Extreme Scattering Events Towards Two Young Pulsars
Abstract
We have measured the scintillation properties of 151 young, energetic pulsars with the Parkes radio telescope and have identified two extreme scattering events (ESEs). Towards PSR J10575226 we discovered a three-year span of strengthened scattering during which the variability in flux density and the scintillation bandwidth decreased markedly. The transverse size of the scattering region is 23 au, and strong flux density enhancement before and after the ESE may arise from refractive focusing. Long observations reveal scintillation arcs characteristic of interference between rays scattered at large angles, and the clearest arcs appear during the ESE. The arcs suggest scattering by a screen 100–200 pc from the earth, perhaps ionized filamentary structure associated with the boundary of the local bubble(s).
Towards PSR J17403015 we observed a “double dip” in the measured flux density similar to ESEs observed towards compact extragalactic radio sources. The observed shape is consistent with that produced by a many-au scale diverging plasma lens with electron density 500 cm-3. The continuing ESE is at least 1500 d long, making it the longest detected event to date.
These detections, with materially different observational signatures, indicate that well-calibrated pulsar monitoring is a keen tool for ESE detection and ISM diagnostics. They illustrate the strong rôle au-scale non-Kolmogorov density fluctuations and the local ISM structure play in such events and are key to understanding both their intrinsic physics and their impact on other phenomena, particularly fast radio bursts.
keywords:
pulsars:general, ISM:structure1 Introduction
The discovery of dramatic variations in the observed flux density of the quasar 0954658 (Fiedler et al., 1987), dubbed an “extreme scattering event”, revealed an unexpected and poorly understood property of the ionized interstellar medium (ISM). If produced by refraction (Romani et al., 1987), the required column density gradients imply densities 1000 cm-3 for symmetric distributions and are consequently overpressured relative to the ambient ISM by three orders of magnitude. Various mechanisms, from local density enhancements (Walker & Wardle, 1998) to highly asymmetric structures like current sheets (Pen & King, 2012) and circumstellar plasma streams (Walker et al., 2017) have been proposed to alleviate this overpressure problem, but the origin of the structure remains unclear.
A primary difficulty in advancing the field is the relative rarity of such events. They are typically discovered in archival data and thus lack the contemporaneous VLBI/multi-frequency observations that help probe the lensing structure. Only recently was an ESE detected and studied in real time via a monitoring campaign of bright extragalactic AGN (Bannister et al., 2016), and the wide frequency coverage and VLBI imaging provided detailed insight into the electron column density profile (Tuntsov et al., 2016).
While dedicated campaigns like those of Bannister et al. (2016) will continue to turn up new ESEs, we point out pulsar monitoring as a complementary approach. Indeed, pulsar point sources are ideal for detecting ESEs since the ESE signature is not convolved with a finite source geometry. Further, examination of differential delays in pulse arrival times admits direct measurement of the electron column density (dispersion measure, DM) towards the source. Coles et al. (2015) identified two ESEs towards millisecond pulsars via their variations in DM and scintillation strength, and there are likely a spectrum of less extreme events in the dataset, making ISM studies a fruitful offshoot of the effort to detect low-frequency gravitational waves by pulsar timing arrays. However, MSPs are much rarer than unrecycled pulsars and so probe few lines of sight. Thus, with an aim towards discovering new ESEs, we searched over 1200 source-years of data taken for the young pulsar timing program on the Parkes telescope (Weltevrede et al., 2010, “P574”).
We discovered two clear ESEs with dramatically different observational signatures. One, towards PSR J17403015, is a smooth modulation of the pulsar light curve reminiscent of the Fiedler et al. event and suggestive of coherent lensing by a plasma structure. The other, towards PSR J10575226, is more like the events reported by Coles et al. (2015), detected through modification of diffractive scintillation properties. Although this latter type, observed exclusively towards pulsars, have not been identified as ESEs in the literature until recently, they too are caused by au-scale inhomogeneities that cross the line of sight and substantially alter/dominate the scattering properties. It is only in the addition of diffractive effects from the pointlike sources that their observational signature differs, and accordingly we classify both episodes as ESEs.
In §2, we discuss the P574 observations and the production of the dynamic spectra on which this analysis is based. We follow in §3 with a discussion of PSR J10575226, its scintillating nature, and the ESE detected towards it. We do the same for PSR J17403015 in §4. In §5, we offer interpretation of the observations.
| Distance (, pc) | 400 |
| Dispersion Measure (DM, pc cm-3) | 30.1 |
| Transverse velocity (km/s) | 80 |
| Fresnel radius (cm) | |
| Decorrelation bandwidth (, MHz) | 50 |
| Decorrelation time-scale (s) | 1000 |
| Diffractive scale (, cm) | |
| Refractive scale (cm) | |
| Diffractive time-scale (s) | |
| Refractive time-scale (hr) |

2 Observations and Data Reduction
We observed PSRs J10575226 and J17403015 as part of a continuing program to time about 150 young (characteristic ages yr), energetic ( erg s-1) pulsars with the Parkes radio telescope to provide rotational ephemerides for -ray analysis with the Fermi Large Area Telescope. The program has been extremely successful both in its original purpose (Abdo et al., 2013, nearly 40 -ray pulsars discovered using Parkes data) and through the study of the wealth of pulse profiles and timing data (e.g. Rookyard et al., 2017; Brook et al., 2016; Antonopoulou et al., 2015; Karastergiou et al., 2011). The data set, now spanning more than eight years, allows detection of phenomena with time-scales of several years, e.g. DM variations (Petroff et al., 2013) and the recently discovered quasi-periodic modulations in the pulse times of arrival of eight members of the sample (Kerr et al., 2016). Many of the pulsars in the sample have large DMs and are (very) strongly scattered by the ISM. As pulsars become more strongly scattered, their diffractive time-scale (the period over which the observed intensity in a narrow band becomes decorrelated) becomes shorter while their refractive time-scale (over which the line-of-sight crosses the scattering disk) becomes longer, due to the increased size of the scattering disk, reaching months to years for typical lines of sight in the Galactic plane. These time-scales can be measured by studying the correlations in pulsar light curves (e.g. Kaspi & Stinebring, 1992), prompting us to produce flux-density calibrated light curves from our timing observations as follows.
The pulsar sample was observed with a roughly monthly cadence with short, two or three-minute snapshot observations using primarily the centre pixel of the 20 cm multi-beam receiver. For about six months in 2007 and in 2016, we used another 20 cm (“H-OH”) receiver. We recorded 256 MHz of bandwidth centred on 1369 MHz using a succession of digital polyphase filterbanks systems (PDFB1-PDFB4) and folded the resulting 1024 spectral channels into pulse profiles with 1024 phase bins. (With the H-OH receiver in 2016, we recorded 2048 channels over 512 MHz of bandwidth at 1465 MHz.) To measure the differential gains between the signal paths of the two voltage probes, once an hour we observe a pulsed noise signal injected into the signal path prior to the first-stage low-noise amplifiers. The noise signal also provides a reference brightness for each observation. To correct for the absolute gain of the system, we make use of observations of the radio galaxy 3C 218 (Hydra A); by using on- and off-source pointings, we can measure the apparent brightness of the noise diode as a function of radio frequency. Finally, to measure the flux density, we cross-correlate the observed profile with a standard template. For the total flux density at each epoch, we have integrated over the observing band and observation duration, while for the dynamic spectra we retain the native resolution of the filterbanks. All data reduction makes use of the psrchive (Hotan et al., 2004) software package.
Dynamic spectra are particularly sensitive to radio-frequency interference (RFI) as both quasi-stationary narrowband and impulsive broadband signals can create spurious enhancements of frequency and time intervals. To mitigate RFI and aliasing, we filter out the edges of the band (5%) and channels exceeding a median-smoothed bandpass, and we identify sub-integrations affected by impulsive RFI by eye and remove them. These missing channels and sub-integrations introduce additional windowing to the secondary spectra discussed below, but the percentage of filtered data is typically small. When constructing secondary spectra, we linearly interpolate over missing data to minimize windowing artifacts. Large features in dynamic spectra such as bright scintles manifest as low-frequency power in secondary spectra and, due to windowing from finite observation length, can leak to higher power. We partially mitigate this in affected observations by first-order differencing (pre-whitening) and subsequent correction of the output spectrum (post-darkening); see Coles et al. (2011) for more details.
3 PSR J10575226
PSR J10575226 (B105552) is a bright pulsar discovered in the seminal, early pulsar search survey of the southern sky by Vaughan & Large (1972). Its high S/N profile has furnished several insights into the pulsar mechanism (Weltevrede et al., 2012) and it is one of the brightest -ray pulsars in the sky. Indeed, the constraints from its radio polarimetry and -ray light curve together provide some of the first evidence for “backwards” -ray beams (Craig, 2015). PSR J10575226 has also been detected at optical and UV wavelengths using the Hubble Space Telescope, allowing sensitive astrometry and refined spectral distance estimates as we review below.
3.1 Distance and Velocity
The interpretation of scintillation measurements depends critically on the distance and velocity of a pulsar, but unfortunately the distance to PSR J10575226 is not well constrained. According to the electron distribution model of Taylor & Cordes (1993), the modest DM (30.1 pc cm-3) places it at a distance of 1.53 kpc, but more modern models place it at 0.72 kpc (NE2001 Cordes & Lazio, 2002) and 94 pc (YMW16 Yao et al., 2017), an order of magnitude discrepancy. Constraints from other observations place the pulsar in the lower half of this range. Mignani et al. (2010), by modelling of the optical, UV, and X-ray spectrum, estimate a distance of 400 pc. The high -ray efficiency, 25.6% at 400 pc (Abdo et al., 2013), also suggests a true distance at the lower end of this range, and we therefore adopt a fiducial distance of 400 pc.
Mignani et al. (2010) measure a proper motion of mas yr-1 by comparing the Hubble position with an archival radio timing position. At our fiducial distance, this leads to a transverse velocity of 80 km s-1, somewhat low but consistent with typical two-dimensional speeds (median 180 km s-1, Hobbs et al., 2005). However, due to timing noise and the relatively short span of data used in producing the archival radio position, we sought to verify the proper motion using a single long span of pulsar timing data.
Archival data from Parkes observations are available with varying cadence from 1992 and include a range of instruments and receivers. The raw data are currently unavailable, so we used a partially-reduced version of the data that were folded at the correct pulsar period and reduced to, typically, 4 or 8 spectral channels. Ultimately, we assembled 2306 pusle times of arrival (TOAs) spanning from July 1992 to January 2016. The noise properties of the TOAs vary strongly over the data span. Radiometer noise generally decreases over time as more sensitive, wider bandwidth systems became available. Early data sometimes suffer pulse profile distortions due to single-bit digitization, and nearly all lack polarization calibration. To account for this noise, we flagged each unique combination of receiver and backend system and modified the TOA errors with an overall scale and an additional error added in quadrature (“EFAC” and “EQUAD”). We also allow each system to have a free phase adjustment (“JUMP”) relative to the fiducial system (PDFB4). Finally, we fit the timing model and these white noise parameters, together with a power law representation of red timing noise, using TempoNest (Lentati et al., 2014). At an epoch of MJD 54531, we find a position
and a proper motion
with a total proper motion of mas yr-1, verifying the result of Mignani et al. (2010). Unfortunately, the precision of the parallax measurement is only 60 mas, so we can only place a lower limit on the distance of about 10 pc.
3.2 Scintillation Properties
Refraction contributes most strongly at the transition from weak to strong scattering (e.g. Coles et al., 1987), which occurs when the transverse coherence scale in the scattering medium becomes smaller than the Fresnel radius, or equivalently when the decorrelation bandwidth becomes smaller than the observing frequency . Though depending on frequency and the wavenumber spectrum, refraction contributes of order 0.1 (Rickett, 1990) to the modulation index (, with the observed flux density) while diffractive scintillation has . As we show below, we observed for J10575226 outside of the ESE, indicating a strong for the refractive component. Thus, even though the observed decorrelation bandwidth for our 20 cm observations is , formally placing it well into strong scattering, refraction plays an outsize rôle, perhaps indicating the presence of an inner scale in the turbulence spectrum (Coles et al., 1987). Such strong variations may also reflect the presence of discrete refracting structures. The observational consequence of this large variance is that we occasionally see flux densities almost 20 times greater (or lower) than the mean even though our bandwidth encompasses multiple diffractive scintles.
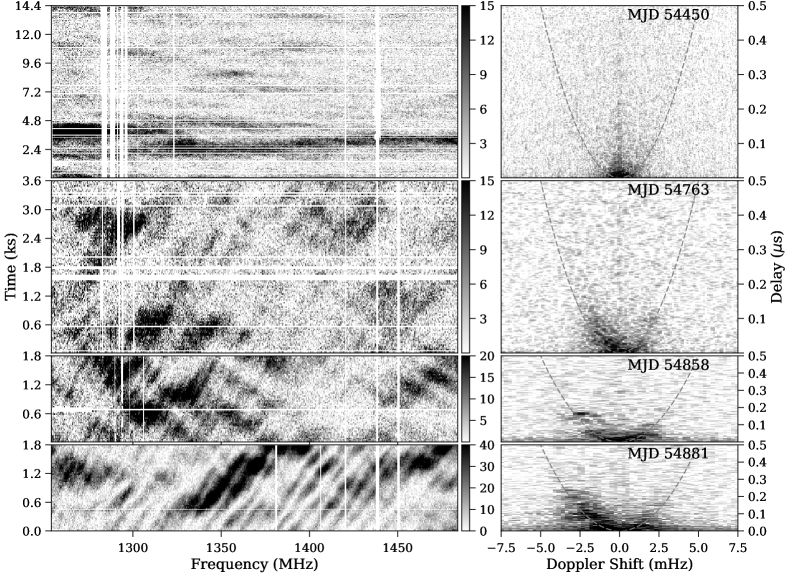
Identifying the “baseline” diffractive properties of PSR J10575226 is challenging. Johnston et al. (1998) report values of 36.7 MHz (correlation half-width at half-maximum) and 308 s (correlation half-width at 1/) at 1388 MHz. However, long observations almost always reveal fringing in the dynamic spectra characteristic of interference between rays scattered from large angles (see below), and these fringes obscure the underlying large-scale scintles from the scattering core. We have identified a few long observations that appear relatively free from such interference (e.g. the top panel of Figure 1) and estimate a slightly larger decorrelation bandwidth of 50 MHz and decorrelation time-scale of 1000 s, which we adopt for a fiducial model.
We can check the consistency of this model by noting that, if the pulsar velocity is dominant, the decorrelation time-scale is simply the time it takes a coherent patch on the scattering screen to translate past the line-of-sight. If the phase variations are due to a Kolmogorov spectrum of fluctuations, then the coherence length , with the normalized distance from the pulsar to the screen, the Fresnel distance, and the diffractive bandwidth. We report these parameters in Table 1 and, if we place the screen halfway to the pulsar, we find the coherence length to be cm. If the effective velocity along the screen is dominated by the pulsar velocity, i.e. is 40 km s-1, then the predicted decorrelation time is 1100 s, in good agreement with our model. The corresponding refraction timescale is 66 hours, somewhat longer but in qualitative agreement with the day-to-day variations we observe (e.g. Figure 2).
3.3 Extreme Scattering Event
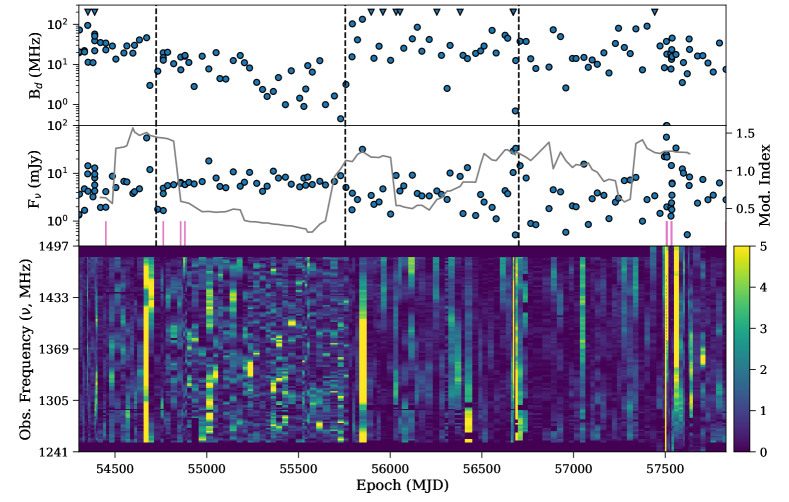
We have examined the flux density and diffractive properties of J10575226 over our data set and show our results in Figure 3. To measure the decorrelation bandwidth (), we computed the secondary spectrum for each observation (the Fourier transform of the dynamic spectrum) and then fitted the models used by Coles et al. (2015). We have also measured the flux density for each observation. The typical observation length (120 to 180 s) is much shorter than the decorrelation time-scale (1000 s), so they give snapshots whose variance is dominated by the diffractive scintillation structure. This is borne out by the running modulation index, shown in the middle panel of the figure, which reaches values up to 1.2. In order to put the longer observations on the same footing, we simply truncate those observations to 180 s when measuring the flux density.
There is a substantial drop in both the decorrelation bandwidth and the variance in the snapshot flux density beginning around MJD 54725 and concluding around MJD 55755, shown as the first two vertical dashed lines in Figure 3. Both are hallmarks of an increase in the scattering strength, and thus the ESE is due to additional turbulent plasma entering the line-of-sight. (The flux variance decreases as there are more scintles in the band for stronger scattering, so the snapshot observations approach the mean flux.) There are strong, wideband flux density enhancements preceding and following the ESE. These may be coincidental, or they may be refractive enhancements (lensed emission) associated with the boundary of the scattering structure. The scattering structure itself cannot lens strongly, as there is no measurable decrease in the mean observed flux.
There is a clear gradient in the diffractive bandwidth over the duration of the ESE, with the scattering strongest in the trailing edge. The sharp delineation in diffractive bandwidth makes the event duration a relatively precise 100050 d. However, its linear size depends on where it lies along the line of sight. If we take it as halfway to pulsar (), and again assign the dominant motion to the pulsar velocity ( km s-1), the transverse size is 23 ( km s-1) au. This is substantially larger than structures reported for other ESEs, even if it is much closer with a typical local relative velocity of 10 km s-1.
We have marked an additional event at MJD 56700, a series of very bright observations bookending a near non-detection. These may also represent a small plasma lens crossing the line of sight, with characteristic caustic enhancements preceding and following a defocused region (e.g. Clegg et al., 1998). The decorrelation bandwidth appears to decrease slightly following this event.
There are additional less “extreme” but similar events. Around MJD 56300 the drop in modulation index is accompanied by a single observation with a markedly decreased scintillation bandwidth, reminiscent of (but in the opposite sense to) the “pinhole” in DM reported by Coles et al. (2015) for PSR J17130747.
3.4 Large-angle Scattering
Although fringing in pulsar dynamic spectra had been appreciated for some time as a realization of multiple imaging (Rickett, 1990), it was the discovery of dramatic parabolic arcs in secondary spectra (Stinebring et al., 2001) that crystallized the understanding that these features are the natural hallmarks of a medium capable of supporting wide-angle scattering (Walker et al., 2004; Cordes et al., 2006) and that they are a sensitive probe of the angular scattering spectrum. Briefly, in the case of interference between a dominant small-angle scattering core and a halo of light scattered at larger angles, the scattered waves will be Doppler shifted () by the screen velocity an amount proportional to the scattering angle and will suffer a delay () proportional to its square. The scattering halo sites then map onto a parabola
| (1) |
(see equation 11 of Cordes et al. (2006), NB in the second equality the signs of the exponents of the velocity and units are inverted), with
| (2) |
with the pulsar distance in kpc, the observing frequency in GHz, and the projected screen velocity scaled by 100 km s-1. Therefore, in addition to the snapshot spectra discussed above, we have analyzed long archival observations, taken primarily in 2007 and 2008, as well as recent data obtained after the discovery of the ESE. These long observations provide the necessary resolution to identify scattering features in secondary spectra.
A very long observation in 2007 (Figure 1, top panel) gives a reasonable representation of the “baseline” scattering state of PSR J10575226. Large structures in frequency and time, with a strong refractive enhancement in the first part of the observation, yield a dense knot of scattering near the origin in the secondary spectrum; the dimensions of this knot yield the canonical diffractive scintillation bandwidth and time-scale. The next long archival observations occur in 2008, after the onset of the ESE. The first such observation, the second from the top, shows obvious fringing, and the secondary spectrum reveals these fringes as power well removed from the origin, with negative Doppler shifts of a few mHz and delays of up 0.1 s, while the subsequent two observations show features with delays up to 0.25 s. For our fiducial model with , , and km s-1, s3, shown as dashed arc drawn in Figure 1 and in good agreement with the observed curvature. This agreement reinforces our fiducial distance and velocity model and again suggests the ESE is 20 au. in transverse dimension.
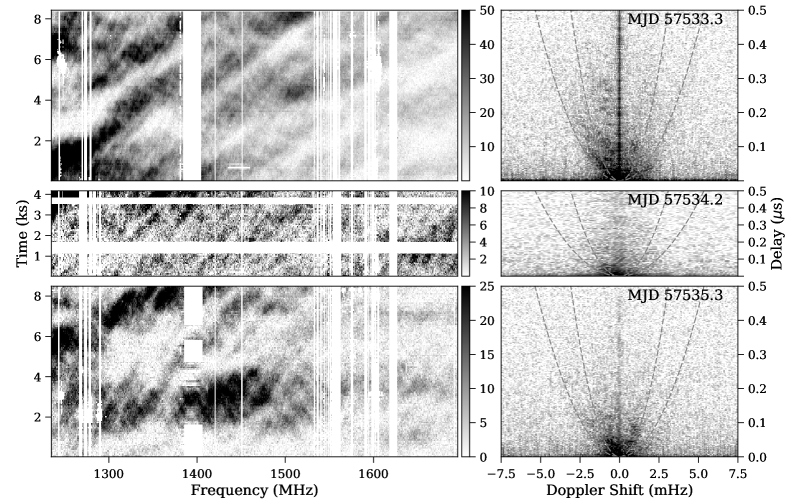
We have observed similar, if less pronounced, fringing in recent observations taken as a dedicated followup to the discovery of the ESE. In a series of observations made on subsequent days in late April/early May 2016 (Figure 2), there is evidence both of strong refractive enhancement and of scattering structure apparently associated with an even greater value of s3. The scintillation arc evolves rapidly on a 1-day time-scale, with the power along the arc at positive Doppler shift on the first day fading over the two subsequent days. The time required for this material to translate far enough to escape the scattering region is about 50 d, so this variability must reflect the scattering process itself. Indeed, Coles et al. (2010) found such variation in arc asymmetry on refractive time-scales in simulations of Kolmogorov turbulence.
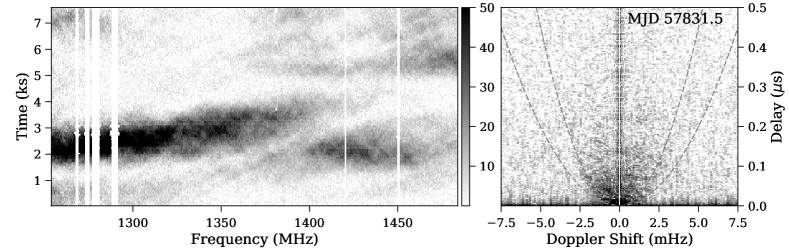
Another series of consecutive long observations at the end of May 2016 shows a similar evolution (Figure 4) . The first observation reveals scattering at large delay (0.3 s) and small negative Doppler shift (-1 mHz), and there is extremely strong low-frequency fringing. Two days later, that structure has largely vanished, while substantial power at small scattering angles, along the inner parabola, has appeared. A final long observation made in March of 2017 (Figure 5) reveals a symmetric distribution concentrated at the origin, suggesting absence of large-angle interference.
If the larger value of is a distinct feature, and if the effective velocity remains dominated by the pulsar velocity, then the screen distances are related by . If during the ESE is correct, then . That is, the “baseline” screen is located 1/4 of the way from the earth to the pulsar, and halfway between the ESE screen and the earth. Since there is also still power filling the area between the two parabolae (particularly during the strong fringing on MJD 57533), this suggests scattering occurs over an extended region from 100–200 pc.
Finally, under the assumption that the scattering is dominated by bright core/large angle interference, the secondary spectrum can be directly mapped to a brightness distribution. For our fiducial model, a parabola following s3 yields an approximately circular brightness distribution, while smaller (larger) values are elongated along the (perpendicular to the) effective velocity vector. Thus, the brightness distribution is circular during the ESE (save for the bright large angle knot) but somewhat elongated perpendicular to the velocity in subsequent epochs. In fact, change of image shape may also be sufficient to explain the different apparent values of , as asymmetry in the image strongly affects the position of scattered power relative to the predicted parabola (e.g. Cordes et al., 2006).
| Distance (, kpc) | 2.0 |
| Dispersion Measure (DM, pc cm-3) | 152 |
| Transverse velocity (km s-1) | 150 |
| Fresnel radius (cm) | |
| Decorrelation bandwidth (, MHz) | 1 |
| Decorrelation time-scale (s) | – |
| Diffractive scale ( cm) | |
| Refractive scale (cm) | |
| Diffractive time-scale (s) | 190 |
| Refractive time-scale (d) | 24 |
4 PSR J17403015
PSR J17403015 (B173730), discovered by Clifton & Lyne (1986) at a DM of 152 pc cm-3, is a radio-bright but otherwise unremarkable pulsar, save for its relatively frequent glitches (Clifton & Lyne, 1986). Its precise distance remains unknown. Johnston et al. (2001) were able to detect Hi absorption at 15 km s-1, but the 3 kpc arm is seen only in emission, leading those authors to conclude only that the pulsar is nearer than kpc. Verbiest et al. (2012) more recently invoked Malmquist bias to suggest that the distance is only 0.4 kpc. Both the NE2001 and the YMW16 DM/distance models predict intermediate distances of 2.7 and 2.9 kpc, respectively. Due to the lack of any obvious strongly-ionized regions along the line-of-sight and the small decorrelation bandwidth (see below), we favour these intermediate distances and adopt a fiducial pulsar distance of 2.0 kpc, marginally consistent with the large uncertainties of Verbiest et al. (2012). Unfortunately, there are no constraints on the pulsar proper motion, and we adopt a typical speed of 150 km s-1.
We note that PSR J17403015 lies at an ecliptic latitude of 6.9°, and consequently in December passes very close to the sun, with some observations having a solar angle . Such observations (about ten in our set) suffer a degraded system temperature and additional bandpass ripple from standing waves between the telescope focus and antenna surface. However, we find no evidence that the post-calibration spectra are out of trend and we do not exclude these data.
4.1 Scintillation Properties
Measurements of the correlation bandwidth, as well as inspection of Figure 6, indicate the scintillation bandwidth is 1 MHz, making the measurement via correlation of channels of marginal reliability. We also evaluated the scintillation bandwidth by measuring excess variance in the dynamic spectra. In brief, the total variance within a sub-integration should be equal to the radiometer contribution plus a , with the number of scintles within the band. Because intrinsic variation in pulse amplitude and shape (“jitter”) is typically correlated over bandwidths much larger than the observing bandwidth (Shannon et al., 2014), its noise contribution is negligible. The typical excess variance, corresponding to a value of in a 256 MHz band, confirms a 1 MHz bandwidth. The baseline model values with our fiducial distance and velocity are given in Table 2.
After removing the low-frequency trend from the measured flux densities (middle panel of Figure 6), the band-integrated modulation index is about 0.07. The expected variance from DISS is 5–10%, indicating residual contributions from refraction at a 24-day time-scale are minimal. However, there is clearly variation on longer time-scales. Due to the low ecliptic latitude, the orbital motion of the earth may be substantial relative to the scattering medium, leading to an annual signal. However, when we computed a power spectrum of the long-term light curve (by interpolating and pre-whitening/post-darkening to correct for spectral leakage) we found no clear quasi-periodic signal.
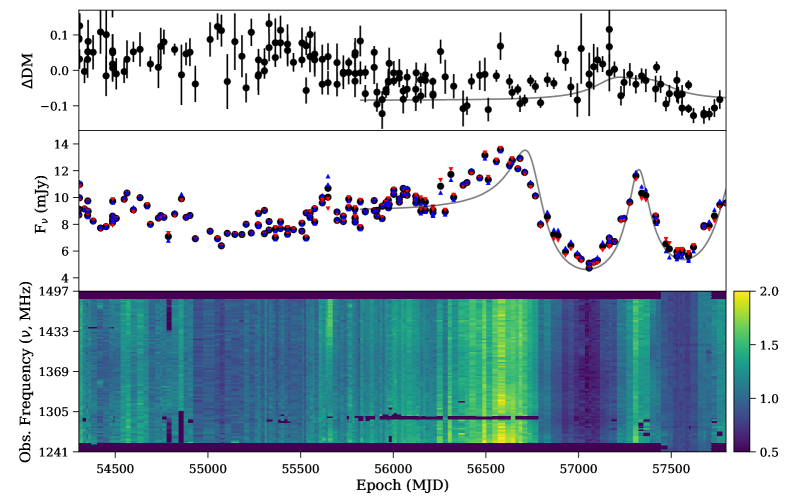
4.2 Extreme Scattering Event
Above the level of refractive variation, there is a clear increase in received flux density beginning at MJD 56250, though the leading edge may extend earlier in time. Relative to a baseline flux density of 8 mJy, the ESE peaks around 13 mJy (163%), followed by a dip to 5 mJy (61%). A second more moderate (11.5 mJy) peak and trough (5.8 mJy) follow. In a typical diverging lens geometry, at least one more peak is expected. During the ESE, there appears to be a low-frequency ripple in the intensity across the observing band (bottom panel), with greater intensity towards the edges and a clear dip in in the band center; this variation is most clearly visible near the first intensity peak at MJD 56600. We have also plotted the flux density for the top and bottom halves of the observing band, scaled to the mean spectral index, as triangles in the middle panel. These light curves show that the ESE is frequency-independent over our observing band.
This is the longest ESE observed to date. Maitia et al. (2003) report a three-year ESE towards the millisecond pulsar J16431224, but this is likely a special case of a persistent annual modulation related to the earth’s orbital motion (Keith et al., 2013). The duration of this ESE is already at least 1550 d, and if the expected second peak is similar in shape to the first, the total length will be around 2000 d.
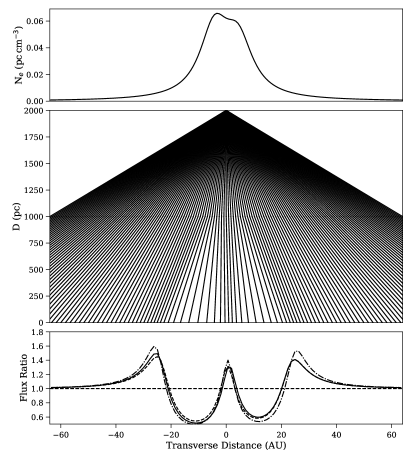
Following Clegg et al. (1998), we have modelled the flux density modulation as a diverging plasma lens crossing the line-of-sight. The two dips require two modes in the distribution, and we compute the received flux density using simple ray tracing, taking into account the finite source distance. The resulting model, at our fiducial screen distance of 1000 pc, appears in Figure 7. In this model, the two Lorentzian components with HWHM have separation 0.68 and the trailing component column density Ne amplitude is 80% of the first. We note that Gaussian components provide a poorer fit as modulation between the peaks is too deep. With the effective screen velocity of 75 km s-1, the predicted transverse size of 80 au is in good qualitative agreement with the data. The finite distance of the source means the inferred lens size is smaller than one in the plane wave approximation.
This model is not unique. Even setting aside more complicated (e.g. 2-d) lens shapes, there is degeneracy between the lens distance, electron column density (Ne), and size (Clegg et al., 1998), and here a two-parameter family of lenses provides a good description of the data. The assumed transverse velocity fixes the lens size at a given distance to be au (Dl/1 kpc)(/75 km s-1), and the peak/trough amplitude then requires the normalization column density to follow pc cm-3(D/1 kpc)(/75 km s-1)2. Here, represents the normalization of the transverse screen velocity, scaled in such a way that the observed ESE length is correct at the other model values. This scaling has two important consequences.
First, we obtain equally good results over a broad range of lens distances. However, small lens distances can be ruled out because the image scale becomes too small to account for the long ESE with reasonable relative velocities. More distant lenses require greater electron column depths, and for lenses further than about 1 kpc the required column would exceed our observational constraints on DM variation. In the top panel of Figure 6, we show the DM as computed by fitting with Tempo2 a dispersion model to 8 TOAs extracted across the observing band along with the DM column for our fiducial model.
The second consequence is that the electron density is quite robustly determined for a lens at any valid distance. For our model, the FWHM of the density profile is about . If we take this as characteristic of the longitudinal dimension, the peak electron density depends only on the velocity scale. This electron density is somewhat lower than the values estimated for shorter ESEs, in keeping with the larger inferred size.
Finally, we note that the 1-d plasma lens model predicts chromaticity as the refraction angle . We show the difference in flux densities for the two halves of our observing band as the non-solid lines in Figure 7. Although the predicted differences are relatively modest over our bandwidth, they are detectable, suggesting a more complicated lens is necessary to fully account for the data.
5 Discussion
Romani et al. (1987) proposed two mechanisms to explain the observations of Fiedler et al. (1987): sheets of ionized gas in old supernova remnants whose pressures could confine sheets with cm-3, sufficient to provide the observed enhancement if their aspect ratios are 100; and very high pressure ( cm-3) magnetically-confined plasma spun off by stars. Both ideas have re-appeared recently in more generalized form. The likely ubiquity of current sheets in the ISM (Braithwaite, 2015) has been invoked both to explain ESEs (Pen & King, 2012) and more generally pulsar scintillation (Pen & Levin, 2014). The newly-discovered strong correlation between the velocity of some intra-day variables (IDVs) and hot stars likewise lends support for a stellar origin of scattering structure (Walker et al., 2017). A unifying feature of all of these origins is substantial elongation either along or perpendicular to the line of sight, and the ESEs reported here provide further evidence for such asymmetry.
As we have described above, the ESEs towards PSR J10575226 and J17403015 have long durations and transverse sizes of 23 ( km s-1) au and 80 ( km s-1) au, respectively. For PSR J10575226, the good agreement between our fiducial model and the curvature of the secondary spectrum parabola suggests the transverse size truly is at least 20 au. For J17403015, our fiducial model is consistent with a simple plasma lens model, indicating a size 20 au, but a wider range of values is equally good. Nonetheless, it is probably larger than 5 au, as a closer (smaller) lens would likely show pronounced annual effects from the earth’s orbit. These large sizes—and the lack of shorter/smaller ESEs in our sample—suggest the ESEs are indeed the result of inhomogeneities rather than properties of a self-similar turbulent medium.
These large transverse sizes have interesting implications for the models above. If the scatterer is sheet-like, then only inclinations close to edge-on provide the strong gradients needed to provide the refraction in PSR J17403015 and the sharp edges for PSR J10575226. Such alignment occurs by chance of order 1% of the time, consistent with the detection rates reported here (2 events/7 ESE-years per 150 pulsars/1200 source-years) and those of Fiedler et al. (1994)). Further fine tuning such that the elongation is along the effective velocity yields detection rates lower than observed, suggesting that the scattering structures are roughly symmetric in the plane of the sky and overall geometry is an elongated cylinder. If the scatterer is a corrugated plasma sheet, then the corrugations are much larger than the sheet width.
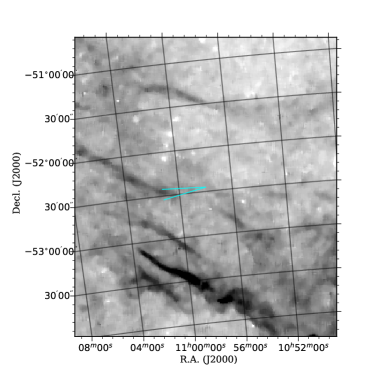
There are several candidates for such extended structures along the line of sight to PSR J10575226. It is near the boundary of the classical Loop 1 bubble, and more convincingly along the intersection of two shells proposed by Wolleben (2007) to explain the north pulsar spur, with distances comparable to our estimate for the screen. We also note that Yao et al. (2017) place the Loop 1 shell at 195 pc, precisely at our fiducial screen distance. Inspection of an H image (Figure 8) reveals filamentary structure on large scales, lending credence to the idea that the region may harbor such post-shock electron density enhancement as those proposed by Romani (1988) and Clegg et al. (1988). On the other hand, we note that the ESE cannot be associated with an underdensity (e.g. Pen & King, 2012) since the scintillation strength increases.
Intriguingly, several type A Hipparcos stars (Perryman et al., 1997) lie both in the foreground of our 400 pc distance and within 1 pc of the sight line. HIP53771 (px=16.4(4) mas, 1/px=60 pc, =0.7 pc, A3III/IV, with the distance from the sight line) is the strongest candidate for providing a scattering radial plasma structure (Walker et al., 2017). Two other A stars, HIP53395 (px=8.5(3) mas, 1/px=120 pc, =0.9 pc, A9V) and HIP53836 (px=7.3(4), 1/px=140 pc, =1.2 pc, A0V) are also candidates. In all cases, the surrounding ionized volumes are substantially smaller than their Hill spheres, so it is unclear if they are close enough. Future precise astrometry from GAIA, as well as a monitoring campaign to search for annual signatures in diffraction properties, can further test the hot star hypothesis.
Unfortunately, due to the larger and more uncertain distance to PSR J17403015, less can be said about specific scatterers. There are not many hot stars near earth and near the sight line, with only two Hipparcos candidates. HIP86744 (px=8.1(3) max, 1/px=120 pc, =1.3 pc, A2V) and HD316162 (px=0.8(3), 1/px=1200 pc, 2.8 pc, A0) could plausibly provide structure along the sight line. A third Hipparcos source, HIP 86512 (A0 RR Lyr variable), has a revised GAIA distance of 1 kpc (Gaia Collaboration et al., 2016) which places it too far from the sight line. Generally, we look forward to discovering more candidates with further GAIA data releases.
Although these ESEs clearly illuminate some properties of the ISM, much more could be learned, and potentially some models discarded, with additional observational data. In particular, both candidates would benefit from wideband monitoring. E.g., the ultra-wideband receiver currently being commissioned at Parkes (0.7–4.0 GHz) would expand the band to half the current observing frequency and thus will substantially increase the number of scintles observable in an observation of PSR J10575226. This may better characterize the refractive properties of future ESEs as well as yield better constraints on the parabolic arcs in the secondary spectrum. Conversely, the decorrelation bandwidth for PSR J17403015 will be resolvable above 3 GHz with even modest channelization, allowing for searches of annual modulation in diffraction which might allow association with a nearby star. In both cases, modelling the frequency evolution of the diffractive properties will allow better understanding of the turbulence spectrum dominating the scattering.
Likewise, a VLBI parallalax would greatly expand our understanding of these sources. Knowing the pulsar distance and proper motion would break the degeneracy in the lens model for J17403015, allowing determination of the screen location. Determing the distance of J10575226 would determine whether local bubble boundaries are the most likely scatterers and would give a direct measurement of the screen velocity from the parabolic arcs. Since both pulsars are bright, the measurement is possible with existing observatories.
Finally, we close with a note about the dramatic flux variations observed towards PSR J10575226 in its “quiescent” state, outside of the ESE. We have observed flux densities in excess (deficit) of the mean by factors of 20. Although the pulsar is not far off the Galactic plane (6.7°), the scattering is likely dominated by local material and thus many extragalactic sight lines could experience such “super” refractive scintillation if the sources are sufficiently compact. Monitoring campaigns of nearby pulsars over a range of frequencies and many refractive time-scales will reveal just how often such modulation can happen. Such substantial magnifications may play a rôle in the detectability of fast radio bursts (Macquart & Johnston, 2015) and better determine the relation between FRBs and the local ISM, if indeed any exists (Fiedler et al., 1994).
Acknowledgements
We thank Phil Edwards for his deft telescope scheduling. The Parkes radio telescope is part of the Australia Telescope, which is funded by the Commonwealth Government for operation as a National Facility managed by CSIRO. This research has made use of NASA’s Astrophysics Data System, for which we are grateful. Work at NRL is supported by NASA.
References
- Abdo et al. (2013) Abdo A. A., et al., 2013, \hrefhttp://dx.doi.org/10.1088/0067-0049/208/2/17 ApJS, 208, 17
- Antonopoulou et al. (2015) Antonopoulou D., Weltevrede P., Espinoza C. M., Watts A. L., Johnston S., Shannon R. M., Kerr M., 2015, \hrefhttp://dx.doi.org/10.1093/mnras/stu2710 MNRAS, 447, 3924
- Bannister et al. (2016) Bannister K. W., Stevens J., Tuntsov A. V., Walker M. A., Johnston S., Reynolds C., Bignall H., 2016, \hrefhttp://dx.doi.org/10.1126/science.aac7673 Science, 351, 354
- Braithwaite (2015) Braithwaite J., 2015, \hrefhttp://dx.doi.org/10.1093/mnras/stv890 MNRAS, 450, 3201
- Brook et al. (2016) Brook P. R., Karastergiou A., Johnston S., Kerr M., Shannon R. M., Roberts S. J., 2016, \hrefhttp://dx.doi.org/10.1093/mnras/stv2715 MNRAS, 456, 1374
- Clegg et al. (1988) Clegg A. W., Chernoff D. F., Cordes J. M., 1988, in Cordes J. M., Rickett B. J., Backer D. C., eds, American Institute of Physics Conference Series Vol. 174, Radio Wave Scattering in the Interstellar Medium. pp 174–178, \hrefhttp://dx.doi.org/10.1063/1.37587 doi:10.1063/1.37587
- Clegg et al. (1998) Clegg A. W., Fey A. L., Lazio T. J. W., 1998, \hrefhttp://dx.doi.org/10.1086/305344 ApJ, 496, 253
- Clifton & Lyne (1986) Clifton T. R., Lyne A. G., 1986, \hrefhttp://dx.doi.org/10.1038/320043a0 Nature, 320, 43
- Coles et al. (1987) Coles W. A., Rickett B. J., Codona J. L., Frehlich R. G., 1987, \hrefhttp://dx.doi.org/10.1086/165168 ApJ, 315, 666
- Coles et al. (2010) Coles W. A., Rickett B. J., Gao J. J., Hobbs G., Verbiest J. P. W., 2010, \hrefhttp://dx.doi.org/10.1088/0004-637X/717/2/1206 ApJ, 717, 1206
- Coles et al. (2011) Coles W., Hobbs G., Champion D. J., Manchester R. N., Verbiest J. P. W., 2011, \hrefhttp://dx.doi.org/10.1111/j.1365-2966.2011.19505.x MNRAS, 418, 561
- Coles et al. (2015) Coles W. A., et al., 2015, \hrefhttp://dx.doi.org/10.1088/0004-637X/808/2/113 ApJ, 808, 113
- Cordes & Lazio (2002) Cordes J. M., Lazio T. J. W., 2002, ArXiv Astrophysics e-prints
- Cordes et al. (2006) Cordes J. M., Rickett B. J., Stinebring D. R., Coles W. A., 2006, \hrefhttp://dx.doi.org/10.1086/498332 ApJ, 637, 346
- Craig (2015) Craig H. A., 2015, \hrefhttp://dx.doi.org/10.1088/0004-637X/801/1/24 ApJ, 801, 24
- Fiedler et al. (1987) Fiedler R. L., Dennison B., Johnston K. J., Hewish A., 1987, \hrefhttp://dx.doi.org/10.1038/326675a0 Nature, 326, 675
- Fiedler et al. (1994) Fiedler R., Dennison B., Johnston K. J., Waltman E. B., Simon R. S., 1994, \hrefhttp://dx.doi.org/10.1086/174432 ApJ, 430, 581
- Gaia Collaboration et al. (2016) Gaia Collaboration et al., 2016, \hrefhttp://dx.doi.org/10.1051/0004-6361/201629272 A&A, 595, A1
- Gaustad et al. (2001) Gaustad J. E., McCullough P. R., Rosing W., Van Buren D., 2001, \hrefhttp://dx.doi.org/10.1086/323969 PASP, 113, 1326
- Hobbs et al. (2005) Hobbs G., Lorimer D. R., Lyne A. G., Kramer M., 2005, \hrefhttp://dx.doi.org/10.1111/j.1365-2966.2005.09087.x MNRAS, 360, 974
- Hotan et al. (2004) Hotan A. W., van Straten W., Manchester R. N., 2004, \hrefhttp://dx.doi.org/10.1071/AS04022 Publ. Astron. Soc. Australia, 21, 302
- Johnston et al. (1998) Johnston S., Nicastro L., Koribalski B., 1998, \hrefhttp://dx.doi.org/10.1046/j.1365-8711.1998.01461.x MNRAS, 297, 108
- Johnston et al. (2001) Johnston S., Koribalski B., Weisberg J. M., Wilson W., 2001, \hrefhttp://dx.doi.org/10.1046/j.1365-8711.2001.04152.x MNRAS, 322, 715
- Karastergiou et al. (2011) Karastergiou A., Roberts S. J., Johnston S., Lee H., Weltevrede P., Kramer M., 2011, \hrefhttp://dx.doi.org/10.1111/j.1365-2966.2011.18697.x MNRAS, 415, 251
- Kaspi & Stinebring (1992) Kaspi V. M., Stinebring D. R., 1992, \hrefhttp://dx.doi.org/10.1086/171454 ApJ, 392, 530
- Keith et al. (2013) Keith M. J., et al., 2013, \hrefhttp://dx.doi.org/10.1093/mnras/sts486 MNRAS, 429, 2161
- Kerr et al. (2016) Kerr M., Hobbs G., Johnston S., Shannon R. M., 2016, \hrefhttp://dx.doi.org/10.1093/mnras/stv2457 MNRAS, 455, 1845
- Lentati et al. (2014) Lentati L., Alexander P., Hobson M. P., Feroz F., van Haasteren R., Lee K. J., Shannon R. M., 2014, \hrefhttp://dx.doi.org/10.1093/mnras/stt2122 MNRAS, 437, 3004
- Macquart & Johnston (2015) Macquart J.-P., Johnston S., 2015, \hrefhttp://dx.doi.org/10.1093/mnras/stv1184 MNRAS, \hrefhttp://adsabs.harvard.edu/abs/2015MNRAS.451.3278M 451, 3278
- Maitia et al. (2003) Maitia V., Lestrade J.-F., Cognard I., 2003, \hrefhttp://dx.doi.org/10.1086/344816 ApJ, 582, 972
- Mignani et al. (2010) Mignani R. P., Pavlov G. G., Kargaltsev O., 2010, \hrefhttp://dx.doi.org/10.1088/0004-637X/720/2/1635 ApJ, 720, 1635
- Pen & King (2012) Pen U.-L., King L., 2012, \hrefhttp://dx.doi.org/10.1111/j.1745-3933.2012.01223.x MNRAS, 421, L132
- Pen & Levin (2014) Pen U.-L., Levin Y., 2014, \hrefhttp://dx.doi.org/10.1093/mnras/stu1020 MNRAS, 442, 3338
- Perryman et al. (1997) Perryman M. A. C., et al., 1997, A&A, 323, L49
- Petroff et al. (2013) Petroff E., Keith M. J., Johnston S., van Straten W., Shannon R. M., 2013, \hrefhttp://dx.doi.org/10.1093/mnras/stt1401 MNRAS, \hrefhttp://adsabs.harvard.edu/abs/2013MNRAS.435.1610P 435, 1610
- Rickett (1990) Rickett B. J., 1990, \hrefhttp://dx.doi.org/10.1146/annurev.aa.28.090190.003021 ARA&A, 28, 561
- Romani (1988) Romani R. W., 1988, in Cordes J. M., Rickett B. J., Backer D. C., eds, American Institute of Physics Conference Series Vol. 174, Radio Wave Scattering in the Interstellar Medium. pp 156–162, \hrefhttp://dx.doi.org/10.1063/1.37611 doi:10.1063/1.37611
- Romani et al. (1987) Romani R. W., Blandford R. D., Cordes J. M., 1987, \hrefhttp://dx.doi.org/10.1038/328324a0 Nature, 328, 324
- Rookyard et al. (2017) Rookyard S. C., Weltevrede P., Johnston S., Kerr M., 2017, \hrefhttp://dx.doi.org/10.1093/mnras/stw2430 MNRAS, 464, 2018
- Shannon et al. (2014) Shannon R. M., et al., 2014, \hrefhttp://dx.doi.org/10.1093/mnras/stu1213 MNRAS, 443, 1463
- Stinebring et al. (2001) Stinebring D. R., McLaughlin M. A., Cordes J. M., Becker K. M., Goodman J. E. E., Kramer M. A., Sheckard J. L., Smith C. T., 2001, \hrefhttp://dx.doi.org/10.1086/319133 ApJ, 549, L97
- Taylor & Cordes (1993) Taylor J. H., Cordes J. M., 1993, \hrefhttp://dx.doi.org/10.1086/172870 ApJ, 411, 674
- Tuntsov et al. (2016) Tuntsov A. V., Walker M. A., Koopmans L. V. E., Bannister K. W., Stevens J., Johnston S., Reynolds C., Bignall H. E., 2016, \hrefhttp://dx.doi.org/10.3847/0004-637X/817/2/176 ApJ, 817, 176
- Vaughan & Large (1972) Vaughan A. E., Large M. I., 1972, \hrefhttp://dx.doi.org/10.1093/mnras/156.1.27P MNRAS, 156, 27P
- Verbiest et al. (2012) Verbiest J. P. W., Weisberg J. M., Chael A. A., Lee K. J., Lorimer D. R., 2012, \hrefhttp://dx.doi.org/10.1088/0004-637X/755/1/39 ApJ, 755, 39
- Walker & Wardle (1998) Walker M., Wardle M., 1998, \hrefhttp://dx.doi.org/10.1086/311332 ApJ, 498, L125
- Walker et al. (2004) Walker M. A., Melrose D. B., Stinebring D. R., Zhang C. M., 2004, \hrefhttp://dx.doi.org/10.1111/j.1365-2966.2004.08159.x MNRAS, 354, 43
- Walker et al. (2017) Walker M. A., Tuntsov A. V., Bignall H., Reynolds C., Bannister K. W., Johnston S., Stevens J., Ravi V., 2017, \hrefhttp://dx.doi.org/10.3847/1538-4357/aa705c ApJ, 843, 15
- Weltevrede et al. (2010) Weltevrede P., et al., 2010, \hrefhttp://dx.doi.org/10.1071/AS09054 Publ. Astron. Soc. Australia, 27, 64
- Weltevrede et al. (2012) Weltevrede P., Wright G., Johnston S., 2012, \hrefhttp://dx.doi.org/10.1111/j.1365-2966.2012.21207.x MNRAS, 424, 843
- Wolleben (2007) Wolleben M., 2007, \hrefhttp://dx.doi.org/10.1086/518711 ApJ, 664, 349
- Yao et al. (2017) Yao J. M., Manchester R. N., Wang N., 2017, \hrefhttp://dx.doi.org/10.3847/1538-4357/835/1/29 ApJ, 835, 29