Dynamic Regulation of T cell Activation by Coupled Feedforward Loops
Abstract
The adaptive immune system responds to foreign invaders by activating T cells. However, this response is perilous if T cells are activated by the wrong signal or if they remain activated unduly long after the threat has been eliminated. It is therefore important that T cells get activated only by the right kind of signals and for the right duration. The dominant theory in immunology over recent decades has been that a T cell must receive at least two signals before it can become activated. It is, however, unclear whether and how this two-signal requirement ensures that T cell activation is provoked only by the right signals and that the response is just long enough. Here, we propose that the two signal requirement induces a novel coherent feedforward motif whose properties align with those preferred for an ideal immune response. Further consideration of the interaction between helper and regulatory T cells induces a composite feedforward-feedback motif, analysis of which generates a condition for a healthy concentration of activated T helper cells.
1 Introduction
The immune system serves to defend the body against attacks by both foreign and internal threats. At the heart of an adaptive immune response lies the activation of T cells, the main orchestrators of the immune response. If not well regulated, this process can have perilous consequences. Both a prolonged response and a response to a wrong target can lead to destruction of body tissue and have been linked to pregnancy complications, stroke, heart attacks, and blood clots [1]. In addition, they can lead to wastage of resources such as energy used in the production of cytokines [2, 3]. What then determines whether a particular T cell is activated by the right signal, and that the activation doesn’t last too long?
T cell activation is triggered by the binding of a T cell receptor (TCR) to its cognate antigen. However, in the absence of costimulation, TCR mediated recognition has been reported to cause a state of nonresponsiveness called anergy [4]. The two-signal theory posits that T cell activation requires at least two signals: one signal in the form of antigen recognition by the TCR and the other in form of a secondary stimulus. This requirement was first proposed as a mechanism for distinguishing the self from the non-self in B cells [5]. The theory was later extended to T cell activation by Lafferty and Cunningham [6], and was reinforced by the identification of the CD28 receptor together with the B7-1 molecule as its ligand [7, 8]. Besides CD28, additional costimulatory molecules such as ICOS, OX40 and 4-1BB, have since been identified [9, 10]. The complexity of T cell activation, however, became more apparent with the discovery of coinhibitory receptors such as CTLA-4 and PD-1. These receptors are expressed on the surfaces of activated T cells and down-regulate T cell activation. The absence of these coinhibitory signals in mice has been associated with autoimmunity, highlighting their possible role in maintenance of self tolerance [11, 12]. Despite this advance in knowledge about costimulation, the entirety of the costimulation spectrum is still yet to be uncovered.
Amongst the key cellular players of the immune system, with antagonistic roles, are helper and regulatory T cells. Helper T cells serve to coordinate the effector function of other white blood cells, while regulatory T cells down-regulate immune responses induced by helper T cells. In so doing, regulatory T cells play a critical role in preventing over-reaction, and in maintaining peripheral tolerance by suppressing activation of self reacting T helper cells [13, 14]. The two cell types are activated alike: Costimulation was initially defined solely with respect to helper T cells [15, 16]. However, shortly after the renewal of interest in regulatory T cells (previously dismissed), the revelation of the necessity of costimulation in their activation played a critical role in our understanding of the mechanisms of costimulation [17, 18, 19]. This implied that some costimulatory molecules, for example CD28 and IL-2, had dual (opposing) effects on immune responses, which made the prediction of therapeutic outcomes aimed at blocking any of these signaling pathways difficult [16, 20, 21]. This also confounded the determinants of the relative amount of activated regulatory vs helper T cells– a significant determinant of the outcome of an immune response [22, 23, 17]
Here, we propose to study T cell activation from the perspective of network science. Despite the discovery of a number of other cosignalling molecules, signal transduction between CD28 receptors and the B7 molecules remains the best defined initiator of T cell activation [24, 25]. We initially restrict our attention to this classical version of the two-signal theory with plans of considering the dynamic interplay between costimulation and coinhibition in the future. We show that the two-signal requirement induces a novel type-1 coherent feedforward loop. Feedfoward loops are amongst the most significant motifs found in transcription networks of diverse gene systems [26, 27, 28], and in other biological networks [29, 30]. Next, we analyze the implications of this model of T cell activation on the interaction between helper and regulatory T cells. This results in a coupled coherent-incoherent feedforward interaction loop. Sontag [31] recently mathematically analyzed a similar interaction by combining negative feedback and type 1 incoherent feed forward loops to model immune responses to antigen presentation. In addition to helper and regulatory T cell nodes, his model includes a pathogen node that we don’t consider here. Sontag [31] also considers dynamic rather than static antigen presentation as we have done here. As a result of these differences in model formulations, the two approaches to modeling immune responses yield different contextual outcomes.
2 Materials and Methods
Briefly, a typical immune response begins with the engulfing, and then processing, of infectious pathogens by antigen presenting cells (APCs) of the innate immune system: mainly dendritic cells and macrophages. Peptide fragments of the pathogens are then bound to MHC class II molecules and displayed for CD4 T cell recognition [32]. Upon successful recognition of such peptide-MHC complexes (pMHCs), the T cells are activated, and they go on to orchestrate the rest of the immune response against the infection. Once the infection has been nullified, suppressor T cells known as T regulatory cells turn off the immune response [33]. In this work, we studied the dynamics of T cell activation, and the interaction between helper and regulatory T cells, using mathematical models inspired by recent advances in network sciences. For convenience, we collectively refer to CD4 and CD8 T cells as effector T cells.
2.1 T cell activation induces a type-1 Coherent Feedfoward Loop (C1-FFL) with AND logic
According to the two signal theory, one signal for T cell activation is in the form of TCR-pMHC binding whilst the other is mediated by costimulatory proteins on the surfaces of T cells and APCs. The B7 molecules are only expressed on professional APCs, and their production peaks after the APCs have been activated by microbial products [33]. The combined action of the two signals activates T cells to proliferate and begin to differentiate into effector T cells [33, 34].
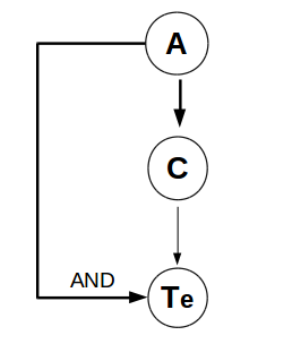
From the description above, T cell activation induces a feedfoward loop (FFL) in which the antigen signal () regulates the costimulatory signal (), and both jointly regulate T cell () activation (Figure 1). In this particular case, the FFL is “coherent” because the sign of the direct regulation path (from to ) is same as the overall sign of the indirect path through . This FFL motif is of type-1 because all the paths are positive (activators). Also, since both signals are required to activate the T cell, the input function of activation follows an AND logic gate. The other alternative is an OR-gate which obtains when either of the two signals is sufficient to activate the T cell.
2.1.1 Mathematical model of the type-1 coherent feedforward loop (C1-FFL)
Using a binary (ON-OFF) antigenic signal ,, the rates of change in the production of and were described by
| (1) | ||||
where the parameters , and are the activation coefficients of by , by , and by , respectively, while and are the maximal production rates of the costimulatory signal and the T cell, respectively. We assumed that the production of and are offset by the decay rate parameters and , respectively.
The general form,
| (2) |
in Equation 1 is called the Hill function and it represents the probability of activation of for a given concentration of . The parameters and represent the activation coefficient and the Hill coefficient, respectively. The activation coefficient represents the ligand concentration that generates a 50 chance of activation, while the Hill coefficient represents the effective number of molecules of required to activate . When , and when . The higher the value of , the more the Hill function behaves like a step function (Supplementary Figure 1). In this scenario, behaves like a threshold value for the ON and OFF regulatory influence of . When is close to zero however, the Hill function can still be approximated by the logic function
| (3) |
which is equal to one when the concentration is greater than a particular activation threshold , and zero otherwise. The equivalent form of Equation (2) for the inhibition of by is given by
| (4) |
Consider a case when the antigenic signal is ON for a time, . If this is the initial instance of the infection, then until , the costimulation signal is off, i.e, is zero. At , switches ON (A = 1) and the dynamics of follow from Equation 1 with an initial condition of .
At , switches off (A = 0 again) and similarly, the dynamics for follow from Equation (1) with as the initial condition.
Equation 1 can thus be simplified to
| (5) | ||||
where
| (6) |
Of note, coinhibition via competition for B7 molecules by CTLA-4 can be captured in .
2.2 The two-signal requirement with immune regulation induce a coupled coherent-incoherent feedforward loop (CCI-FFL)
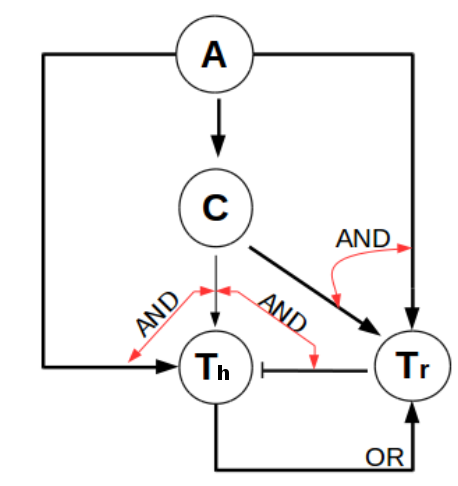
Usually, network motifs do not work in isolation: they are embedded within larger networks in a way that preserves their dynamical functions [35]. The interaction between T helper () cells and T regulatory () cells regulates the effector and regulatory properties of the immune system. An excessive immune response by cells is normally prevented by cells. Before it can suppress cells however, a cell must itself be activated following the same pathway like the T helper cell. In addition to this, cells can enhance the activation and sustain proliferation of cells by producing a cytokine, interleukin 2 (IL-2) [36, 37, 38]. IL-2, however, cannot substitute for CD28 in regulatory T cell activation [39]. Therefore, as shown in Figure 2, the two-signal requirement, combined with immune regulation, induce coupled coherent-incoherent feedforward Loop (CCI-FFL). Notably, this motif has an OR logic gate for the activation of cells. This CCI-FFL is a multiple output feedforward loop since the antigenic and costimulation signals regulate the activation of more than one type of T cell.
2.2.1 Mathematical model of the coherent-incoherent feedforward loop
Using the same approach as in Section 2.1.1, we modeled the rates of change of and using the following system of differential equations:
| (7) | ||||
where is defined as in Equation (6). Equation (7) takes into account the OR input function for the activation of cells by produced IL-2; this activation is inadequate for maximal activation, hence the parameter . The parameters represent the maximal production rate of each entity, are the activation/ suppression coefficient of entity by activating/ suppressing factor and are the respective decay rates.
Although it has been shown that regulatory T cells need not recognise the same antigen as T helper cells [40], we considered the crossregulation model [41] in which regulatory and helper T cells have same antigen specificity. All simulations were performed using the deSolve package in R and the parameter values used are as shown in the respective figures in the results section.
3 Results
3.1 The C1-FFL is a sign sensitive delay element in T cell activation.
Simulations based on the model in Equation 1 show that the coherent type 1 feedforward loop (C1-FFL) can serve as a sign-sensitive delay element (Figure 3), that is, a circuit that responds with a delay to a step-like stimulus in one direction (e.g OFF to ON), and rapidly to the step in the opposite direction (ON to OFF). The delay ( ) depends on the activation threshold ( ) for the T cell as shown in Equation 8.
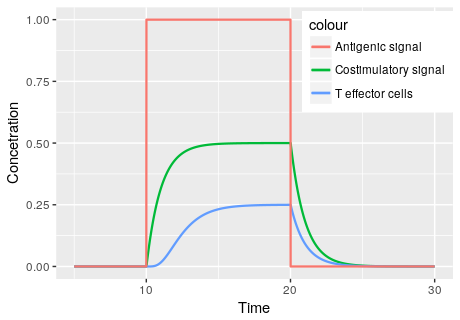
This delay is the time it takes to pass its activation threshold and is given by
| (8) |
where is the steady state concentration of the costimulation signal . From this expression, if , , thus the activation threshold should be smaller than . Also, the larger the value of , the longer the delay (Supplementary Figure 2).
3.2 The C1-FFL filters out noisy anitgenic signals.
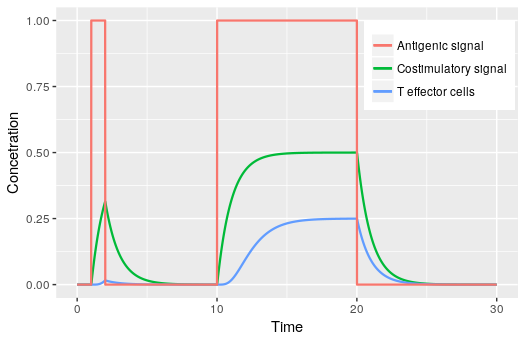
Model simulations also show that the C1-FFL motif filters out noisy signals (Figure 4). Long durations elicit a T cell response after a short delay whereas short durations fail to elicit a response. This failure of T cell activation occurs because the short duration of the antigen signal does not give enough time for the costimulation signal to accumulate past its activation threshold. Thus, the C1-FFL motif filters noise in the form of short pulses of antigen signal whilst allowing persistent signal to elicit T cell activation.
Of note, while we used a step-like stimulus in these simulations, sigmoidal forms yield qualitatively similar dynamics. For example consideration of an exponentially growing antigen signal , reproduces the delay in T cell activation as shown in Supplement Figure 3.
3.3 The coupled coherent-incoherent feed forward loop is a sign sensitive delay element.
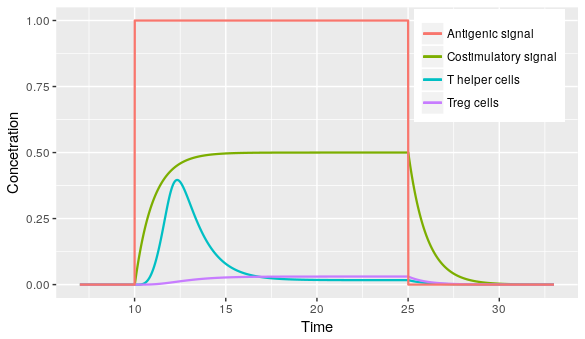
Simulations based on the mathematical model in Equation 7 show that the CCI-FFL retains the property of sign sensitive delay (Figure 5). The delay in the activation of each T cell type depends mainly on their respective costimulation threshold parameter, . In this simulation, the concentration of initially rises, unchecked, until passes its threshold and exerts a suppressive effect. We notice that when starts to drop, the concentration of is much lower than that of . However, this also depends on the simulation parameters.
3.4 A condition for a healthy concentration of activated T helper cells at equilibrium
With n=1 for simplicity, analysis of the system in Equation 7, at equilibrium, generates the following condition for a healthy concentration of activated T helper cells:
| (9) |
where
| (10) | |||||
| (11) |
and represents the maximum concentration of activated cells in normal conditions in the absence of any real antigen. Parameters and represent the overall activation rates for and cells, respectively. Assuming is very small, , and Equation (9) can be simplified to
| (12) |
Rearranging terms, we get:
| (13) | |||||
| (14) |
For a very small , and assuming , is likely to be negative considering typical values for and . In that case, Equation (13) becomes
| (15) |
which implies that
| (16) |
4 Discussion
In this work, we showed that T cell activation can be modeled by a feed foward loop: a motif capable of signal processing as a sign sensitive delay element. We argue that this is a desirable property of any regulatory system of T cell activation as it ensures response to actual threats and minimises wastage after the threat has been eliminated.
The two-signal theory posits that T cells require at least two signals to become activated: one in form of an antigenic signal (A) and the other in the form of a costimulation signal (C). Investigating the mode of T cell activation by these signals shows that the two signal theory induces a coherent type 1 feedforward loop. This network motif is known to behave as a sign-sensitive delay element that responds differently to signals of different signs. The presence of a delay, , during the ON step enables the T cell to decide whether or not to launch a response to potential health threats. This delay depends inversely on the activation threshold, as shown in Equation 8. The higher the threshold, the longer the delay. For very large values of , the T cell may never be activated given any duration of the antigen signal: This could be a plausible explanation for the phenomenon of self tolerance. On the other hand, the absence of a delay when the antigen signal is switched off ensures less wastage of resources and less damage to tissues due to a prolonged response.
Additionally, the sign sensitive delay rejects any transient antigenic (A) signals and responds only to persistent signals. This ensures T cell activation only when a signal is persistent (Figure 4). This is important because persistent signals are more likely to represent real health threats compared with short lived signals, and therefore minimises the wastage of resources and the side effects of a defective response. T cell responses consume the body’s resources for instance ATP and so if not required, these responses will be extremely inefficient. The two-signal model for T cell activation therefore provides a molecular mechanism for ensuring that immune responses occur only when they are required and for the correct amount of time.
When the two-signal model was combined with the interaction between the and cells, we found that this induces a coupled coherent-incoherent feedforward loop (CCI-FFL). The CCI-FFL forms a multiple output feedforward loop since antigenic signal (A) and costimulation signal (C) regulate the activation of more than one type of cell. As the activation/inactivation signals vary through time in the CCI-FFL, they pass through different activation/inactivation thresholds. Therefore, the CCI-FFL can generate temporal orders of T cell activation/inactivation depending on the activation/inactivation thresholds. In Figure 5, we observe delays in the initial activation of both and cells since they are individually governed by a C1-FFL . The difference in delay is because and have different activation thresholds, and hence they wait for different lengths of time after the antigen signal has been turned on. During infection, the activation threshold for is higher than that for [39], and so becomes activated first. The difference in delay should increase as the difference increases (Equation (8)). This makes sense biologically because we do not want to be suppressed by before it has had the chance to clear an infection. Therefore, the difference between and defines a critical time window within which can function unopposed by .
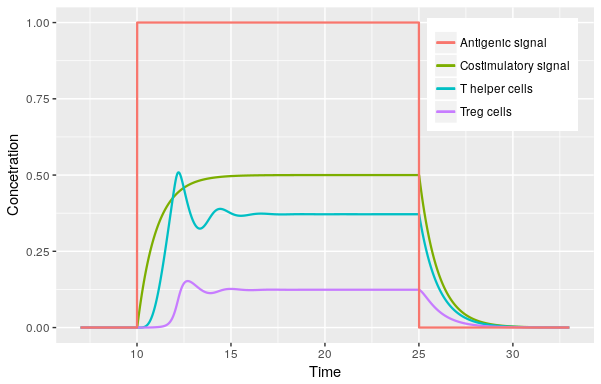
For a specific range of parameters, the dynamic model for the CCI-FFL can generate damped oscillations in the concentrations of and cells as shown in Figure(6). Inherent in the CCI-FFL structure is a negative feedback loop with two nodes, i.e, and . Negative feedback loops have been shown to be necessary for periodic behavior [42, 43]. The oscillations however, damp because repression by cells diminishes the activation and expansion of cells which, in turn, negatively affects the expansion of via IL-2 activation. This effect is propagated through subsequent cycles as the two cell types approach equilibrium. This is useful because it allows the individual to conserve limited resource and regulate the immune response corresponding to the infection level. For example, this can be helpful for infections that have an on and off behaviour, and for chronic infections like HIV.
In the absence of an antigen, a small number of T helper cells, less than a threshold , are nevertheless activated. This could be, for example, in response to bacteria in the gut or any other commensal organisms in the body. In the presence of a real threat, we expect this number to increase in order to fight off the pathogen, and then to decrease once the threat has been eliminated. It is the prolonged maintenance of such an increased quantity of activated cells that causes damage to body tissues and is thus usually suppressed by cells. A successful suppression of by will see this quantity fall back below . Using this bound on the concentration of activated cells under normal condition, we obtain a condition for a healthy concentration of activated T helper cells at equilibrium, shown in Equation (9). A consideration of , very small, as in the case of self reacting cells, simplifies this condition to This shows that the overall activation rate of T regulatory cells should be greater than that for T helper cells for the former to successfully suppress cells and to prevent self reacting T helper cells. In particular the concentration of required for half-maximal repression of () should ideally be much smaller than the concentration of required for half-maximal IL-2-mediated activation fo (i.e ).
Understanding the organising principles of T cell activation is key to knowing how it works, when it will be effective and why it sometimes fails, for example, why it is damped during cancer. In addition, it is also important for devising new ways to therapeutically improve efficiency of T cell activation. In this work, we applied network science to investigate the dynamical behaviour of T cell regulation. We focused on the classical version of the two-signal theory, leaving the more complex consideration of coinhibition for the future. We proposed a novel structural representation of the two signal theory of T cell activation in the form of a coherent type 1 feedforward loop, and showed that it has desirable properties of an ideal immune response. Combining the two signal requirement with immune regulation induced a coherent-incoherent feedforward loop, analysis of which generated a condition for a healthy concentration of activated T helper cells at equilibrium. Our results provide new insight about how the two signal requirement ensures that T cell activation is both targeted and efficient, and elucidate possible mechanisms for self tolerance.
References
- [1] Anne Davidson and Betty Diamond. Autoimmune diseases. New England Journal of Medicine, 345(5):340–350, 2001.
- [2] Wendy M Rauw. Immune response from a resource allocation perspective. Frontiers in genetics, 3, 2012.
- [3] Kelly A Lee. Linking immune defenses and life history at the levels of the individual and the species. Integrative and comparative biology, 46(6):1000–1015, 2006.
- [4] Ronald H Schwartz. Costimulation of t lymphocytes: the role of cd28, ctla-4, and b7/bb1 in interleukin-2 production and immunotherapy. Cell, 71(7):1065–1068, 1992.
- [5] Peter Bretscher and Melvin Cohn. A theory of self-nonself discrimination. Science, 169(3950):1042–1049, 1970.
- [6] Kevin John Lafferty and AJ Cunningham. A new analysis of allogeneic interactions. Australian Journal of Experimental Biology & Medical Science, 53(1), 1975.
- [7] Carl H June, Jeffrey A Ledbetter, Marjorie M Gillespie, Tullia Lindsten, and Craig B Thompson. T-cell proliferation involving the cd28 pathway is associated with cyclosporine-resistant interleukin 2 gene expression. Molecular and Cellular Biology, 7(12):4472–4481, 1987.
- [8] Peter S Linsley, Edward A Clark, and Jeffrey A Ledbetter. T-cell antigen cd28 mediates adhesion with b cells by interacting with activation antigen b7/bb-1. Proceedings of the National Academy of Sciences, 87(13):5031–5035, 1990.
- [9] Takanori So, Seung-Woo Lee, and Michael Croft. Immune regulation and control of regulatory t cells by ox40 and 4-1bb. Cytokine & growth factor reviews, 19(3):253–262, 2008.
- [10] Andreas Hutloff, Anna M Dittrich, Katja C Beier, Barbara Eljaschewitsch, et al. Icos is an inducible t-cell co-stimulator structurally and functionally related to cd28. Nature, 397(6716):263, 1999.
- [11] Paul Waterhouse, Josef M Penninger, Emma Timms, Andrew Wakeham, Arda Shahinian, Kelvin P Lee, Craig B Thompson, Henrik Griesser, Tak W Mak, et al. Lymphoproliferative disorders with early lethality in mice deficient in ctla-4. SCIENCE-NEW YORK THEN WASHINGTON-, pages 985–985, 1995.
- [12] Hiroyuki Nishimura, Taku Okazaki, Yoshimasa Tanaka, Kazuki Nakatani, Masatake Hara, Akira Matsumori, Shigetake Sasayama, Akira Mizoguchi, Hiroshi Hiai, Nagahiro Minato, et al. Autoimmune dilated cardiomyopathy in pd-1 receptor-deficient mice. Science, 291(5502):319–322, 2001.
- [13] Shimon Sakaguchi, Tomoyuki Yamaguchi, Takashi Nomura, and Masahiro Ono. Regulatory t cells and immune tolerance. Cell, 133(5):775–787, 2008.
- [14] Qizhi Tang and Jeffrey A Bluestone. The foxp3+ regulatory t cell: a jack of all trades, master of regulation. Nature immunology, 9(3):239, 2008.
- [15] Daniel L Mueller, Marc K Jenkins, and Ronald H Schwartz. Clonal expansion versus functional clonal inactivation: a costimulatory signalling pathway determines the outcome of t cell antigen receptor occupancy. Annual review of immunology, 7(1):445–480, 1989.
- [16] Deborah J Lenschow, Theresa L Walunas, and Jeffrey A Bluestone. Cd28/b7 system of t cell costimulation. Annual review of immunology, 14(1):233–258, 1996.
- [17] Benoît Salomon, Deborah J Lenschow, Lesley Rhee, Neda Ashourian, Bhagarith Singh, Arlene Sharpe, and Jeffrey A Bluestone. B7/cd28 costimulation is essential for the homeostasis of the cd4+ cd25+ immunoregulatory t cells that control autoimmune diabetes. Immunity, 12(4):431–440, 2000.
- [18] David M Sansom and Lucy SK Walker. The role of cd28 and cytotoxic t-lymphocyte antigen-4 (ctla-4) in regulatory t-cell biology. Immunological reviews, 212(1):131–148, 2006.
- [19] Qizhi Tang, Kammi J Henriksen, Elisa K Boden, Aaron J Tooley, Jianqin Ye, Sumit K Subudhi, Xin X Zheng, Terry B Strom, and Jeffrey A Bluestone. Cutting edge: Cd28 controls peripheral homeostasis of cd4+ cd25+ regulatory t cells. The Journal of Immunology, 171(7):3348–3352, 2003.
- [20] Salim Bouguermouh, Geneviève Fortin, Nobuyasu Baba, Manuel Rubio, and Marika Sarfati. Cd28 co-stimulation down regulates th17 development. PloS one, 4(3):e5087, 2009.
- [21] Andrew B Adams, Mandy L Ford, and Christian P Larsen. Costimulation blockade in autoimmunity and transplantation: The cd28 pathway. The Journal of Immunology, 197(6):2045–2050, 2016.
- [22] Hélène Bour-Jordan, Benoît L Salomon, Heather L Thompson, Gregory L Szot, Matthew R Bernhard, and Jeffrey A Bluestone. Costimulation controls diabetes by altering the balance of pathogenic and regulatory t cells. Journal of Clinical Investigation, 114(7):979, 2004.
- [23] Aldo A Rossini, Dale L Greiner, and John P Mordes. Induction of immunologic tolerance for transplantation. Physiological Reviews, 79(1):99–141, 1999.
- [24] Lieping Chen and Dallas B Flies. Molecular mechanisms of t cell co-stimulation and co-inhibition. Nature reviews. Immunology, 13(4):227, 2013.
- [25] Jennifer E Smith-Garvin, Gary A Koretzky, and Martha S Jordan. T cell activation. Annual review of immunology, 27:591–619, 2009.
- [26] Shmoolik Mangan, Alon Zaslaver, and Uri Alon. The coherent feedforward loop serves as a sign-sensitive delay element in transcription networks. Journal of molecular biology, 334(2):197–204, 2003.
- [27] Ron Milo, Shai Shen-Orr, Shalev Itzkovitz, Nadav Kashtan, Dmitri Chklovskii, and Uri Alon. Network motifs: simple building blocks of complex networks. Science, 298(5594):824–827, 2002.
- [28] Tong Ihn Lee, Nicola J Rinaldi, François Robert, Duncan T Odom, Ziv Bar-Joseph, Georg K Gerber, Nancy M Hannett, Christopher T Harbison, Craig M Thompson, Itamar Simon, et al. Transcriptional regulatory networks in saccharomyces cerevisiae. science, 298(5594):799–804, 2002.
- [29] JG White. Neuronal connectivity in caenorhabditis elegans. Trends in Neurosciences, 8:277–283, 1985.
- [30] Bruce Alberts, Dennis Bray, Karen Hopkin, Alexander Johnson, Julian Lewis, Martin Raff, Keith Roberts, and Peter Walter. Essential cell biology. Garland Science, 2013.
- [31] Eduardo D Sontag. A dynamic model of immune responses to antigen presentation predicts different regions of tumor or pathogen elimination. Cell Systems, 4(2):231–241, 2017.
- [32] Terry Y Nakagawa, William H Brissette, Paul D Lira, Richard J Griffiths, Nina Petrushova, Jeffrey Stock, John D McNeish, Susan E Eastman, Edward D Howard, Sally RM Clarke, et al. Impaired invariant chain degradation and antigen presentation and diminished collagen-induced arthritis in cathepsin s null mice. Immunity, 10(2):207–217, 1999.
- [33] Abul K Abbas and Charles A Janeway. Immunology: improving on nature in the twenty-first century. Cell, 100(1):129–138, 2000.
- [34] Frans P Nijkamp and Michael J Parnham. Principles of immunopharmacology. Springer Science & Business Media, 2006.
- [35] Uri Alon. Biological networks: the tinkerer as an engineer. Science, 301(5641):1866–1867, 2003.
- [36] Yonatan Savir, Nir Waysbort, Yaron E Antebi, Tsvi Tlusty, and Nir Friedman. Balancing speed and accuracy of polyclonal t cell activation: a role for extracellular feedback. BMC systems biology, 6(1):111, 2012.
- [37] Fei Guo, Cristina Iclozan, Woong-Kyung Suh, Claudio Anasetti, and Xue-Zhong Yu. Cd28 controls differentiation of regulatory t cells from naive cd4 t cells. The Journal of Immunology, 181(4):2285–2291, 2008.
- [38] Yosef Refaeli, Luk Van Parijs, Cheryl A London, Jürg Tschopp, and Abul K Abbas. Biochemical mechanisms of il-2–regulated fas-mediated t cell apoptosis. Immunity, 8(5):615–623, 1998.
- [39] Andreas A Hombach, David Kofler, Anja Hombach, Gunter Rappl, and Hinrich Abken. Effective proliferation of human regulatory t cells requires a strong costimulatory cd28 signal that cannot be substituted by il-2. The Journal of Immunology, 179(11):7924–7931, 2007.
- [40] Oral Alpan, Eric Bachelder, Eda Isil, Heinz Arnheiter, and Polly Matzinger. ’educated’dendritic cells act as messengers from memory to naive t helper cells. Nature immunology, 5(6):615, 2004.
- [41] Kalet Leon, Rolando Perez, Agustin Lage, and Jorge Carneiro. Modelling t-cell-mediated suppression dependent on interactions in multicellular conjugates. Journal of Theoretical Biology, 207(2):231–254, 2000.
- [42] El Houssine Snoussi. Necessary conditions for multistationarity and stable periodicity. Journal of Biological Systems, 6(01):3–9, 1998.
- [43] Jean-Luc Gouzé. Positive and negative circuits in dynamical systems. Journal of Biological Systems, 6(01):11–15, 1998.