Changes in the pulse phase dependence of X-ray emission lines in 4U 1626-67 with a torque reversal
Abstract
We report results from an observation with the XMM-Newton observatory of a unique X-ray pulsar 4U 1626–67. EPIC-pn data during the current spin-up phase of 4U 1626–67 have been used to study pulse phase dependence of low energy emission lines. We found strong variability of low energy emission line at 0.915 keV with the pulse phase, varying by a factor of 2, much stronger than the continuum variability. Another interesting observation is that behavior of one of the low energy emission lines across the pulse phase is quite different from that observed during the spin-down phase. This indicates that the structures in the accretion disk that produce pulse phase dependence of emission features have changed from spin-down to spin-up phase. This is well supported by the differences in the timing characteristics (like pulse profiles, QPOs etc) between spin-down and spin-up phases. We have also found that during the current spin-up phase of 4U 1626–67, the X-ray pulse profile below 2 keV is different compared to the spin-down phase. The X-ray light curve also shows flares which produce a feature around 3 mHz in power density spectrum of 4U 1626–67. Since flares are dominant at lower energies, the feature around 3 mHz is prominent at low energies.
keywords:
X-ray: Neutron Stars - accretion, pulsars, individual: 4U 1626–671 Introduction
4U 1626–67 is a remarkable ultra-compact X-ray binary bearing a neutron star with pulse period of 7.7 seconds (Rappaport et al., 1977). Evidence of binary motion has never been revealed from X-ray timing measurements (see e.g., Rappaport et al., 1977; Joss et al., 1978; Jain et al., 2008). Orbital period of 42 minutes has been inferred from the pulsed optical emission reprocessed on the surface of secondary (Middleditch et al., 1981; Chakrabarty, 1998). An upper limit of 10 lt-ms for pulse arrival delay has been reported by Jain et al. (2008) using X-ray data from RXTE-PCA. Time-scales of torque reversals observed in most of the accretion powered pulsars varies from weeks to months and years and, in most cases accretion torques are often related to the X-ray luminosity. 4U 1626–67, a persistent X-ray source underwent two torque reversals since its discovery (Camero-Arranz et al., 2010). It was initially observed in spin-up state, this trend reversed in 1990 and the neutron star began to spin-down. After the steady spin-down phase of about 18 years, a transition to spin-up took place in 2008. The second torque reversal was detected with RXTE-PCA (Jain & Paul, 2009) and Fermi-GBM (Camero-Arranz et al., 2009). Moreover, it is observed that this source does not obey standard X-ray luminosity-accretion torque relation (Beri et al., 2014). X-ray features during spin-down phase were different in comparison with both spin-up phases. The most outstanding difference in energy resolved pulse profiles of the two spin-up eras and the spin down era was disappearance of the sharp double peaked profile during spin-down era (for details see Beri et al., 2014). Quasi periodic oscillation (QPO) at 48 mHz was observed in all the observations during spin-down phase (Kaur et al., 2008), this feature was absent in the power density spectra (PDS) created using X-ray data during current spin-up phase (Jain et al., 2010).
The X-ray spectrum of 4U 1626–67 is well described using two
continuum components: a hard power law and a black body.
X-ray spectra during both spin-up phases showed blackbody temperature of about 0.6 keV
while during the spin-down phase of 4U 1626–67 the blackbody temperature decreased to
0.3 keV. Moreover, the energy spectrum became harder during the spin-down phase.
The power law photon index showed a value of 1.5 during the first spin-up phase
which changed to 0.4-0.6 during the spin-down phase and during the second spin-up phase
it showed a value in the range of 0.8-1.0
(see Beri
et al., 2014, references therein).
Detailed study of this source during each phase of torque reversal
suggests that accretion flow geometry is different during the spin-up and spin-down
phases and plays an
important role in transfer of angular momentum (Jain
et al., 2010; Beri
et al., 2014).
X-ray spectrum of 4U 1626–67 is unique, unusually bright Neon (Ne) and Oxygen (O) lines have been reported from many spectroscopic observations (Angelini et al., 1995; Owens et al., 1997; Schulz et al., 2001; Krauss et al., 2007). Observations made with Chandra revealed double peaked nature of low energy emission line features, indicating their formation in the accretion disk (Schulz et al., 2001). Continuum of the spectra is well described using a soft emission component and a power law (see Beri et al., 2015, and references therein) though.
Observations made during spin-down and spin-up
phase of 4U 1626–67 with the Suzaku observatory were used to measure spectral changes
with torque reversal in 2008 (Camero-Arranz
et al., 2012). The authors confirmed
that the equivalent width and the intensity of these emission
lines are variable. They found that fluxes of all the emission lines
have increased almost by factor of 5 with an exception
of Ne X (1.02 keV) emission line that showed an increase by factor of 8
after the torque reversal. Pulse
phase resolved spectroscopy performed using data from the XMM-Newton observatory during
spin-down phase of 4U 1626–67 revealed that line fluxes show pulse phase dependence (Beri
et al., 2015)
One of the emission line (O VII) showed the line flux to vary by a factor of about four,
significantly larger compared to
the relative variation of total flux.
Warp-like structures in the accretion disk are believed
to be the cause of observed line flux variability.
An interesting possibility for the cause of spin-down is the radiation pressure induced warping of the inner
accretion disk which may become retrograde leading to negative accretion
torque (van Kerkwijk et al., 1998).
Moreover, changes in the timing characteristics (like the pulse profile, the QPO’s etc)
in the spin-down phase compared to spin-up phase
are understood to be due changes in the inner accretion flow
from a warped accretion disk in the spin-down phase.
Therefore, we expect to observe changes
in the accretion flow and probably
also the accretion disk structures of 4U 1626–67 during
the spin-up phase. We carried out a
pulse phase resolved spectroscopy to investigate if this results
into a different modulation of the emission lines during its current spin-up phase.
In this paper we present results obtained from
timing and spectral study of 4U 1626–67, performed using data
obtained with the XMM-Newton observatory during its current spin-up phase.
The paper is structured as follows: we describe observation
details and data reduction procedure in Section 2. This is followed by
the results from timing analysis (Section 3). In Section 4 we present results from the spectral
analysis. The last section (Section 5) of the paper presents
results and discussions.
2 Observations and Data Reduction
We have obtained a 56 ks observation of 4U 1626–67 during its current spin-up phase with XMM-Newton.
The observation was performed
on October 5, 2015 bearing an ID-0764860101.
XMM-Newton satellite has three X-ray telescopes, each with an Europeon
photon imaging camera (EPIC) at the focus (Jansen
et al., 2001).
Two of the EPIC imaging spectrometers use metal-oxide semiconductors (MOS)
CCDs (Turner
et al., 2001) and one used pn CCD (Strüder
et al., 2001). Reflection grating spectrometer (RGS)
and optical monitor (OM) are two other instruments on-board XMM-Newton satellite.
RGS comprises of two spectrometers namely, RGS1 and RGS2.
Two RGS have a bandpass of 0.35–2.5 keV
and first-order spectral resolution of about 200 to 800 in 0.35–2.5 keV. They are attached to two of the X-ray telescopes
with MOS. Simultaneous optical/UV observations
are carried out with the optical monitor (OM).
In this work we performed analysis using data from
the EPIC-pn and the RGS on-board XMM-Newton.
EPIC-pn data were collected in timing mode using medium filter
with a frame time of 6 ms. In timing mode only one CCD chip
is in operation and data is collapsed into one dimensional row
and read out at high speed.
RGS data was operated in standard
spectral’ mode.
We processed the XMM-Newton observation data files, using the
science analysis software (SAS version 15.0). Latest updated calibration
files available as on April 2016 were applied.
Standard SAS
tool epproc was used to obtain EPIC-pn event file.
We first checked for flaring particle background in the data.
A light curve was extracted using selection criterion: PATTERN=0
in the energy range of 10-12 keV.
We found no evidence of soft proton flaring. Thereafter, we extracted
EPIC-pn cleaned event list by selecting events with PATTERN4,
FLAG=0 and energy in the range 0.3-12 keV. This cleaned event file was used to
extract source events and background files. We used rectangular box with RAWX =
30-46 for source events and RAWX = 2-4 for background. Source event file was also checked
for photon pile-up using SAS tool epatplot. No significant photon
pile-up was found. Barycenter correction was performed using SAS tool barycen.
For extraction of light curves and spectra SAS tool evselect
was used. Response matrix and Ancillary response files were generated
using the SAS task rmfgen and arfgen, respectively.
For the RGS data reduction, we used SAS tool rgsproc
to reduce and extract calibrated source and background spectrum and response files.
Standard procedure as mentioned in SAS analysis thread was followed.
3 Timing Analysis


Left hand side of Figure 1 shows barycenter corrected and background subtracted
light curve of 4U 1626–67 obtained using the EPIC-pn data.
Light curve is highly variable.
It includes both flares and dip features in it.
X-ray flares have also been observed in the light curves created using previous observations
made during its spin-up phase (see Beri
et al., 2014, and references therein).
Amplitude of flares is 2-3 times above the persistent level (Figure 1).
Duration of flares is few hundred of seconds.
Recurrence time-scales of these flares varies between 300 to 1000 seconds
and these time-scales are consistent with the previous reports (see Joss
et al., 1978; Li et al., 1980; Raman et al., 2016)
Unlike other flaring sources
like LMC X-4, SMC X–1, where persistent emission begins just after the end of flares,
it is interesting to notice a sharp dip in the light curve near the decay of bright flares
at 18000, 23000 seconds (second panel) and 51000 seconds (fourth panel)
of Figure 1.
This feature has never been reported before in 4U 1626–67.
Similar kind of dip near the end of outburst has also
been observed in the light curves of bursting pulsar (GRO J1744-28)
(eg., Giles et al., 1996).
3.1 Power density Spectrum
Power density spectrum (PDS) generated using the EPIC-pn light curve is shown in Figure-1. The light curve was divided into stretches of 8192 seconds. PDS from all the segments were averaged to produce the final PDS and were normalized such that their integral gives squared rms fractional variability and the white noise level was subtracted. PDS showed narrow peak at around 0.130 Hz which corresponds to the spin frequency of the neutron star. Multiple harmonics are also seen in the PDS of the source. In addition to the main peak, a QPO feature is seen at 3 mHz with fractional rms amplitude of . 3 mHz QPO can be due to flares seen in the light curve and this feature is observed for the first time in the X-ray data during current (spin-up) phase of 4U 1626–67. A similar mHz QPO was however observed in the PDS generated with X-rays during the first spin-up phase of 4U 1626–67 (see e.g., Joss et al., 1978). Another interesting observation is dependence of 3 mHz QPO on energy (Figure 2). It is evident from Figure 2 that flares are more prominent at lower energies and therefore sharp feature in the PDS around 3 mHz is dominant at energies below 5 keV. Fractional rms amplitude of 3 mHz QPO feature in the PDS created using light curves in different energy bands namely, 0.3-2 keV, 2-5 keV, 5-8 keV amd 8-12 keV are , , , respectively. We also detect a signature of broad QPO around 48 mHz with rms amplitude of 5 %, much smaller than the rms in the 48 mHz QPO seen during the spin-down phase (e.g., Kommers et al., 1998).


3.2 Pulse Profiles
Spin-period was determined to be seconds using epoch folding
maximization technique.
This period was used for creating pulse profiles.
We first created average pulse profile with 64 phase bins, using light curve in
0.3-12 keV energy band (Figure 3).
The bi-horned peaks observed in the pulse profiles
look similar to the previously reported pulse profiles
of 4U 1626–67 during its spin-up era (see e.g., Beri
et al., 2014).
However, in 0.3-12 keV band amplitude of first peak is slightly small compared to the second peak.
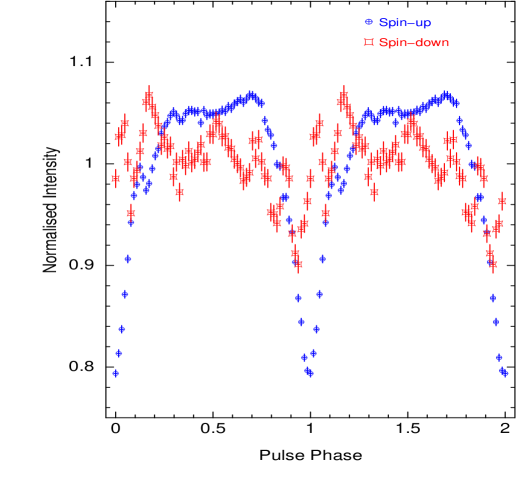
The energy resolved pulse profiles were created using the light curves in the energy bands of 0.3-2 keV, 2-5 keV, 5-8 keV, 8-12 keV. Thanks to XMM-Newton which enabled us to investigate pulse profiles below 2 keV during its current spin-up phase for the first time. Pulse profile in 0.3-2 keV band looks simple having shoulder-like structure. It has a sharp dip around phase 0.0. It seems that the sharp dip observed in the 0.3-2 keV profiles mainly contributes to the dip observed between the two horns in the energy averaged profiles (0.3-12 keV). Profile shape in 0.3-2 keV band is similar to that seen during the first spin-up phase (Pravdo et al., 1979). It is interesting to see that pulse profile below 2 keV is quite different from that observed in other energy bands. This suggests that pulsation of soft component is different from that in higher energy band pulse profiles which indicate that pulsation of thermal component is different from power law component. A soft spectral component, that pulsates differently from the power law component has been detected in other sources with low absorption column density (e.g., SMC X–1 and LMC X–4) and have been interpreted as reprocessed thermal emission from the inner accretion disk (Paul et al., 2002).
To compare pulse profiles below 2 keV during its current phase
with that of the spin-down phase, we created pulse profile in the energy band
of 0.3-2 keV using data from previous XMM-Newton observation (ObsID-0152620101)
during its spin-down phase. We performed data reduction and analysis
in the same way as discussed in our previous paper on 4U 1626–67
(Beri
et al., 2015).
It is interesting to see that pulse profile during spin-down phase
is quite different from that during its current phase.
Pulse profile below 2 keV has many structures during spin-down phase
which is not the case during its current spin-up phase (see Figure 4).
Pulse profiles in remaining energy bands are consistent
with previous observations in spin-up state (see Beri
et al., 2014, and references therein).
| Parameter | Model Values |
| NH (10atoms cm-2) | |
| PowIndex () | |
| Reduced | 1.43(dof 1337) |
Note: Errors quoted are with 90 confidence range.
Energy range used is 0.35-1.8 keV for RGS1 and RGS2 and 0.8-12.0 keV for EPIC-pn.
a Powerlaw normalisation ()
is in units of at 1 keV
b Line Energy in units of keV.
c Line width in units of keV.
d Gaussian normalisation is in units of
| Observatory | MJD | Blueshifted Lines | Redshifted Lines | |||
| V ( | V ( | Reference | ||||
| O VIII (0.653 keV) | ||||||
| Chandra | 51803.6 | 1740440 | 14.042.52 | 1900480 | 17.82 0.57 | Schulz et al. (2001) |
| XMM-Newton | 52145.1 | 1930260 | 1930260 | Krauss et al. (2007) | ||
| Chandra | 52795.1 | 1770330 | 1770330 | Krauss et al. (2007) | ||
| XMM-Newton | 52871.2 | 1810180 | 1810180 | Krauss et al. (2007) | ||
| XMM-Newton | 56397 | 1535158 | 716 | 1306158 | 61 6 | Current Work |
| Ne X (1.02 keV) | ||||||
| Chandra | 51803.6 | 2220350 | 8.150.93 | 1240220 | 15.04 1.65 | Schulz et al. (2001) |
| XMM-Newton | 52145.1 | 1910450 | 1910450 | Krauss et al. (2007) | ||
| Chandra | 52795.1 | 1670180 | 1670180 | Krauss et al. (2007) | ||
| XMM-Newton | 52871.2 | 1780420 | 1780420 | Krauss et al. (2007) | ||
| XMM-Newton | 56397 | 1731247 | 6520 | 1484247 | 98 22 | Current Work |
Note: a The Gaussian normalization is in units of
4 Spectroscopy
4.1 Phase Averaged Spectroscopy
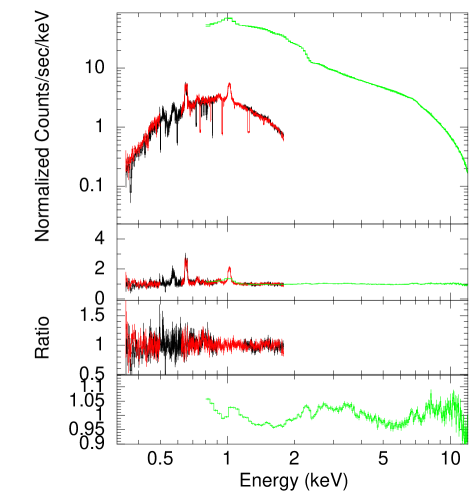
We performed simultaneous spectral fitting, using data from RGS and EPIC-pn (Figure 5).
Spectra of 1st order obtained using RGS1 and RGS2
were grouped using the tool grppha (HEASOFT Version-6.17)
to contain 6 channels per bin. We have used 0.35-1.8 keV band of RGS for spectral fitting.
Mean spectrum extracted using EPIC-pn was
rebinned using the SAS task specgroup to oversample the FWHM of energy resolution by factor of 3
and to obtain minimum of 25 counts/bin.
There is no reliable calibration below 0.7 keV for EPIC-pn
in timing mode 111http://xmm2.esac.esa.int/docs/documents/CAL-TN-0018.pdf
and the disagreement between the EPIC-pn and the RGS
is larger below 0.7 keV. Therefore,
we have used 0.8-12 keV band of EPIC-pn for spectral fitting.
All the spectral parameters other than the relative instrument normalization,
were tied together for both RGS and EPIC-pn.
We fixed the instrumental normalization of RGS1
to 1, and freed the normalization of the RGS2 and EPIC-pn
instruments. The values of constant model component
obtained for RGS2 and EPIC-pn are
and respectively.
A blackbody component and a power law well describes
the continuum of the phase-averaged spectrum (Pravdo
et al., 1979; Kii et al., 1986; Angelini
et al., 1995; Owens
et al., 1997; Orlandini
et al., 1998; Schulz et al., 2001; Krauss et al., 2007; Jain
et al., 2010; Iwakiri
et al., 2012).
Therefore, we modelled the continuum of the spectrum using tbabs*(bbodyrad+powerlaw).
Using only the continuum model showed a
significant excess in the residuals in the form of emission lines.
The second panel of Figure 5
shows the ratio between data and model, indicating the presence of low energy emission lines (below 1 keV).
The raw RGS spectrum shows the presence of two strong emission lines around
0.65 keV and 1.0 keV, therefore, we added two Gaussian components around
0.65 and 1.0 keV. These line energies correspond to Ne X and O VIII.
Adding these two Gaussian components was not adequate to obtain a good spectral fit.
The presence of additional emission features at 0.73 keV, 0.571 keV, and 0.913 keV
was observed in the
residuals of the RGS data.
The presence of O VII and Ne IX emission lines around 0.569 keV and 0.915 keV respectively
in the X-ray spectrum of 4U 1626-67 have been reported earlier by several authors
(see e.g., Schulz et al., 2001; Krauss et al., 2007).
Therefore, to obtain an appropriate fit
we added two additional Gaussian components at these line energies.
However, we required an additional Gaussian component
to model the excess seen around 0.73 keV.
This line energy correspond to iron (Fe-L shell) emission feature.
Table 1 shows the best fit parameters obtained. They are consistent with the
previous results during spin-up phase of 4U 1626–67 (see e.g., Camero-Arranz et al., 2010).
The equivalent widths (EW) of O VII (0.571 keV), O VIII (0.653 keV), Fe-L shell (0.73 keV), Ne IX (0.913 keV) and
Ne X (1.02 keV) emission lines are
eV, eV, eV, eV, 1 eV respectively.
Here, we emphasize that for the first time the X-ray spectrum of
4U 1626-67 showed an Fe-L shell fluorescence emission
feature and the detection of this feature at 0.73 keV is statistically significant
as the value of chi-squared () increased from 2049 to 2458 (1341 degrees of freedom)
on fixing its normalization to zero.
A systematic error of was added quadratically to each energy bin
to account for all the artifacts due to calibration issues in the EPIC-pn timing mode data.
The residuals of EPIC-pn showed the presence of a weak iron fluorescence emission line around 6.8 keV.
Therefore, we added another Gaussian component
with line energy centered around 6.8 keV to the spectrum. Equivalent
width of the emission line observed at 6.8 keV is keV.
The spectral fit resulted into reduced () of 1.43 for 1337 degrees
of freedom (see Table-1).
We also observed that on fixing the normalization of Fe K shell line
to zero lead to an increase in the value of chi-squared ()
from 1914 to 1930 (1338 degrees of freedom) which suggests that the detection of this emission feature is statistically significant.
The presence of Fe emission line was also observed in the MOS 2 spectrum.
The values of line flux and the equivalent width observed in the MOS 2 data
are and keV respectively.
These values are similar to that observed in
the pn data and on fixing the normalization to zero of this line in the MOS 2 data also showed increase in
the value of chi-squared (172 to 183 for 171 degrees of freedom) which is similar to that observed in the pn data.
The addition of the systematic error to the pn data
is not likely to introduce any pulse phase dependence of emission line fluxes which is the main
motivation of the present work. Here, we would like to mention that
owing to limited statistical significance of Fe emission line we have not performed
phase resolved spectroscopy for this line.
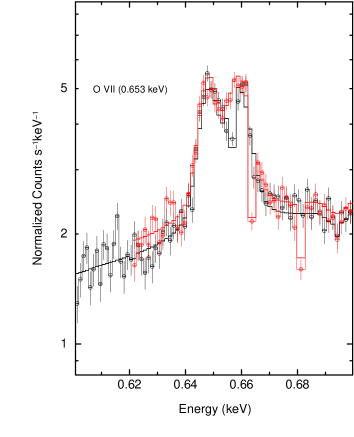
It is believed that Ne/O emission lines observed in the X-ray spectra of
4U 1626–67 originate from highly ionized layers of the accretion disk.
The existence of double-peaked profiles support their disk
origin (Schulz et al., 2001; Krauss et al., 2007). Interestingly, we noticed that one of the emission lines
at 0.653 keV (O VIII) showed the presence of double-peaked profiles
in the high resolution data of RGS (Figure 6).
Therefore, we fit this line with a pair of Gaussian
to resolve into the doppler pairs and to estimate the disk velocities
of red and blue-shifted components.
The line velocities measured using the RGS data
along with the previous known values are given in Table 2.
The single-Gaussian fit revealed a broad emission line
at 1.02 keV (Ne X) in the RGS2 spectrum. Therefore, we fit this line as well
with a pair of Gaussian and the velocities measured are given in Table 2.
Ne IX emission line observed in the XMM-Newton data did not allow us
to measure doppler velocities.


4.2 Pulse Phase Resolved Spectroscopy
For performing pulse phase resolved spectroscopy we have used data from EPIC-pn. We added phase’ column to the pn event list. This was performed using SAS task phasecalc with phase zero fixed at the reference time (epoch) used for creating pulse profiles. Thereafter, appropriate good time intervals (GTI) files were created for narrow phase bins of 0.05. These GTI files were used for the extraction of 20 phase resolved source spectra. Response matrices and ancillary response files used for phase averaged spectroscopy were used again for performing phase resolved spectroscopy. Spectral fitting was done in the energy range of 0.8-12 keV with the same spectral model consisting of a power-law, a blackbody and several emission lines. We fixed the neutral hydrogen column density, line energies and line widths to the values obtained from the phase averaged spectrum. Left plot of Figure 7 shows variation of flux of low energy emission lines with pulse phase. From the plot we observe :
-
•
Ne IX emission line at 0.913 keV shows strong variation with pulse phase (factor of ). value of 103 for 20 phase bins was observed after fitting a constant to the flux of line at 0.913 keV.
-
•
Ne X emission line at 1.02 keV shows no significant variation with pulse phase. This is similar to the previous observations made during spin-down phase of 4U 1626-67 (Angelini et al., 1995; Beri et al., 2015). A constant fitted to the flux of Ne X emission line showed a value of 32 for 20 phase bins.
We estimated the observed total continuum flux in the energy band of 0.7-12 keV,
power law flux in 2-12 keV band and the blackbody
flux in 0.7-2 keV band using the CFLUX convolution model
in XSPEC.
The continuum flux profile plotted in right hand side of Figure 7
shows that the modulation of the power law is same as the modulation of the
total flux while the flux modulation of the
blackbody component has a different shape.
The blackbody component shows a broad dip,
consistent with the pulse profile in the 0.3-2.0 keV band
in which the blackbody component dominates. Shape
of the power law profile can be imagined to have formed
as a narrow dip at the centre of a broad pulse peak, while the
blackbody profile is a broad dip on an otherwise constant emission.
Continuum parameters also showed variation with pulse phase (Figure 8). Blackbody temperature shows strong variation with possible correlation with the pulse profile. However, blackbody normalization profile shape is anti-correlated to its temperature profile. Power law index profile shows a sharp dip at phase 0.2 with some structures in rest of the profile while power law normalization shows strong correlation with the pulse profile shape (bi-horned peaks around pulse phase 0.9 and 1.1). The blackbody flux is a few percent of the total flux and given the systematic errors in EPIC-pn, one should be cautious about the blackbody parameters. The flux modulation of the blackbody is however certainly different from the power law flux variation, as is evident from the energy-resolved pulse profiles.
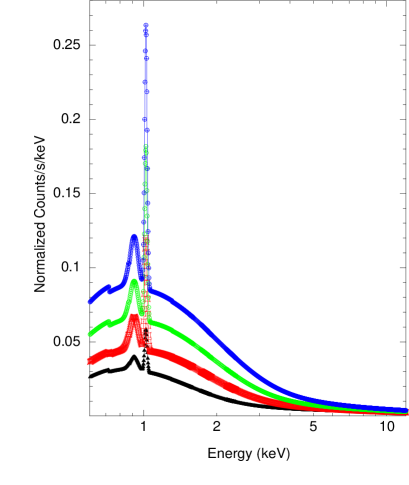


4.3 Intensity Resolved Spectroscopy
Since strong variation in count-rates is observed in light curve shown in Figure 1, we extracted intensity resolved spectra from EPIC-pn data using SAS task evselect. Good time intervals (GTIs) were created in different intensity ranges : sharp dip seen just after the end of first flare seen in Figure 1 and pn count-rates between 90-150 c/s, 150-200 c/s, 200-320 c/s were used to extract intensity resolved spectra. For spectral fitting we used the same technique which we opted while performing phase resolved spectroscopy. Neutral hydrogen column density, line energies and widths were fixed to the phase averaged values. We also added systematics while performing the spectral fitting. Fitted model components are shown in Figure 9. Temperature of blackbody and the power-law index was found to increase. The line fluxes and fractional contribution of the blackbody flux also found to increase with total flux (Figure 10).
| Ion Species | (Spin-down) | (Spin-up) |
|---|---|---|
| O VII | 2.3 | 4.2 |
| O VIII | 1.4 | 2.6 |
| Ne IX | 1.2 | 2.1 |
| Ne X | 0.07 | 0.14 |
Note: a Radius Measurements are in units of
5 Discussion & Summary of Results
In this paper we present results obtained using data from the
XMM-Newton observatory during the current spin-up phase of
4U 1626–67. Several new
and significant changes have been observed in comparison to the previous
observation made during its spin-down phase. The main focus
of our study is to observe a pulse phase dependence of low energy
emission lines seen in the X-ray spectrum of 4U 1626–67.
Strong pulse phase dependence of O VII emission line at 0.569 keV
was observed during spin-down phase of 4U 1626–67. This strong variation was
interpreted as a result of warps in the accretion disk (Beri
et al., 2015).
Dissimilarities in timing characteristics (such as pulse profile, QPOs)
during spin-down and spin-up eras are believed to be due to difference in the
inner accretion flow from a warped accretion disk during spin-down phase (Beri
et al., 2014; Kaur
et al., 2008).
Therefore, one expects to see a different behavior of line fluxes with
pulse phase during current spin-up phase of this source.
The calibration issues below 0.7 keV in the timing mode data of EPIC-pn
did not allow us to study the pulse phase dependence of emission line features
at 0.571 keV (O VII), 0.653 keV (O VIII) and 0.733 keV (Fe L). However, we investigated the behavior
of emission lines at 0.913 keV (Ne IX) and 1.02 keV (Ne X) with the pulse phase.
We summarize the results as follows :
-
•
Light curve obtained using the EPIC-pn data during its current spin-up phase showed dips. Unlike other flaring sources like LMC X-4, SMC X–1 it is interesting to notice a broad dip in the light curve soon after the decay of a large flare. This feature is similar to that observed in the bursting pulsar, GRO J1744-28. The light curve of GRO J1744-28 showed the presence of a dip and recovery period following each outburst (see e.g., Giles et al., 1996) and the X-ray spectrum of GRO J1744-28 showed no significant change going from quiescence to outburst (Cannizzo, 1996). The same authors proposed that the outbursts observed in the bursting pulsar could be due to Lightman-Eardley (LE) instability (Lightman & Eardley, 1974) in the accretion disk and the material that is evacuated onto the pulsar during an accretion event is replenished by material flowing in from further out; hence, the dip and recovery in the light curve following an outburst. After performing intensity resolved spectroscopy of 4U 1626–67 we found that overall there is no change in the shape of shape of the spectrum (see Figure 9) except that the continuum and line parameters follow an increasing trend with intensity. Therefore, it is plausible that a similar mechanism might be responsible for the presence of flares, sharp dips in the light curve of 4U 1626–67.
-
•
QPO feature around 3 mHz is observed in the PDS. This feature has been observed for the first time using X-ray data of current spin-up phase. The feature at 3 mHz also shows strong energy dependence. The feature is sharp at low energies as flares dominate at low energies.
The energy dependence of fractional rms amplitude of QPO has been used as a tool to understand the physical origin of QPO (see e.g., Gilfanov et al., 2003; Cabanac et al., 2010; Mukherjee & Bhattacharyya, 2012). The fractional rms amplitude of 3 mHz QPO observed in 4U 1626–67 showed an increase upto 5 keV and thereafter its value saturates (probably due to lower count rates at higher energies). Therefore, it seems that fluctuations in the blackbody component could be a plausible cause of the observed mHz QPO in 4U 1626–67.
-
•
We found that the pulse profile shape below 2 keV is different from that seen during spin-down phase of 4U 1626–67 (Figure 4). Moreover, during its spin-up phase pulse profiles below 2 keV are quite different from that seen above 2 keV (Figure 3). A possible explanation to these observations is changes in the emission diagram of the accretion column. During the low luminosity phase (spin-down) of 4U 1626–67, the emission of the accretion column is concentrated in a beam, oriented along the magnetic field axis while during the high luminosity phase (spin-up) the emission diagram changed to the fan beam pattern (Basko & Sunyaev, 1975). Soft X-ray emission (below 2 keV) is attributed to reprocessing of the primary emission by the optically thick material (i.e., the inner accretion disk) and, therefore, changes in the emission diagram might lead to the changes in the illumination of the inner accretion disk and hence, different pulse profiles below 2 keV during the spin-up phase compared to the spin-down phase of 4U 1626—67. We also note that the similar hypothesis was also proposed by Koliopanos & Gilfanov (2016) to explain the origin of the iron line during spin-up phase.
-
•
Values of EW of emission lines observed in the phase averaged spectrum suggests that the EW of O VIII has increased by a factor of 4 compared to the value (7 eV) measured with Suzaku during its spin-up phase by Camero-Arranz et al. (2012). However, EW measured with ASCA and XMM-Newton during its spin-down phase was 14 eV (Angelini et al., 1995; Krauss et al., 2007). Observations made with ASCA and XMM-Newton during spin-down phase of 4U 1626-67 revealed EW of O VII to be 31 eV and 23 eV respectively (Angelini et al., 1995; Krauss et al., 2007) while the measurement made during spin-up phase with the Suzaku observatory showed a much lower value (1.3 eV). EWs of Ne IX and Ne X emission lines are almost consistent with the previous measurements made during its spin-up phase (Camero-Arranz et al., 2012).
-
•
From the intensity resolved spectroscopy, we found that there is an increase in the ratio between blackbody and power law flux which suggests that the spectrum softens with the intensity. The values of line fluxes at 0.913 keV and 1.02 keV also showed an increase with intensity. However, we did not notice any correlation between the equivalent width of these emission lines with the intensity (Figure 10).
-
•
From the pulse phase resolved spectroscopy of 4U 1626–67, we observed a strong variation of Ne IX emission line with the pulse phase while the emission line at 1.02 keV (Ne X) showed a lack of pulsations. A different behaviour of Ne IX and Ne X emission lines accross the pulse phase suggests that these emission lines might have a different origin. It may be possible that Ne IX emission line originates from the accretion disk and thus, showing a strong pulse phase dependence while the Ne X emission line originates from highly ionized optically thin emission i.e. from the material trapped in the Alfven shell (Basko, 1980). If this scenario is true, it also provides an explanation to the different line shapes of Ne IX and Ne X emission lines. The broadening observed in the profile of Ne IX emission line could be due to the Doppler shifts while the microscopic processes may be the cause of the broadening of Ne X emission line.
Current observation made during spin-up phase of 4U 1626–67 showed a different line intensity modulation pattern of Ne IX emission line compared to the earlier XMM-Newton observation in the spin-down phase. Pulse phase dependence of low energy emission lines in 4U 1626–67 is believed to be due to geometrical effect called “warping” of the accretion disk (Beri et al., 2015). Due to warps (wherein tilt angle of the normal to the local disk surface varies with azimuth) in the accretion disk, one expects to observe modulation in the flux of reprocessed emission visible along our line of sight. Several possibilities have been discussed in the literature that might lead to warps in the accretion disk. One of the widely accepted possibility is that if the accretion disk is subject to strong central irradiation, then it is unstable to warping (see e.g., Petterson, 1977; Pringle, 1996). We also note that Pringle (1996) suggested that radiation-driven warping is strongest in the outer regions of the accretion disks. From Table 2, it is interesting to notice that O VIII emission line at 0.653 keV showed a lower value of velocity compared to the values measured during the spin-down phase of 4U 1626–67. This indicates that the radius of the accretion disk at which this emission line is formed has moved outward during spin-up phase.
In order to further investigate the above, we estimated radii of Ne/O emission line formation regions using the expression for ionization parameter ( =), where is the X-ray luminosity, is the ion number density and is the radius (see Table 3) The values of ionization parameters calculated using the XSTAR code (Kallman & McCray, 1982) for the optically thin photoionized model 222http://heasarc.gsfc.nasa.gov/lheasoft/xstar/xstar.html were opted for our calculations. We further assumed a constant value () for the electron number density. This is a reasonable assumption as comparable values of number density were estimated by Schulz et al. (2001). It is interesting to notice from Table 3 that the radius of line formation region for each of the ion species has moved outwards compared to the values obtained using measured during spin-down phase. This further supports our interpretation that a strong variation of Ne IX line during the current spin-up phase of 4U 1626–67 is because the structures (or warps) in the accretion disk (that produce pulse phase dependence of emission lines) have changed during its spin-up phase or the line forming region has moved outwards where the warps dominates.
Different pulse phase dependence of Ne IX emission line observed during current spin-up phase of 4U 1626–67, therefore, supports that there is a possible change in accretion flow geometry. Accretion flow geometry plays an important role in transfer of angular momentum and therefore any change in it would suggest a change in the interaction between the Keplerian disk and the stellar magnetic field at the corotation radius.
Acknowledgments
We thank the anonymous referee for several useful suggestions which improved the quality of the paper. A.B. gratefully acknowledge Raman Research Institute (RRI) for providing local hospitality and financial assistance, where this work was started. She is also grateful to the Royal Society and SERB (Science Engineering Research Board, India) for financial support through Newton-Bhabha Fund. A.B would like to extend further thanks to Michael Smith and Matteo Guainazzi for their useful insights about XMM-Newton data analysis. The authors would like to thank all the members of the XMM-Newton observatory for carrying out observation of 4U 1626–67 during its current spin-up phase and for their contributions in the instrument preparation, spacecraft operation, software development, and in-orbit instrumental calibration.
References
- Angelini et al. (1995) Angelini L., White N. E., Nagase F., Kallman T. R., Yoshida A., Takeshima T., Becker C., Paerels F., 1995, ApJ, 449, L41
- Basko (1980) Basko M. M., 1980, A&A, 87, 330
- Basko & Sunyaev (1975) Basko M. M., Sunyaev R. A., 1975, A&A, 42, 311
- Beri et al. (2014) Beri A., Jain C., Paul B., Raichur H., 2014, MNRAS, 439, 1940
- Beri et al. (2015) Beri A., Paul B., Dewangan G. C., 2015, MNRAS, 451, 508
- Cabanac et al. (2010) Cabanac C., Henri G., Petrucci P.-O., Malzac J., Ferreira J., Belloni T. M., 2010, MNRAS, 404, 738
- Camero-Arranz et al. (2009) Camero-Arranz A., Finger M. H., Wilson C., 2009, The Astronomer’s Telegram, 2099
- Camero-Arranz et al. (2010) Camero-Arranz A., Finger M. H., Ikhsanov N. R., Wilson-Hodge C. A., Beklen E., 2010, ApJ, 708, 1500
- Camero-Arranz et al. (2012) Camero-Arranz A., Pottschmidt K., Finger M. H., Ikhsanov N. R., Wilson-Hodge C. A., Marcu D. M., 2012, A&A, 546, A40
- Cannizzo (1996) Cannizzo J. K., 1996, ApJ, 466, L31
- Chakrabarty (1998) Chakrabarty D., 1998, ApJ, 492, 342
- Giles et al. (1996) Giles A. B., Swank J. H., Jahoda K., Zhang W., Strohmayer T., Stark M. J., Morgan E. H., 1996, ApJ, 469, L25
- Gilfanov et al. (2003) Gilfanov M., Revnivtsev M., Molkov S., 2003, A&A, 410, 217
- Iwakiri et al. (2012) Iwakiri W. B., et al., 2012, ApJ, 751, 35
- Jain & Paul (2009) Jain C., Paul B., 2009, The Astronomer’s Telegram, 2095
- Jain et al. (2008) Jain C., Paul B., Joshi K., Dutta A., Raichur H., 2008, Journal of Astrophysics and Astronomy, 28, 175
- Jain et al. (2010) Jain C., Paul B., Dutta A., 2010, MNRAS, 403, 920
- Jansen et al. (2001) Jansen F., et al., 2001, A&A, 365, L1
- Joss et al. (1978) Joss P. C., Avni Y., Rappaport S., 1978, ApJ, 221, 645
- Kallman & McCray (1982) Kallman T. R., McCray R., 1982, ApJS, 50, 263
- Kaur et al. (2008) Kaur R., Paul B., Kumar B., Sagar R., 2008, ApJ, 676, 1184
- Kii et al. (1986) Kii T., Hayakawa S., Nagase F., Ikegami T., Kawai N., 1986, PASJ, 38, 751
- Koliopanos & Gilfanov (2016) Koliopanos F., Gilfanov M., 2016, MNRAS, 456, 3535
- Kommers et al. (1998) Kommers J. M., Chakrabarty D., Lewin W. H. G., 1998, ApJ, 497, L33
- Krauss et al. (2007) Krauss M. I., Schulz N. S., Chakrabarty D., Juett A. M., Cottam J., 2007, ApJ, 660, 605
- Li et al. (1980) Li F. K., McClintock J. E., Rappaport S., Wright E. L., Joss P. C., 1980, ApJ, 240, 628
- Lightman & Eardley (1974) Lightman A. P., Eardley D. M., 1974, ApJ, 187, L1
- Middleditch et al. (1981) Middleditch J., Mason K. O., Nelson J. E., White N. E., 1981, ApJ, 244, 1001
- Mukherjee & Bhattacharyya (2012) Mukherjee A., Bhattacharyya S., 2012, ApJ, 756, 55
- Orlandini et al. (1998) Orlandini M., et al., 1998, ApJ, 500, L163
- Owens et al. (1997) Owens A., Oosterbroek T., Parmar A. N., 1997, A&A, 324, L9
- Paul et al. (2002) Paul B., Nagase F., Endo T., Dotani T., Yokogawa J., Nishiuchi M., 2002, ApJ, 579, 411
- Petterson (1977) Petterson J. A., 1977, ApJ, 216, 827
- Pravdo et al. (1979) Pravdo S. H., et al., 1979, ApJ, 231, 912
- Pringle (1996) Pringle J. E., 1996, MNRAS, 281, 357
- Raman et al. (2016) Raman G., Paul B., Bhattacharya D., Mohan V., 2016, MNRAS, 458, 1302
- Rappaport et al. (1977) Rappaport S., Markert T., Li F. K., Clark G. W., Jernigan J. G., McClintock J. E., 1977, ApJ, 217, L29
- Schulz et al. (2001) Schulz N. S., Chakrabarty D., Marshall H. L., Canizares C. R., Lee J. C., Houck J., 2001, ApJ, 563, 941
- Strüder et al. (2001) Strüder L., et al., 2001, A&A, 365, L18
- Turner et al. (2001) Turner M. J. L., et al., 2001, A&A, 365, L27
- van Kerkwijk et al. (1998) van Kerkwijk M. H., Chakrabarty D., Pringle J. E., Wijers R. A. M. J., 1998, ApJ, 499, L27