Cross section of -induced reactions on iridium isotopes obtained from thick target yield measurement for the astrophysical process
Abstract
The stellar reaction rates of radiative -capture reactions on heavy isotopes are of crucial importance for the process network calculations. These rates are usually derived from statistical model calculations, which need to be validated, but the experimental database is very scarce. This paper presents the results of -induced reaction cross section measurements on iridium isotopes carried out at first close to the astrophysically relevant energy region. Thick target yields of 191Ir(,)195Au, 191Ir(,n)194Au, 193Ir(,n)196mAu, 193Ir(,n)196Au reactions have been measured with the activation technique between E MeV and 17 MeV. For the first time the thick target yield was determined with X-ray counting. This led to a previously unprecedented sensitivity. From the measured thick target yields, reaction cross sections are derived and compared with statistical model calculations. The recently suggested energy-dependent modification of the +nucleus optical potential gives a good description of the experimental data.
keywords:
Nuclear astrophysics, astrophysical process, -induced reactions, activation method, thick target yield1 Introduction
The majority of nuclides heavier than iron are produced via neutron capture reactions [1, 2, 3, 4]. However, there are a few dozens of nuclides on the proton rich side of the valley of stability, the so-called -nuclei, which cannot be reached by these processes. These are produced mainly in the so-called process [5], occurring in hot, dense astrophysical plasmas as encountered, e.g., in core-collapse supernovae (ccSN) and thermonuclear supernovae (SNIa). While SNIa remain a promising site for -nucleus production [6, 7], the ccSN model calculations still show deficiencies in reproducing the observed -nucleus abundances in some nuclear mass regions [5]. Both sites, however, may contribute to the galactic -nucleus content. The deficiencies are partly due to the uncertain nuclear physics input [8]. The reaction network for the process involves tens of thousands of reactions on thousands of mainly unstable nuclei. The network calculations use mostly theoretical reaction rates calculated with the Hauser-Feshbach (H-F) statistical model [9]. Above neutron number the reaction flow is mainly proceeding through chains of (,n) and (,) reactions due to nuclear structure effects (reaction values) [5, 10]. Experimental reaction rate information can be obtained by measuring the inverse -capture reaction cross sections [11, 12, 13] and applying the principle of detailed balance [14]. Experimental data of -capture reactions in the relevant energy region are still scarce, however [15]. A comparison of H-F predictions to the scarce low-energy data above have consistently shown an overprediction of cross sections [5]. In the astrophysically relevant energy region [16] the H-F cross section calculations are only sensitive to the -channel width [17], which is calculated using global nucleus optical model potentials. Recently, an energy dependent modification of the depth of the imaginary part of the widely used McFadden-Satchler potential [18] was shown to describe much better the experimental data [19, 20, 21]. Lately developed further alternatives also include energy-dependent modifications of the imaginary part, these are e.g. [22, 23, 24].
This work presents experimental data for one of the heaviest nuclides investigated so far. For the first time, thick target yield measurement combined with X-ray detection were employed for determining -process related cross sections for such a heavy nuclide. The data were compared to H-F calculations for further constraining the optical model potential.
2 Thick target yield and cross section
Most of the former studies concentrated on the direct measurement of the reaction cross sections. Usually thin layers of target material are used, in which the projectile energy loss is small, and by knowing the number of target atoms the cross section can be derived at an effective energy. In the present study the projectile stops in the target, therefore, reactions take place with all energies between the bombarding energy and zero. Thus the quantity to be measured is the so-called thick target yield, i. e., the number of reactions per projectile. The number of target atoms is maximized in this way and does not limit the yield to be measured. In process relevant studies the thick target yield technique was applied recently only in the lower mass range [25, 26]. This study is the pioneering work in the heavy mass range.
The thick target yield () as a function of energy () is related to the reaction cross section () by the following integral formula:
| (1) |
where is the effective stopping power for the studied isotope, i.e., the stopping power of chemically pure iridium divided by the isotopic abundance of the studied isotope. From the measured thick target yields the cross section between two energies can be obtained by subtraction:
| (2) |
where is the averaged effective stopping power in the energy range.
is determined from the yield curve, per definition
| (3) |
3 Studied reactions
Iridium in its natural form consists of two isotopes, 191Ir and 193Ir with 37.3% and 62.7% relative abundances, respectively. The -induced reactions on both isotopes were investigated in the energy range of E MeV MeV in 0.5 MeV energy steps. For the investigations the activation technique was used. Therefore only reactions leading to unstable nuclei were studied. The main reaction of interest is the radiative capture of particles by 191Ir. Since in the studied energy region the (,n) reaction channel is also open for both isotopes, these reactions were also studied. Although they are not immediately important in the process, their cross sections are mainly sensitive to the -channel width. Accordingly they provide an additional constraint for the nucleus optical potential.
191Ir(,)195Au
Because there are no previous experimental data for this reaction in the literature, our new data enlarges the existing database related to process reactions. The reaction product 195Au has the longest half-life of all studied isotopes (see table 1). For this reaction, not only the rays were used in the determination, but also the X-rays. However, as the characteristic X-rays following the decay of the different studied isotopes are identical, the X-ray peaks in the spectra are initially populated by all of them. After several months the reaction products with shorter half-lives decay off and only 195Au remains. Thus, from the time-dependent population of the X-ray peaks, the activity of this isotope can be derived. At the lowest irradiation energies the peak was buried by the background and only the X-rays were strong enough to be visible. The X-ray detection technique was tested already for thin targets [27, 28]. In this paper we present the first thick target yield measurements via X-ray detection for a process related study.
| Reaction | Half-life | ray or X-ray | Intensity | ||
|---|---|---|---|---|---|
| product | / h | energy / keV | / % | ||
| 194Au | 38.02 10 | 328.5 | 60. | 4 | 8 |
| 293.5 | 10. | 58 | 15 | ||
| 195Au | 4464.2 14 | 66.8 | 47. | 2 | 11 |
| 98.9 | 11. | 21 | 15 | ||
| 196mAu | 9.6 1 | 147.8 | 43. | 5 | 15 |
| 188.3 | 30. | 0 | 15 | ||
| 196Au | 148.006 14 | 355.7 | 87. | 0 | 30 |
| 333.0 | 22. | 9 | 9 | ||
| 426.1 | 6. | 6 | 3 | ||
191Ir(,n)194Au
There are two datasets in the literature for this reaction [32, 33]. Both were obtained using the stacked foil technique. Only the lowest energy points of these studies are within our investigated energy range. Due to the limitations of this technique, however, those points have large energy uncertainties. In our measurement, the energy uncertainty is much smaller even with the subtraction method.
193Ir(,n)196mAu
The metastable state of 196Au at an excitation energy of 0.596 MeV has a long enough half-life to be measurable by the activation technique. This level decays exclusively by internal transitions to the ground state, producing rays with high relative intensity (see table 1). Using these, the partial thick target yield populating this level was derived. Previously in the literature only the ratios of the reaction cross sections leading to the metastable and to the ground state were published, and mainly at reaction energies much higher than our energy range [34, 35, 36].
193Ir(,n)196Au
From the decay of 196Au the total reaction cross section was derived. Even though 196Au nuclei in their ground states are also produced via the long lived isomeric state, after one day of waiting time the majority of the metastable nuclei de-excited. Using only the spectra recorded after this time, the measured decay curve of 196Au was not distorted. The total reaction cross section including the production via the metastable state was calculated from these countings.
4 Experimental details
Targets
For the measurements, 50 m thick high purity (99.9 %) iridium foils of natural isotopic composition were used. This thickness fulfils the criteria of a thick target to completely stop the particles. With the maximum energy investigated here (17 MeV), the average range of an particle in iridium according SRIM [37] is 40 2 m. According to the supplier’s specification, the iridium foils contain trace amounts of platinum, rhenium, and iron at the ppm level.
Irradiations
For the irradiations, the MGC-20 type cyclotron of Atomki was used. The particles entered the activation chamber through a beam defining aperture and a second aperture was supplied with -300 V secondary electron suppression voltage. The apertures and the chamber were isolated allowing to measure the beam current. The typical -beam current was A A. The length of the irradiations was typically h h. Since the particles completely stopped in the targets, the possible blistering had to be avoided. Therefore, the irradiation was stopped typically every 12 h and the target was rotated to receive the bombardment at a slightly different spot. With this method, no visible blistering occurred. The beam current was recorded with a multichannel scaler, stepping the channels every minute. In this way, the small variations in beam intensity were followed and taken into account in the data analysis.
-ray and X-ray detection
The produced activity was determined by counting the and/or X-rays following the decay of the reaction products (see table 1). For the counting a thin-crystal high-purity germanium detector, a so-called Low Energy Photon Spectrometer (LEPS) was used. The detector was equipped with a home-made 4 shielding consisting of layers of copper, cadmium, and lead [38].
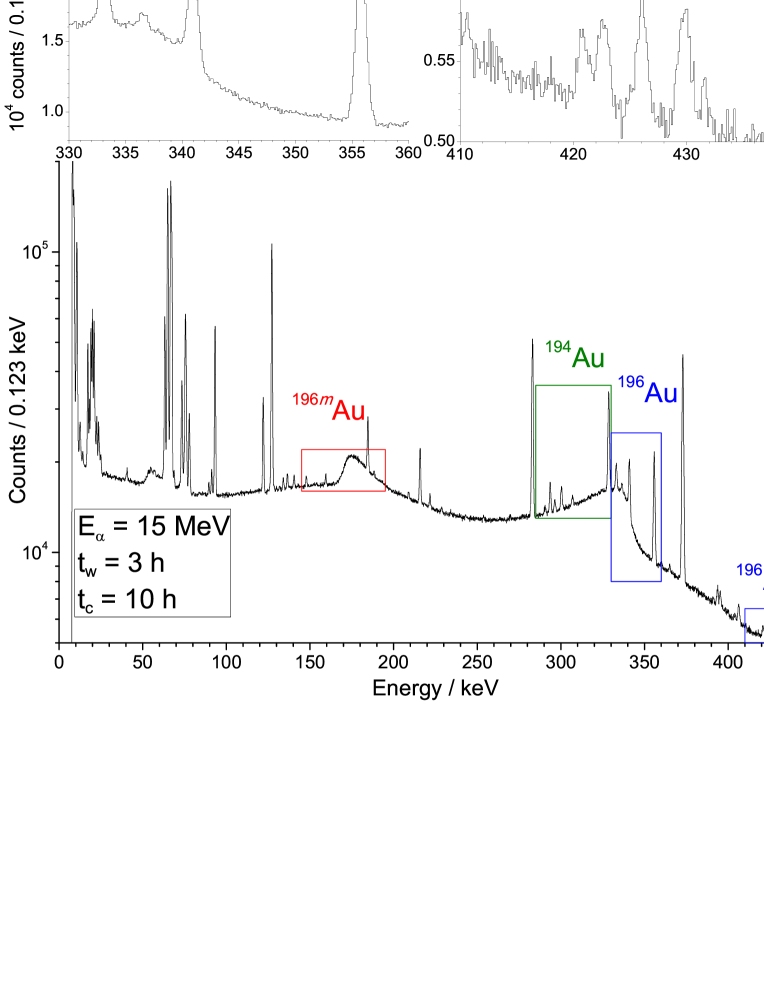
The activity of the reaction products of the (,n) channels was measured at 3 cm distance. The dead time was always below 5% at the beginning of the counting and decreased to a negligible level within a few hours. A typical spectrum taken 3 h after the irradiation with E MeV is shown in fig. 1.
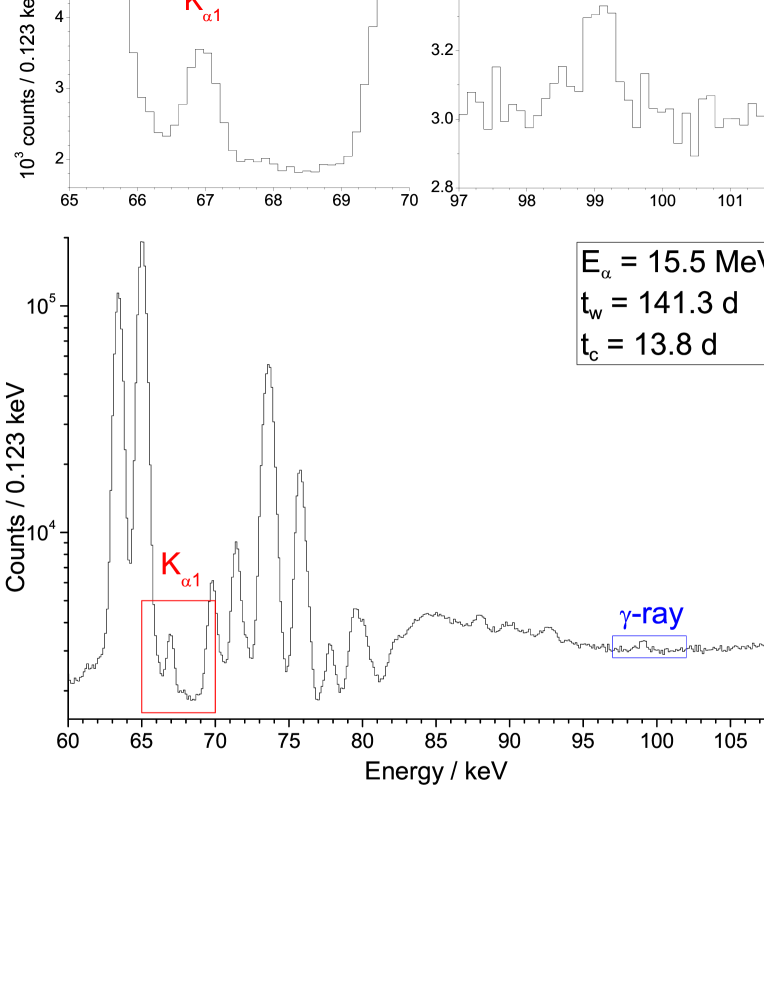
The countings for the 191Ir(,)195Au reaction product were done in 1 cm counting geometry to increase the efficiency. Typically these countings were done at least 4 months after the irradiations, hence no notable dead time was experienced and only the 195Au isotope populated the X-ray peaks, i.e., less than 0.5 % contribution came from the other isotopes. In the X-ray spectra the X-ray fluorescence of the bulk iridium was always observed causing peaks at, e.g., 63.3 keV and 64.9 keV (K and K, respectively). The X-ray fluorescence was induced by long-lived parasitic activities like 57Co, which were always procured on the trace impurities in the targets. This kind of fluorescence was not observed in previous thin target measurements [27, 28] because in those cases less parasitic activity was produced by the fewer impurity atoms and there was also less material on which the fluorescence could be induced. The K X-ray from the reaction product at 65.1 keV is buried under the fluorescence peak but thanks to the excellent energy resolution of the LEPS detector the K X-ray at 66.8 keV can be separated from the much more intense fluorescence peak. Even when the separation was excellent, the florescence was the main limiting factor of the activity determination (see fig. 2).
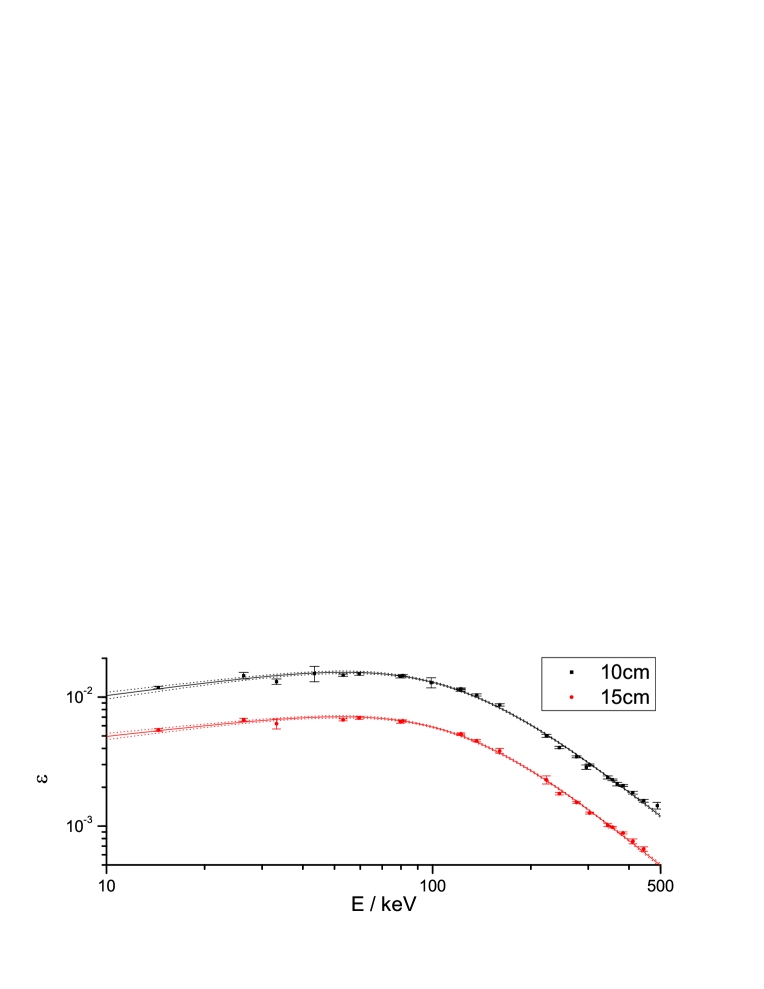
The detector efficiency calibration was done with sources of known activity at end-cap to target distances of 10 cm and 15 cm to avoid true coincidence-summing effects. The obtained efficiency points were fitted with an exponential function [39] as shown in fig. 3. At each energy the 1 confidence interval of the fit was used for the efficiency uncertainty. The efficiency at the actual counting distance (3 cm) was determined with the help of several targets which were counted both in 10 cm and 3 cm geometry. From the observed count rates, knowing the half-lives of the products and the time difference of the countings, the efficiency conversion factors were derived. This factor contains the possible loss due to the true coincidence-summing in close geometry. The conversion factors measured with the different sources were consistent. Therefore their statistically weighted average was used in the close-geometry efficiency determination. The close-geometry efficiency uncertainty contains the uncertainty of the fit and the uncertainty of the conversion factors and thus ranges from 1.5 % to 8 %. The latter value is for the two lines for the metastable state, where the statistical uncertainty in the efficiency ratio measurement dominated.
Similar efficiency conversion factors were derived for the 10 cm to 1 cm and 15 cm to 1 cm counting geometries for the X-ray peak and peak several months after the 17 MeV irradiations when only the 195Au reaction product was present in the target. Only this source was strong enough for this method, because of the sizeable 195Au isotope production via the 193Ir(,n)195Au reaction. The 1 cm efficiency was than calculated from both the 10 cm and 15 cm calibration curves and the weighted average of them was used in the analysis. The final efficiency uncertainty in 1 cm counting distance was 3 %.
5 Analysis and experimental results
Thick target yield
The peaks were fitted by a Gaussian while a linear background was assumed under the peaks. The detected counts () are related to the counting and irradiation parameters as follows,
| (4) |
where is the absolute detection efficiency, is the relative intensity of the investigated transition, is the incident particle flux in the th one minute time window () of the multichannel scaler, is the decay constant of the given reaction product, , and are length of the irradiation, the waiting time between the end of the irradiation and the beginning of the counting, and the duration of the counting, respectively. The spectra were stored on a 1 h time basis to follow the decay of the reaction products and check the stability of the counting system. The half-lives of the reaction products were found to be consistent with their literature values. Therefore the spectra were summed up to reduce the statistical uncertainty.
Since thick targets were used and activity is created in the bulk of the target, the attenuation of the exiting radiation had to be taken into account. To estimate this effect the target was estimated to be built up from 0.01 m thick slices. The attenuation of the radiation from each slice was calculated using the known attenuation coefficient of iridium [40] and averaged weighted by an estimated activity distribution. For the calculation of the activity distribution the actual beam energy in each slice was calculated using SRIM [37] and considered to be constant within the slice. For each slice cross sections from the NON-SMOKER calculations [41] were used as the first estimate. Later, the activity distribution was iteratively re-calculated using the obtained final cross sections. Note that for the estimation only the energy dependence of the cross section is important and its absolute scale plays no role in the activity distribution determination. With higher beam energy the highest attenuation is experienced since the tail of the activity distribution penetrates deeper into the sample. The attenuation of the rays with energies higher than 200 keV was less than 0.1%, for the rays with energy 188 keV and 149 keV was less than 0.5% and 0.9%, respectively. The highest attenuation of about 5% is experienced by the 98.9 keV ray. As conservative estimate, 30% relative uncertainty was assigned to the attenuation.
| Eα / MeV | 191Ir(,n)194Au | 191Ir(,)195Au | 193Ir(,n)196mAu | 193Ir(,n)196Au |
|---|---|---|---|---|
| 17.00 0.05 | 13200 500 | 310 20 | 21100 900 | |
| 16.50 0.05 | 6600 200 | 146 10 | 11000 500 | |
| 16.00 0.05 | 2240 80 | 10.9 0.6 | 42 2 | 3670 160 |
| 15.50 0.05 | 770 30 | 3.4 0.2 | 13.1 0.9 | 1310 60 |
| 15.00 0.05 | 243 8 | 1.53 0.19 | 3.4 0.3 | 410 18 |
| 14.50 0.04 | 77 3 | 0.76 0.05 | 0.96 0.13 | 136 6 |
| 14.00 0.04 | 12.4 0.5 | 0.24 0.04 | 0.21 | 20.7 1.0 |
| 13.40 0.04 | 4.9 0.2 | 0.47 | 0.16 | 7.0 0.4 |
Thick target yields for each (,n) reaction channel were determined from more than one peak and consistent results were found. In case of the 191Ir(,)195Au reaction the above 15.5 MeV were determined both from the detected X-rays and rays. Again, consistent results within their statistical uncertainty were found. Below 15.5 MeV the peak was not visible, thus only the X-ray was used for the determination.
The obtained from the different transitions were averaged using their statistical weight, which is the combination of the uncertainty of the fitted peak area, the uncertainty of the relative intensity of the given peak, the efficiency uncertainty, and the uncertainty of the attenuation. After the averaging, the uncertainty of the absolute intensity per decay and the beam current uncertainty (3 %) were quadratically added. The obtained are shown in table 2.
Above 16.01 MeV, the 193Ir(,2n)195Au reaction channel is open, producing the same isotope as 191Ir(,)195Au. Therefore, no thick target yields were determined for the radiative capture at 16.5 MeV and 17 MeV.
Cross sections
An average cross section between two energies was derived from the thick target yield using eq. (2). The differentiation of the has been done for each transition using the statistical error only. After that the relative uncertainty of the intensity of the given peak, detection efficiency and attenuation was quadratically added to the relative uncertainty of the derived cross sections. The consistent cross section values were then averaged using these uncertainties. Finally, the uncertainty of the absolute intensity per decay, the beam current, and the stopping power uncertainty (4 %) were quadratically added to the relative uncertainty of the averaged value.
For the effective energy determination, an exponential curve was fitted to the measured yield points. The quoted effective energy was calculated by eq. (3). The energy error contains the beam energy uncertainty of 0.3 % and an additional 0.5 % uncertainty, which accounts for the considered energy dependence and fit uncertainty of the yield. The derived cross sections are shown in table 3 and in the figures later.
| E / MeV 191Ir(,n)194Au 191Ir(,)195Au 16.47 0.10 1420 75 – 15.98 0.10 956 50 – 15.49 0.09 329 17 1.69 0.14 15.00 0.09 119 6 0.46 0.07 14.51 0.09 39.0 2.1 0.19 0.05 14.02 0.08 15.3 0.8 0.08 0.02 13.50 0.08 1.50 0.09 0.05 | E / MeV 193Ir(,n)196mAu 193Ir(,n)196Au 16.48 0.10 20.4 1.7 1295 76 15.99 0.10 13.4 1.1 952 56 15.50 0.09 3.9 0.3 313 18 15.01 0.09 1.33 0.12 121 7 14.52 0.09 0.34 0.04 37.8 2.3 14.03 0.08 0.12 0.03 16.3 1.0 13.51 0.08 0.02 1.64 0.10 |
6 Discussion
The experimental data have been compared with statistical-model calculations performed with the SMARAGD code [42].
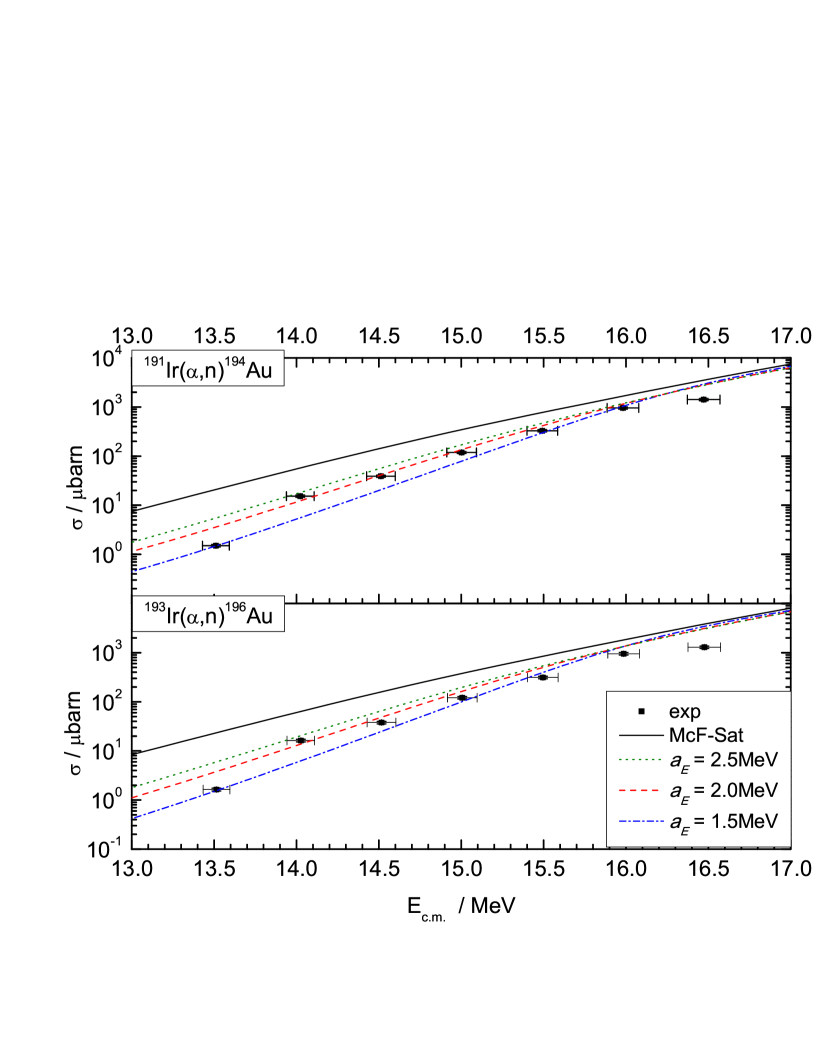
The (,n) cross sections are solely sensitive to the -channel width [17]. As can be seen in fig. 4, the standard McFadden-Satchler potential [18] does not reproduce well the measured data. A good reproduction is found when using the modified energy-dependent potential of [19]. In this approach the energy-dependent depth of the imaginary part is given by
| (5) |
where is the height of the Coulomb barrier. Choosing MeV gives the best description of the present experimental data.
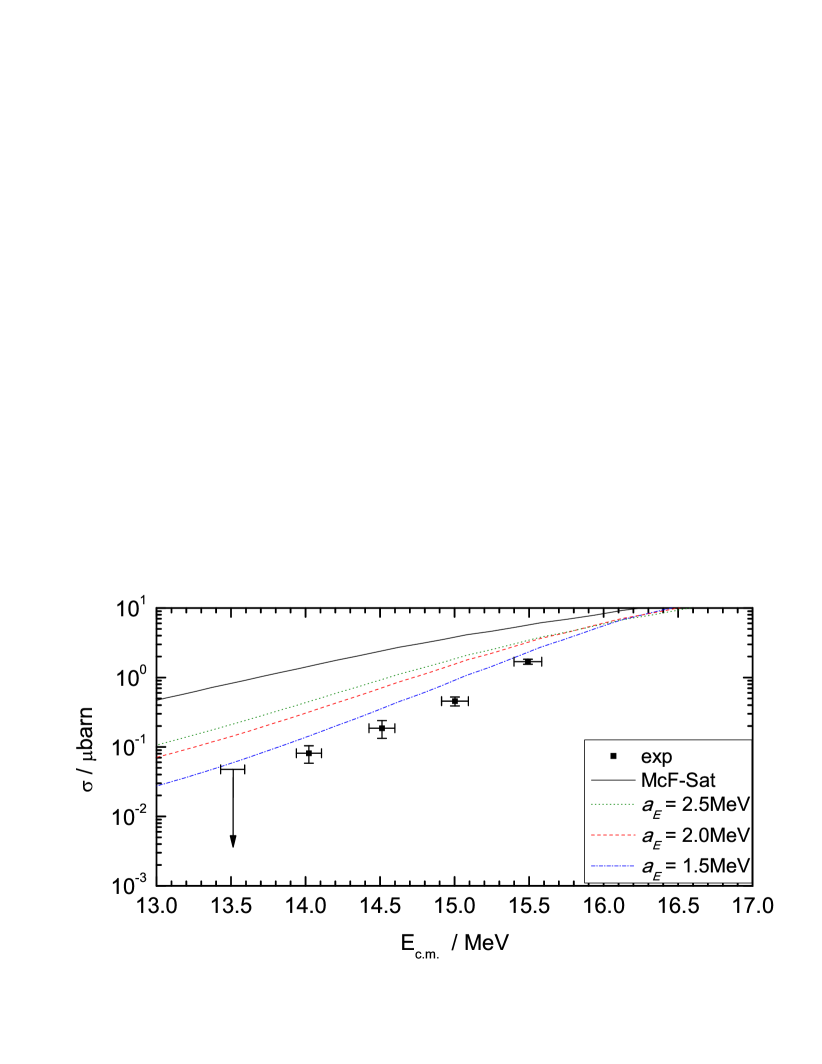
Using the same -channel width for calculating the (,) cross section the model overestimates the experimental data (see fig. 5). In this reaction channel, the calculated cross sections above the (,n) threshold are equally sensitive to the -, neutron-, and -widths. Since the width has been determined by the (,n) reaction, the poor reproduction has to be ascribed to the neutron- and/or -widths. These, on the other hand, do not play a role to determine the astrophysical reaction rates involving particles in the process.
7 Summary
Thick target yields of -induced reactions on iridium of natural isotopic composition were measured in the energy range of MeV and 17 MeV with the activation method. The combination of X-ray detection with thick target yield measurements has been performed in this mass region for the first time, allowing to measure the reaction cross sections at lower energies than ever before. From the measured thick target yields, reaction cross sections were derived and compared with statistical model calculations. The results show that the recently suggested energy-dependent modification of the widely used McFadden-Satchler +nucleus optical potential gives a good description of the experimental data. The - and neutron widths above the (,n) threshold cannot be further constrained by the present data but are not relevant for the astrophysical process.
Acknowledgement
This work was supported by NKFIH (K108459, K120666) and the EU COST Action CA16117 (ChETEC).
References
- Burbidge et al. [1957] E. M. Burbidge, G. R. Burbidge, W. A. Fowler, F. Hoyle, Rev. Mod. Phys. 29 (1957) 547–650.
- Käppeler et al. [2011] F. Käppeler, R. Gallino, S. Bisterzo, W. Aoki, Rev. Mod. Phys. 83 (2011) 157–193.
- Arnould et al. [2007] M. Arnould, S. Goriely, K. Takahashi, Phys. Rep. 450 (2007) 97–213.
- Thielemann et al. [2017] F.-K. Thielemann, M. Eichler, I. Panov, B. Wehmeyer, Annu. Rev. Nucl. Part. Sci. 67 (2017) 253–274.
- Rauscher et al. [2013] T. Rauscher, et al., Rep. Prog. Phys. 76 (2013) 066201.
- Travaglio et al. [2011] C. Travaglio, F. K. Röpke, R. Gallino, W. Hillebrandt, Astrophys. J. 739 (2011) 93.
- Travaglio et al. [2015] C. Travaglio, et al., Astrophys. J. 799 (2015) 54.
- Rauscher et al. [2016] T. Rauscher, et al., Mon. Not. R. Astron. Soc. 463 (2016) 4153.
- Hauser and Feshbach [1952] W. Hauser, H. Feshbach, Phys. Rev. 87 (1952) 366–373.
- Arnould and Goriely [2003] M. Arnould, S. Goriely, Phys. Rep. 384 (2003) 1–84.
- Mohr et al. [2007] P. Mohr, Z. Fülöp, H. Utsunomiya, Eur. Phys. J. A 32 (2007) 357–369.
- Kiss et al. [2008] G. G. Kiss, et al., Phys. Rev. Lett. 101 (2008) 191101.
- Rauscher et al. [2009] T. Rauscher, et al., Phys. Rev. C 80 (2009) 035801.
- Rauscher [2011] T. Rauscher, Int. J Mod. Phys. E 20 (2011) 1071–1169.
- Szücs et al. [2014] T. Szücs, I. Dillmann, R. Plag, Z. Fülöp, Nucl. Data Sheets 120 (2014) 191–193. http://www.kadonis.org/pprocess.
- Rauscher [2010] T. Rauscher, Phys. Rev. C 81 (2010) 045807.
- Rauscher [2012] T. Rauscher, Astrophys. Jour. Suppl. Ser. 201 (2012) 26.
- McFadden and Satchler [1966] L. McFadden, G. Satchler, Nuclear Physics 84 (1966) 177–200.
- Sauerwein et al. [2011] A. Sauerwein, et al., Phys. Rev. C 84 (2011) 045808.
- Kiss et al. [2014] G. G. Kiss, et al., Phys. Lett. B 735 (2014) 40–44.
- Kiss et al. [2015] G. G. Kiss, et al., J. Phys. G: Nucl. Part. Phys. 42 (2015) 055103.
- Avrigeanu and Avrigeanu [2010] M. Avrigeanu, V. Avrigeanu, Phys. Rev. C 82 (2010) 014606.
- Demetriou et al. [2002] P. Demetriou, C. Grama, S. Goriely, Nucl. Phys. A 707 (2002) 253–276.
- Mohr et al. [2013] P. Mohr, et al., At. Data Nucl. Data Tables 99 (2013) 651–679.
- Gyürky et al. [2014] Gy. Gyürky, et al., Nucl. Phys. A 922 (2014) 112–125.
- Fiebiger et al. [2017] S. Fiebiger, et al., J. Phys. G: Nucl. Part. Phys. 44 (2017) 075101.
- Kiss et al. [2011] G. G. Kiss, et al., Phys. Lett. B 695 (2011) 419–423.
- Kiss et al. [2012] G. G. Kiss, et al., Phys. Rev. C 86 (2012) 035801.
- Singh [2006] B. Singh, Nuclear Data Sheets 107 (2006) 1531–1746.
- Huang and Kang [2014] X. Huang, M. Kang, Nuclear Data Sheets 121 (2014) 395–560.
- Xiaolong [2007] H. Xiaolong, Nuclear Data Sheets 108 (2007) 1093–1286.
- Bhardwaj et al. [1992] M. K. Bhardwaj, I. A. Rizvi, A. K. Chaubey, Phys. Rev. C 45 (1992) 2338–2342.
- Ismail [1998] M. Ismail, Pramana 50 (1998) 173–189.
- Gavriluk et al. [1989] V. Gavriluk, V. Zheltonojskij, V. Stepanenko, V. Kharlamov, 39.Conf. Nucl. Spectrosc. and Nucl. Struct.,Tashkent, p. 374.
- Denisov et al. [1993] V. Denisov, V. Zheltonozhskii, S. Reshit’ko, Phys. At. Nucl. 56 (1993) 57.
- Chuvilskaya et al. [1999] T. V. Chuvilskaya, Y. G. Seleznev, A. A. Shirokova, M. Herman, Bull. Rus. Acad. Sci. Phys. 63 (1999) 825.
- Ziegler et al. [2010] J. F. Ziegler, M. Ziegler, J. Biersack, Nucl. Instrum. Methods Phys. Res., Sect. B 268 (2010) 1818–1823. http://www.srim.org.
- Szücs et al. [2014] T. Szücs, G. G. Kiss, Z. Fülöp, AIP Conf. Proc. 1595 (2014) 173.
- McFarland [1991] R. C. McFarland, Radioactivity & Radiochemistry 2 (1991) 35.
- Hubbell and Seltzer [2004] J. Hubbell, S. Seltzer, Tables of X-Ray Mass Attenuation Coefficients and Mass Energy-Absorption Coefficients (version 1.4), 2004. Avaliable: http://physics.nist.gov/xaamdi, National Institute of Standards and Technology, Gaithersburg, MD.
- Rauscher and Thielemann [2001] T. Rauscher, F.-K. Thielemann, Atomic Data and Nuclear Data Tables 79 (2001) 47–64.
- Rauscher [2012] T. Rauscher, Code SMARAGD, 2012. Version 0.9.2s.