Wisdom of the crowd from unsupervised dimension reduction
Lingfei Wang***Corresponding author. Email: Lingfei.Wang@roslin.ed.ac.uk and Tom Michoel
Division of Genetics and Genomics, The Roslin Institute, The University of Edinburgh, Easter Bush, Midlothian EH25 9RG, UK
Abstract
Wisdom of the crowd, the collective intelligence derived from responses of multiple human or machine individuals to the same questions, can be more accurate than each individual, and improve social decision-making and prediction accuracy ([1, 2, 3, 4, 5]). This can also integrate multiple programs or datasets, each as an individual, for the same predictive questions. Crowd wisdom estimates each individual’s independent error level arising from their limited knowledge, and finds the crowd consensus that minimizes the overall error. However, previous studies have merely built isolated, problem-specific models with limited generalizability, and mainly for binary (yes/no) responses. Here we show with simulation and real-world data that the crowd wisdom problem is analogous to one-dimensional unsupervised dimension reduction in machine learning. This provides a natural class of crowd wisdom solutions, such as principal component analysis and Isomap, which can handle binary and also continuous responses, like confidence levels, and consequently can be more accurate than existing solutions. They can even outperform supervised-learning-based collective intelligence that is calibrated on historical performance of individuals, e.g. penalized linear regression and random forest. This study unifies crowd wisdom and unsupervised dimension reduction, and thereupon introduces a broad range of highly-performing and widely-applicable crowd wisdom methods. As the costs for data acquisition and processing rapidly decrease, this study will promote and guide crowd wisdom applications in the social and natural sciences, including data fusion ([6]), meta-analysis ([5]), crowd-sourcing ([3, 7]), and committee decision making ([2, 8]).
Results
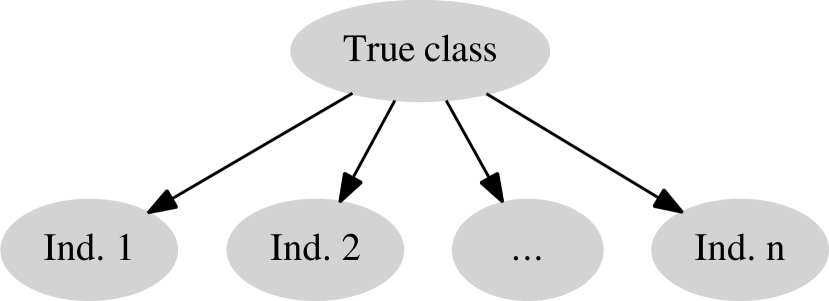
Although wisdom of the crowd and its philosophy have been discovered and rediscovered in a wide range of sociological and statistical contexts, most studies rely on the fundamental assumption that each individual is an independent estimator of the ground-truth, possessing their knowledge as the signal and bias as the error (Figure 1A). As long as the group or ensemble of individuals remain unbiased as a whole, aggregating individual estimators for the same predictive variables would still strengthen the signal and cancel out their errors. This can be regarded as a more complex version of averaging multiple measurements of the same variable.
| A |
|
B |
|
| C |
|
D |
|
E |
|
However, previous crowd wisdom classification studies have focused predominantly on binary responses and problem-specific models ([9, 7, 4, 10]). The confusion matrices of individuals and the binary true classes are fit in turn to maximize the model’s likelihood with expectation-maximization. Where available, continuous individual predictions such as confidence levels are thresholded and mostly lost, potentially limiting the classification accuracy and generalizability, whilst the proper choice of threshold can also be difficult.
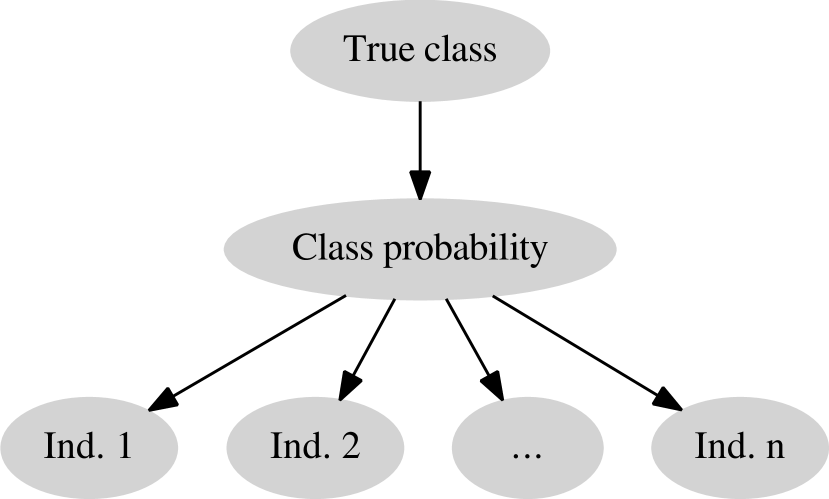
To resolve this issue and to link crowd wisdom with machine learning, we consider continuous rather than binary variables for individual responses. Due to a lack of complete information to perfectly determine the true class, we introduce an unknown intermediate layer representing the probability of the true class (class probability, Figure 1B). In the simplest scenario, individual responses are then independent continuous estimations of the class probability. More generally, individuals can also characterize and estimate classification confidence with any other continuous scores, which are assumed to be equivalent in ranking with the class probability. Binary responses can also be treated as numerical 0s and 1s.
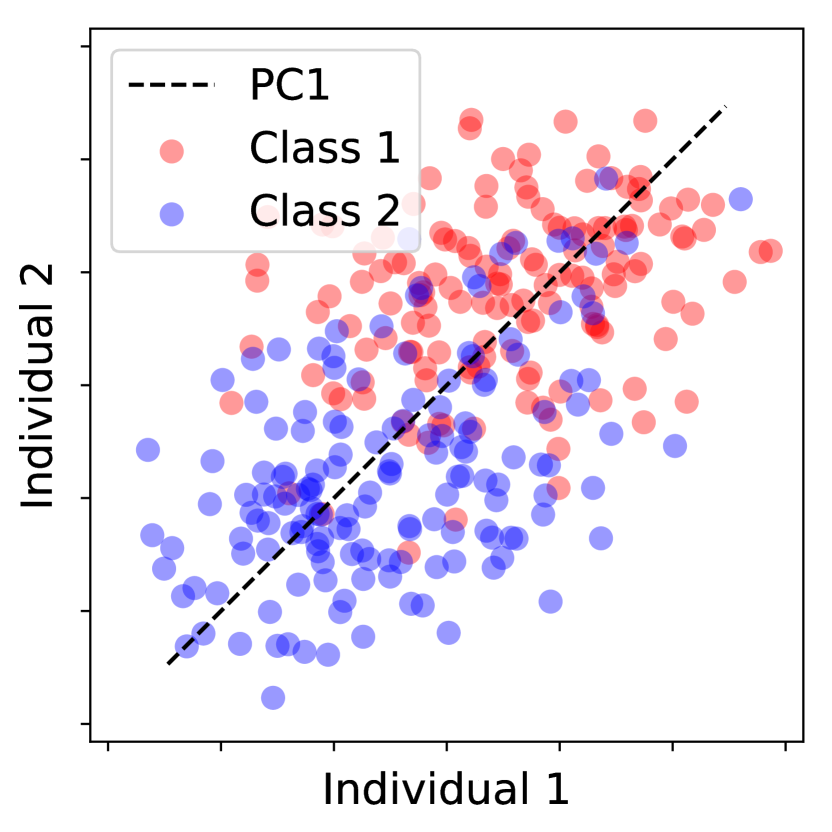
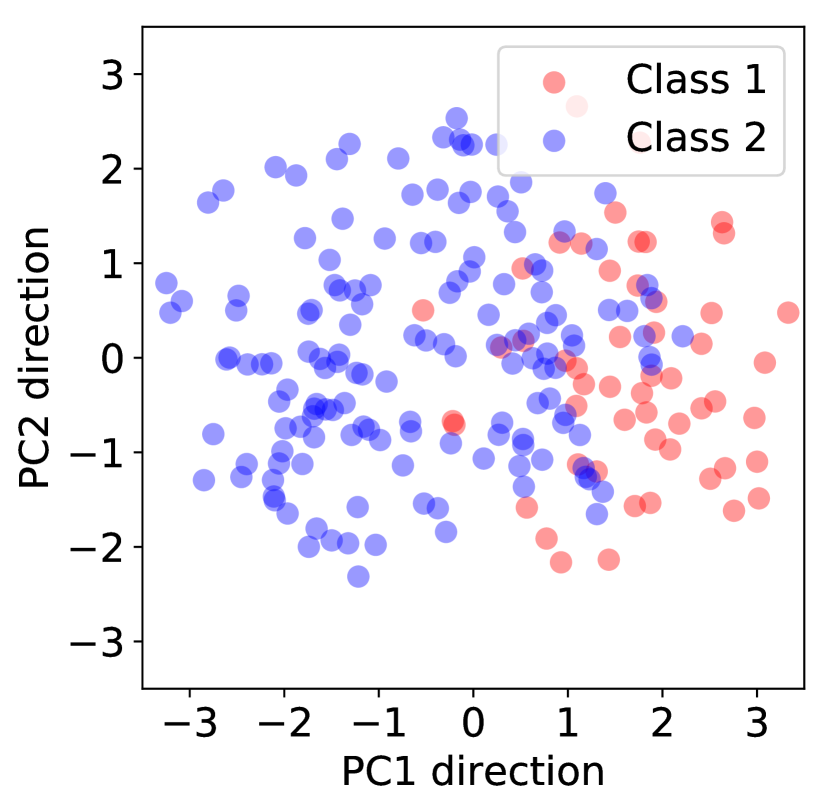
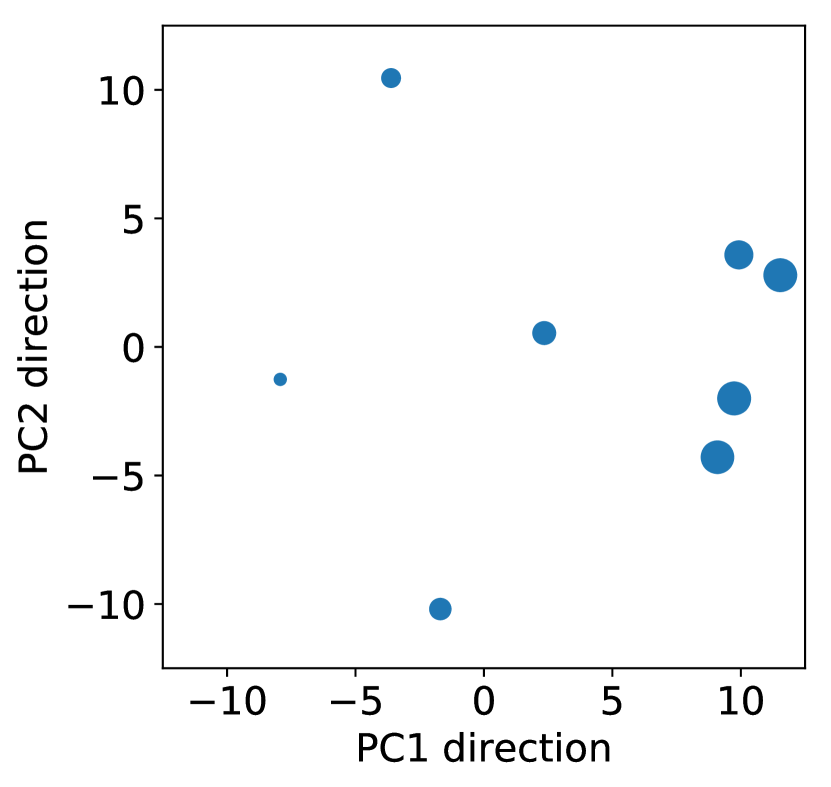
The continuous crowd wisdom classification problem can then be solved by unsupervised dimension reduction. Unsupervised dimension reduction infers the latent lower dimensions by which the input data are assumed to be parameterized. In crowd wisdom (Figure 1B), each individual independently estimates, and is effectively parameterized by, the class probability alone. Therefore, the class probability may be recovered as the first and only dimension (Figure 1C, subjecting to a monotonic transformation). This makes dimension reduction the natural crowd wisdom for classification problems with continuous information. Which dimension reduction method is the best then depends on various aspects of the problem, such as nonlinearity. As a brief demonstration with the DREAM2 BCL6 Transcription Factor Prediction challenge dataset, containing the confidence scores of 200 genes as potential targets of BCL6 (i.e. questions) submitted by 8 teams (i.e. individuals) ([11, 12, 13]), the first principal component (PC1) direction of the gene-by-individual matrix gave an accurate representation of the class probability ranking (Figure 1D) and the performance of each individual (Figure 1E).
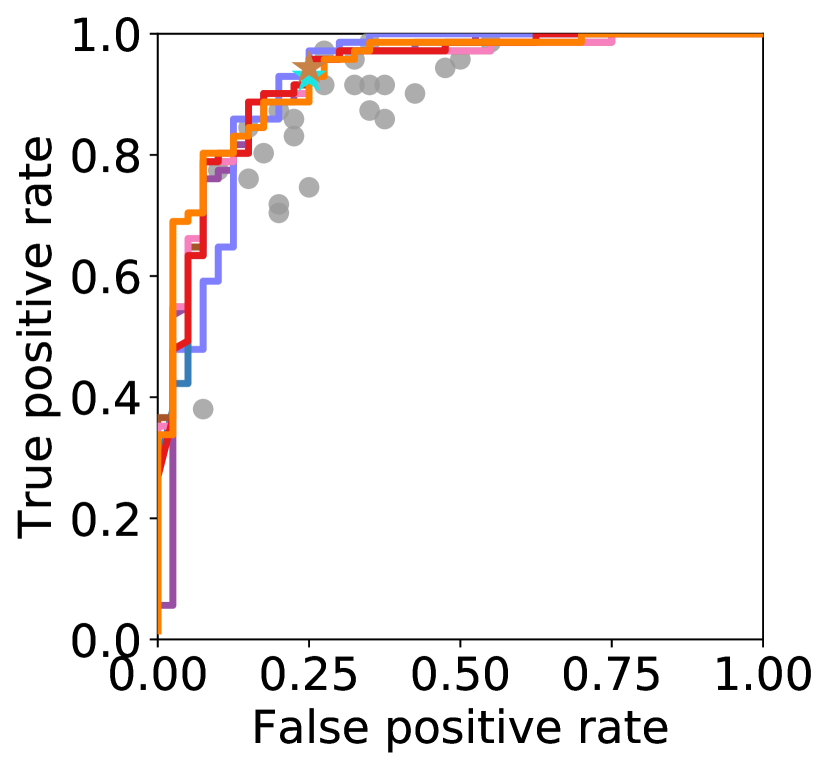
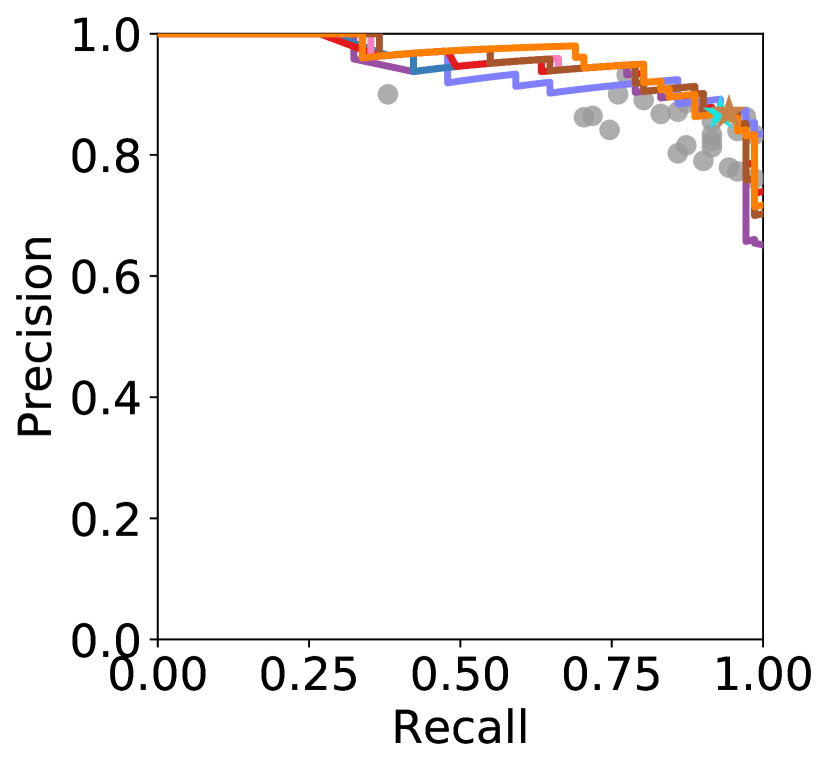
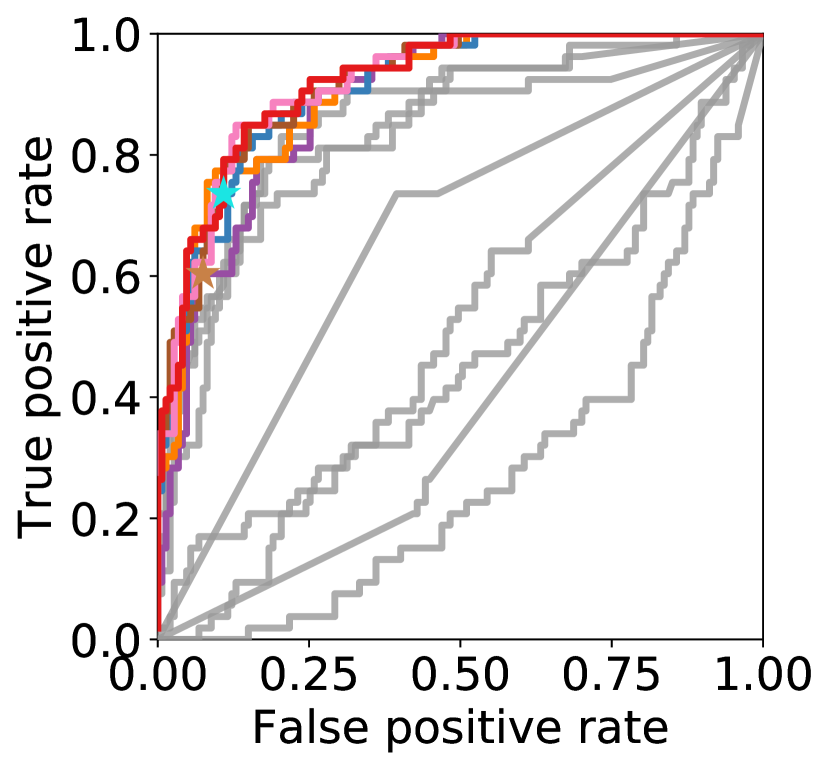
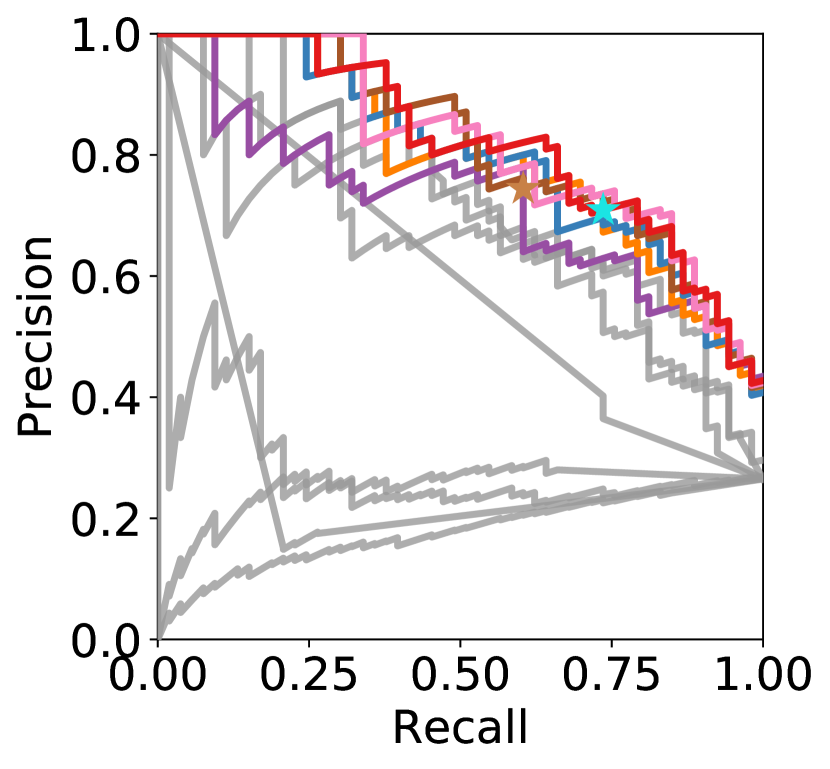
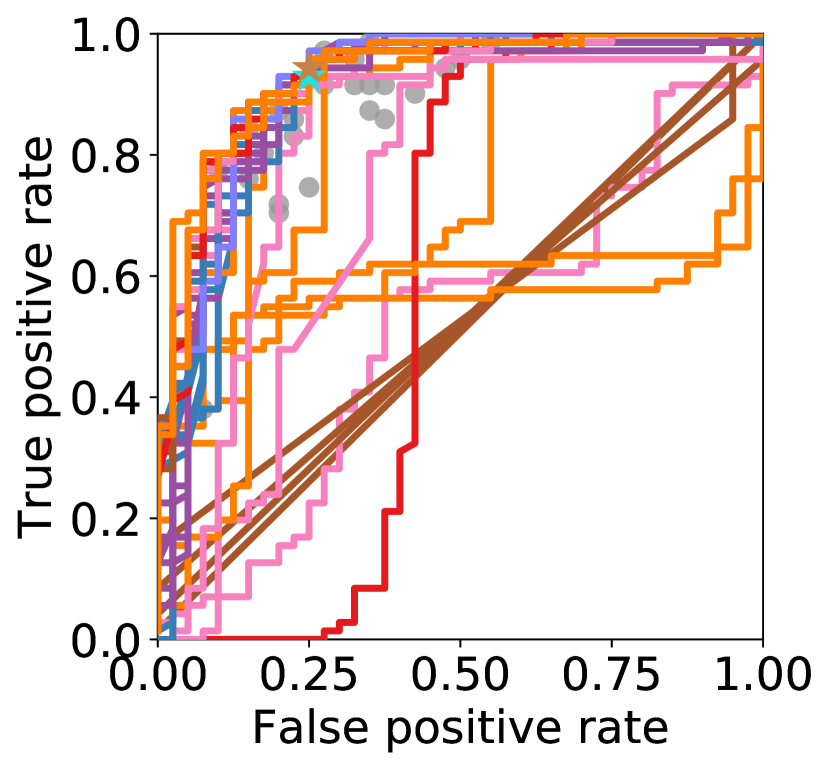
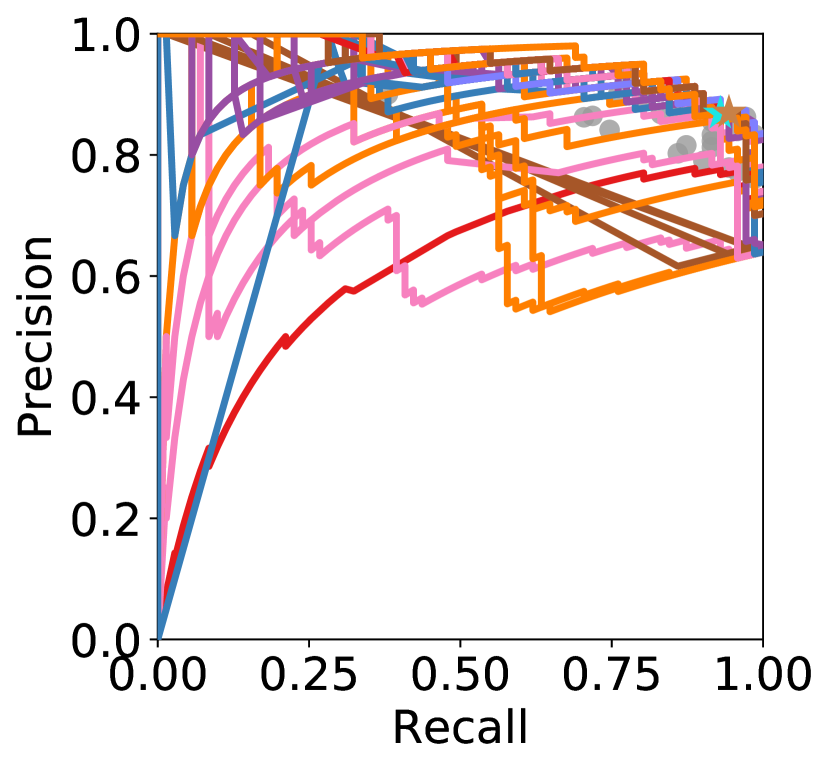
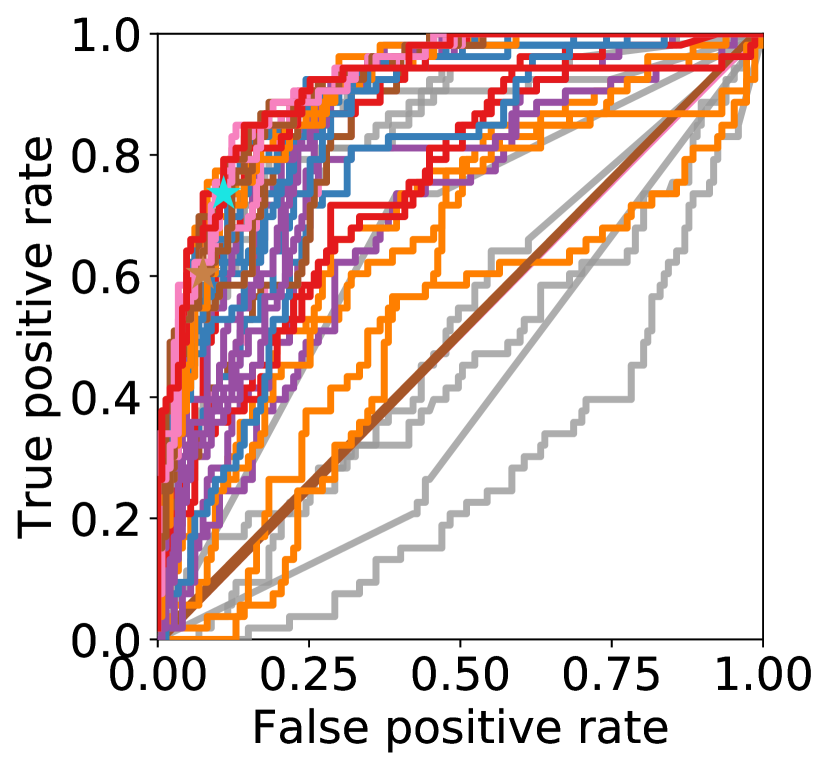
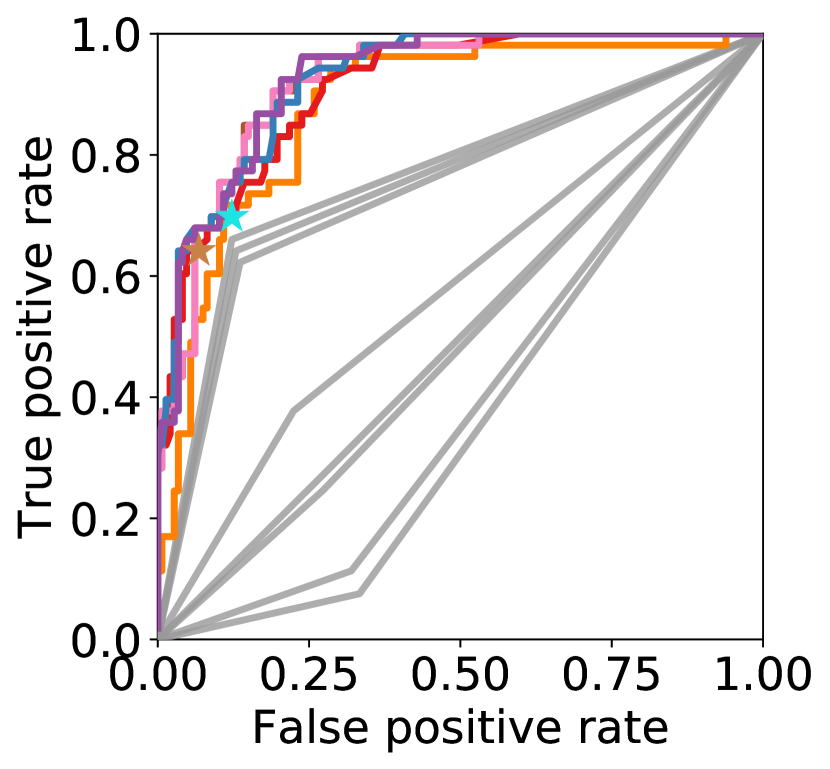
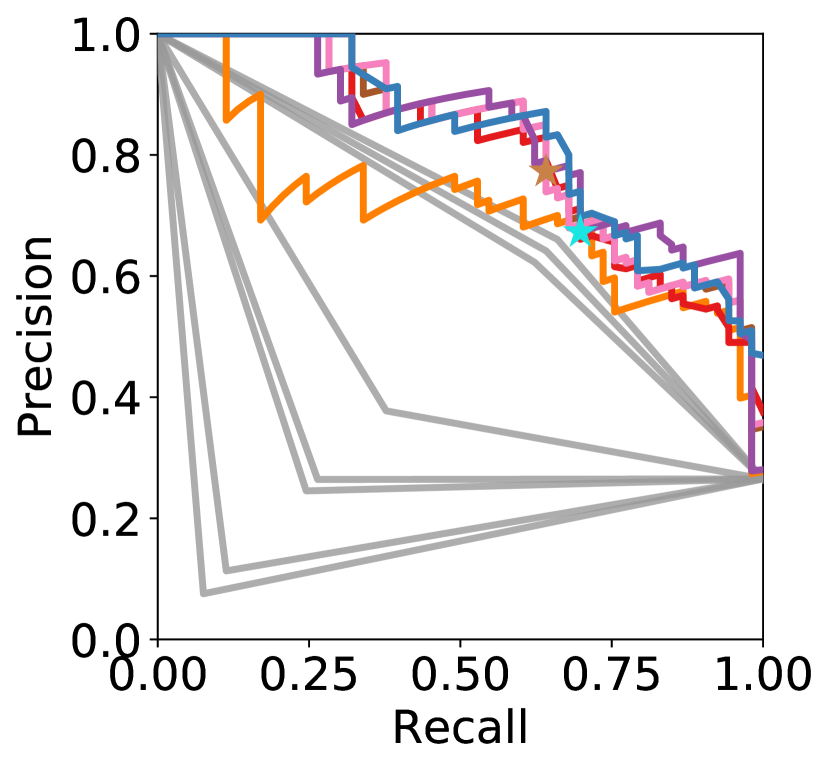
To first evaluate dimension reduction methods on binary responses, we envisioned an algorithm-assisted diagnostic committee of 24 dermatologists whose skin cancer classifications are known for 111 dermoscopy images ([14]). As a comparison, we applied principal component analysis (PCA), factor analysis (FA), multi-dimensional scaling (MDS), locally linear embedding (LLE), Hessian LLE, local tangent space alignment (LTSA), Isomap, and spectral embedding to estimate the class probability ranking from the individual classifications (Methods). PCA and FA were superior to most dermatologists and were among the top crowd wisdoms. Nearest neighbor based methods were not significantly more accurate than PCA, but instead converged towards PCA at large numbers of neighbors, suggesting no significant nonlinearity (Figure 2E). PCA and FA offered continuous confidence levels which reduced to state-of-the-art binary crowd wisdom solutions from SML ([4]) and CUBAM ([15]) at certain thresholds (Figure 2AB, Figure S1AB). Interestingly, more than 15 crowd wisdoms had better classification performance than a deep neural network trained on 130k clinical images (Figure 2ABE, Table S1, [14]). This demonstrates the cutting-edge efficacy from dimension reduction on the binary crowd wisdom task.
| A |
|
B |
|
|
| C |
|
D |
|
Non-parametric: Mean Median Factor analysis MDS PCA |
| E |
|
F |
|
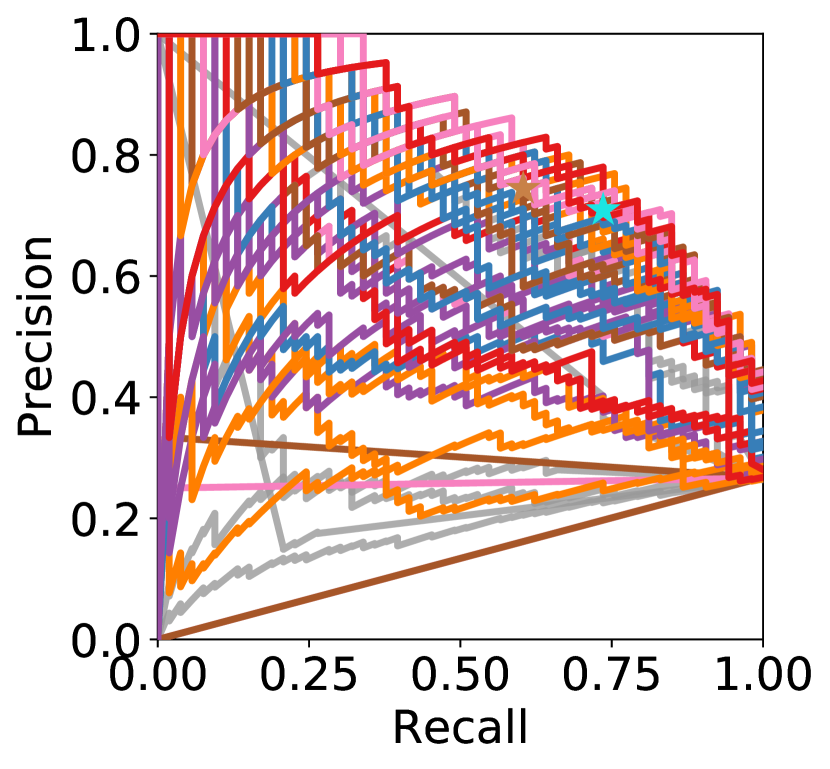
To test whether continuous confidence information can improve accuracy, we applied the same dimension reduction methods on the DREAM2 dataset, as well as on their perfectly binarized yes/no responses (Methods). PCA on continuous confidence levels was more accurate than SML and CUBAM on binarized responses (Figure 2CD, Figure S2). Performance differences between crowd wisdoms were in agreement with the skin cancer classification data, except that mean and median — often the default crowd wisdom method for continuous data ([3]) — could not account for worse-than-random individuals (Figure 2CDF, Figure S1CD, Figure S3). Many dimension reduction methods, including PCA and Isomap, outperformed every team. Dimension reduction provided reliable and superior crowd wisdom from confidence information without knowing the true class distribution.
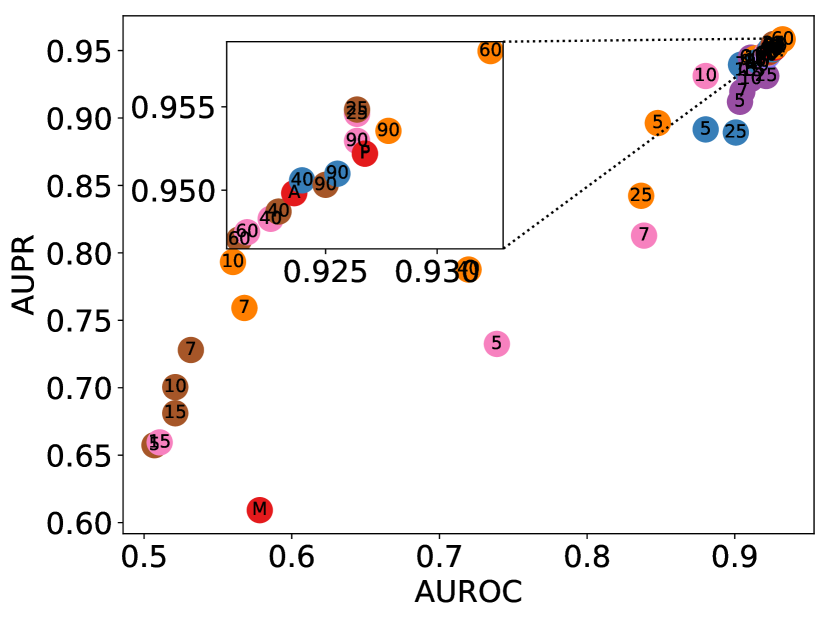
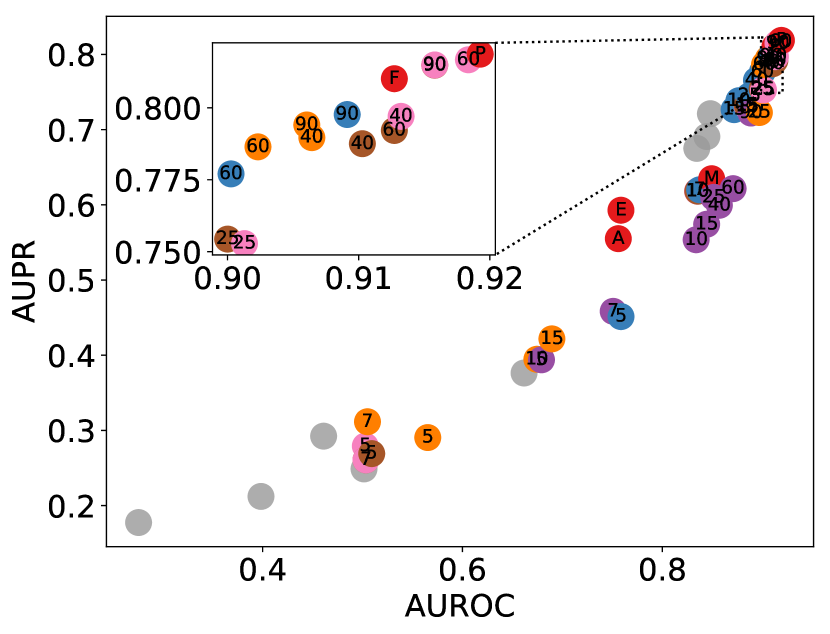
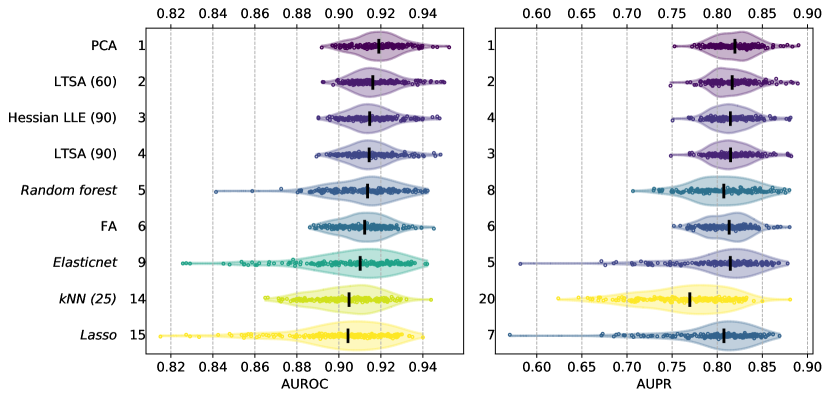
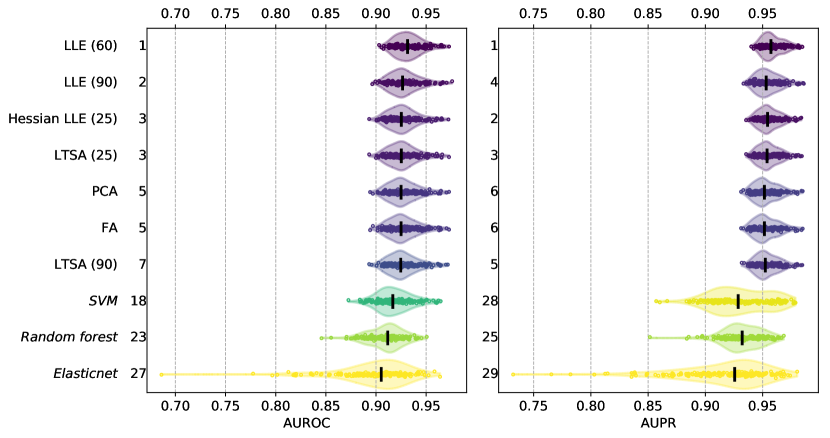
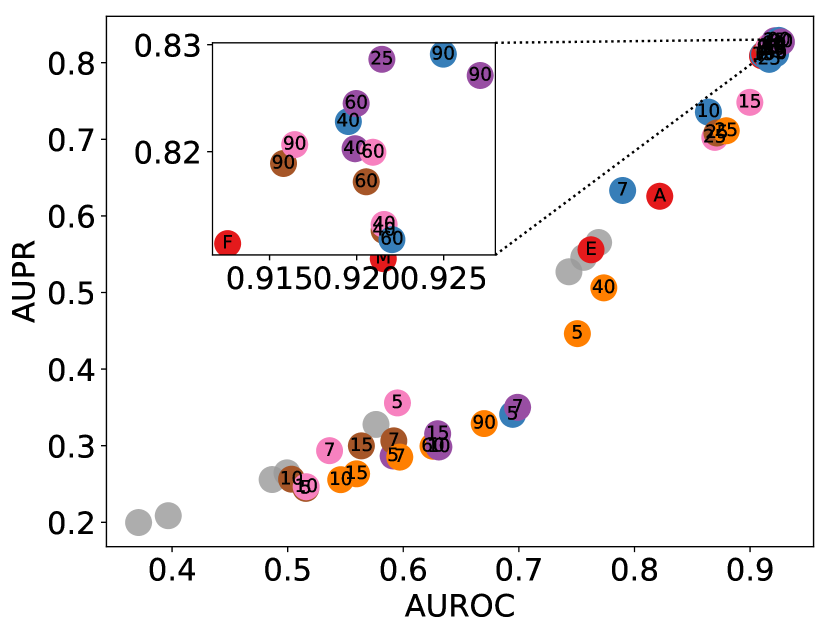
Knowledge of the ground-truth for a subset of questions may help calibrating response aggregations for the remaining questions. For instance, in daily life we trust people and favor programs that were more accurate historically. To compare calibrated response aggregations against ground-truth-ignorant crowd wisdoms, we cross-validated crowd wisdoms and 8 popular supervised classifiers [including linear, logistic, lasso, and elasticnet regression, linear discriminant analysis (LDA), support vector machine (SVM), kNN, and random forest] that were trained on randomly selected question subsets (Methods). Surprisingly, crowd wisdom had equal or better performance than supervised classifiers for both the DREAM2 and the skin cancer datasets in terms of AUROC and AUPR (Figure 3, Figure S4, Figure S5). Supervised classifiers could only reach crowd wisdom’s performance with 50% of training data or more (Figure S4, Figure S5). Considering that the true answers in practical research questions are largely unknown, unsupervised crowd wisdom outperformed supervised learning by integrating the test dataset to better estimate individual accuracies.
| A |
|
| B |
|
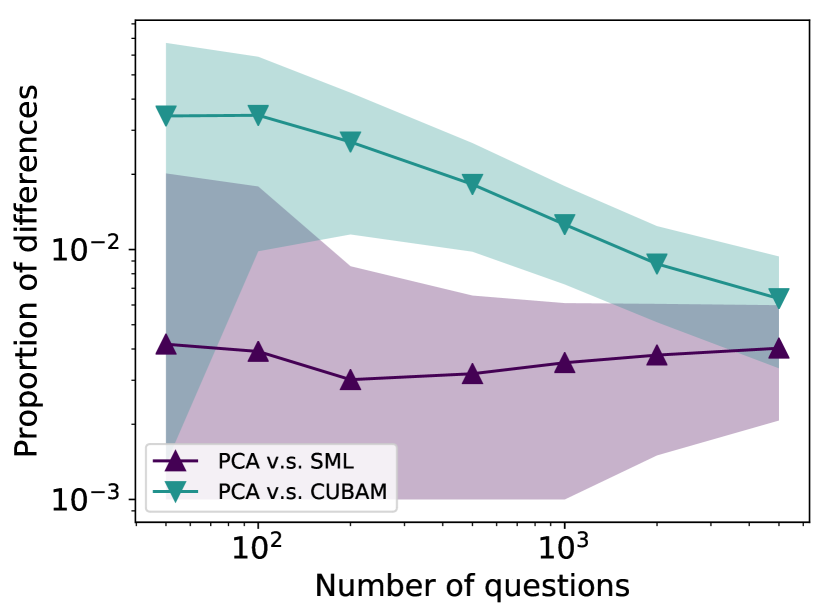
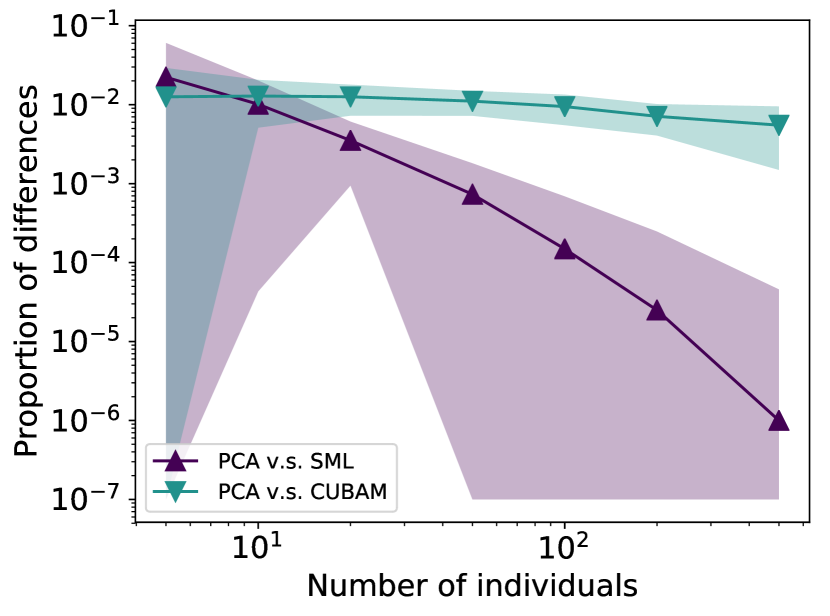
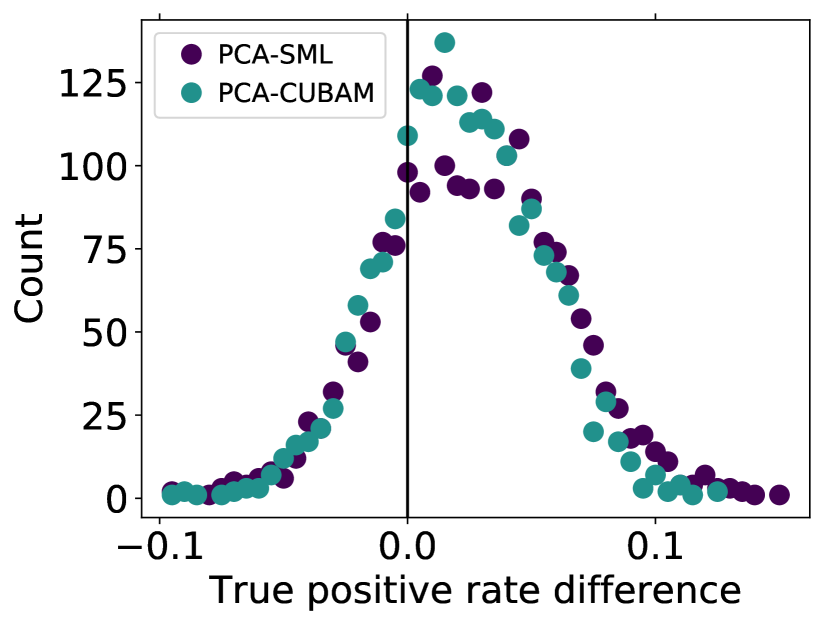
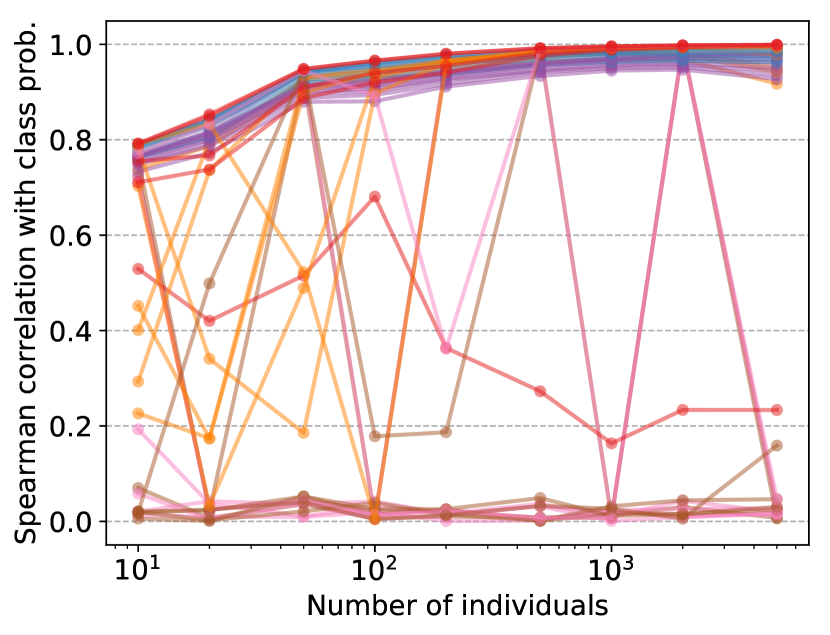
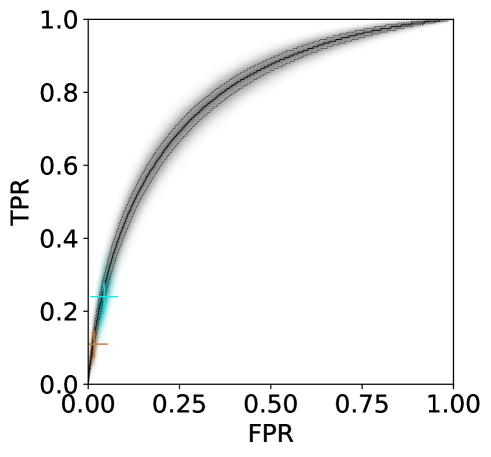
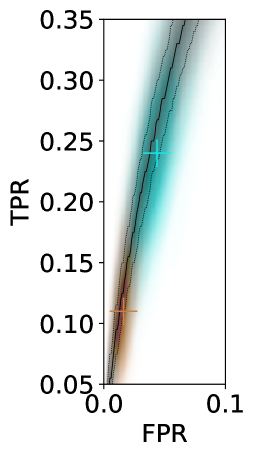
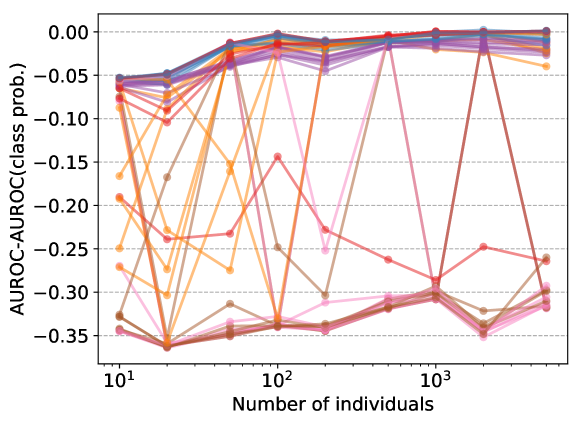
We further interrogated crowd wisdoms in controlled simulations. With 2000 replicated simulations for each parameter set, we found SML to highly correlate with and converge to thresholded PCA as the number of individuals increases (Figure 4AB, Methods). SML was consequently less sensitive than PCA due to the loss of information, even in perfect binarizations of confidence levels (Figure 4C, Student’s -tests , Figure S6, Methods). CUBAM was also less sensitive after binarization than PCA. In single simulations (Methods), PCA, FA, Isomap, and LLE converged to perfect class probability predictions as the number of individuals increased (Figure 4D, Figure S7, Figure S8B-I), but LLE based methods were unreliable on noisy datasets (Figure S8JK, [16]). Single simulations also reaffirmed our existing conclusions. PCA, FA, and Isomap continued to lead the performances (Figure S9, Figure S8) and crowd wisdom remained superior to supervised classifiers (Figure S9B, Figure S10). Mean and median were again hindered by worse-than-random individuals (Figure S9A, Figure S8). Overall, PCA and Isomap are more reliable and accurate than other dimension reduction methods and previous wisdom of the crowd methods.
| A |
|
B |
|
| C |
|
D |
|
|
By embedding wisdom of the crowd in unsupervised dimension reduction, we have found that PCA and Isomap are efficient, accurate, consistent, and generic algorithms. Unsupervised dimension reductions obtain superior performances over calibrated crowd wisdoms from supervised classifiers. This study does not consider datasets with missing values ([7]), strongly correlated errors between individuals ([17, 18]), or post-crowd-wisdom thresholding. Future research on these problems within the dimension reduction framework may further widen the applications of crowd wisdom.
Methods
DREAM2 BCL6 Transcription Factor Prediction challenge dataset
The DREAM2 BCL6 Transcription Factor Prediction Challenge is an open crowd challenge to infer BCL6 gene’s transcriptional targets ([11, 12, 13]). Participating teams inferred BCL6 targets from gene expression microarray and optional external data, and submited confidence scores for 200 potential target genes. Submissions were evaluated against the gold standard derived from ChIP-on-chip and perturbation experiments, containing 53 BCL6 targets. We had access to submissions from 11 teams, in which 8 were full (without missing predictions) and were used for crowd wisdom.
Skin cancer classification dataset
Deep neural networks outperformed an average dermatologist in the classification of skin cancer from dermoscopy images ([14]). Based on dermoscopy images alone, dermatologists were asked whether to biopsy/treat the lesion or to reassure the patient. We obtained 24 dermatologists’ responses to 111 biopsy-proven dermoscopy images in which 71 were malignant. We also obtained the predicted confidence scores for these images from the deep neural network in [14].
Simulated datasets
A simulated dataset of binary (yes/no) questions contains their true classes, the (posterior) class probabilities given all the relevant data for each question as , and the responses from individuals to all questions as matrix , for , . Given the desired occurrence frequency of class yes as , the dataset needs to contain questions in class yes and in class no. We simulated the true classes, class probabilities, and individual responses (Figure 1B) according to the following steps:
-
1.
Simulate class probabilities , where is the Beta distribution and characterizes the question difficulty given all the data. For each question, set the true class to yes with probability and no otherwise. Only the first questions in yes class and the first questions in no class were retained, merged, and shuffled to form the full list of questions . Their class probability and true classes were recorded.
-
2.
Simulate individual responses . Individual ’s response to question is , where .
-
3.
Normalization was applied (cf below).
The simulation takes 6 parameters: , , , , , and . See Table S2 for parameter values.
Perfect binarization
To transform confidence level responses to binary (yes/no) responses, we chose the ideal scenario for existing binary crowd wisdom methods, by assuming that each individual knows the true total number of yes responses. Consequently, each individual will select that same number of their most confident predictions as yes, and the rest as no. Ties at the yes/no boundary are selected at random.
Normalization
We normalized raw answers from multiple individuals to multiple questions before applying crowd wisdom or supervised learning (in cross validation). For continuous datasets, we first converted raw answers into rankings, separately for each individual and with ties averaged. Then, for all datasets, we shifted the raw or rank-converted values to zero mean and scaled them to unit variance, separately for each individual.
Dimension reduction as wisdom of the crowd
From the python package scikit-learn, we applied the following dimension reduction methods for crowd wisdom: TruncatedSVD (as PCA) and FactorAnalysis in sklearn.decomposition, and LocallyLinearEmbedding (with methods standard, hessian, and ltsa), Isomap, and SpectralEmbedding in sklearn.manifold. Nearest-neighbor based methods took 5, 7, 10, 15, 25, 40, 60, and 90 neighbors. We also included mean and median as simple statistics for crowd wisdom.
Evaluation metrics
We used the Receiver Operating Characteristic (ROC) and Precision-Recall curves, as well as their areas under the curves (AUROC and AUPR) as evaluation metrics. To tackle the sign indeterminacy from dimension reduction, we always computed these metrics twice, on the original output and on its negative, and selected the one with a larger area under the curve for comparison. For fair comparison, the same procedure was applied on supervised learning methods. In practice, sign indeterminancy can be solved by assuming more than half of the individuals have better-than-random responses, and then aligning crowd wisdom with the majority of the crowd.
Supervised classifiers
From the python package scikit-learn, we applied the following supervised classifiers: LinearRegression, ElasticNetCV, LassoCV, and LogisticRegression in sklearn.linear_model, LinearDiscriminantAnalysis in sklearn.discriminant_analysis, RandomForestClassifier in sklearn.ensemble, and KNeighborsClassifier in sklearn.neighbors with 5, 7, 10, 15, 25, 40, 60, and 90 neighbors.
Method comparison in cross validation
To compare crowd wisdom and supervised classifiers, we randomly split each dataset into a training set (containing 10, 20, 25, 40, 60, 80, or 90 percent of all samples) and a test set (for the rest), using sklearn.model_selection.StratifiedShuffleSplit and requiring the number of questions to be larger than that of individuals in the training set. Supervised classifiers were trained on individual predictions against ground-truths in the training set, and then predicted for the test set. For crowd wisdom, we performed crowd wisdom on the full data (not using ground-truth) and then extracted predictions for the test set. Evaluation metrics were computed for every random split. The random split was repeated 200 times per split ratio per dataset.
Method comparison on binarized data
With a given parameter set for simulation, we performed 2000 replicated simulations with different random seeds. For each replicate, the ROC curve for PCA and the FPR and TPR for SML and CUBAM were computed. The ROC quantiles were computed as the quantiles of TPR at every FPR level among the 2000 ROCs from replicates. The densities of SML and CUBAM points on ROC were computed with scipy.stats.gaussian_kde. The TPR difference between PCA and SML or CUBAM was computed at SML’s or CUBAM’s FPR in each replicate.
Proportion of differences between binary crowd wisdoms and PCA
Simulations 21, 22, 23, 19, 1, 20, 25 and 24, 3, 1, 4, 5, 6, 7 were used respectively for the comparisons of differences as the numbers of questions and individuals vary. Each simulation consists of 2000 replications with different random seeds. Within each replication, the binary crowd wisdom (SML or CUBAM) and PCA were first applied on the binary(/binarized) simulated data. Should the AUROC between PC1 of PCA and the binary crowd wisdom be , the signs of PC1 are inverted. PC1 is then thresholded so the largest entries are positive, in which is the number of positives from the binary crowd wisdom. The proportion of differences is the number of questions on which the thresholded PC1 and the binary crowd wisdom have different predictions, divided by the total number of questions. The mean and standard deviation were then computed across the 2000 replicates, after excluding the (rare) critical failures or single-valued outputs of the binary crowd wisdom.
Acknowledgements
LW would like to thank Gustavo Stolovitzky and Robert Vogel for providing the DREAM2 dataset, and Andre Esteva and Sebastian Thrun for providing the skin cancer dataset. This work is supported by BBSRC (grant numbers BB/P013732/1 and BB/M020053/1).
References
- [1] GALTON F. Vox Populi. Nature. 1907;75:450–451.
- [2] Romney AK, Weller SC, Batchelder WH. Culture as Consensus: A Theory of Culture and Informant Accuracy. American Anthropologist. 1986;88(2):313–338. Available from: http://www.jstor.org/stable/677564.
- [3] Marbach D, Costello JC, Küffner R, Vega NM, Prill RJ, Camacho DM, et al. Wisdom of crowds for robust gene network inference. Nature Methods. 2012 Aug;9(8):796–804. Available from: https://www.nature.com/nmeth/journal/v9/n8/abs/nmeth.2016.html.
- [4] Parisi F, Strino F, Nadler B, Kluger Y. Ranking and combining multiple predictors without labeled data. Proceedings of the National Academy of Sciences. 2014 Jan;111(4):1253–1258. Available from: http://www.pnas.org/content/111/4/1253.
- [5] Alhamdoosh M, Ng M, Wilson NJ, Sheridan JM, Huynh H, Wilson MJ, et al. Combining multiple tools outperforms individual methods in gene set enrichment analyses. Bioinformatics. 2017 Feb;33(3):414–424. Available from: https://academic.oup.com/bioinformatics/article/33/3/414/2875813/Combining-multiple-tools-outperforms-individual.
- [6] Cho H, Berger B, Peng J. Compact Integration of Multi-Network Topology for Functional Analysis of Genes. Cell Systems. 2016 Dec;3(6):540–548.e5. Available from: http://www.cell.com/cell-systems/abstract/S2405-4712(16)30360-X.
- [7] Sheshadri A, Lease M. SQUARE: A Benchmark for Research on Computing Crowd Consensus. In: First AAAI Conference on Human Computation and Crowdsourcing; 2013. Available from: https://www.aaai.org/ocs/index.php/HCOMP/HCOMP13/paper/view/7550.
- [8] Chen KY, Fine LR, Huberman BA. Eliminating Public Knowledge Biases in Information-Aggregation Mechanisms. Management Science. 2004 Jul;50(7):983–994. Available from: http://pubsonline.informs.org/doi/abs/10.1287/mnsc.1040.0247.
- [9] Dawid AP, Skene AM. Maximum Likelihood Estimation of Observer Error-Rates Using the EM Algorithm. Journal of the Royal Statistical Society Series C (Applied Statistics). 1979;28(1):20–28. Available from: http://www.jstor.org/stable/2346806.
- [10] Jaffe A, Nadler B, Kluger Y. Estimating the accuracies of multiple classifiers without labeled data. In: PMLR; 2015. p. 407–415. Available from: http://proceedings.mlr.press/v38/jaffe15.html.
- [11] Vogel R, Gustavo S;. personal communication.
- [12] DREAM2 - BCL6 Transcriptional Target Prediction - syn3034857;. Available from: https://www.synapse.org/#!Synapse:syn3034857/wiki/74404.
- [13] Klein U, Tu Y, Stolovitzky GA, Keller JL, Haddad J, Miljkovic V, et al. Transcriptional analysis of the B cell germinal center reaction. Proceedings of the National Academy of Sciences. 2003 Mar;100(5):2639–2644. Available from: http://www.pnas.org/content/100/5/2639.
- [14] Esteva A, Kuprel B, Novoa RA, Ko J, Swetter SM, Blau HM, et al. Dermatologist-level classification of skin cancer with deep neural networks. Nature. 2017 Feb;542(7639):115–118. Available from: https://www.nature.com/nature/journal/v542/n7639/abs/nature21056.html.
- [15] Welinder P, Branson S, Perona P, Belongie SJ. The Multidimensional Wisdom of Crowds. In: Lafferty JD, Williams CKI, Shawe-Taylor J, Zemel RS, Culotta A, editors. Advances in Neural Information Processing Systems 23. Curran Associates, Inc.; 2010. p. 2424–2432. Available from: http://papers.nips.cc/paper/4074-the-multidimensional-wisdom-of-crowds.pdf.
- [16] Chang H, Yeung DY. Robust locally linear embedding. Pattern Recognition. 2006 Jun;39(6):1053–1065. Available from: http://www.sciencedirect.com/science/article/pii/S0031320305003353.
- [17] Lorenz J, Rauhut H, Schweitzer F, Helbing D. How social influence can undermine the wisdom of crowd effect. Proceedings of the National Academy of Sciences. 2011 May;108(22):9020–9025. Available from: http://www.pnas.org/content/108/22/9020.
- [18] Jaffe A, Fetaya E, Nadler B, Jiang T, Kluger Y. Unsupervised Ensemble Learning with Dependent Classifiers. In: PMLR; 2016. p. 351–360. Available from: http://proceedings.mlr.press/v51/jaffe16.html.
| A |
|
B |
|
| C |
|
D |
|
| A |
|
| B |
|
C |
|
See external file: supa3.pdf
See external file: supa7.pdf
| A |
|
B |
|
See external file: supsimauc.pdf
See external file: supsim1.pdf
See external file: supsima5.pdf
See tabc.xlsx.
See sim.xlsx.