A Novel Data-Driven Framework for Risk Characterization and Prediction from Electronic Medical Records: A Case Study of Renal Failure
Abstract
Electronic medical records (EMR) contain longitudinal information about patients that can be used to analyze outcomes. Typically, studies on EMR data have worked with established variables that have already been acknowledged to be associated with certain outcomes. However, EMR data may also contain hitherto unrecognized factors for risk association and prediction of outcomes for a disease. In this paper, we present a scalable data-driven framework to analyze EMR data corpus in a disease agnostic way that systematically uncovers important factors influencing outcomes in patients, as supported by data and without expert guidance. We validate the importance of such factors by using the framework to predict for the relevant outcomes. Specifically, we analyze EMR data covering approximately 47 million unique patients to characterize renal failure (RF) among type 2 diabetic (T2DM) patients. We propose a specialized L1 regularized Cox Proportional Hazards (CoxPH) survival model to identify the important factors from those available from patient encounter history. To validate the identified factors, we use a specialized generalized linear model (GLM) to predict the probability of renal failure for individual patients within a specified time window. Our experiments indicate that the factors identified via our data-driven method overlap with the patient characteristics recognized by experts. Our approach allows for scalable, repeatable and efficient utilization of data available in EMRs, confirms prior medical knowledge and can generate new hypothesis without expert supervision.
Introduction
The growth and wide-spread adoption of Electronic Medical Record (EMR) systems [1, 2, 3] has led to efficient recording of patient characteristics and their encounter details that makes the information accessible for secondary data purposes. The resultant rich longitudinal view of the patients’ disease progression and treatment response, allows for novel analyses, even leading to revision of the recommended treatment and patient-care plans [4, 5, 6]. Machine learning approaches furthermore provide robust methods to harvest and compute large data stores, alleviating past limitations of epidemiological studies on clinical data [7]. Increased adoption of EMR standards and health information exchanges, primarily by online and cloud-based data marts [8], have further led to efficient linking of patient encounters/visits across hospitals and addresses many of the concomitant issues with using EMR data such as missing information and temporal blind-spots. Consequently, data driven clinical studies are now feasible and coupled with large EMR datasets can now, for the first time, lead to discovery of hitherto unknown associations between complex chronic diseases.
In this work, we focus on a disease agnostic data-driven approach to identify novel factors associated with disease characterization as supported by data and without necessitating expert guidance. Our framework is designed to be scalable and modifies the classic epidemiological survival model, Cox proportional hazard model [9]. The modifications allow us to identify relevant attributes and validate the same via outcome prediction automatically. Specifically, we exploit the relationship between survival model and Generalized Linear Model(GLM) [10] to create a L1 regularized proportional hazard model for characterization backed by a L1 regularized GLM regression model to predict the occurrence of adverse or critical events. This approach provides the flexibility to overcome the traditional limitation of survival models, specifically the tracking of the disease/event progression only up to the maximum duration present in the training set. At the same time, survival models provide a principled approach to handle “right censored” data points that is data is truncated at the time of last follow-up without knowing if the patient eventually developed the outcome of interest. Compared to prior studies [7] our model by virtue of its data-driven regularization can identify factors that are significant as supported by the EMR instead of relying only on expert knowledge. Newly revealed factors can then be verified from outcome prediction and be added to the list of early warning indicators to be monitored. To illustrate our framework, we provide a use-case characterizing renal failure (RF) in Type 2 Diabetes Mellitus (T2DM). To summarize, our key contributions are:
-
•
We present a scalable L1 regularized proportional hazard model to discover information from EMR about factors that can influence outcomes in patients, without expert guidance.
-
•
We present a GLM regression model to predict the occurrence of events amongst patients using factors discovered via survival modeling while adhering to the underlying generative process.
Methods
Experimental Setup: We use a de-identified EMR corpus of approximately million unique patients covering billion medical encounters. We construct a type 2 diabetic cohort spanning the time period - and covering million patients, following a three step definition: (a) patients must have been diagnosed with type 2 diabetes anytime within this period (presence of snomed concepts), (b) they must have had abnormal HbA1C levels (HbA1C ) from lab observations corresponding to such diagnosis, and (c) had at least diabetes related encounters within this period. A patient satisfying all the three criteria is considered to be diabetic and included in the cohort and, the first time-point when these criteria are satisfied is considered to be the first diagnosis date for the patient. This definition ensures that patients have been identified as diabetic from both procedural and diagnostic methods, thus reducing false positives. From the EMR records, we create normalized medical histories of patients by resolving observations and outcomes with encounters. Furthermore, we admit both positive and negative cases of renal failure (acute and chronic).
Feature Identification: Typically, experts look at a fixed set of factors such as age, weight and HbA1c level in blood while analyzing renal failures in diabetic patients. In this study, we aim to identify other possible indicators, as supported by the data, from the corpus of near-complete patient medical histories. Following classical bio-statistical approaches, risk factors for extreme outcomes like renal failure can be characterized using survival models such as Cox Proportional Hazard (CoxPH) models [9]. In these models, conditional event rates or hazards () associated with factors characterizes the corresponding risk of outcomes which, for a patient , can be given as:
where, denotes the baseline hazard at time (independent of patient covariates) and denotes the regression weight of the factor . To identify and characterize such factors from the data, we use L regularized survival models which have been proven to be effective in other domains [11]. Specifically, we find these parameters by fitting the regularized log-likelihood ratio (eq. 1) against normalized EMR history of the patients in the cohort.
| (1) |
where, is the L penalty factor and we identify the factors which are (a) statistically significant for survival outcomes and (b) associated with the largest regression weights ().
Renal Failure Prediction: We validate the data-driven factors by using these as covariates to predict for renal failure in type 2 diabetic patients based on their medical histories. Although survival models are not particularly suited for prediction on time-intervals outside the training data, we note that the partial log-likelihood in CoxPH models have close ties to logistic GLM regressions [10]. We use a regularized logistic regression (eq. 2) to use these factors to predict for the possibility of renal failure. We use the average history of factors within a pre-defined observation period (first 6,9,12 months from first diagnosis date) in a rolling window setup and predict the occurrence of renal failure in the prediction period (the next months).
| (2) |
Results
| LOINC | description | coef. value |
|---|---|---|
| 8277-6 | Body surface Area | 1.536450e-01 |
| 28542-9 | Platelet mean volume | 2.762536e-02 |
| 30180-4 | Basophils/100 leukocytes | 2.447092e-02 |
| ET3111-5 | 1.967411e-02 | |
| 6299-2 | Urea Nitrogen | 1.112565e-02 |
| 26450-7 | Eosinophils/100 leukocytes | 8.770401e-03 |
| 3094-0 | Urea nitrogen [Mass/volume] | 3.679680e-03 |
| ET3123-9 | 3.000471e-03 | |
| 26511-6 | Neutrophils/100 leukocytes | 2.930090e-03 |
| 26444-0 | Basophils [#/volume] in Blood | 1.513770e-03 |
| 2345-7 | Glucose | 5.521050e-04 |
| 26484-6 | Monocytes | 4.750066e-04 |
| 8480-6 | Intravascular systolic | 2.682153e-04 |
| 2339-0 | Glucose [Mass/volume] in blood | 1.919959e-04 |
| 2571-8 | Triglyceride | 1.305691e-04 |
| 8310-5 | Body temperature | 1.291046e-04 |
| 1920-8 | Aspartate aminotransferase | 1.268876e-04 |
| 1742-6 | Alanine aminotransferase | 1.218098e-04 |
| 26499-4 | Neutrophils | 2.527398e-05 |
| 14957-5 | Albumin | 8.445566e-07 |
| 8867-4 | Heart Rate | 9.496403e-13 |
Table 1 tabulates the top statistically significant data-driven factors w.r.t. survival as identified via eq. 1 from our T2DM patient corpus. Table 1 shows that our method uncovers several observational attributes, from the data and without expert input, that are potentially correlated with an increased risk of renal failures. We validate the importance of these factors using our predictive model as shown in Table 2 which shows that the outcome prediction performance increases when expert factors are supplemented by data-driven factors - thus indicating that the data-driven factors may be uncovering hidden correlations and thus, of potential interest to experts. Here, we found the L penalty using fold cross validation and for each observation period, we used fold cross-validation to quantify accuracy, sensitivity, and specificity.
| Model attributes | Accuracy | Specificity | Sensitivity |
|---|---|---|---|
| Only expert features | 0.86 | 0.89 | 0.68 |
| Data driven features | 0.89 | 0.92 | 0.71 |
| expert + data -driven features | 0.91 | 0.93 | 0.73 |
Discussion
In this section we briefly discuss some interesting findings from our assay.
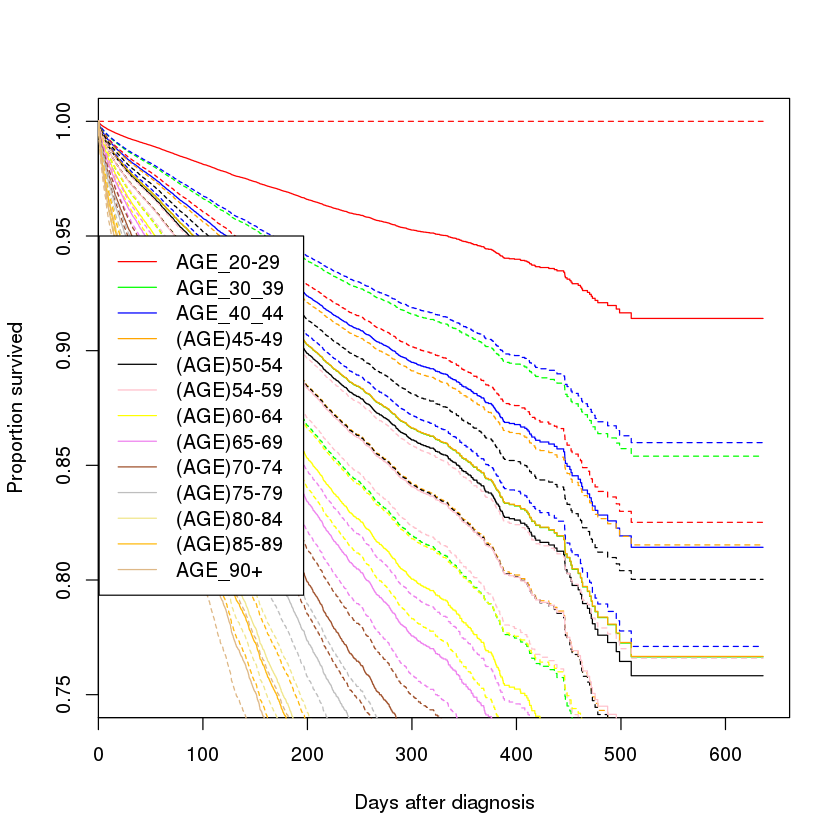
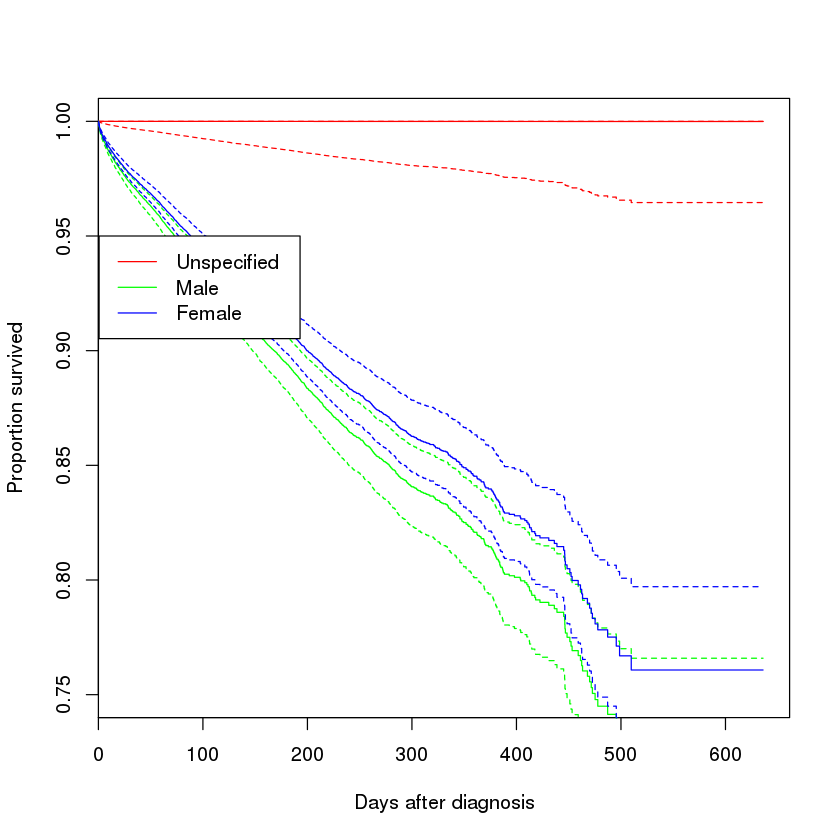
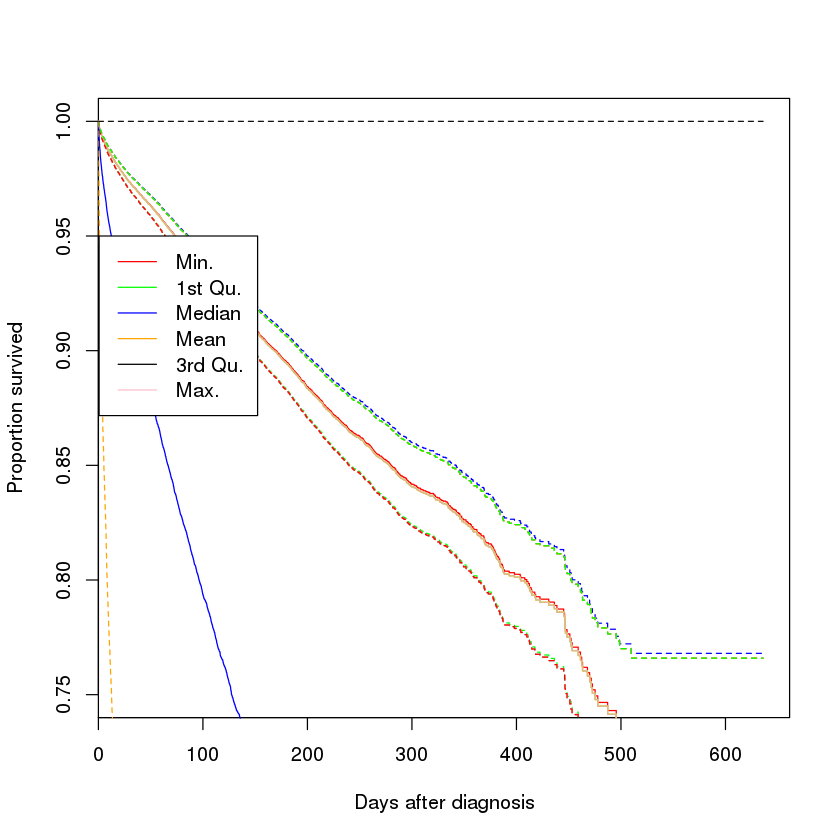
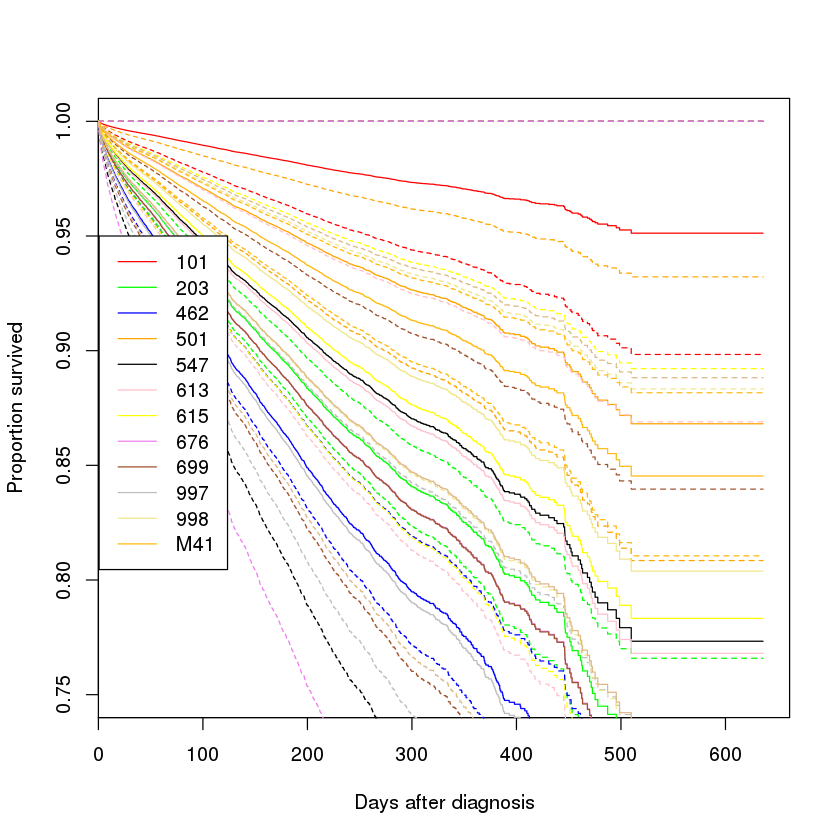
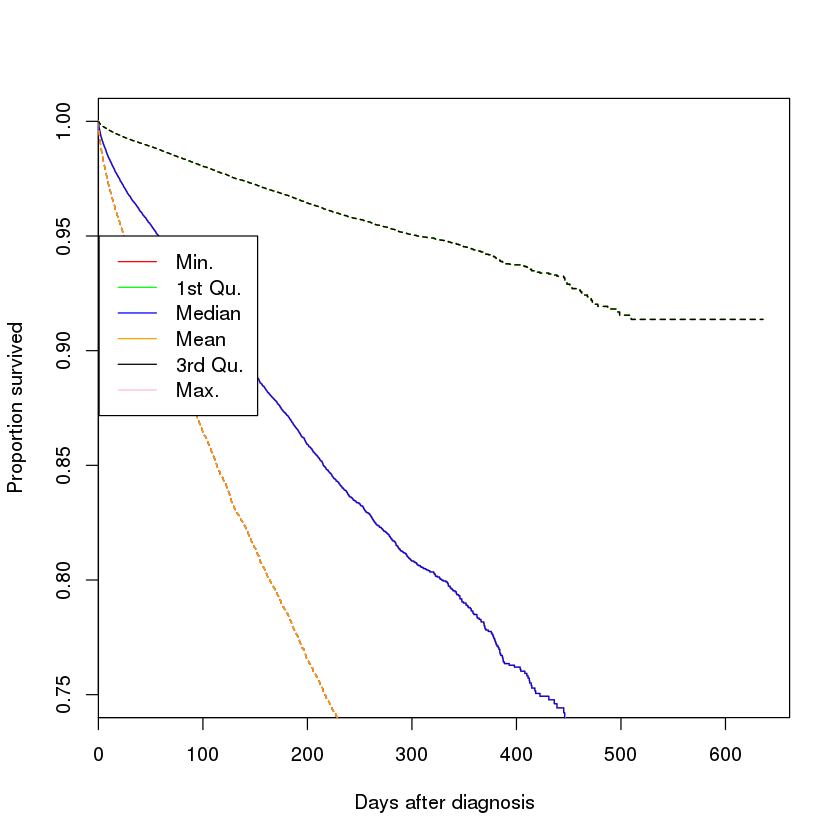
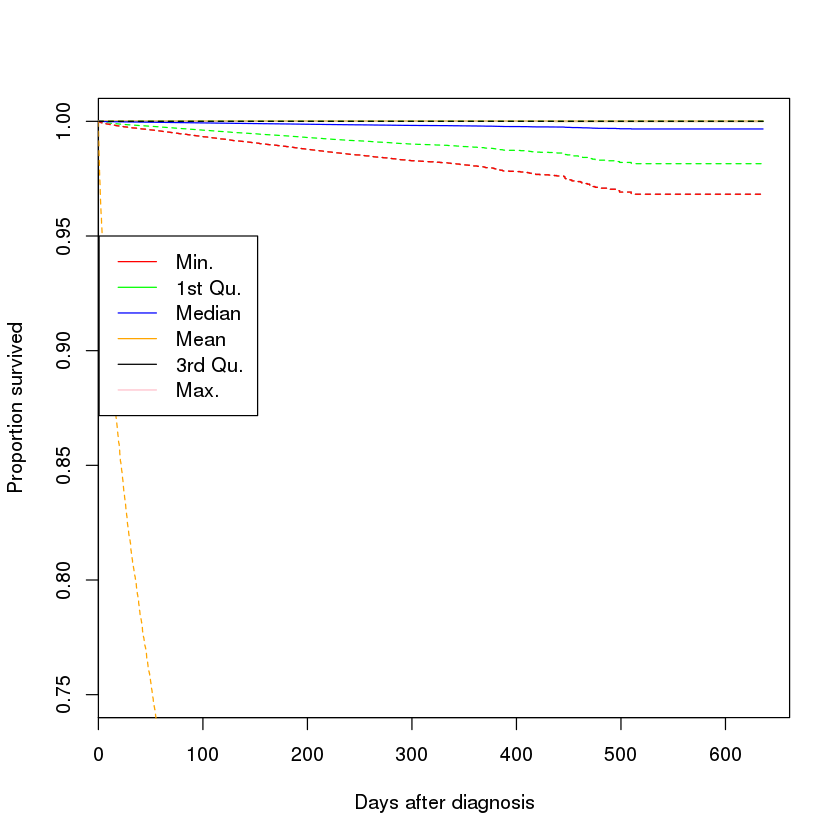
Relative importance of factors : We ascertain the relative importance of factors using coefficient rankings in Table 1, where the coefficients are calculated in the presence of other factors. Following classical survival analysis methodology, we further investigate the importance of each individual factor using adjusted survival ratios. We create the adjusted ratio for a factor by marginalizing against other factors, setting such factors to their mean or most prevalent value (depending on the type of the factor). Figure 1 shows the adjusted ratios for the most important data driven as well as Expert factors. As can be seen when marginalized, we can uncover certain characteristics within the factors. For example, males are generally at higher risk than females. While weight and renal risk exhibits an inverse ratio, HbA1c shows a direct ratio with renal failure risk. Interestingly, the difference is not as marked in the case of LOINC 8277-6.
Are there any significant factors not identified by survival models : Although weight is one of the factors considered by experts, it ranks low from our data-driven framework. We posit that this could indicate that that effects identified by weight may already be covered by other factors and hence its ranking is not significant. Interestingly, the importance of gender and race remain constant throughout different models - indicating that these are fundamental factors. A possible extension to analyze these factors in depth could be a stratified approach. However, such approaches can obscure the importance of the fundamental factors
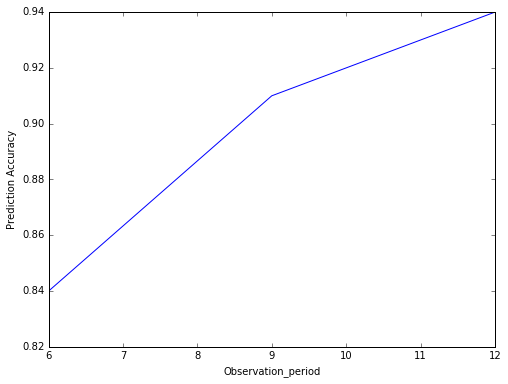
How does the observation period affect the prediction performance : Table 2 reports the overall prediction accuracy for our experimental setup. However, the prediction performance when viewed as a function of the observation period (see Figure 2), uncovers interesting patterns. It can be seen that, in general, increasing the observation period increases the prediction accuracy. It is to be noted, increasing the observation doesn’t necessarily increase the amount of data observed in general (as we are taking average history of patients who haven’t had a renal failure in the observation period). One possible explanation could be the fact that with the increase in observation period, more renal failures happen in the subsequent prediction period and as such the prediction problem becomes less skewed and well-defined. This indicates that while dealing with low observation periods we may need to include additional strategies such as SMOTE [12].
Conclusion
In this paper, we propose a systematic framework for identifying risk factors for outcomes as supported by data from EMR corpus. We showcase our framework on renal failures for diabetic patients and discussed various components of the same. Our experiments indicate that the framework is able to identify significant factors. However, certain factors as identified by experts don’t rank highly from this framework. Further research is needed to model hidden interactions between factors to distinguish between ‘fundamental’ factor and derivative factors.
References
- [1] Dustin Charles, Meghan Gabriel, and Michael F Furukawa. Adoption of Electronic Health Record Systems among US Non-Federal Acute Care Hospitals: 2008-2012. ONC data brief, 9:1–9, 2013.
- [2] Steven Wallace, Keith Maxey, and Lakshmi S Iyer. A Multi-case Investigation of Electronic Health Record Implementation in Small-and Medium-size Physician Practices. Journal of Information Technology Case and Application Research, 16(1):27–48, 2014.
- [3] Chun-Ju Hsiao, Esther Hing, Thomas C Socey, Bill Cai, et al. Electronic Medical Record/Electronic Health Record Systems of Office-based Physicians: United States, 2009 and Preliminary 2010 State estimates. National Center for Health Statistics, 2010.
- [4] Peter B Jensen, Lars J Jensen, and Søren Brunak. Mining Electronic Health Records: Towards Better Research Applications and Clinical Care. Nature Reviews Genetics, 13(6):395–405, 2012.
- [5] Gou Masuda and Norihiro Sakamoto. A Framework for Dynamic Evidence based Medicine using Data Mining. In Computer-Based Medical Systems, 2002.(CBMS 2002). Proceedings of the 15th IEEE Symposium on, pages 117–122. IEEE, 2002.
- [6] Lucila Ohno-Machado et al. Mining Electronic Health Record Data: Finding the Gold Nuggets. Journal of the American Medical Informatics Association, 22(5):937–937, 2015.
- [7] Subramani Mani, Yukun Chen, Tom Elasy, Warren Clayton, and Joshua Denny. Type 2 diabetes risk forecasting from emr data using machine learning. In AMIA annual symposium proceedings, volume 2012, page 606. American Medical Informatics Association, 2012.
- [8] Yu-Yi Chen, Jun-Chao Lu, and Jinn-Ke Jan. A Secure EHR System based on Hybrid Clouds. Journal of medical systems, 36(5):3375–3384, 2012.
- [9] D. R. Cox. Regression Models and Life-Tables. Journal of the Royal Statistical Society. Series B (Methodological), 34(2):187–220, 1972.
- [10] P. McCullagh and J.A. Nelder. Generalized Linear Models, Second Edition. Chapman and Hall/CRC Monographs on Statistics and Applied Probability Series. Chapman & Hall, 1989.
- [11] J. J. Goeman. L1 Penalized Estimation in The Cox Proportional Hazards Model. Biometrical Journal, (52):–14, 2010.
- [12] Nitesh V. Chawla, Kevin W. Bowyer, Lawrence O. Hall, and W. Philip Kegelmeyer. SMOTE: Synthetic Minority Over-sampling Technique. Journal of artificial intelligence research, 16:321–357, 2002.