2Department of Astronomy, University of Illinois at Urbana-Champaign, Urbana, IL, USA
3School of Physics and Astronomy, Cardiff University, CF24 3AA, UK
4Department of Physics and Astronomy, University of British Columbia, Vancouver, BC, Canada
5Department of Physics, Princeton University, Princeton, NJ, USA 08544, USA
6Physics Department, Center for Education and Research in Cosmology and Astrophysics, CaseWestern Reserve University, Cleveland, OH, USA
7Division of Physics, Mathematics and Astronomy, California Institute of Technology, Pasadena, CA, USA
8Jet Propulsion Laboratory, Pasadena, CA, USA
9Canadian Institute for Theoretical Astrophysics, University of Toronto, Toronto, ON, Canada
10School of Earth and Space Exploration, Arizona State University, Tempe, AZ, USA
11School of Mathematics, Statistics and Computer Science, University of KwaZulu-Natal, Durban, South Africa
12National Institute for Theoretical Physics (NITheP), KwaZulu-Natal, South Africa
13Blackett Laboratory, Imperial College London, London, UK
14The Oskar Klein Centre for Cosmoparticle Physics, Department of Physics, Stockholm University, Stockholm, Sweden
15Institute of Theoretical Astrophysics, University of Oslo, Oslo, Norway
16Department of Astronomy and Astrophysics, University of Toronto, Toronto, ON, Canada
17National Radio Astronomy Observatory, Charlottesville, NC, USA
18Department of Physics, University of Michigan, Ann Arbor, MI, USA
19Department of Physics, University of Toronto, Toronto, ON, Canada
20Department of Physics and Astronomy, Johns Hopkins University, Baltimore, MD, USA
21NASA Goddard Space Flight Center, Greenbelt, MD, USA
22APC, Univ. Paris Diderot, CNRS/IN2P3, CEA/Irfu, Obs de Paris, Sorbonne Paris Cite, France
23Pennsylvania State University, University Park, PA, USA
24National Institute of Standards and Technology, Boulder, CO, USA
25Department of Physics, Stanford University, Stanford, CA, USA
26SLAC National Accelerator Laboratory, Menlo Park, CA, USA
27Department of Mechanical and Aerospace Engineering, Princeton University, Princeton, NJ, USA
28Dunlap Institute for Astronomy & Astrophysics, University of Toronto, Toronto, ON, Canada
29Harvard-Smithsonian Center for Astrophysics, Cambridge, MA, USA
30Fermi National Accelerator Laboratory, Batavia, IL, USA
31Kavli Institute for Cosmological Physics, University of Chicago, Chicago, IL, USA
32Max-Planck-Institute for Astronomy, Heidelberg, Germany
33Laboratoire AIM, Paris-Saclay, CEA/IRFU/Sap-CNRS-Université Paris Diderot, Gif-sur-Yvette Cedex, France 11email: rgualtie@illinois.edu
SPIDER: CMB polarimetry from the edge of space
Abstract
Spider is a balloon-borne instrument designed to map the polarization of the millimeter-wave sky at large angular scales. Spider targets the B-mode signature of primordial gravitational waves in the cosmic microwave background (CMB), with a focus on mapping a large sky area with high fidelity at multiple frequencies. Spider’s first long-duration balloon (LDB) flight in January 2015 deployed a total of 2400 antenna-coupled Transition Edge Sensors (TESs) at 90 GHz and 150 GHz. In this work we review the design and in-flight performance of the Spider instrument, with a particular focus on the measured performance of the detectors and instrument in a space-like loading and radiation environment. Spider’s second flight in December 2018 will incorporate payload upgrades and new receivers to map the sky at 285 GHz, providing valuable information for cleaning polarized dust emission from CMB maps.
Keywords:
Cosmic microwave background, inflation, bolometers, transition edge sensors, polarimetry1 Introduction
Precision observations of the CMB have transformed our understanding of the universe’s history and composition. The next frontier of this endeavor is the characterization of the exceedingly faint pattern of polarization in this radiation field, with an intensity more than an order of magnitude smaller than that of the CMB’s well-known temperature anisotropies. An accurate map of this polarization across the sky encodes information about the local conditions within the primordial plasma that is complementary to that available from the temperature. Most intriguingly, the presence of an odd-parity “B-mode” pattern of polarization at large angular scales would be an unambiguous signature that our universe began with an inflationary epoch of rapid expansion, thus providing information on fundamental physics at energy scales far beyond those achievable at accelerators 1. A believable detection (or exclusion) of this faint signal will require polarimeters of enormous sensitivity, exquisite control of polarized instrumental systematics, and clean separation of the CMB from galactic and atmospheric foregrounds. Numerous scientific teams are now developing and deploying terrestrial, balloon-borne, and satellite instruments to seek out this signature in the millimeter-wave sky. Current observational constraints limit the tensor-to-scalar ratio – the power of primordial gravitational waves relative to that of the primordial density perturbations – to be less than 0.07 at 95% confidence 2, 3.
Spider 4, 5, 6 is a balloon-borne telescope array optimized to search for the signature of cosmic inflation7 in the polarization of the CMB, and to discriminate a primordial signal from galactic foreground emission. Spider employs multiplexed arrays of transition-edge sensor (TES) bolometers to observe the millimeter-wave sky from a NASA LDB. LDB flights from McMurdo Station, Antarctica, provide multi-week flights at high (36 km) observing altitudes, near-space photon backgrounds, and sensitivity to frequencies and angular scales that are contaminated by atmosphere at even the most favorable ground-based observing sites. In addition to their observing advantages, LDB flights are also technological proving grounds for future space missions 8. In this paper we briefly review the design and performance of the Spider instrument, with a particular focus on Spider’s performance in this environment during its first observing flight in January 2015.
2 The Spider 2015 payload
2.1 Overview
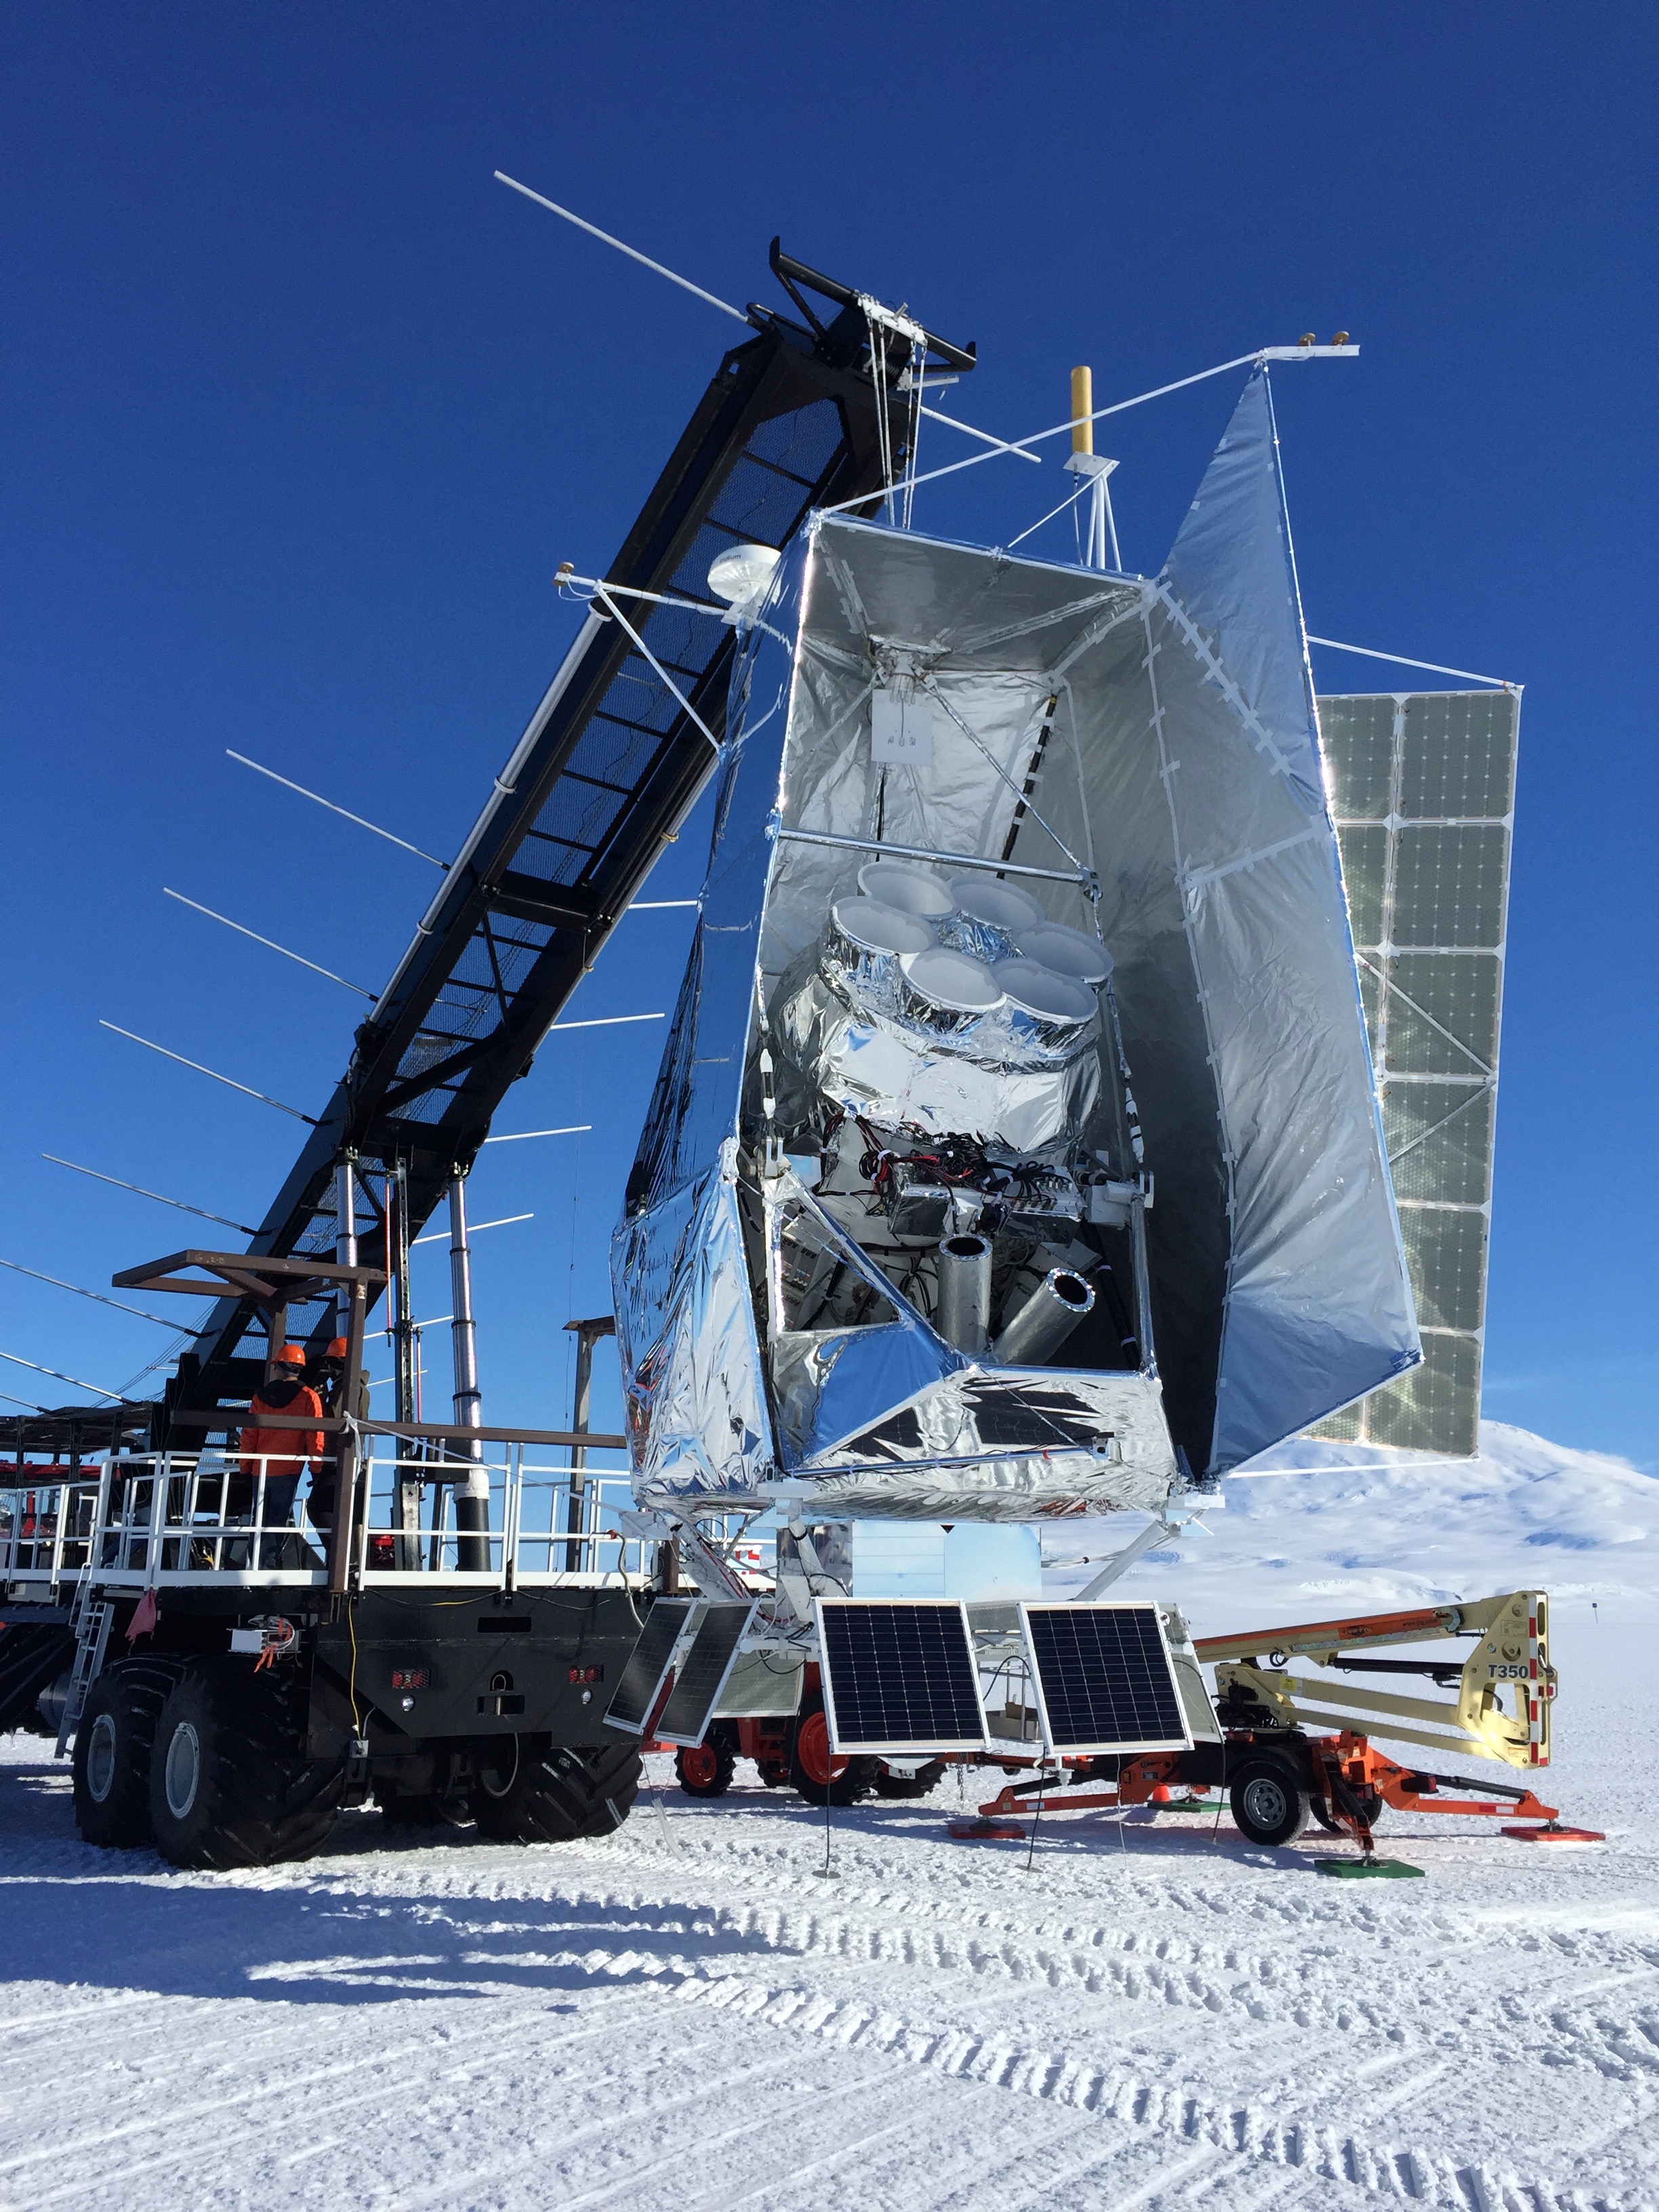
The Spider payload (Fig. 1, left) consists of six monochromatic refracting telescopes housed within a single large liquid helium cryostat. The cryostat and associated electronics are supported within a lightweight carbon fiber gondola, which hangs beneath the balloon 9.
A reaction wheel and linear drive scan the cryostat in azimuth and elevation throughout the flight working in concert with a motorized pivot, at speeds as high as s in azimuth 10. A suite of star cameras, GPS receivers, sun sensors, and gyroscopes enable accurate instantaneous ( rms) and post-flight ( rms) pointing reconstruction 11, well in excess of requirements for the relatively broad beams ( FWHM at 150 GHz and FWHM at 90 GHz) of the Spider telescopes. A set of sun shields protects the instrument and optics during the 24-hour Antarctic summer daylight. A 2 kW solar panel system provides electric power throughout the flight. An assortment of antenna arrays provide commanding, telemetry, and location information during flight.
Spider’s cryogenic system, the largest yet deployed on an LDB, consists of two liquid helium reservoirs: a 1284 L main tank and a 20 L superfluid tank 12. The main tank is maintained near sea level atmospheric pressure during the flight, providing each telescope with cooling power at 4 K. Vapor from the main tank cools a series of vapor-cooled shields to reduce radiative load on the cryogenic system. The superfluid tank fills continuously from the main tank through a capillary assembly, and is pumped out to about 5 torr by opening a valve to the low pressure atmosphere at float. The superfluid system provides cooling power at 1.6 K to each inserts’ sub-Kelvin cooler and internal optical baffles. The focal planes themselves are cooled to 300 mK by a dedicated 3He adsorption refrigerator within each telescope.
2.2 Receivers
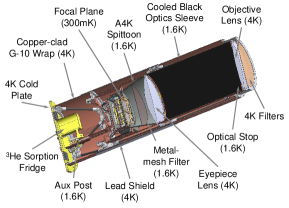
Each Spider receiver is a two-lens cold refracting telescopes, adapted from the basic plan of the Bicep 1 instrument 14, 13. The Spider lens design is optimized for a planar-antenna focal plane, while the filter stack and telescope structure incorporate several adaptations for a balloon-borne environment. Each telescope consists of two anti-reflection coated polyethylene lenses cooled to 4 K, focusing light onto the focal plane (Fig. 1, center). This compact, axisymmetric design limits polarized systematics within the instrument. The relatively small (26 cm ⌀) stop aperture simplifies baffling and far-field beam characterization while retaining sufficient angular resolution to map the inflationary B-mode signal expected at degree angular scales. This modular design using monochromatic telescopes greatly simplifies anti-reflection coatings for the optical elements and allows for flexibility in the instrument’s frequency coverage. Each receiver is supported by a rigid carbon fiber frame to reduce payload mass, a critical concern for balloon-borne operations.
A primary concern for the Spider optical system has been to reduce stray optical load on the detectors, which degrades mapping speed and would eventually saturate the TES bolometers. This has forced several adaptations from the Bicep2 design Bicep2instrument. A blackened “sleeve” baffle cooled to 2 Kelvin by the superfluid tank has been added between the secondary lens and the Lyot stop to reduce loading from the telescope itself. Spider’s filter stack is predominantly reflective (metal-mesh filters 16) to further reduce emission, with a single absorptive nylon filter at 4 K. The vacuum seal for each telescope is provided by a thin sheet of anti-reflection coated ultra-high molecular weight polyethylene, with low scattering and emissivity. The warm baffling of each telescope is primarily reflective rather than absorptive, redirecting side lobe response to the cold sky rather than absorbing it at ambient temperature.
Polarization modulation for each telescope is provided by a sapphire half-wave plate 18, 17, just skyward of the 4 Kelvin filter stack and also cooled to 4 K. Each plate’s thickness and coating are tuned for the wavelength of the associated receiver, yielding minimal impact on optical throughput, ghosting, and pointing. Each wave plate is operated in a stepped configuration, rotated every 12 hours during fridge cycling to provide polarization modulation over the course of the flight.
2.3 Focal plane assemblies
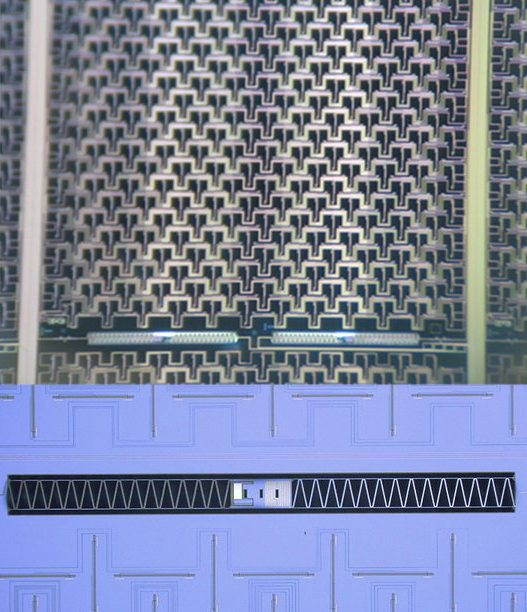
In Spider’s 2015 flight, these optical systems focused light onto planar arrays of dual-polarization antenna-coupled TESs developed at Caltech/JPL 19. Each receiver’s focal plane houses four silicon tiles, each photolithographically patterned with an square array ( for 90 GHz) of polarimeter pixels. Each of these consists of two interpenetrating arrays of slot antennas sensitive to perpendicular polarization modes (Figure 1, top right). The power received by each beam-forming antenna array is fed to a dedicated Ti TES ( mK) through an inline band-defining filter. The arrays are read out using a time-division Superconducting QUantum Interference Device (SQUID) multiplexer system 21, 20. A second Al TES ( K) is wired in series with the primary Ti TES to allow receiver characterization under laboratory loading conditions.
Spider’s detectors are optimized to take advantage of the extremely low optical loading from the sky at balloon altitudes, that available at the South Pole. Spider TESs use a meandered leg design (Fig. 1, bottom right) that gives lower thermal conductance (and thus lower thermodynamic noise) in a similar footprint area. Typical thermal conductances of the completed Spider arrays are of order - pW/K at 450 mK. This solution is different in example from the straight-legged design used for the isolation membranes of the Bicep2 bolometers 22. The electrical noise of the amplifier is kept subdominant to that from the detectors and photons by reducing the detector resistance and increasing the readout circuit inductance.
The focal plane housing the detectors and SQUIDs has been designed from the ground up to provide excellent shielding against time-varying magnetic fields, using several nested layers of superconducting and ferromagnetic materials. Without such shielding the payload’s motion in the Earth’s magnetic field could induce spurious signals into the readout system. This is a greater concern for Spider than for terrestrial instruments, since the gondola’s motion makes it difficult to subtract such effects with a ground-fixed template. For further details of this design, see Runyan et al. 2010 23.
3 In-flight performance
3.1 2015 flight
Spider took to the air from the LDB base camp at McMurdo Station, Antarctica on January 1, 2015. All systems functioned well during the 16-day flight, with the exception of a redundant differential GPS package. The flight terminated successfully in West Antarctica, km from the launch point. Spider’s data disks were recovered in February 2015, and the full payload in November 2015, by the British Antarctic Survey. All hardware has been returned to North America, and is currently being refit for Spider’s upcoming second flight (see Section 4).
Robust automation was a key consideration for Spider’s flight operations. The limited satellite link bandwidth prohibited a live downlink of Spider’s full data set, necessitating on-board data quality checks and error recovery. Payload telemetry was also limited, due both to bandwidth demands and to radio-frequency interference (RFI) induced in the detectors by the onboard higher-bandwidth antennas. Instead, the redundant flight computer systems monitored payload and detector status onboard, adjusting detector biases and other settings as needed. Highly compressed diagnostic packets were transmitted to the ground station in brief bursts at regular intervals, limiting the impact on data. The higher bandwidth satellite links were reserved for on-demand use to examine specific issues, generally during cryogenic servicing operations when science data were not being acquired.
During its flight Spider mapped approximately 10% of the sky at 90 and 150 GHz, using three receivers at each frequency. The resulting 1.6 TB of data are currently under analysis 24.
3.2 Detector performance
The 2015 flight incorporated a total of 2400 TES bolometers, of which 96 were intentionally not coupled to antennas. After accounting for hardware yield and relatively stringent data selection cuts, we currently retain data from 1863 optically-coupled bolometers (675/1188 at 90/150 GHz). We further exclude periods of data on individual detectors for various causes, most prominently RFI from the communications arrays. The estimated noise-equivalent temperature (NET) of the total instrument after these cuts is approximately 7.1 (5.3) Kcmb at 90 (150) GHz.
Due to Spider’s cold optical chain, radiation loading from the instrument itself was kept extremely low. We estimate a total in-band loading during flight of () pW at 90 (150) GHz. This includes loading from the instrument, the atmosphere, and the CMB itself. Those numbers are comparable to, or lower than, those achieved by Planck-HFI at L2 25, a significant technical achievement and benefit of the LDB platform. If outfitted with truly photon-noise-limited detectors, a similar design might thus quadruple Spider’s present mapping speed.
3.3 Cosmic ray response
One important challenge of a space or near-space environment is the greatly increased flux of particle radiation relative to that at sea level. The near-Earth environment is pelted by radiation of solar, galactic, and extra-galactic origins, predominantly a broad spectrum of protons peaking near 300 MeV and extending well beyond the TeV range. Frequent glitches in the data stream from particle interactions have been a source of analysis difficulty for the Planck satellite 26, and will be a factor in the design of future space-based bolometric instruments. This particle flux is lower at balloon altitudes, but is still an important part of Spider’s data analysis. Below we give a first description of the general features of cosmic ray-induced glitches seen in the Spider data set.
Particle events deposit energy in the TES bolometer, producing brief glitches in the data that generally recover quickly according the bolometer’s (optical) time constant. The typical energy deposition in a component is determined predominantly by its thickness, while the glitch rate is determined by its area. The incident particle rate is affected by solar activity, surrounding materials, and (for a balloon) the Earth’s magnetic field. From a highly simplified model, we expect energy depositions of order 1 keV in each bolometer every few minutes, while the larger wafer experiences MeV-scale depositions at 100 Hz. The rate of bolometer depositions should thus be manageable in analysis, as long as the TES recovers quickly from each glitch. Of more concern are response to bolometer hits in the wafer and multiplexer crosstalk, both of which could greatly increase the data loss.
Cosmic ray-induced glitches (CRGs) are seen in Spider 2015 data every minutes in each detector. Typical glitches are only a handful of samples in length at an acquisition rate of 126 Hz, with shape determined by the digital anti-aliasing filter applied by our readout electronics. These glitches are flagged and removed with minimal effect on our science analysis. Laboratory characterization of an antenna-coupled TES array with a 32S source at Caltech revealed that the SQUID readout system could occasionally lose lock during a large energy deposition, causing the DC level of the data stream to be offset by one flux quantum. Such “flux-slip” discontinuities are seen regularly in Spider data, primarily due to RFI but occasionally due to energetic particle interactions. They are corrected during low-level data processing.
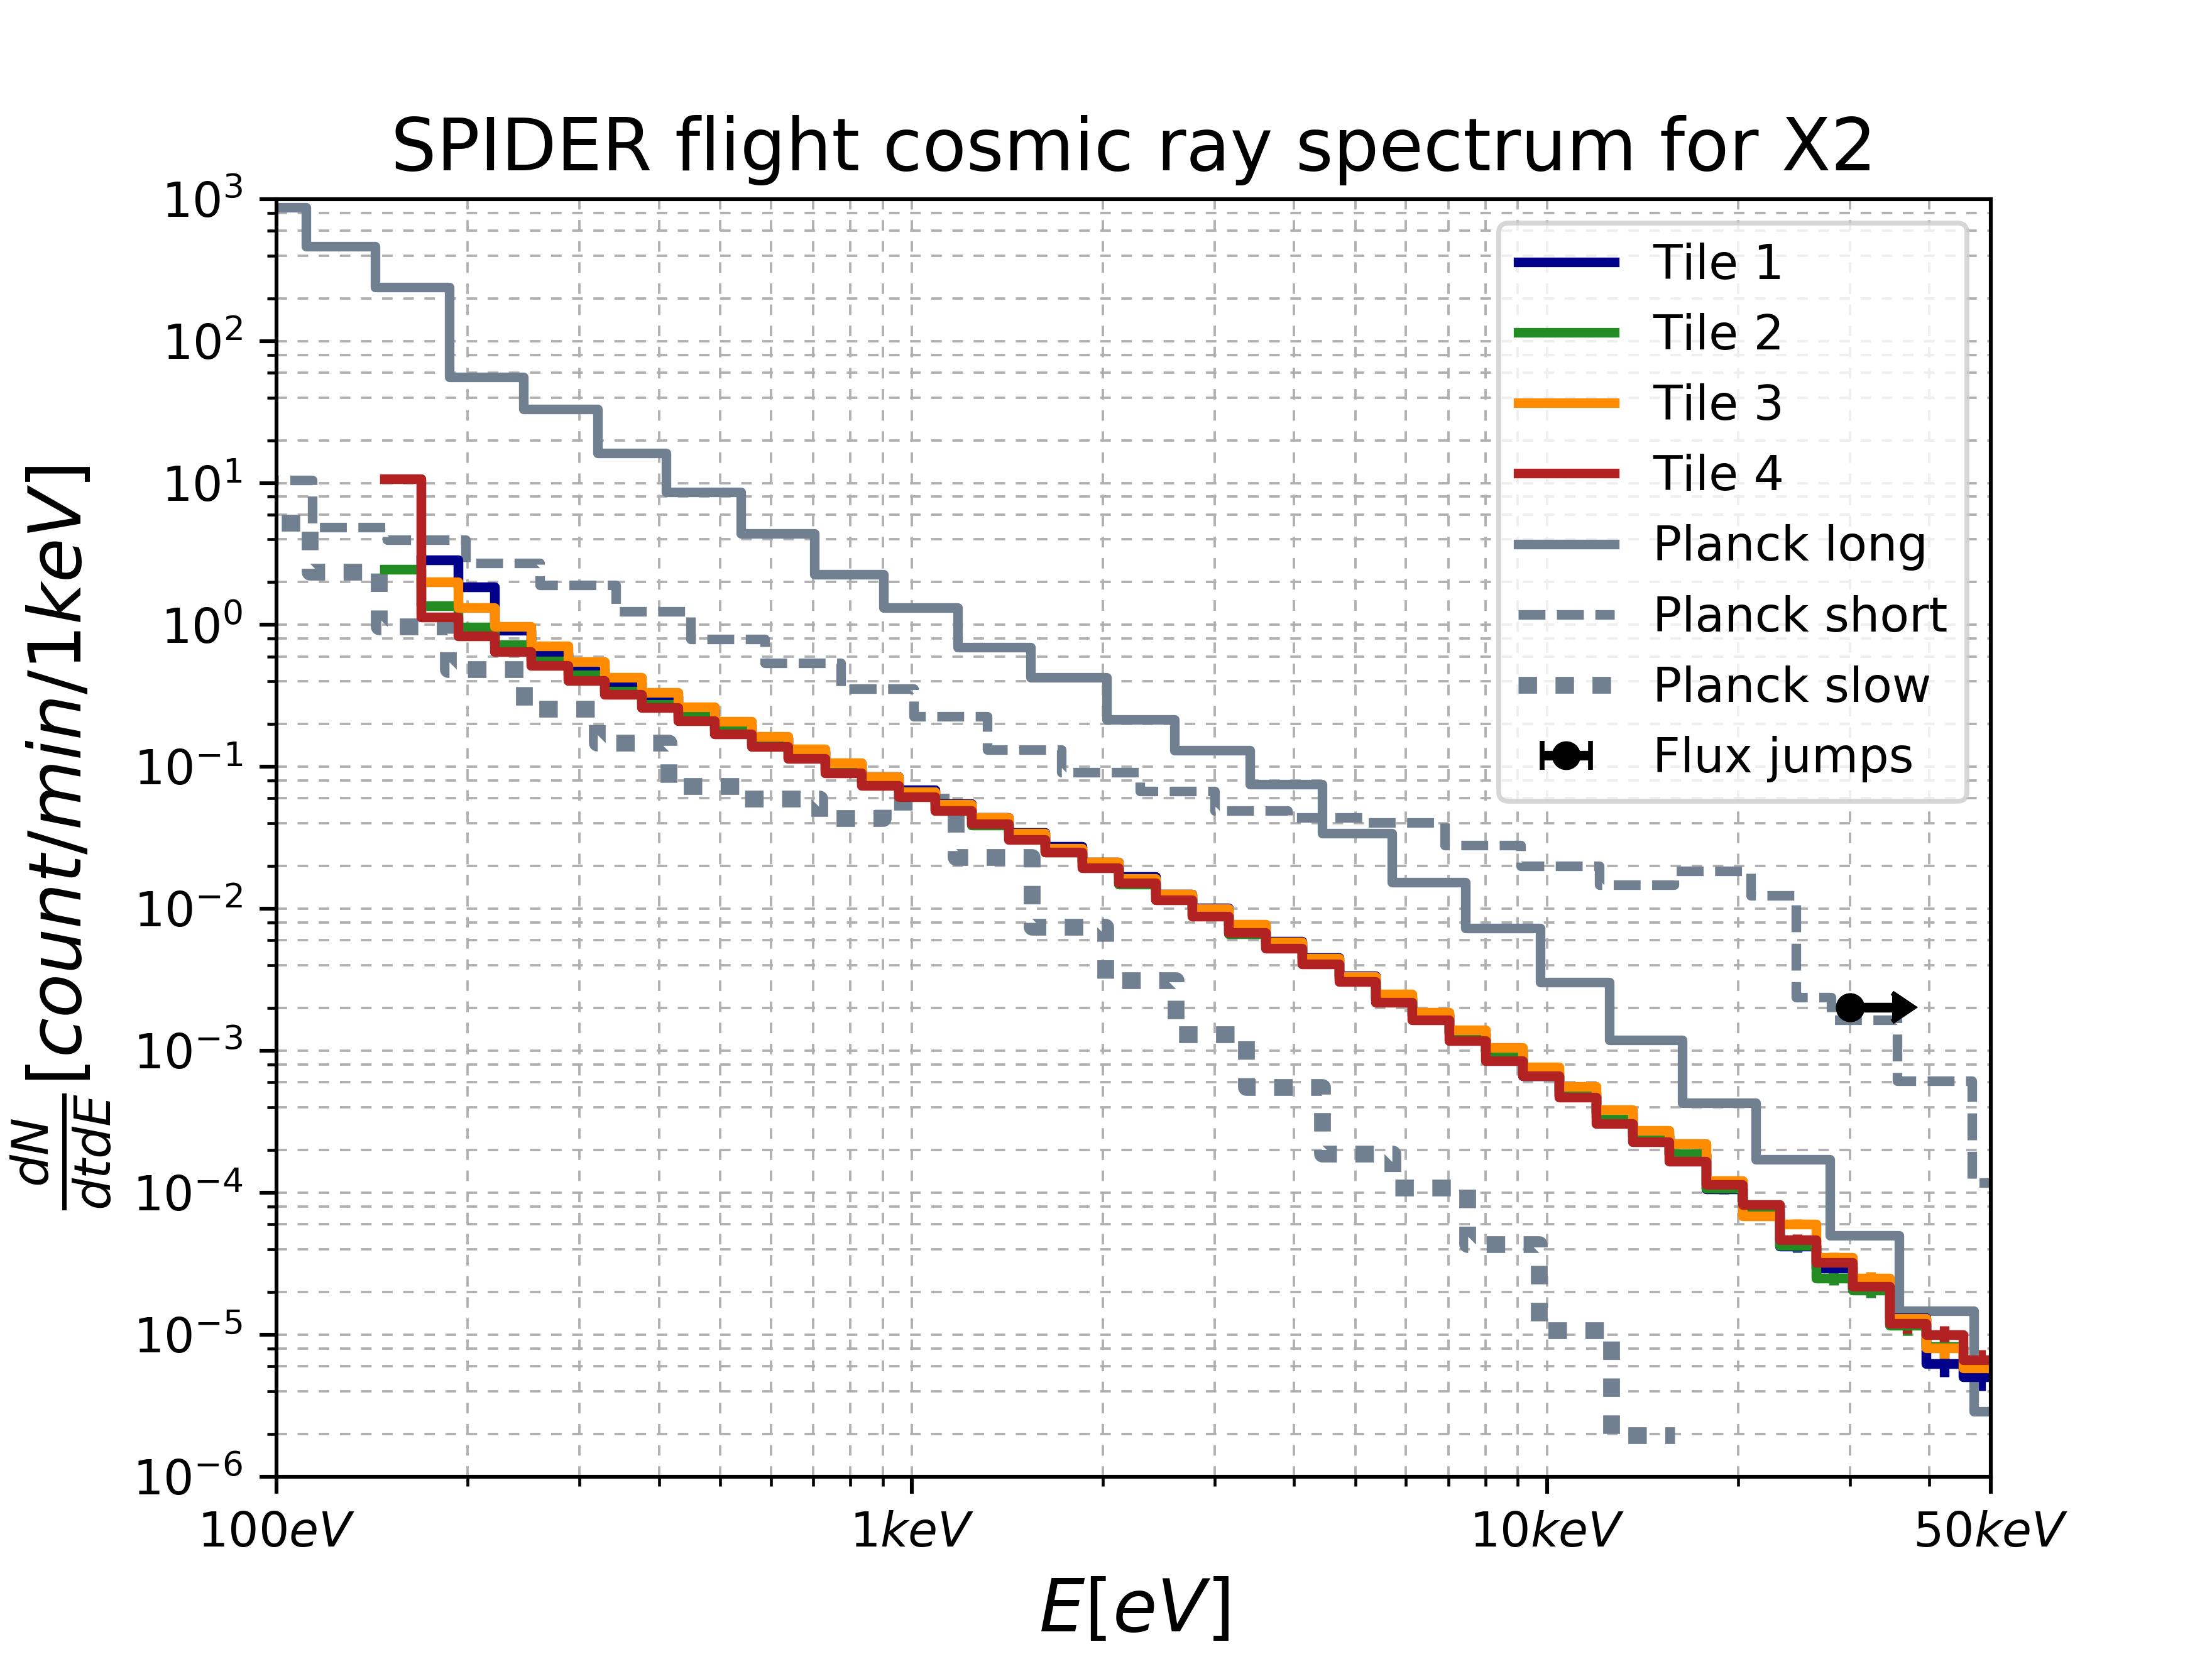
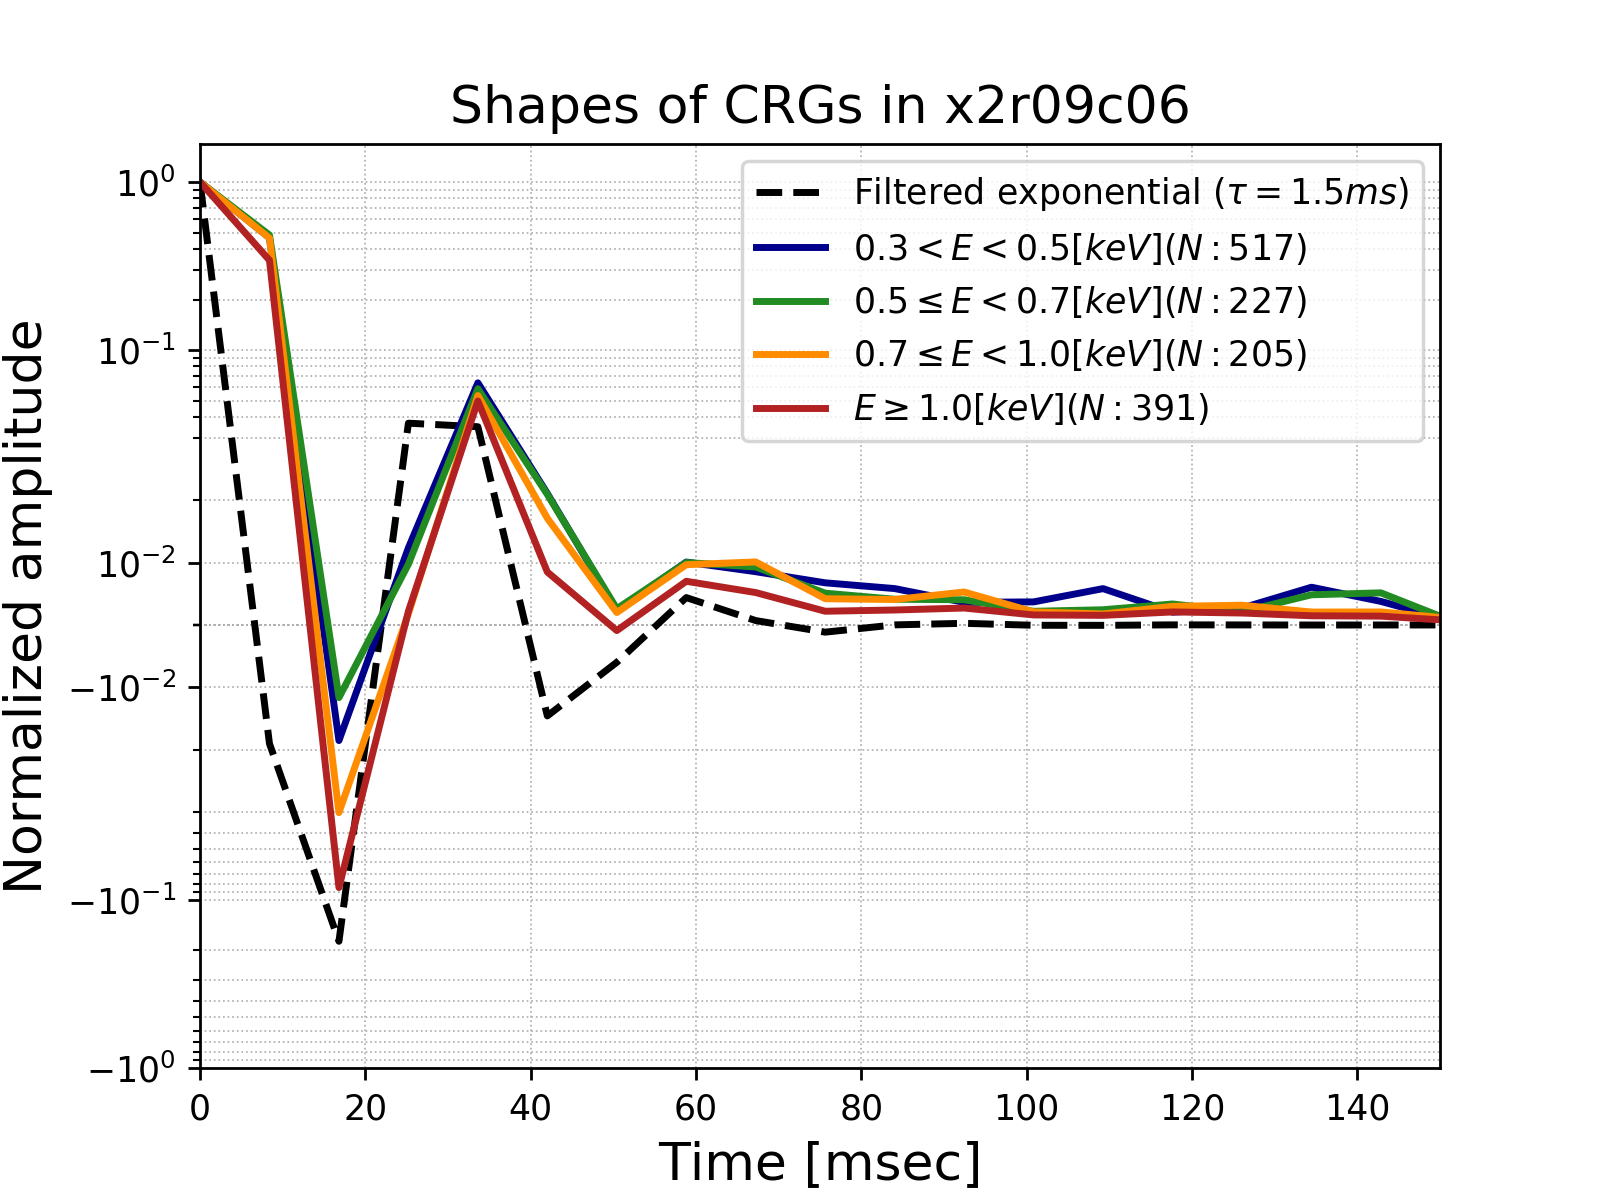
Fig. 2 shows the estimated spectrum of deposited energies for cosmic ray glitches in a representative focal plane unit (FPU). Glitch rates are - lower than in Planck HFI 28, qualitatively consistent with the somewhat more benign environment in the stratosphere. Coincidence rates are low (), suggesting relatively little long-distance energy propagation through the silicon tile. No long “tails” are apparent in the pulse decay times, but this is difficult to constrain given the digital filter. Laboratory tests with radioactive sources are in progress, and will give further information on this front.
4 Status and prospects
Spider’s first scientific result was published in 2017: a new constraint on the level of circular polarization in the CMB and millimeter-wave sky (Fig. 3, Left). This analysis takes advantage of non-idealities in Spider’s half-wave plates that couple circular polarization into linear polarization, leading to constraints three orders of magnitude stronger than previous work 24. Spider’s primary B-mode polarization analysis is ongoing.
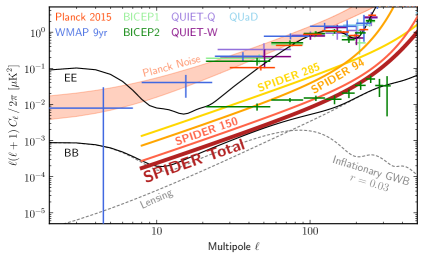
The Spider collaboration is preparing for a second observing flight in Dec. 2018, also on an Antarctic LDB. This flight will incorporate three new receivers to map the same sky at 280 GHz, using feedhorn-coupled arrays of AlMn TES polarimeters developed at NIST 29, 30. The resulting 280 GHz data will yield maps of galactic dust polarization over a large sky fraction at a frequency in between the existing Planck sky maps, which will have lasting value in the field. Spider’s second flight will also incorporate significant upgrades to the cryostat and gondola hardware. We expect Spider to be able to detect or constrain primordial gravitational waves at the at 3 confidence level (Fig. 3, Right). The results obtained in this work were possible thanks to the unique opportunity to study the CR environment from the stratosphere, for the first time with TESs, given by the data collected during the first successful Spider campaign. The analysis presented here will help the design and deployment of this detector’s technology on future satellite mission.
Acknowledgements.
Spider is supported in the U.S. by the National Aeronautics and Space Administration under grants NNX07AL64G, NNX12AE95G, and NNX17AC55G issued through the Science Mission Directorate and by the National Science Foundation through PLR-1043515. Logistical support for the Antarctic deployment and operations was provided by the NSF through the U.S. Antarctic Program. Cosmic ray response studies are supported by NASA under grant 14-SAT14-0009. Support in Canada is provided by the National Sciences and Engineering Council and the Canadian Space Agency. Support in Norway is provided by the Research Council of Norway. Support in Sweden is provided by the Swedish Research Council through the Oskar Klein Centre (contract no. 638-2013-8993). KF acknowledges support from DoE grant DE-SC0007859 at the University of Michigan. The collaboration is grateful to the British Antarctic Survey, particularly Sam Burrell, for invaluable assistance with data and payload recovery after the 2015 flight. We also wish to acknowledge the generous support of the David and Lucile Packard Foundation, which has been crucial to the success of the project.References
- 1 Dodelson, S., Easther, R., Hanany, S., et al., Astro2010: The Astronomy and Astrophysics Decadal Survey
- 2 BICEP2/Keck Collaboration and Planck Collaboration, Ade, P.A.R., Aghanim, N., Ahmed, Z. et al., Physical Review Letters, 114, 10, (2015), DOI: 10.1103/PhysRevLett.114.101301
- 3 Planck Collaboration, Ade, P.A.R., Aghanim, N., Arnaud, M. et al., Astronomy & Astrophysics, , 594 , 65, (2016), DOI: 10.1051/0004-6361/201525898
- 4 Filippini, J. P., Ade, P. A. R., Amiri, M., et al., Proc. SPIE, 7741, (2010), DOI: 10.1117/12.857720
- 5 Fraisse, A. A., Ade, P. A. R., Amiri, M., et al., Journal of Cosmology and Astroparticle Physics, 4, 047 (2013)
- 6 Rahlin, A. S., Ade, P. A. R., Amiri, M., et al., Proc. SPIE, 9153, (2014), DOI: 10.1117/12.2055683
- 7 Guth, A. H., PRD, 23, 347-356, (1981), DOI: 10.1103/PhysRevD.23.347
- 8 Bock, J., Aljabri, A., Amblard, A., et al., arXiv:0906.1188 (2009)
- 9 Soler, J.D., Ade, P.A.R., Amiri, M. et al., Proc. SPIE, 9145, (2014), DOI: 10.1117/12.2055413
- 10 Shariff, J. A., Ade, P. A. R., Amiri, M., et al., Proc. SPIE, 9145, (2014), DOI: 10.1117/12.2055166
- 11 Gandilo, N. N., Ade, P. A. R., Amiri, M., et al., Proc. SPIE, 9145, (2014), DOI: 10.1117/12.2055156
- 12 Gudmundsson, J.E., Ade, P.A.R., Amiri, M. et al., Cryogenics, 72, 65-76, (2015), DOI: 10.1016/j.cryogenics.2015.09.002
- 13 Yoon, K. W., Ade, P. A. R., Barkats, D. et al., Proc. SPIE, 6275, (2006), DOI: 10.1117/12.672652
- 14 Keating, B. G., Ade, P.A.R., Bock, J.J. et al., Proc. SPIE, 4843, 284-295, (2003), DOI: 10.1117/12.459274
- 15 BICEP2 Collaboration, Ade, P. A. R., Aikin, R. W., et al., Astrophys. J, 792, 62 (2014), DOI: 10.1088/0004-637X/792/1/62
- 16 Ade, P. A. R., Pisano, G., Tucker, C., & Weaver, S., Proc. SPIE, 6275 (2006), DOI: 10.1117/12.673162
- 17 Bryan, S., Ade, P., Amiri, M. et al., Review of Scientific Instruments, 87, (2016), DOI: 10.1063/1.4939435
- 18 Bryan, S. A., Ade, P. A. R., Amiri, M., et al., Proc. SPIE, 7741, (2010), DOI: 10.1117/12.857837
- 19 BICEP2 Collaboration and Keck Array Collaboration and Spider Collaboration, Ade, P.A.R., Aikin, R.W., Amiri, M., The Astrophysical Journal, 812, 176, pp. 17, (2015), DOI: 10.1088/0004-637X/812/2/176
- 20 Battistelli, E. S., Amiri, M., Burger, B. et al., Journal of Low Temperature Physics, 151, 3, pp. 908–914, (2008), DOI: 10.1007/s10909-008-9772-z
- 21 de Korte, P. A. J., Beyer, J., Deiker, S., et al., Review of Scientific Instruments, 74, 3807 (2003), DOI: 10.1063/1.1593809
- 22 BICEP2 Collaboration; Keck Array Collaboration; SPIDER Collaboration, Ade, P.A.R., Aikin, R.W., Amiri, M. et al, The Astrophysical Journal, 812, 17, (2015), DOI: 10.1088/0004-637X/812/2/176
- 23 Runyan, M.C., Ade, P.A.R., Amiri, M. et al., Proc. SPIE, 7741, (2010), DOI: 10.1117/12.857715
- 24 Nagy, J. M., Ade, P. A. R., Amiri, M., et al., Astrophys. J, 844, 151 (2017), DOI: 10.3847/1538-4357/aa7cfd
- 25 Lamarre, J. M., Puget, J. L., Ade, P.A.R., Astronomy & Astrophysics, 520, 20 (2010), DOI: 10.1051/0004-6361/200912975
- 26 Planck Collaboration, Ade, P.A.R., Aghanim, N., Arnaud, M. et al., Astronomy & Astrophysics, , 571 , A10, (2014), DOI: 10.1051/0004-6361/201321577
- 27 Perinati, E., Mineo, T., Colasanti, L. et al., Proc. SPIE, 7732, (2010), DOI: 10.1117/12.856393
- 28 Catalano, A., Ade, P. and Atik, Y. et al., Journal of Low Temperature Physics, 176, 5, pp. 773-786, (2014), DOI: 10.1007/s10909-014-1116-6
- 29 Hubmayr, J., Austermann, J.E., Beall, J.A. et al., Proc. SPIE, 9914, (2016), DOI: 10.1117/12.2231896
- 30 Bergman, A.S. , Ade P.A.R., Akers, S. et al., Journal of Low Temperature Physics, This Special Issue (2017)