Circumnuclear Multi-phase Gas in Circinus Galaxy I: Non-LTE calculations of CO lines
Abstract
In this study, we investigate the line emissions from cold molecular gas based on our previous “radiation-driven fountain model” (Wada et al., 2016), which reliably explains the spectral energy distribution of the nearest type 2 Seyfert galaxy, the Circinus galaxy. Using a snapshot of the best-fit radiation-hydrodynamic model for the central pc, in which non-equilibrium X-ray-dominated region chemistry is solved, we conduct post-processed, non-local thermodynamic equilibrium radiation transfer simulations for the CO lines. We obtain a spectral line energy distribution with a peak around , and its distribution suggests that the lines are not thermalized. However, for a given line-of-sight, the optical depth distribution is highly non-uniform between and . The CO-to-H2 conversion factor (), which can be directly obtained from the results, is not a constant and depends strongly on the integrated intensity, and it differs from the fiducial value for local objects. exhibits a large dispersion of more than one order of magnitude, reflecting the non-uniform internal structure of a “torus.” We also found that the physical conditions differ between grid cells on a scale of a few parsecs along the observed lines of sight; therefore, a specific observed line ratio does not necessarily represent a single physical state of the ISM.
Subject headings:
galaxies: active – galaxies: nuclei – galaxies: ISM – radio lines: ISM – radiative transfer1. INTRODUCTION
In the standard picture of active galactic nuclei (AGNs), the nucleus is hypothetically surrounded by an optically and geometrically thick “dusty torus.” Except for a few nearby AGNs, such as NGC 1068, NGC 1097 and the Circinus galaxy (e.g., Jaffe et al., 2004; Tristram et al., 2014; García-Burillo et al., 2016; Imanishi et al., 2016; Gallimore et al., 2016; Izumi et al., 2017), dust and molecular emissions have not yet been spatially resolved; therefore, the real geometrical and internal structures of the tori are still unclear. The origin and physical mechanism of the obscuring material around the nucleus have been widely discussed by many authors (e.g., Krolik & Begelman, 1988; Pier & Krolik, 1993; Ohsuga & Umemura, 2001; Lawrence & Elvis, 2010; Hopkins et al., 2012). Recent time-dependent radiation-(magneto)hydrodynamic simulations commonly suggested that a static, donut-like torus is not reproduced, because on sub-parsec to tens of parsec-scales, the ISM is very dynamic (Wada, 2012; Wada et al., 2016; Namekata & Umemura, 2016; Dorodnitsyn et al., 2012, 2016; Dorodnitsyn & Kallman, 2017; Chan & Krolik, 2016, 2017), although there are non-negligible differences in the results among the simulations.
Wada (2012) proposed that the obscuring structures around AGNs, in which outflowing and inflowing gases are driven by radiation from the accretion disk, form a geometrically thick disk on the scale of a few parsecs to tens of parsecs. The quasi-steady circulation of gas, i.e., the “radiation-driven fountain,” may obscure the central source, therefore, the differences in the spectral energy distributions (SEDs) of typical type 1 and 2 Seyfert galaxies are reliably explained (Schartmann et al., 2014). Wada (2015) showed that the observed properties of obscured AGNs change as a function of their luminosity because of fountain flows, and the results were compared with recent X-ray and infrared observations (see also Ramos Almeida, & Ricci, 2017).
Wada et al. (2016) (hereafter W16) applied this radiation-driven fountain model to the Circinus galaxy, which is the nearest ( 4 Mpc) type-2 Seyfert galaxy. We studied, for the first time, the non-equilibrium chemistry for the X-ray-dominated region (XDR) with supernova feedback in the central pc111The photon dominated region (PDR) chemistry and shock chemistry are not considered in the present model.. A double hollow cone structure occupied by an inhomogeneous, diffuse ionized gas is formed, and it is surrounded by geometrically thick () atomic/molecular gas. Dense molecular gases (e.g. H2 and CO with cm-3) are mostly concentrated around the equatorial plane, and atomic gas (e.g. H0 and C0) extends with a larger scale height. The energy feedback from supernovae enhances its scale height. In W16, by applying post-processed three-dimensional (3-D) radiation transfer calculations, we found “polar” emission in the mid-infrared band (12 ), which is associated with bipolar outflows, as suggested in recent interferometric observations of nearby AGNs (Hönig et al., 2013; Tristram et al., 2014, see also Stalevski et al. (2017) for a theoretical model). We also confirmed that the viewing angle for the nucleus should be larger than 75∘ (i.e., close to edge-on) in order to explain the observed SED and 10 absorption feature of the Circinus galaxy (Prieto et al., 2010).
In this study, we focus on the structures of the cold, molecular gas located in the outskirts of the infrared bright region in the best-fit model for the Circinus galaxy. In order to compare with future high-resolution observations of the molecular gas, we performed 3-D, non-local thermodynamic equilibrium (non-LTE) radiative transfer calculations for the 12CO lines. Spatial distributions of the multi- line intensity, line ratios, spectral line energy distribution (SLED), and CO-to-H2 conversion factor are discussed in the central ten parsecs with a sub-parsec resolution. The results can be a theoretical reference to understand observations of the Atacama Large Millimeter/submillimeter Array (ALMA), whose spatial resolution can now reach a few parsecs in nearby AGNs. Detailed comparisons between the models and our Cycle-4 observations by ALMA will be discussed in a subsequent paper (Izumi et al., in preparation). The results of other molecules (e.g., HCN) and atomic gases (e.g., neutral carbon and hydrogen) will be discussed elsewhere.
2. NUMERICAL METHODS AND MODELS
2.1. Input model: Radiation-driven fountain
We use a snapshot of our radiation-driven fountain model, which reliably explains the features of the SED of the Circinus galaxy (see details in W16). The results suggest that the viewing angle for the gas disk should be 75∘ or higher. We use our 3-D Eulerian hydrodynamic code (Wada, 2012, 2015), with a uniform grid that accounts for radiative feedback processes from the central source using a ray-tracing method. We include the non-equilibrium XDR chemistry (Maloney, Hollenbach, & Tielens, 1996; Meijerink & Spaans, 2005) for 2563 zones (resolution of 0.125 pc). Self-gravity of the gas is ignored because it is not essential for the gas dynamics in the radiation-driven fountain (see also Namekata & Umemura (2016)). Supernova feedback is also implemented. Cooling functions for 20 K K (Meijerink & Spaans, 2005; Wada et al., 2009) and solar metallicity are also assumed. At every time step, the gas density, and 222If the temperature of the dust irradiated by a central source exceeds , we assume the dust is sublimated, and no dust is assumed for K, because of dust sputtering. , and ionization parameters in the 2563 grid cells are passed to the chemistry module.
The central point mass is assumed to be , which is comparable to the value estimated from the maser observations (Greenhill et al., 2003), in Circinus. The total gas mass is . The Eddington ratio of 0.2 and the bolometric luminosity of erg s-1 are fixed during the calculation.
Here we assume three independent radiation fields; 1) non-spherical UV radiation emitted from a thin accretion disk, 2) spherically symmetric X-ray radiation emitted from the corona of the accretion disk (Netzer, 1987; Xu, 2015), and 3) uniform far UV due to star forming regions exisited in the circumnuclear disk. All these three components are assumed to be time-independent. The first component plays an important role for the radiation pressure to the dust, and the second one mainly contributes for heating the gas depending on the column density, and also for the non-equilibrium XDR chemistry333We use a selection of reactions from the chemical network described by Meijerink & Spaans (2005); Ádámkovics et al. (2011) for 25 species: H, H2, H+, H, H, H-, e-, O, O2, O+, O, O2H+, OH, OH+, H2O, H2O+, H3O+, C, C+, CO, Na, Na+, He, He+, and HCO+.. The SED of the AGN and the dust absorption cross section are taken from Laor & Draine (1993). The UV flux is assumed to be angle dependent, i.e. (Netzer, 1987), where denotes the angle from the rotational axis (-axis), which is calculated for all grid cells using rays. The UV and X-ray fluxes are calculated from the bolometric luminosity (Marconi et al., 2004). The total X-ray luminosity (2–10 keV) is erg s-1. The temperature of the interstellar dust at a given position irradiated by the central UV radiation is calculated by assuming thermal equilibrium (e.g., Nenkova et al., 2008), therefore, it is not necessarily equivalent to .
For simplicity, the third component of the radiation field, i.e. FUV, is assumed to be uniform. In stead of solving the radiation transfer for FUV in the inhomogeneous media with multi-radiation source, which is beyond our numerical treatment, we change its strength from to , where is the incident FUV field normalized to the local interstellar value ( erg cm-2 s-1), and see if it affects the results (see §4.2.).
The 3-D hydrodynamic grid data (i.e., density, temperature, abundances, and three components of velocity) of the 2563 grid cells are averaged to produce 1283 grid cells (i.e., the spatial resolution is 0.25 pc) in order to reduce the computational cost. This is passed to the 3-D non-LTE line transfer code, as described in the next section, to derive the line intensities.
2.2. Non-LTE line transfer
The numerical code of the 3-D line transfer calculations is the same as that used by Wada & Tomisaka (2005) and Yamada et al. (2007), which is based on the Monte–Carlo and long-characteristic transfer code (Hogerheijde, & van der Tak, 2000). The statistical equilibrium rate equations and the transfer equations are iteratively solved using photon packages (sampling rays) propagating into each grid cell. We solve the rate equations for the energy levels of 12CO from to 15. Once the radiation field and optical depth are determined for all grid cells, we “observe” it from arbitrary directions, and 3-D data cubes (i.e., positions and line-of-sight velocity) are obtained for selected transitions.
There are 1000 sampling rays for each grid cell. The level populations are converged with an error of for and for after ten iterations. The micro-turbulence, i.e., a hypothetical turbulent motion inside one grid cell, is a free parameter, which determines the shape of the line profile function and varies from 1 to 20 km s-1. As a fiducial value, we assume km s-1, and the effect of changing is discussed in §4. In contrast to previous papers (Wada & Tomisaka, 2005; Yamada et al., 2007), we use here the non-uniform abundance distribution for 12CO, which is obtained in the original radiation-hydrodynamic simulations with XDR chemistry (W16). Note that is different from the typical velocity dispersion on several pc scales. In fact, the average velocity dispersion of the gas in the input model on a few pc is about 30 km s-1, which is consistent to the scale height of the cold ( K), molecular gas seen in Fig. 1. In the turbulent gas disk, the velocity dispersion is larger on larger scale as expected from the power-law energy spectrum (e.g. Wada et al., 2002). Therefore we expect that the velocity dispersion inside a grid cell should be smaller than the large scale velocity dispersion. The “large scale” bulk motion between grid cells in the disk is self-consistently considered in the non-LTE line transfer calculations.
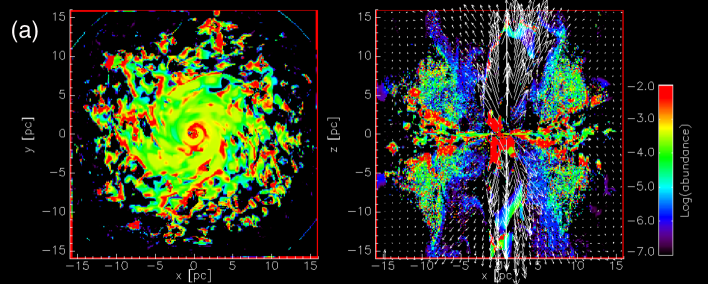
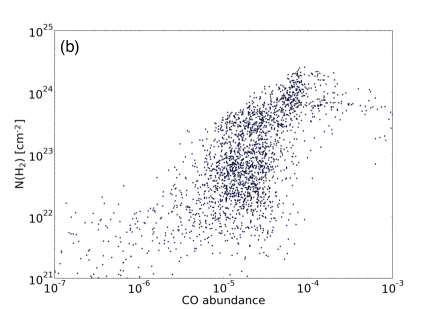
Figure 1a presents spatial distributions of the 12CO abundance with respect to molecular hydrogen in the input model assuming . As shown in Fig. 1b, the 12CO abundance is for most grid cells, but there is large scatter for a given column density of the inhomogeneous disk. Hereafter, “CO” represents 12CO.
3. RESULTS
3.1. Intensity distribution
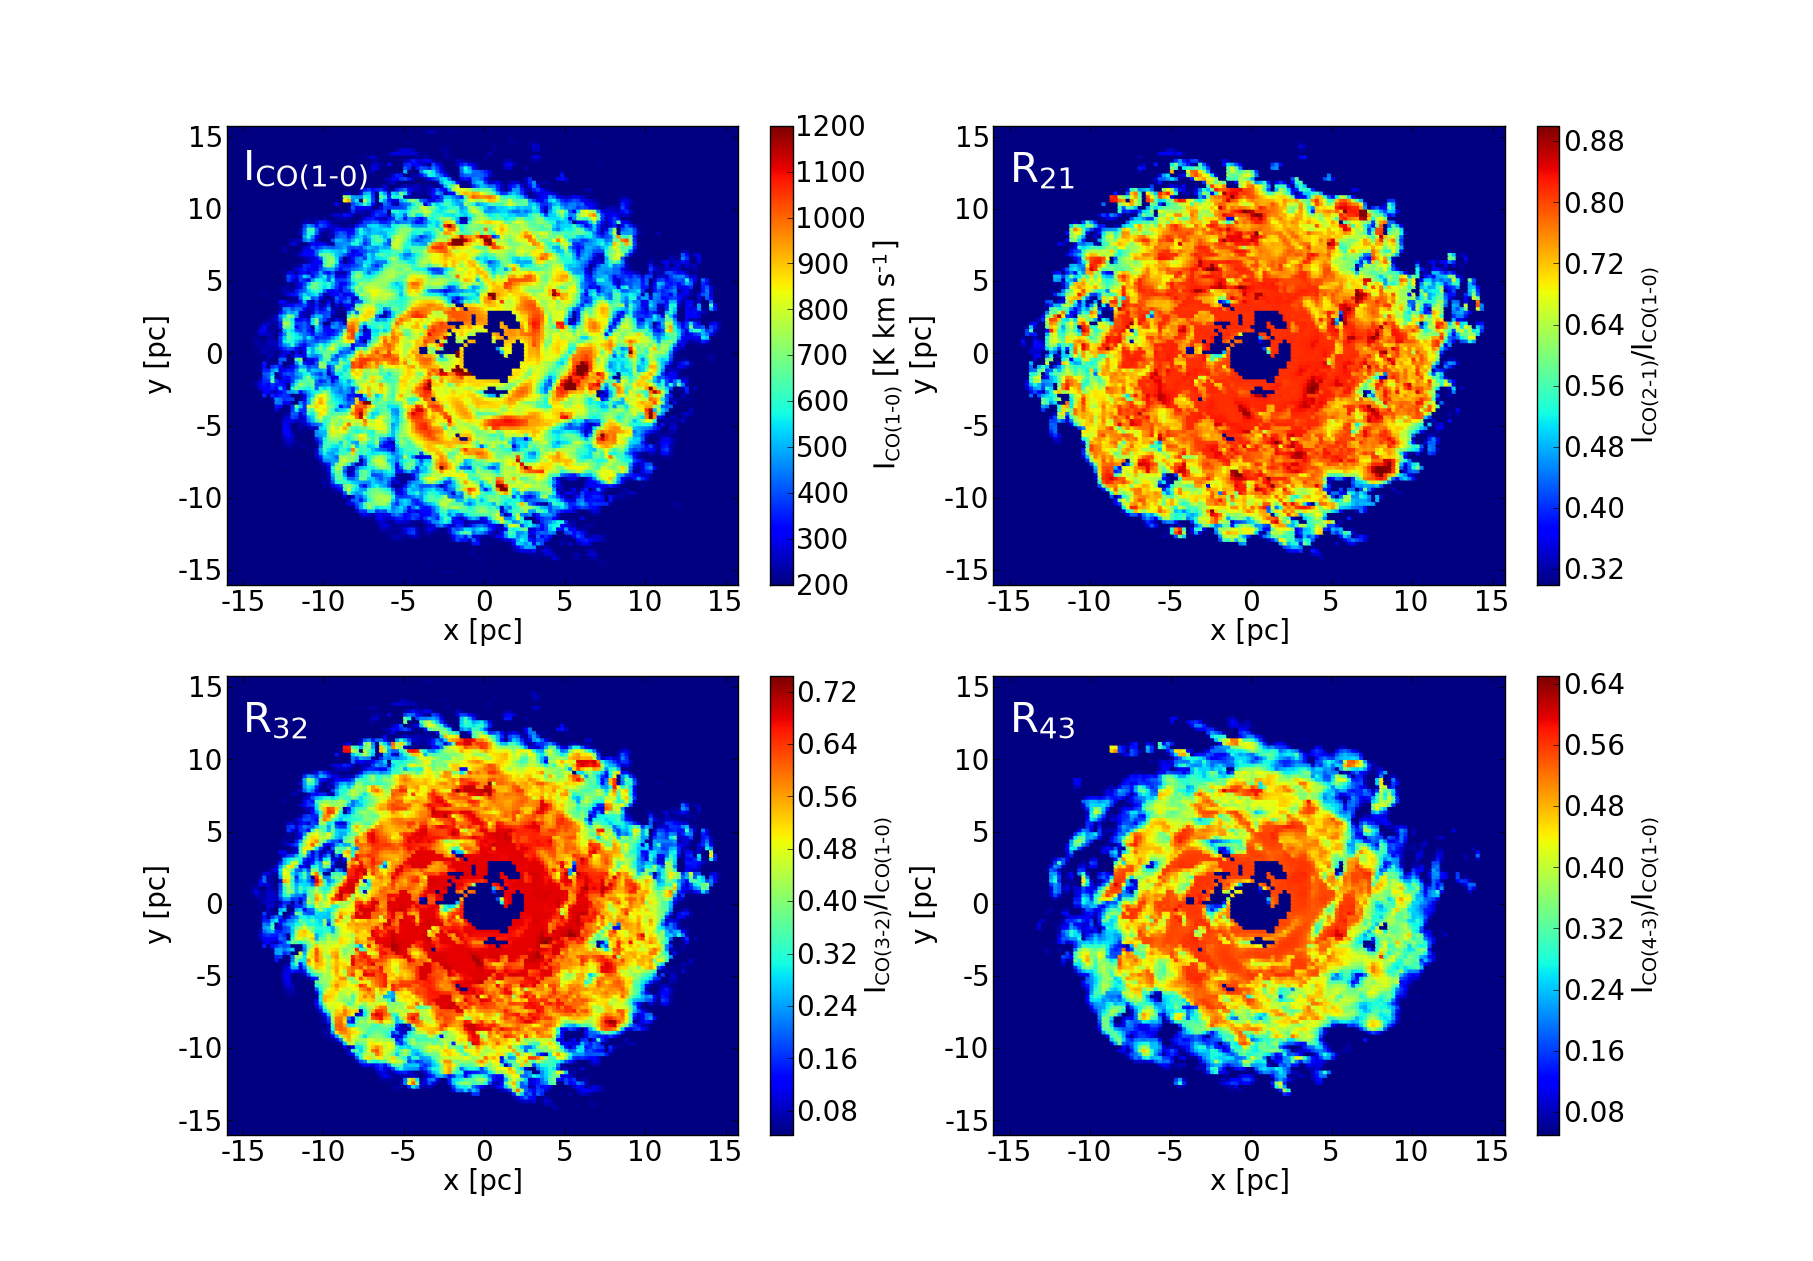
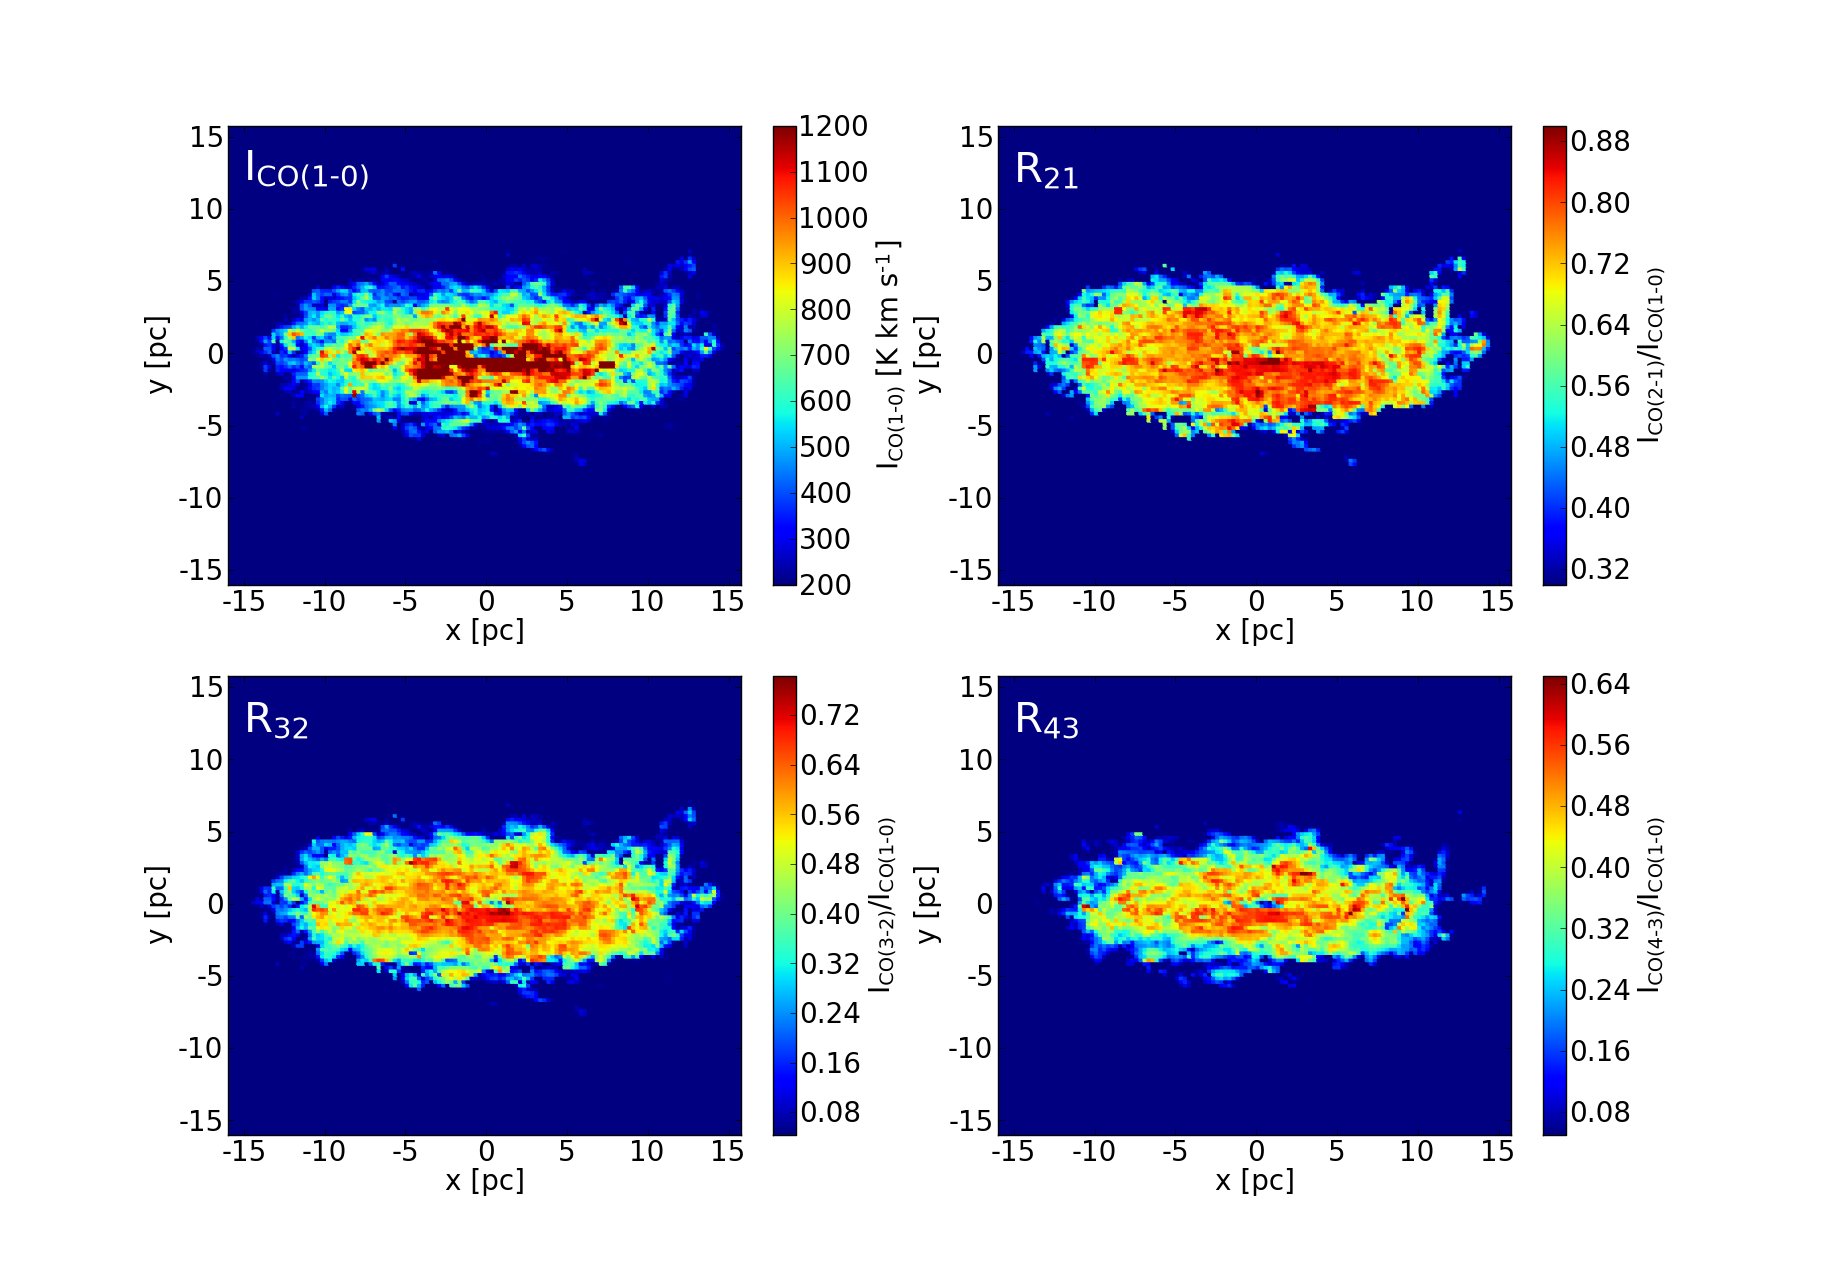
Figures 2 and 3 show the integrated intensity maps of CO (1-0) and the line ratio distributions ( 2-1/1-0, 3-2/1-0, and 4-3/1-0) in K km s-1 for the viewing angles (i.e., face-on) and 75∘, repspectively. The intensity distributions are morphologically similar between the lines. The face-on maps exhibit multi-arm spiral-like features with cloud-like high-density regions. Inhomogeneous structures are also prominent from . In the following results, , which is suggested by comparing with the SED of the Circinus galaxy (W16), is assumed, if not stated. We also notice that the most CO emissions originate from the disk region, and there are no dense “molecular winds” outflowing along the rotational axis. This would be interesting to understand the origin of the kpc-scale molecular outflows observed in nearby AGNs, such as NGC 1068(García-Burillo et al., 2014) (see also discussion in §4.3).
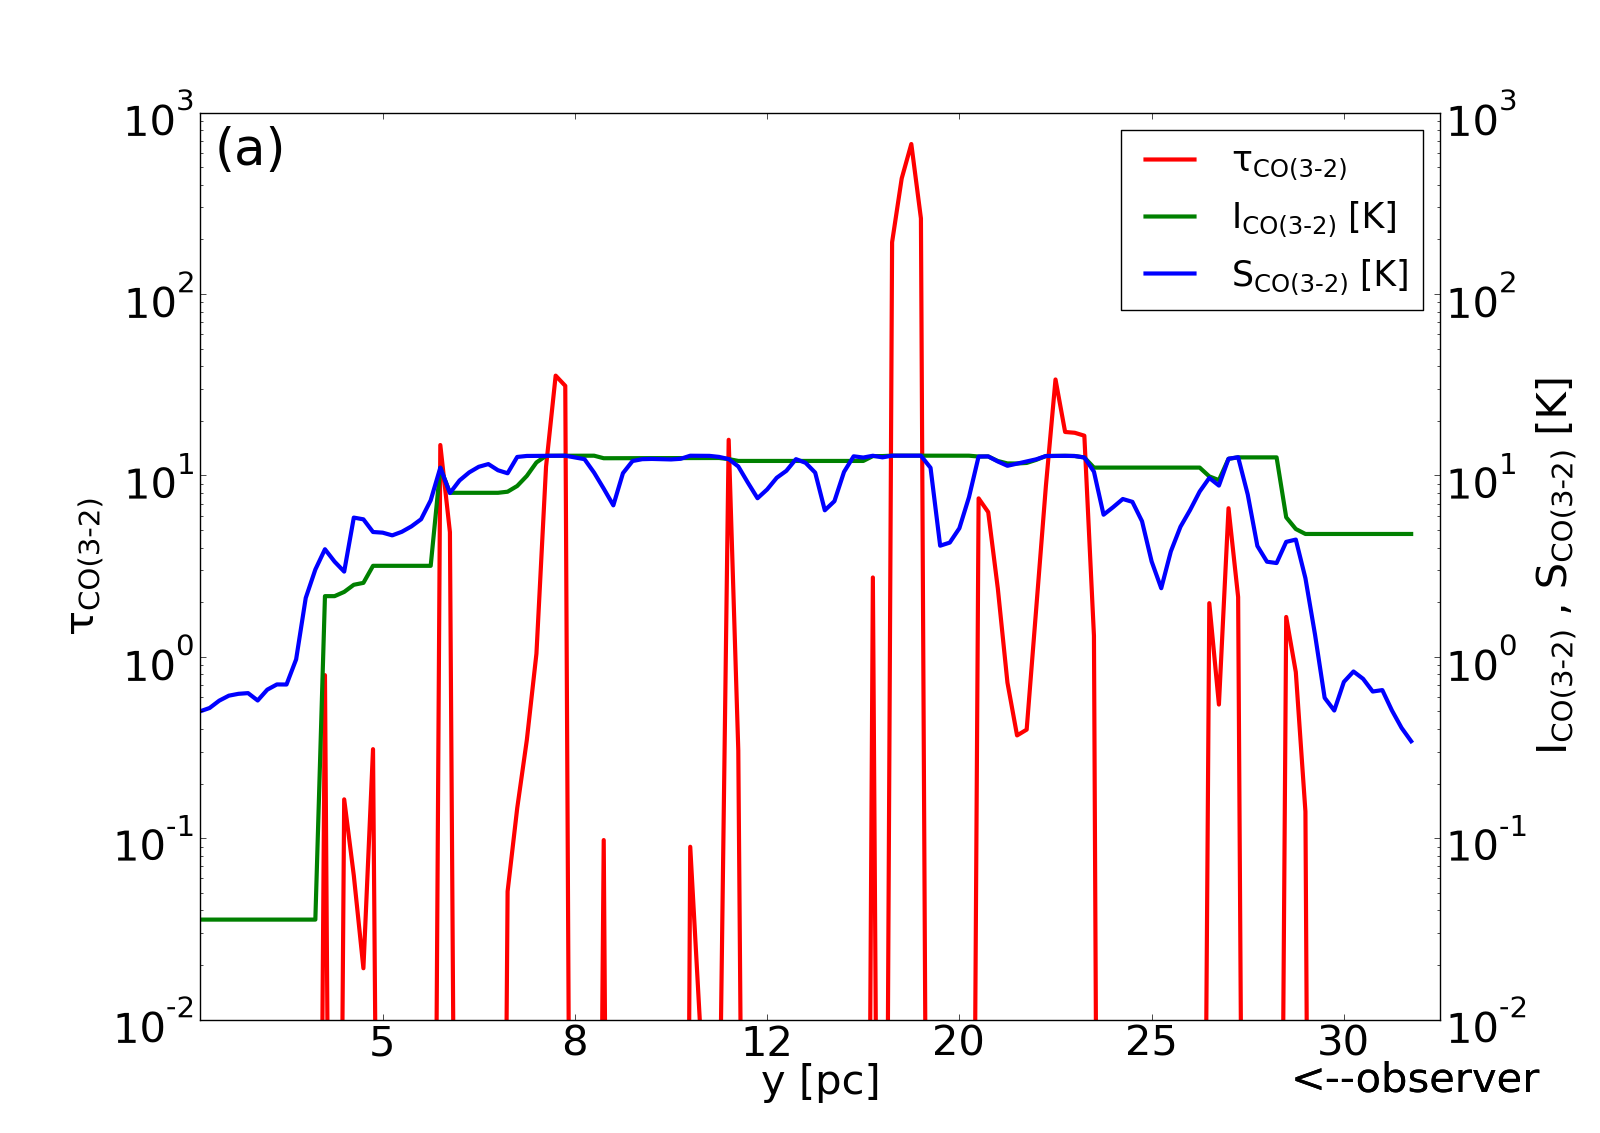
In Fig. 4, the changes in the intensity , source function , and optical depth of CO (3-2) along two different rays toward the observer in a velocity channel ( km s-1 around the systematic velocity) are shown. Along the rays, the optical depth spatially changes by many orders of magnitude. There are several optically thick regions, which are non-uniformly distributed, and they form several discrete “clouds” along this sample line-of-sight (Fig. 4a). The intensity increases from the background (i.e., CMB) at pc, where , and is saturated at the clouds where or stays constant if . At the observer side ( pc), the intensity exceeds the source function and is therefore absorbed at the nearside grids depending on the local optical depth. A relatively optically thin case is also shown in Fig. 4b. The intensity increases following at the far side (i.e., pc), and it is slightly absorbed at the near side. This represents the characteristic feature of the line transfer effect through a highly non-uniform medium. It is then inferred that the observed integrated intensity in terms of the line-of-sight velocity does not necessarily represent a single state of the internal structure of the circumnuclear disk along a given line-of-sight (see also §3.4).
3.2. X-factor
As it is difficult to directly observe emission from cold molecular hydrogen, the line intensity of CO (often ) is used to estimate the column density of H2 in giant molecular clouds in our Galaxy, as well as the total molecular mass in external galaxies. The CO-to-H2 conversion factor is often represented as for the number density or for the mass density. Based on various independent methods, it is estimated for the Galactic disk that cm or , using the CO(1-0) intensity, and the error could be within a factor of 2–3 for molecular clouds in our Galaxy (Bolatto et al., 2013). Although this fiducial value is often also used for observations of external galaxies, it should not be the same in different environments, such as the ISM around AGNs or in starburst regions. Here, we present an independent estimate of the conversion factor using the line transfer calculations shown in §3.1. One should note that the values could be the case for the central region of the Circinus galaxy and could also be applied to low-luminosity AGNs associated with nuclear starbursts, but it is not necessarily the case for all types of AGNs, such as luminous quasars.
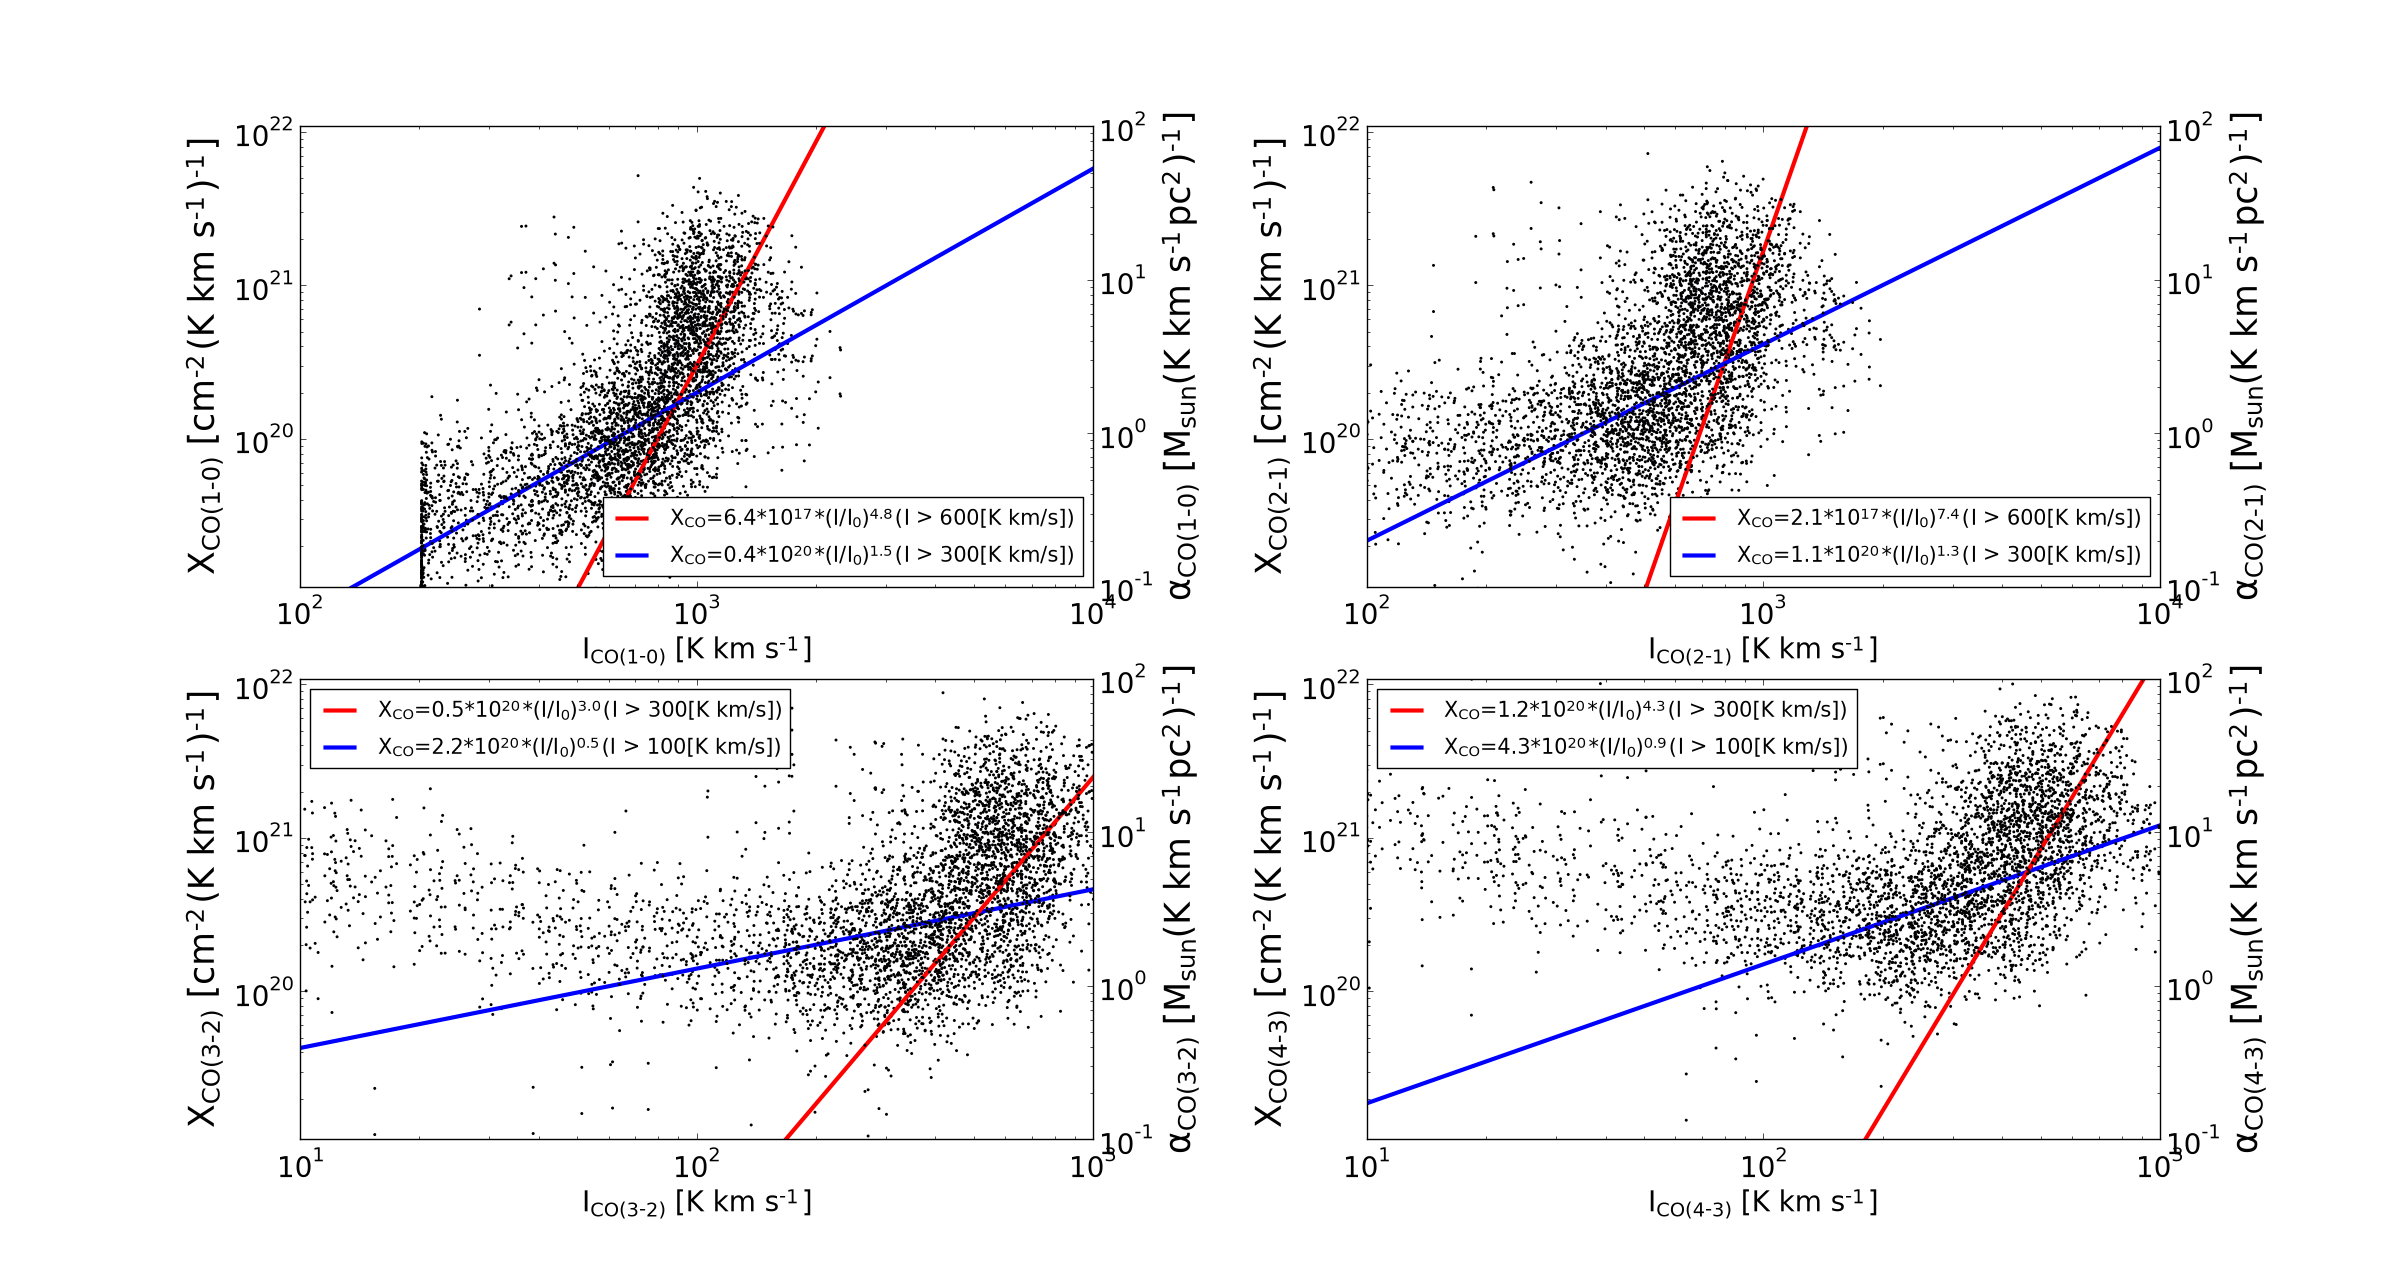
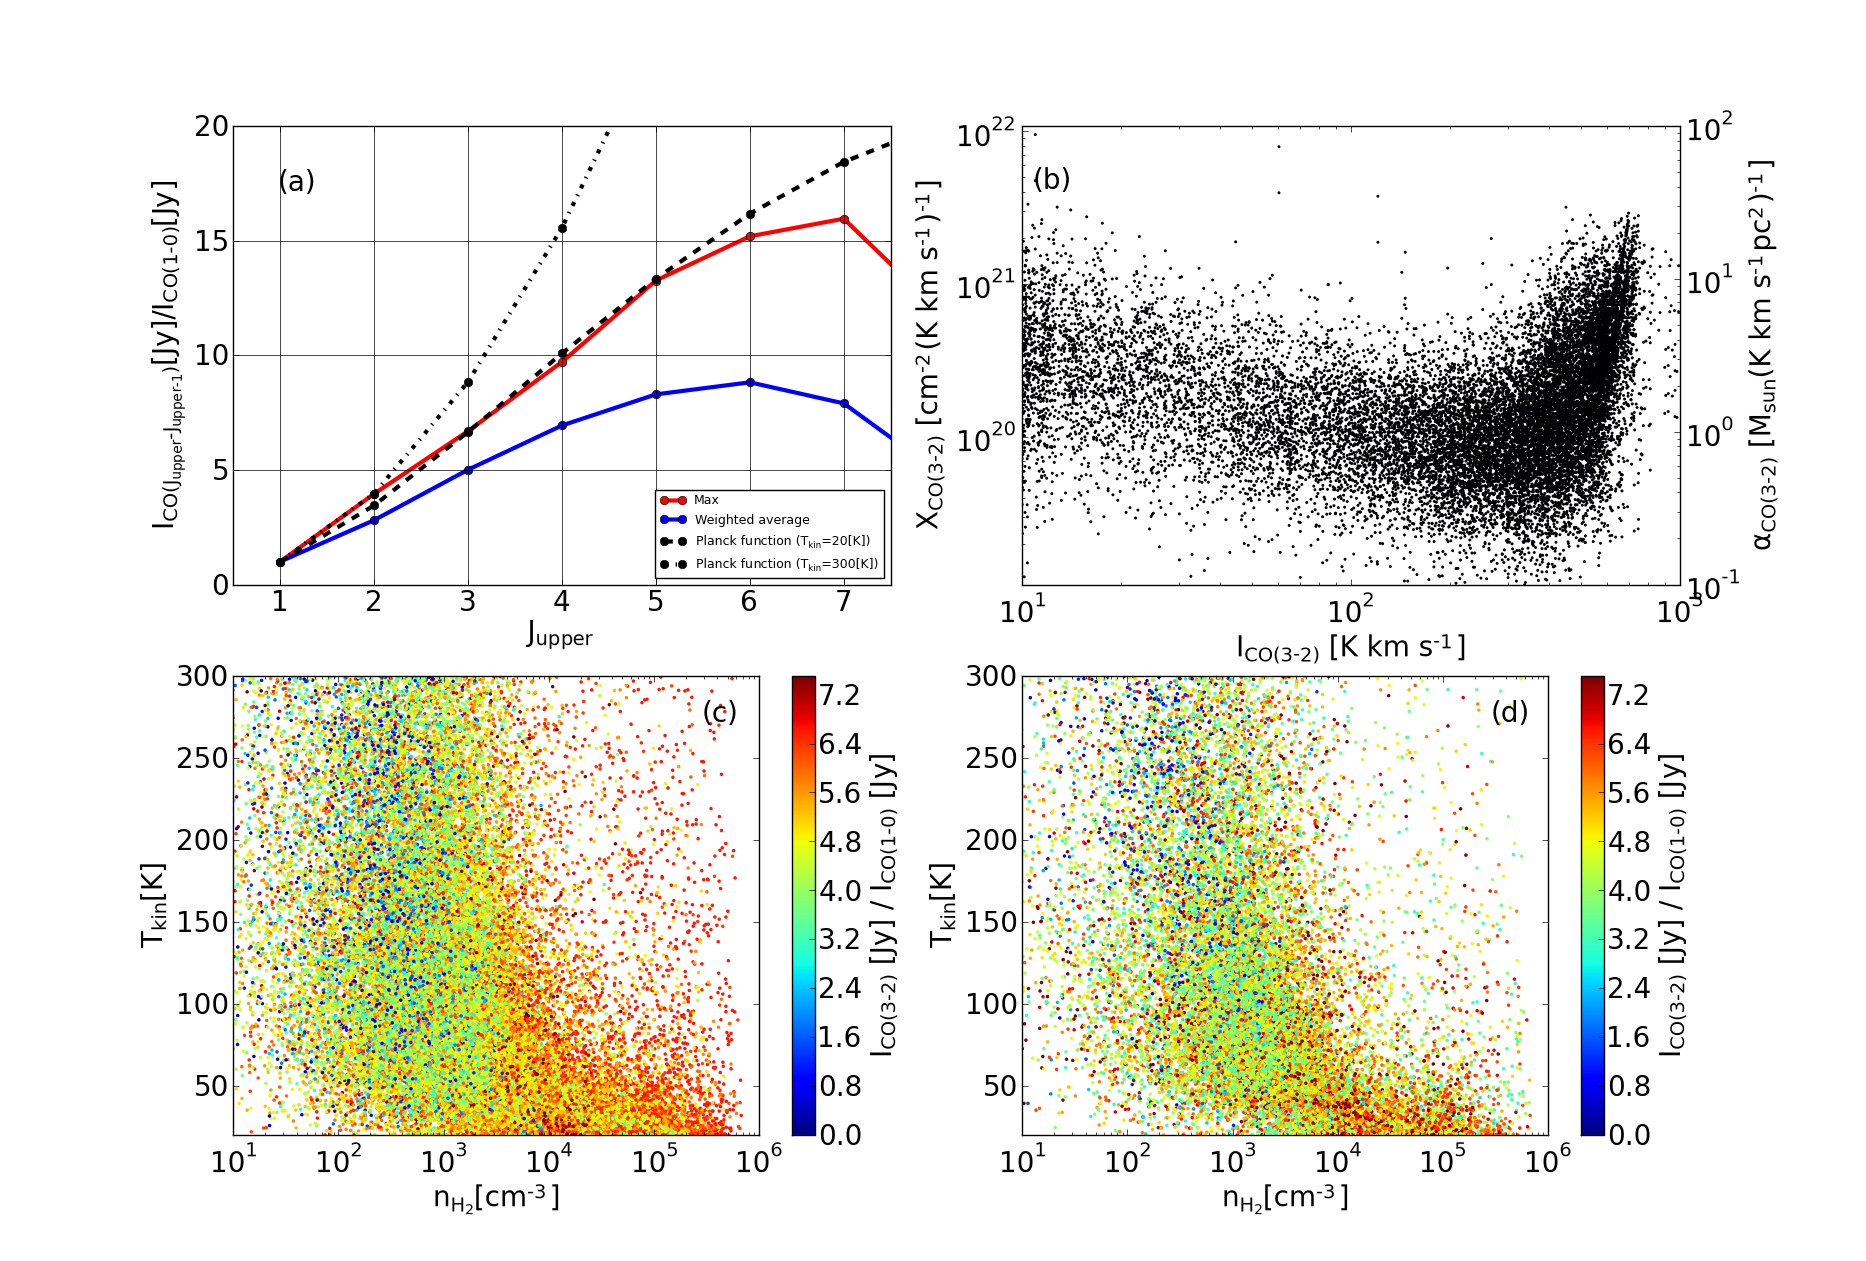
Figure 5 shows XCO (and for the right vertical axis) as a function of the line intensities of CO(1-0), CO(2-1), CO(3-2), and CO(4-3) based on the non-LTE line intensity calculations and H2 density in the input data. It is apparent that the CO-to-H2 conversion factor is not a constant and strongly depends on the line intensity, especially for the low- lines. If we fit the conversion factor for with a single power law, we can obtain cm , or , where the integrated intensity K km s-1. For , cm , or , where the integrated intensity K km s-1. Here, we assume 10 km s-1 and . For other fitting results, see Table 1444 One may notice in the X-factor for CO(3-2) and CO(4-3) that some fraction of grid cells, where the intensity is less than , do not follow the positive power law. This corresponds to the faint, optically thin outer edge of the disk (see Fig. 3)..
One should also note that the dispersion of is more than one order of magnitude for a given intensity, which reflects the fact that the physical and chemical conditions are far from uniform in the circumnuclear disk and are also due to the effect of the line transfer in the inhomogeneous medium (§3.1 and Fig. 4). The strong positive dependence of the X-factor on the intensity implies that the lines are saturated with in optically thick, high density clumps, which are more frequent along the line of sight in bright regions, as seen in Fig. 4a. These conditions in the ISM around the AGN are in contrast with the local GMCs or molecular gas in the disks of normal galaxies, where the X-factor is often assumed as roughly constant.
We found that the X-factor does not strongly depend on the value of FUV () but tends to be smaller for larger (see Fig. 11e and Fig. 11f and discussion in §4.2).
.
| line | |||||
|---|---|---|---|---|---|
| 1-0 | 2.0 | 4.8 | 4.4 | 4.8 | 600 |
| 1-0 | 2.5 | 1.5 | 5.5 | 1.5 | 300 |
| 2-1 | 15.8 | 7.4 | 34.4 | 7.4 | 600 |
| 2-1 | 5.0 | 1.3 | 10.9 | 1.3 | 300 |
| 3-2 | 20.0 | 3.0 | 44.0 | 3.0 | 300 |
| 3-2 | 4.0 | 0.5 | 8.7 | 0.5 | 100 |
| 4-3 | 200.0 | 4.3 | 436.0 | 4.3 | 300 |
| 4-3 | 12.6 | 0.9 | 27.5 | 0.9 | 100 |
Note. — . The conversion factor in the intensity range of is fitted.
3.3. The CO ladder
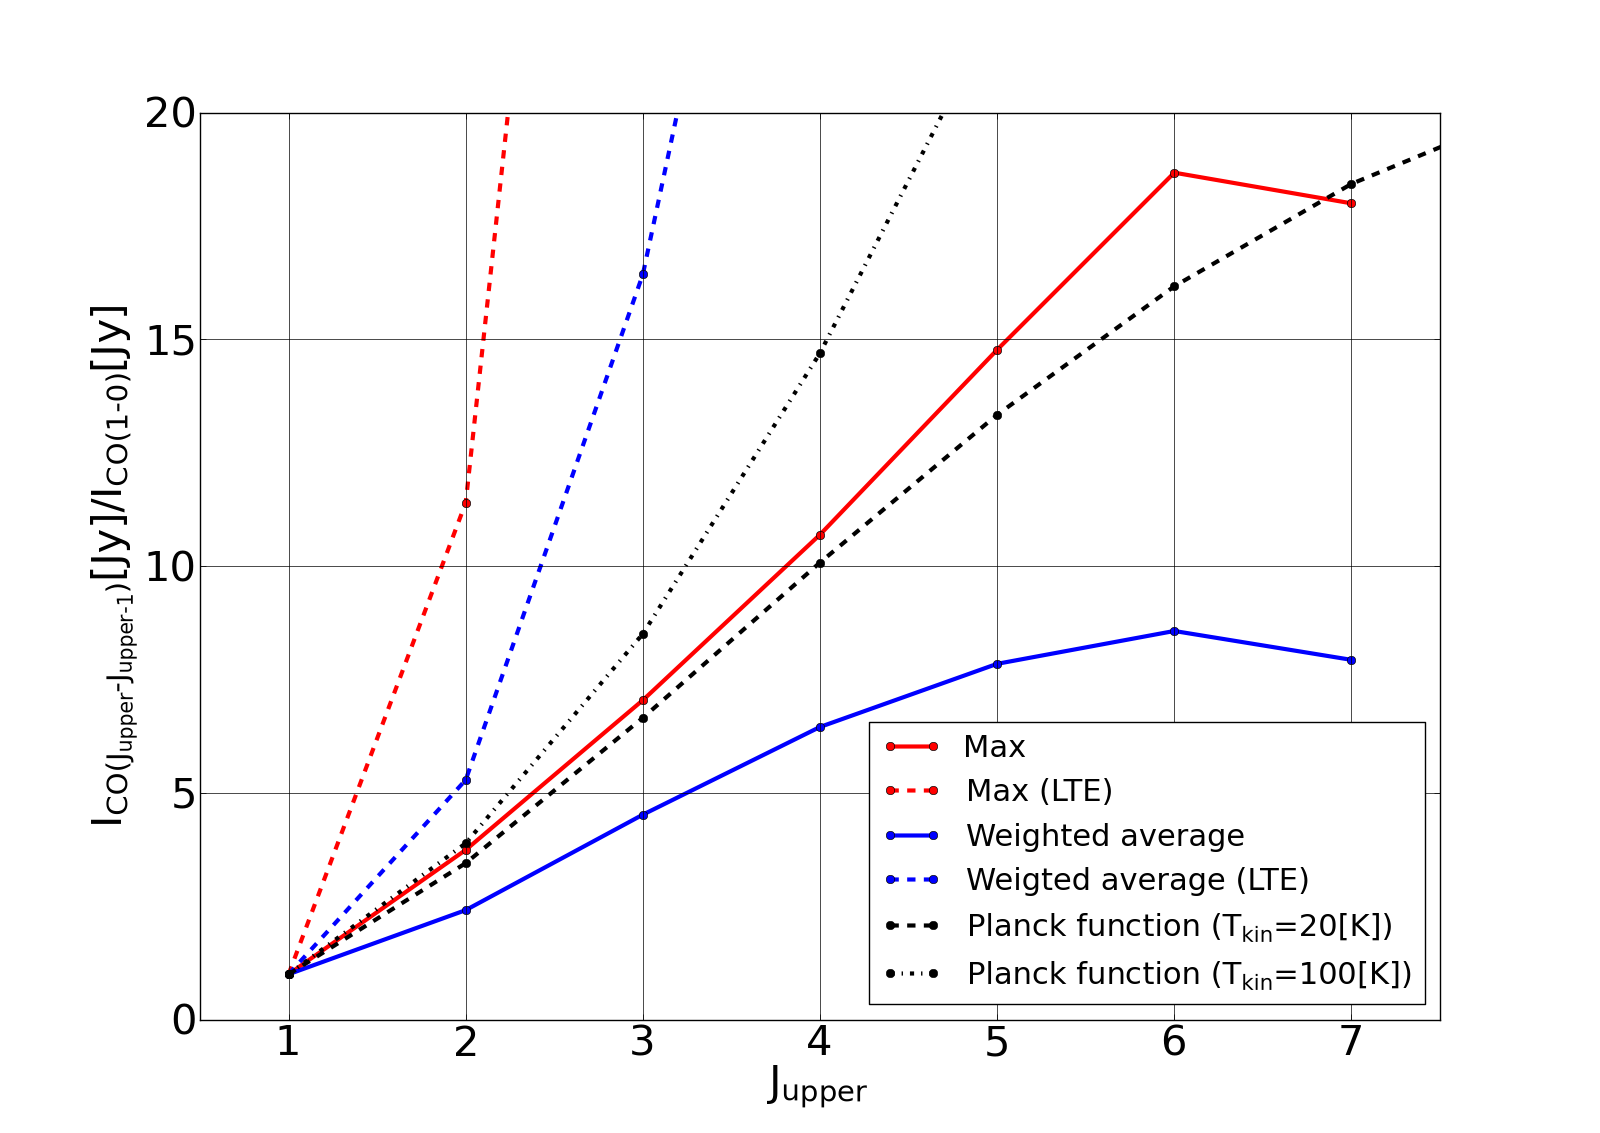
In Fig. 6, we show the total integrated intensity of the CO lines as a function of the rotational transition number , i.e., the SLED for the brightest spot and the intensity-weighted average value. Both show that the intensity with respect to CO(1-0) has a peak around . The SLED of the brightest spot is close to that for the gas in LTE with K (black dashed line). As shown by the weighted average (blue line) in the non-LTE case, most regions of the disk projected on the sky (see Fig. 2) are not thermalized. This is because the internal structures of the disk are considerably clumpy and the line of sight is mostly occupied with optically thin gas (see Fig. 4 and §3.1).
Note that if we assume LTE for all grid cells and calculate the line transfer, as for the non-LTE case, the resultant SLEDs (dashed blue and red lines) are very different. In a non-uniform medium with a large difference in optical depth, the LTE assumption in each grid cell does not necessarily cause the “observed” line ratios of the integrated intensities to be proportional to . In the present case, the CO(1-0) becomes relatively weaker than CO(3-2) because of the line transfer effect; as a result, the line ratios appear ’super-thermal’.
Zhang et al. (2014) showed the CO SLED using Atacama Pathfinder EXperiment (APEX) for the central 18” ( pc) of the Circinus galaxy and demonstrated that the observed 12CO SLED has a maximum at . Using the large velocity gradient (LVG) approximation, they suggested that the gas density of H2 is cm-3, the temperature is 80–400 K, and the velocity gradient is 1–25 km s-1 (assuming a uniform abundance of CO of ). As the radius of the observed region is ten times larger than that of the present model, we cannot directly compare our model with this APEX result. Moreover, the abundance distribution of CO should not be uniform as suggested by our result. However, the suggested ranges of the physical conditions are consistent with those in the high-density gas in our numerical model.
3.4. Physical conditions of the ISM inferred from line ratios
Line ratios are often used to infer the physical states (e.g., density, temperature, and velocity dispersion or gradient) of the ISM in Galactic and extra-galactic objects. For molecular lines, the numerical results with the LVG approximation or one-zone numerical code, such as RADEX (van der Tak et al., 2007), can be compared with the observed line ratios, taking the velocity gradient and fractional abundance as free parameters. In our 3-D model, the physical conditions differ between grid cells on a scale of a few parsecs along the observed lines of sight; therefore, a specific observed line ratio does not necessarily represent a single physical state of the ISM.
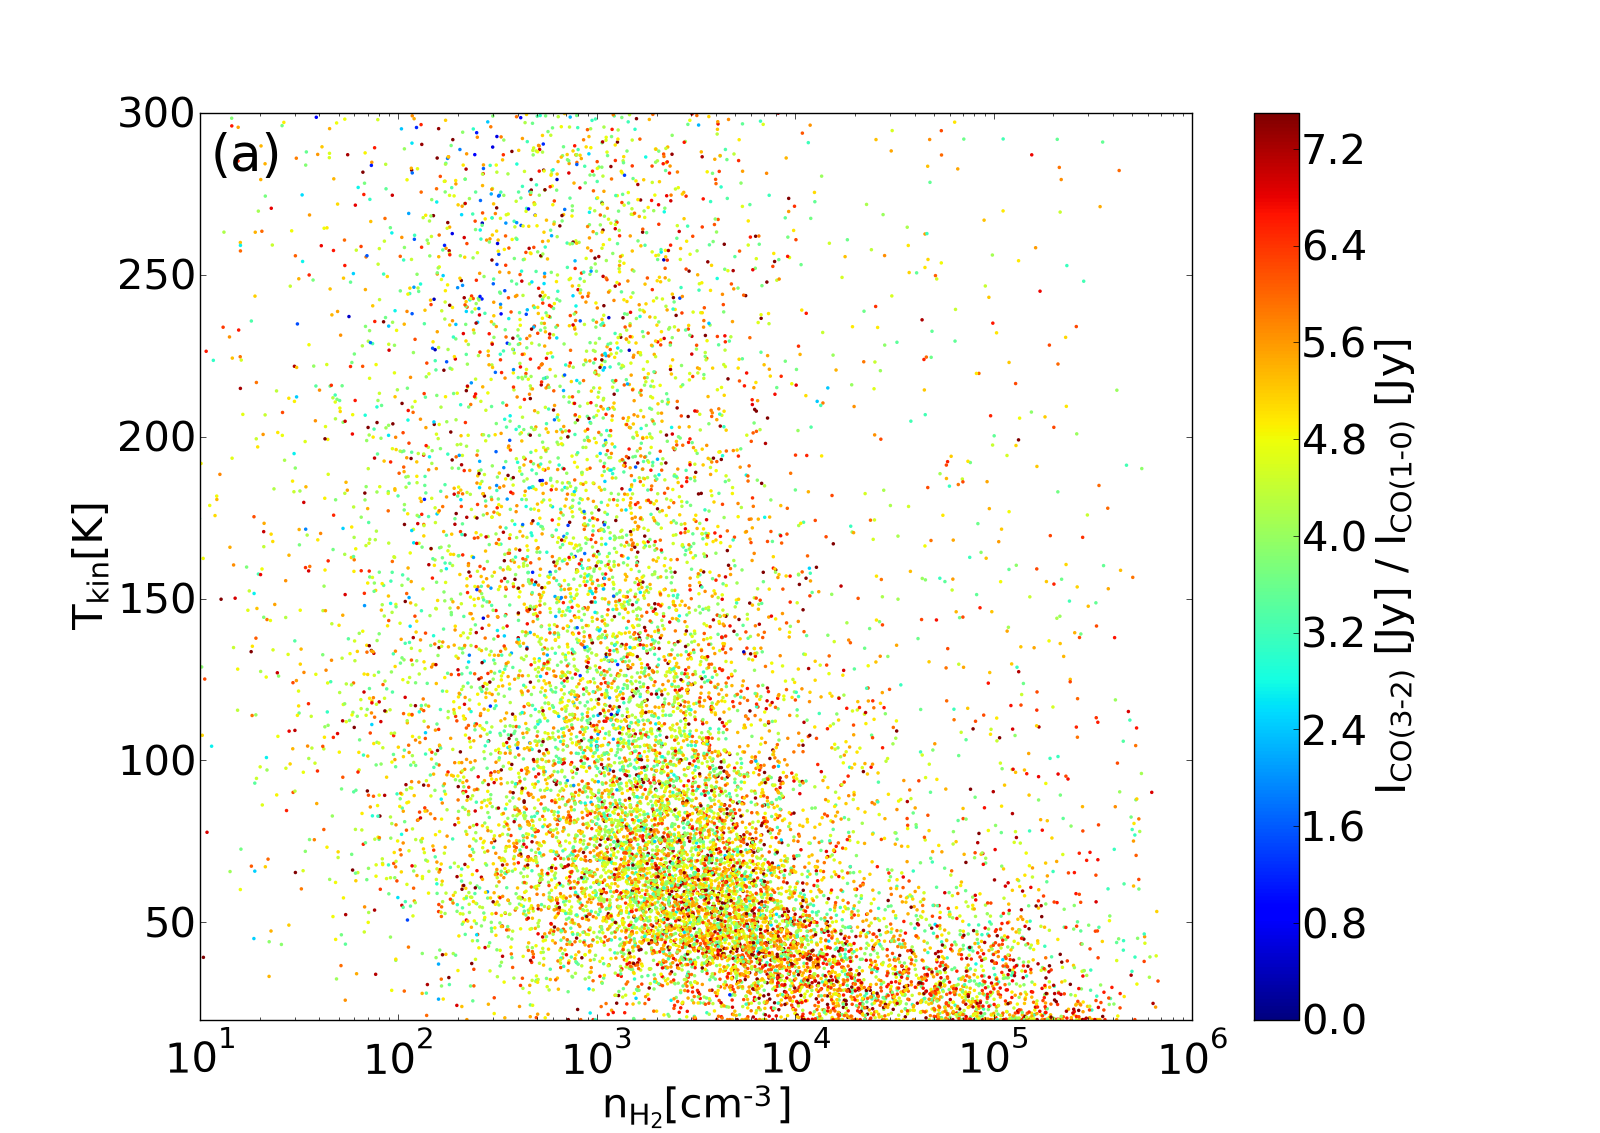
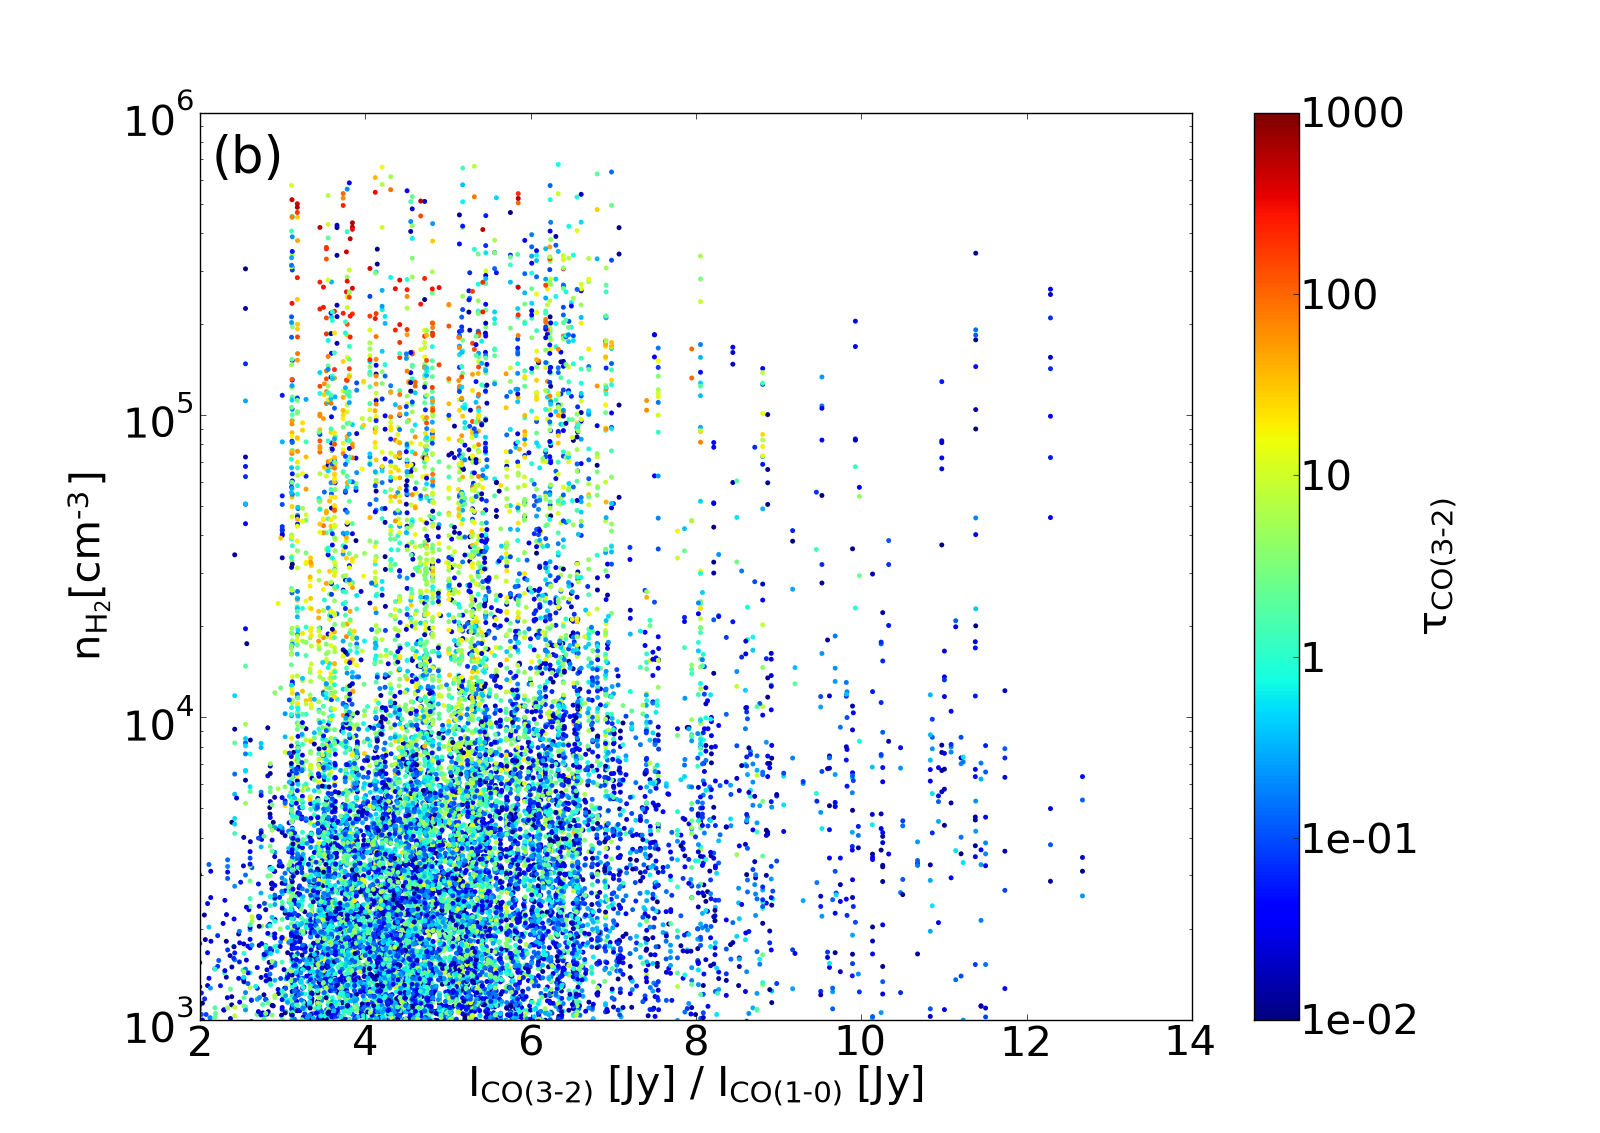
In Fig. 7a, the line ratio (in Jansky) of is plotted on a plane of the gas density and kinetic temperature derived from the input hydrodynamic data for the viewing angle of 90∘. Only grid cells with are plotted. It indicates that a line ratio could have been produced with more than three orders of magnitude in density. There is a weak tendency that for higher-density gas ( cm-3) and for lower-density gas ( cm-3). However, there are significant exceptions. The gas temperature is almost independent of , except for the highest-density gas ( cm-3), where and K.
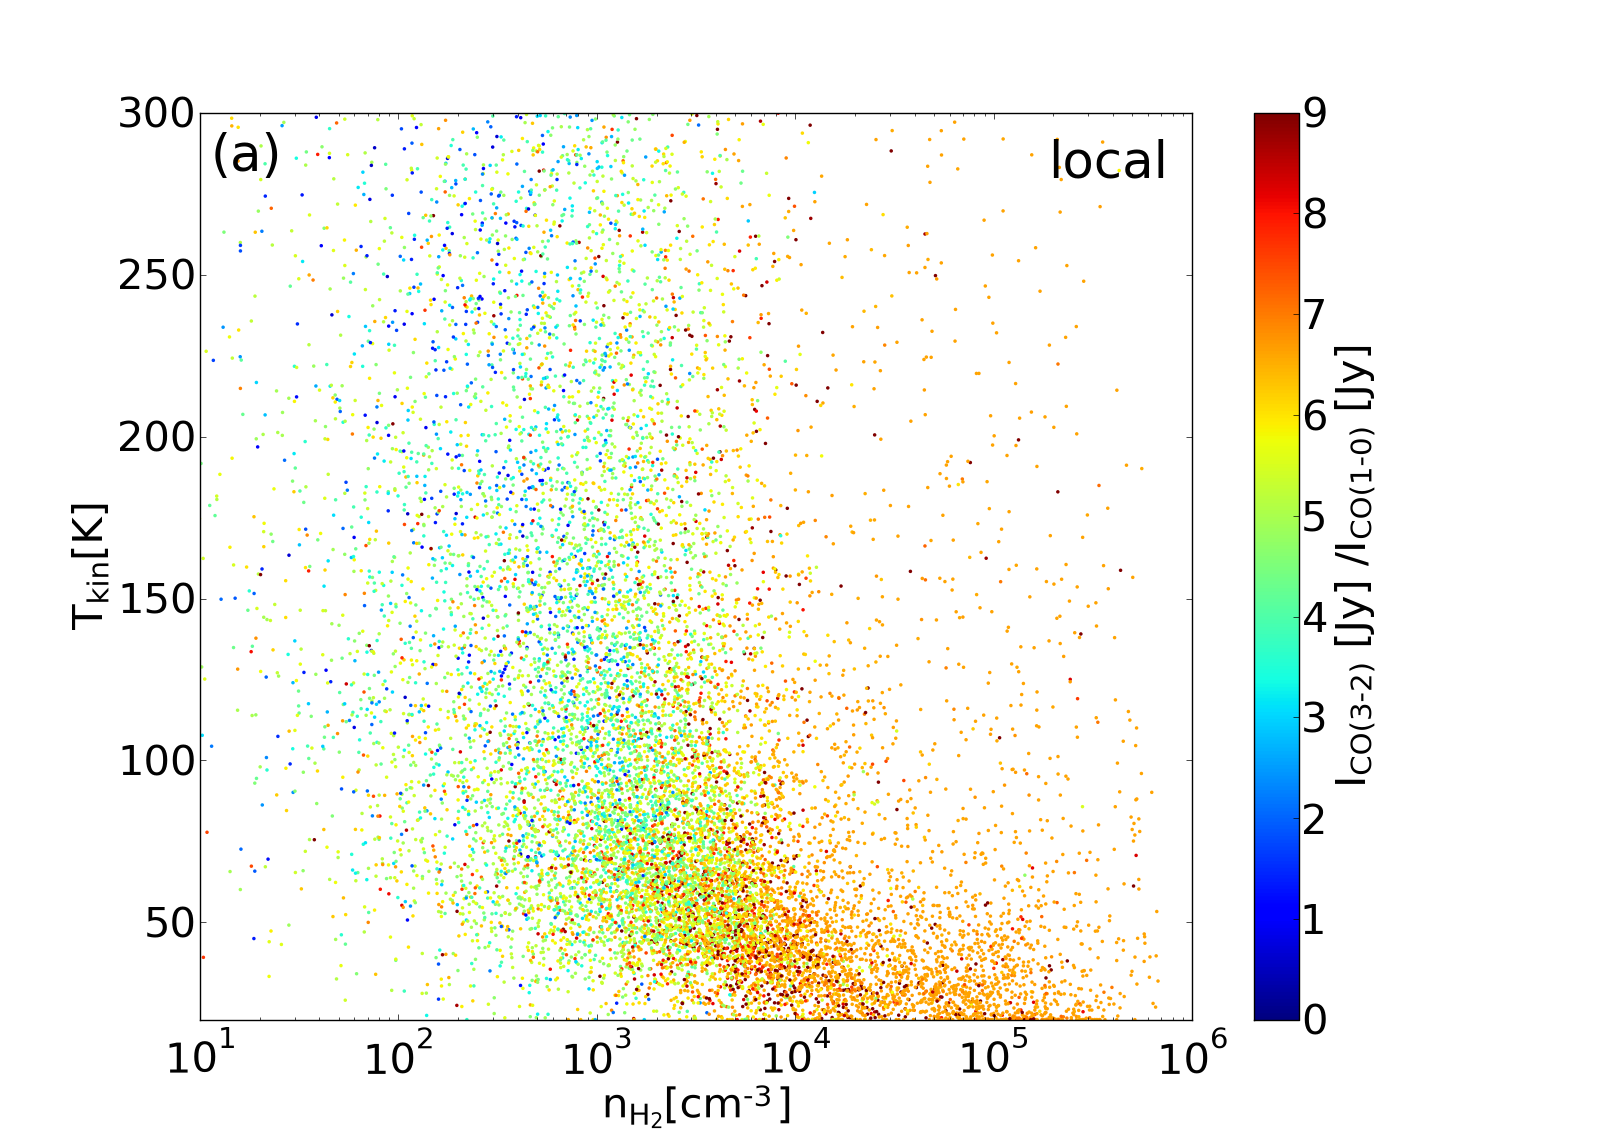
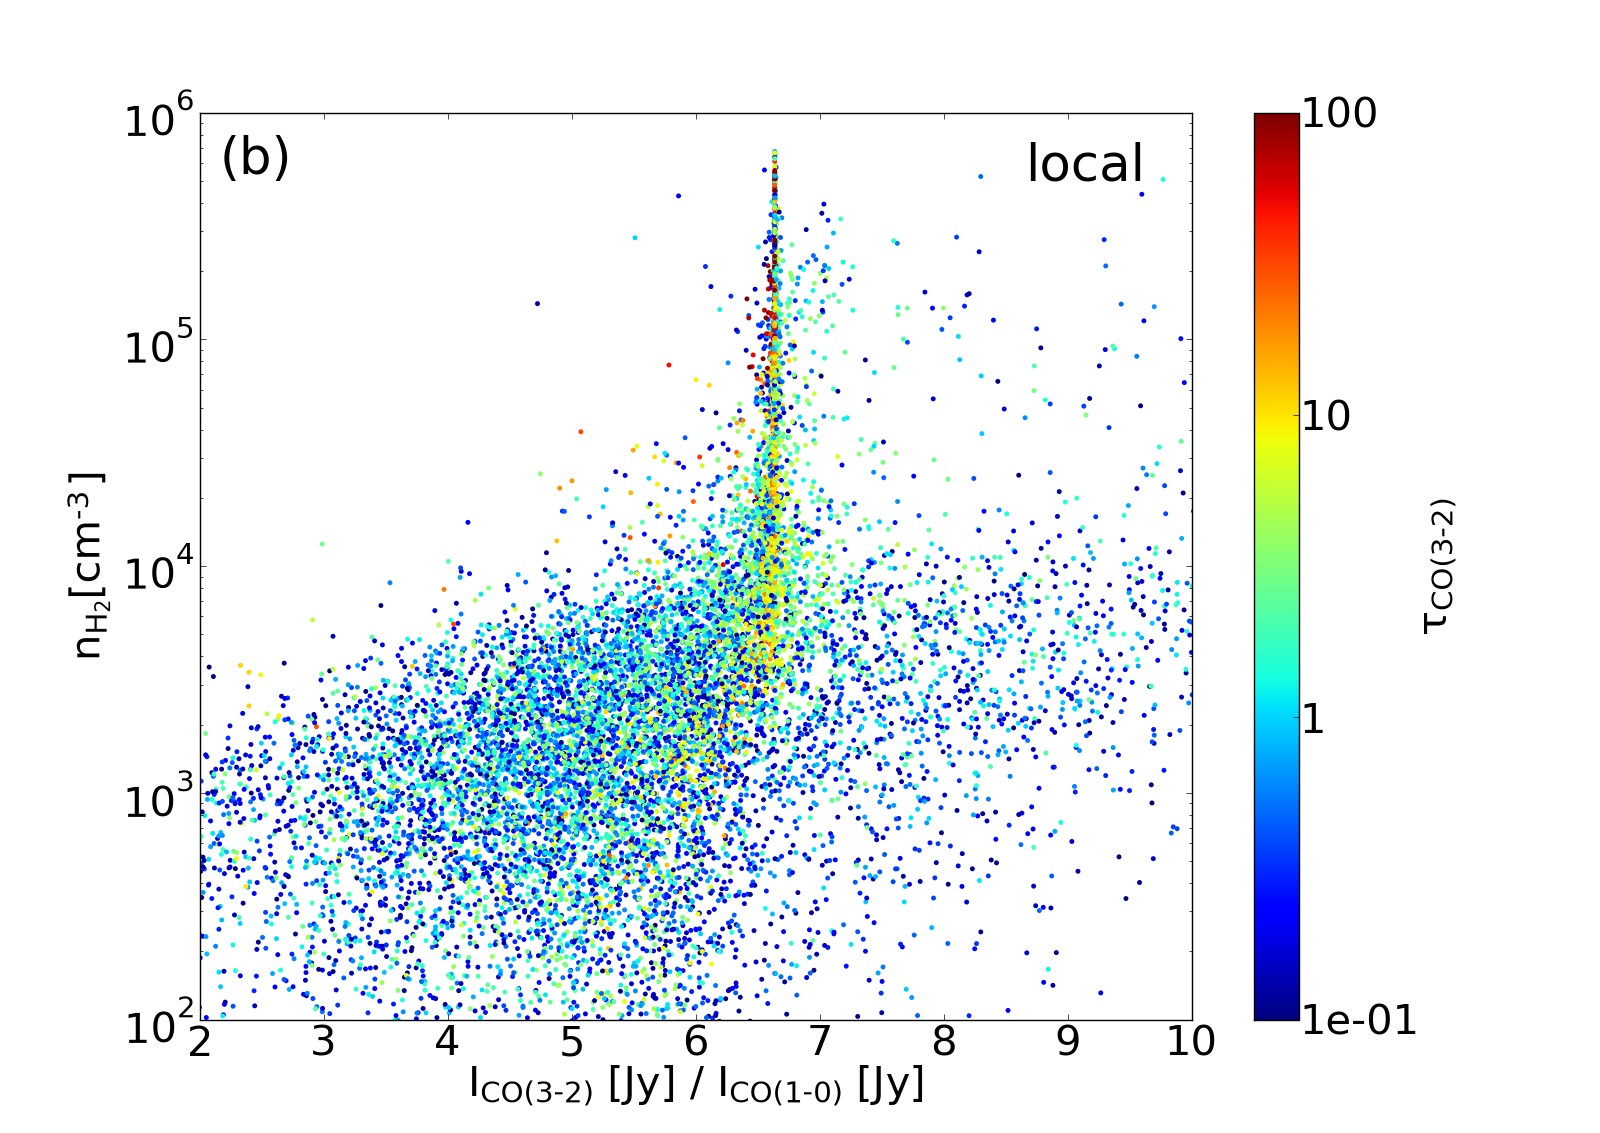
Figure 7b illustrates how the optical depth of CO(3-2) depends on the H2 density and . In the optically thick grid cells, the gas density is cm-3, where . Note that there are a small number of “super-thermal” grid cells where . These points do not necessarily indicate that the gas along its line-of-sight is excited non-thermally, but it is caused by the difference in the line transfer effect in different lines. Fig. 8a and b are, in contrast, plotted against local value of that is the line transfer effect over grid cells is not taken account. The local density now corresponds more clearly than in the non-LTE case. Fig. 8b shows that for optically thick grid cells (), where cm-3 and K. The ratio is expected for the gas in LTE. Most of the other grid cells are optically thin and not thermalized.
4. Discussion
In our numerical modeling, there are two free parameters that could affect the results, i.e., the velocity dispersion inside one grid cell (i.e., micro-turbulence) and the strength of the FUV radiation. We discuss these effects below.
4.1. Effect of micro-turbulence
The molecular line profile in our treatment is assumed as a Gaussian profile with a dispersion () originating from the unresolved internal turbulence in a grid cell. The relevant value of in the molecular clouds in external galaxies, especially under the influence of the AGN, is still not clear. One possible clue to estimate it is the size-dispersion relation of molecular clouds in the Galactic center. Tsuboi & Miyazaki (2012) suggested, using CS(1-0), that the velocity dispersion of molecular gas in the central molecular zone and in “50 km s-1 molecular clouds” is about five times larger for a given size than that in typical GMCs in the Galactic disk. This corresponds to km s-1 for our grid size, i.e., 0.25 pc. As the nuclear region of the Circinus galaxy should be disturbed by intense feedback from the AGN, as well as from starbursts, in contrast to our Galactic center, the velocity dispersion on that scale could be larger than 10 km s-1.
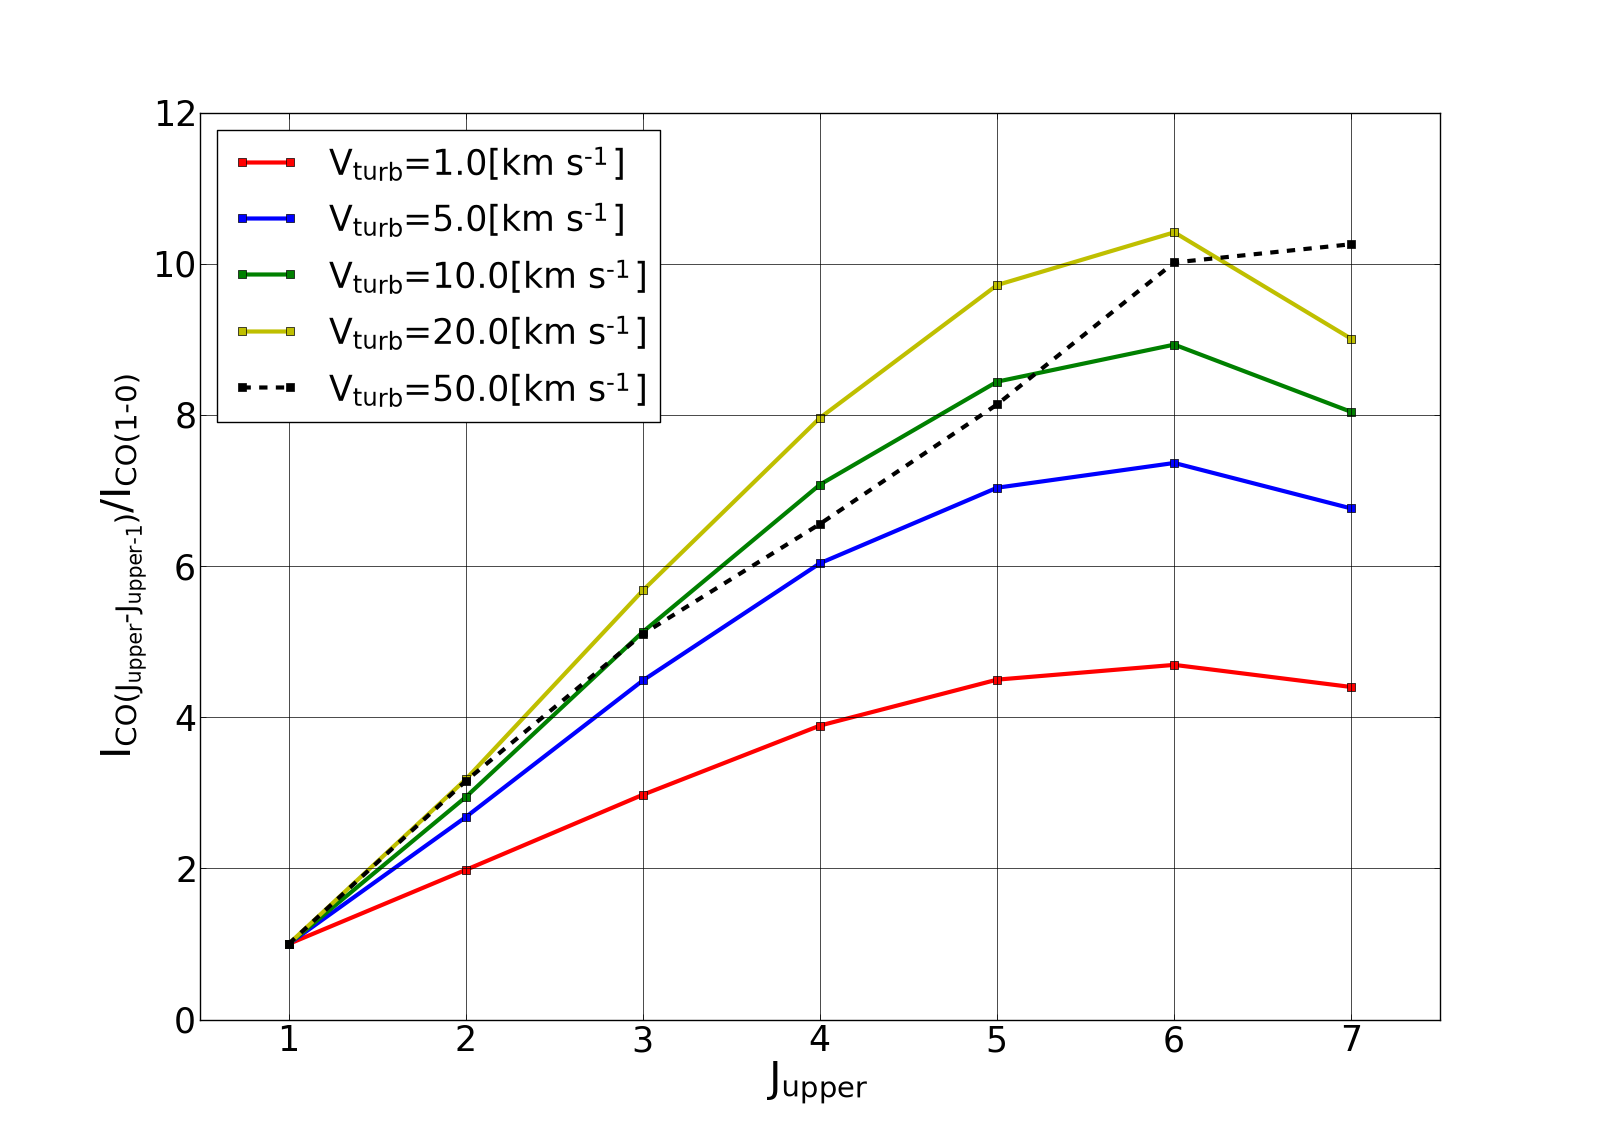
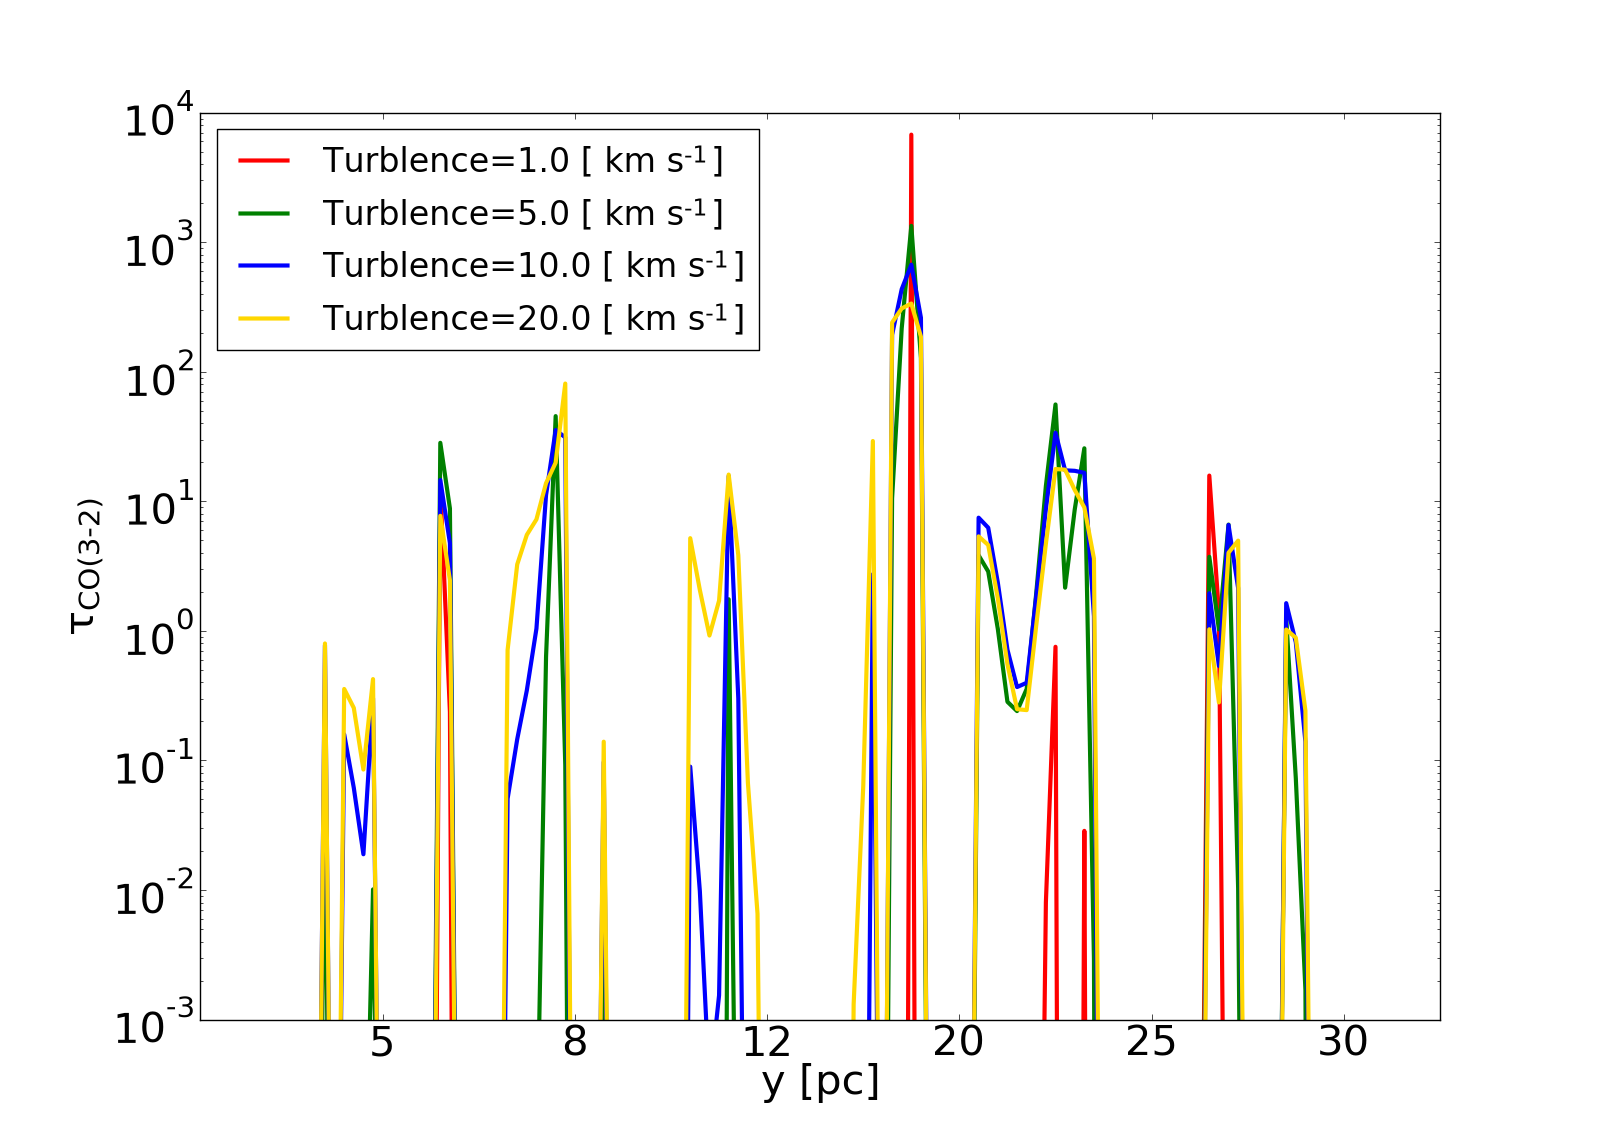
Figure 9 shows the SLED, similar to Fig. 6, but for the micro-turbulence 1, 5, 10, 20 and 50 km s-1. Although the behavior of the intensity in terms of is similarly independent of , it shows that the intensity for a given increases with . This is because the optical depth is proportional to the line profile function . Figure 10 presents the optical depth distribution for a given line of sight. It shows that for larger , the intensity at the line center decreases, but the total integrated intensity increases because there are more regions with 555If is as large as km s-1, the total intensity for turns to decrease because of the insufficient intensity at the line center as shown in the black dotted line in Fig. 9.. The present results suggest that if we obtain the SLED in observations with a sufficiently fine spatial resolution (e.g., sub-parsec) for the central tens parsecs in nearby AGNs, we could determine a relevant value of the micro-turbulence in the molecular clouds. This will be discussed in a subsequent paper (Izumi et al. in preparation).
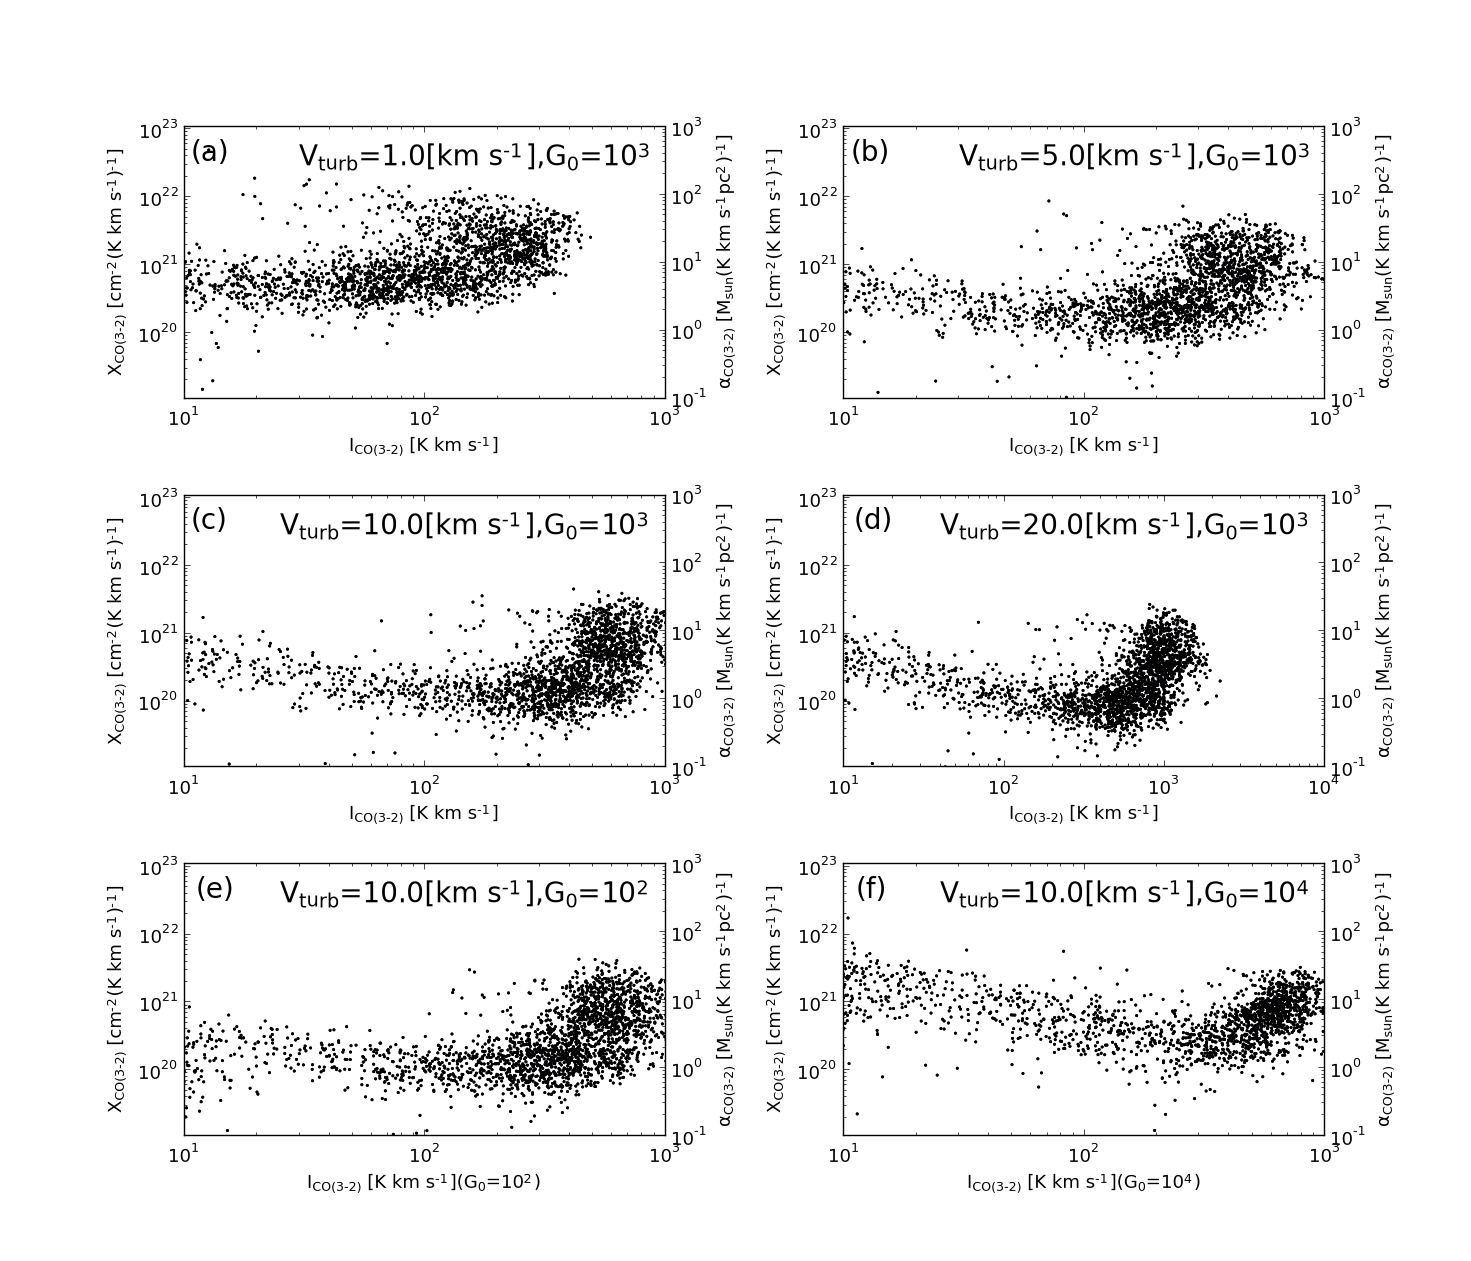
Figure 11a-d show the conversion factor () for different values of micro-turbulence (1, 5, 10, and 20 km s-1), showing that the X-factor tends to be smaller for larger micro-turbulence values for a given line intensity. However, the dispersion does not significantly change among the results.
4.2. Effect of FUV
FUV field strength is one of the important quantities to determine the chemistry and thermal structures in the photo-dissociation region around galactic central regions (Meijerink & Spaans, 2005; Wada et al., 2009). In starburst regions, the local value of the FUV should vary over several orders of magnitude (Rosenberg et al., 2014), e.g., , depending on the local structures of the ISM and the distance to the radiation sources. Assuming the observed star formation rate (SFR) in the Circinus galaxy (Hicks et al., 2009), i.e., yr-1 kpc-2, and the relation between and SFR density in the IR-luminous merger NGC 1614 (Saito et al., 2017), the FUV in Circinus can be estimated as on average (note that the scatter could be extremely large, ranging from to ).
If we directly solve the radiative transfer equations for the FUV in the inhomogeneous media with many radiation sources, our present model could be more realistic. However, this is beyond our current numerical treatment, so we assumed here a uniform and varied it as a free parameter. We confirm that the X-factor does not significantly depend on the strength of the uniform FUV between and (Fig. 11e and 11f), because both the intensity of CO and the molecular hydrogen density are similarly affected by the change in FUV (Wada et al., 2009).
4.3. Effect of the Viewing Angle and Implications to Other AGNs
So far we have focused on the case of edge-on view, which is plausible for the circunumnuclear disk in Circinus (Wada et al., 2016). However, it would be worth to see how the results change for different viewing angles, in order to see whether the present results is applicable to other AGNs. Figure 12 shows the SLED, X-factor and , in which the viewing angle (i.e. face-on) is assumed. The SLED (Fig. 12a) can be compared with Fig. 6. The brightest spot (red solid line) in both cases close the LTE case with K, however, the intensity in the face-on case tends to be smaller, especially for high . The weighted average value (blue solid line) does not depend on the viewing angle. The X-factor for CO (3-2) (Fig. 12b) can be compared with Fig. 5. There is no essential difference in terms of the viewing angle. The line ratio of CO (3-2) () as a function of and for the face-on view is plotted in Fig. 12c. Grid cells with are plotted. For comparison, the same plot for the edge-on case is shown in Fig. 12d. Although the line ratio tends to be larger for a given density in the face-on case, as discussed in §3.4, it also exhibits a large dispersion in gas density and temperature for a given line ratio. This is because the molecular gas forms a thick disk (Fig. 1a), in which there is internal structure on sub-pc scales along the -axis. If this inhomogeneous nature of the ISM in the central tens parsecs exists in other AGNs, the results presented here should be also considered to interpreted CO line observations.
Until now, the only ‘direct’ detection of molecular lines from circumnuclear disk (CND) with a spatial resolution of a few pc is NGC 1068, which is the prototypical Seyfert 2 galaxy at Mpc (García-Burillo et al., 2016). Using CO(6-5) line with ALMA, they claimed that the CND is a 7-10 pc diameter disk and it should be a counter part of the ‘dusty torus’ suggested by the near IR and mid IR interferometric observations (e.g. Jaffe et al., 2004). Although the spatial resolution ( 4 pc) is not fine enough to resolve sub-pc inhomogeneous structures, if they actually exist as found in our model for Circinus, the large velocity dispersion ( km s-1) and the lopsided distribution (i.e. mode) imply the presence of complicated internal sub-structures. In fact, the observed SED is well fitted by a ‘clumpy’ torus model (García-Burillo et al., 2016). However, our model disk for Circinus is globally axisymmetric, and no lopsided distribution of the molecular gas is seen in contrast to NGC 1068. The condition for triggering the large scale asymmetry is an interesting subject to be explored in terms of the hydro and magneto-hydrodynamic instabilities, such as Papaloizou-Pringle instability (Papaloizou & Pringle, 1984) and magneto-rotational instability. The CO(6-5) observation of NGC 1068 shows no significant CO counterpart for the polar emission of the dust tori, which are often seen in nearby AGNs (López-Gonzaga et al., 2016). This is also the case in our ’radiation-driven’ fountain, where there is no dense molecular gas in the bipolar outflows.
The origin of sub-kpc to kpc scale molecular outflows/jets, such as in NGC 1068 (García-Burillo et al., 2014), Circinus (Zschaechner et al., 2016), and NGC 1377 (Aalto et al., 2016), and its physical link to the cicumnuclear molecular gas are still not clear. The presence of 10-pc scale molecular outflows in NGC 1068 is under debate, even if there is some distorted kinematics of molecular gas in the torus is observed(Gallimore et al., 2016). This is an interesting subject to be explored by high-resolution ALMA data of the central region of the Circinus galaxy, and will be discussed in a subsequent paper (Izumi et al. in prep.).
Line ratios, such as CO(2-1)/(1-0) and CO(3-2)/(1-0) in the central 100 pc of NGC1068 is 2-3 (Viti et al., 2014), which is larger by a factor of two than those in our case (Fig. 3). On the other hand, Zhang et al. (2014) showed that the ratio CO(3-2)/(1-0) in the central several 100 pc of the Circinus galaxy is about 0.8, which is consistent with our model. In the Circinus galaxy, there is no currently available high spatial resolution data for CO(1-0). Therefore, with these limited observational information at this moment and due to the difference of the spatial resolution between models and observations, it is hard to conclude on the consistency or inconsistency of the predicted line ratios with the observationally derived values.
5. Conclusions
Recent observational and theoretical studies of obscuring material from sub-parsec to 100-pc scales around AGNs suggested non-static, multi-phase structures over wide density and temperature ranges. In this study, we calculated the line emissions from cold, molecular gas, which was expected in our previous ”radiation-driven fountain model” (Wada et al., 2016). Using a snapshot of the 3-D radiation-hydrodynamic simulation that reliably explains the SED of the nearest type 2 Seyfert galaxy, the Circinus galaxy, with XDR chemistry as an input, we conducted post-processed, 3-D, non-LTE line transfer simulations for CO lines () in the central 16 pc. We found that the CO emissions () mostly originated from thick, inhomogeneous structures. There are almost no “molecular outflows,” as the outflowing gas density is too low and mostly ionized. The SLED has a peak around and its distribution suggests that the lines are optically thin for most regions. However, for a given line-of-sight, the optical depth distribution is highly non-uniform between and .
Because we know the molecular hydrogen density at each grid cell in the input model, we can obtain the CO-to-H2 conversion factor ( or ). We found that the conversion factor depends strongly on the integrated intensity for a given line-of-sight, especially for lower lines:
-
•
cm , or , where the integrated intensity K km s-1.
-
•
cm , or , where the integrated intensity K km s-1
One should note that there is large (more than one order of magnitude) scatter around this average value, reflecting the non-uniform internal structure (density, temperature, abundance, and velocity) of the “torus.” We also found that the conversion factor for a given intensity depends on the assumed value of the “micro-turbulence,” which is the velocity dispersion in one grid cell (0.25 pc in the present case). The values above could be the case for the central region of the Circinus galaxy, and they could also be applied to low-luminosity AGNs associated with nuclear starbursts, but not necessarily to all types of AGNs, such as luminous quasars.
The total CO intensities depend on the assumption of ‘micro-turbulence, i.e. unresolved velocity dispersion inside a grid cell (0.25 pc). It is brighter for larger velocity dispersions (Fig. 9), provided that km s-1. Using this fact, we can estimate the internal turbulent motion of the circumnuclear gas in Circinus and compare it with ALMA Cycle-4 observations of the central molecular disk (Izumi et al. in prep.).
We also found that the physical conditions differ between grid cells on a scale of a few parsecs along the observed lines of sight; therefore, a specific observed line ratio, such as , does not necessarily represent a single physical state of the ISM. The dense ISM ( cm-3) on a 0.25-pc scale is mostly in a phase of molecules and LTE, but the resultant line ratio for an observer is not necessarily in LTE, because of the line transfer effect. These results basically do not depend on the choice of the viewing angle, therefore what we found here could be useful to understand physics of the ISM around supermassive BHs, not only in the Circinus galaxy, but also in other nearby AGNs. The present results also suggest that we need to carefully analyze the molecular line observations of the circumnuclear gas when we obtain them with a high spatial resolution in nearby AGNs by ALMA.
References
- Aalto et al. (2016) Aalto, S., Costagliola, F., Muller, S., et al. 2016, A&A, 590, A73
- Ádámkovics et al. (2011) Ádámkovics, M., Glassgold, A. E., & Meijerink, R. 2011, ApJ, 736, 143
- Bolatto et al. (2013) Bolatto, A. D., Wolfire, M., & Leroy, A. K. 2013, ARA&A, 51, 207
- Chan & Krolik (2017) Chan, C.-H., & Krolik, J. H. 2017, ApJ, 843, 58
- Chan & Krolik (2016) Chan, C.-H., & Krolik, J. H. 2016, ApJ, 825, 67
- Dorodnitsyn & Kallman (2017) Dorodnitsyn, A., & Kallman, T. 2017, ApJ, 842, 43
- Dorodnitsyn et al. (2016) Dorodnitsyn, A., Kallman, T., & Proga, D. 2016, ApJ, 819, 115
- Dorodnitsyn et al. (2012) Dorodnitsyn, A., Kallman, T., & Bisnovatyi-Kogan, G. S. 2012, ApJ, 747, 8
- García-Burillo et al. (2014) García-Burillo, S., Combes, F., Usero, A., et al. 2014, A&A, 567, A125
- García-Burillo et al. (2016) García-Burillo, S., Combes, F., Ramos Almeida, C., et al. 2016, ApJ, 823, L12
- Gallimore et al. (2016) Gallimore, J. F., Elitzur, M., Maiolino, R., et al. 2016, ApJ, 829, L7
- Greenhill et al. (2003) Greenhill, L. J., Booth, R. S., Ellingsen, S. P., et al. 2003, ApJ, 590, 162
- Hicks et al. (2009) Hicks, E. K. S., Davies, R. I., Malkan, M. A., Genzel, R., Tacconi, L. J., Sánchez, F. M., & Sternberg, A. 2009, ApJ, 696, 448
- Hönig et al. (2013) Hönig, S. F., Kishimoto, M., Tristram, K. R. W., et al. 2013, ApJ, 771, 87
- Hogerheijde, & van der Tak (2000) Hogerheijde, M. R. & van der Tak, F. F. S. 2000, A&Ap, 362, 697
- Hopkins et al. (2012) Hopkins, P. F., Hayward, C. C., Narayanan, D., & Hernquist, L. 2012, MNRAS, 420, 320
- Imanishi et al. (2016) Imanishi, M., Nakanishi, K., & Izumi, T. 2016, ApJ, 822, L10
- Izumi et al. (2017) Izumi, T., Kohno, K., Fathi, K., et al. 2017, ApJ, 845, L5
- Jaffe et al. (2004) Jaffe, W., et al. 2004, Nature, 429, 47
- Krolik & Begelman (1988) Krolik, J. H. & Begelman, M. C. 1988, ApJ, 329, 702
- Laor & Draine (1993) Laor, A., & Draine, B. T. 1993, ApJ, 402, 441
- Lawrence & Elvis (2010) Lawrence, A., & Elvis, M. 2010, ApJ, 714, 561
- López-Gonzaga et al. (2016) López-Gonzaga, N., Burtscher, L., Tristram, K. R. W., Meisenheimer, K., & Schartmann, M. 2016, A&A, 591, A47
- Marconi et al. (2004) Marconi, A., Risaliti, G., Gilli, R., et al. 2004, MNRAS, 351, 169
- Maloney, Hollenbach, & Tielens (1996) Maloney, P. R., Hollenbach, D. J., & Tielens, A. G. G. M. 1996, ApJ, 466, 561
- Meijerink & Spaans (2005) Meijerink, R., & Spaans, M. 2005, A&A, 436, 397
- Namekata & Umemura (2016) Namekata, D., & Umemura, M. 2016, MNRAS, 460, 980
- Nenkova et al. (2008) Nenkova, M., Sirocky, M. M., Ivezić, Ž., & Elitzur, M. 2008, ApJ, 685, 147
- Netzer (1987) Netzer, H. 1987, MNRAS, 225, 55
- Ohsuga & Umemura (2001) Ohsuga, K. & Umemura, M. 2001, A&A, 371, 890
- Papaloizou & Pringle (1984) Papaloizou, J. C. B., & Pringle, J. E. 1984, MNRAS, 208, 721
- Pier & Krolik (1993) Pier, E. A., & Krolik, J. H. 1993, ApJ, 418, 673
- Prieto et al. (2010) Prieto, M. A., Reunanen, J., Tristram, K. R. W., et al. 2010, MNRAS, 402, 724
- Ramos Almeida, & Ricci (2017) Ramos Almeida, C., Ricci, C., Nature Astronomy Review in press, https://arxiv.org/abs/1709.00019
- Rosenberg et al. (2014) Rosenberg, M. J. F., Kazandjian, M. V., van der Werf, P. P., et al. 2014, A&A, 564, A126
- Saito et al. (2017) Saito, T., Iono, D., Xu, C. K., et al. 2017, ApJ, 835, 174
- Schartmann et al. (2014) Schartmann, M., Wada, K., Prieto, M. A., Burkert, A., & Tristram, K. R. W. 2014, MNRAS, 445, 3878 (Sch14)
- Stalevski et al. (2017) Stalevski, M., Asmus, D., & Tristram, K. R. W. 2017, arXiv:1708.07838
- Tristram et al. (2014) Tristram, K. R. W., Burtscher, L., Jaffe, W., et al. 2014, A&A, 563, A82
- Tsuboi & Miyazaki (2012) Tsuboi, M., & Miyazaki, A. 2012, PASJ, 64, 111
- van der Tak et al. (2007) van der Tak, F. F. S., Black, J. H., Schöier, F. L., Jansen, D. J., & van Dishoeck, E. F. 2007, A&A, 468, 627
- Viti et al. (2014) Viti, S., García-Burillo, S., Fuente, A., et al. 2014, A&A, 570, A28
- Wada (2012) Wada, K. 2012, ApJ, 758, 66
- Wada (2015) Wada, K. 2015, ApJ, 812, 82
- Wada et al. (2002) Wada, K., Meurer, G., & Norman, C. A. 2002, ApJ, 577, 197
- Wada & Tomisaka (2005) Wada, K. & Tomisaka, K. 2005, ApJ, 619, 93
- Wada et al. (2009) Wada, K., Papadopoulos, P. P., & Spaans, M. 2009, ApJ, 702, 63
- Wada et al. (2016) Wada, K., Schartmann, M., & Meijerink, R. 2016, ApJ, 828, L19 (W16)
- Xu (2015) Xu, Y.-D. 2015, MNRAS, 449, 191
- Yamada et al. (2007) Yamada, M., Wada, K., & Tomisaka, K. 2007, ApJ, 671, 73
- Zschaechner et al. (2016) Zschaechner, L. K., Walter, F., Bolatto, A., et al. 2016, ApJ, 832, 142
- Zhang et al. (2014) Zhang, Z.-Y., Henkel, C., Gao, Y., et al. 2014, A&A, 568, A122