Solar Abundance Ratios of the Iron-Peak Elements in the Perseus Cluster
Abstract
The metal abundance of the hot plasma that permeates galaxy clusters represents the accumulation of heavy elements produced by billions of supernovae[2]. Therefore, X-ray spectroscopy of the intracluster medium provides an opportunity to investigate the nature of supernova explosions integrated over cosmic time. In particular, the abundance of the iron-peak elements (chromium, manganese, iron and nickel) is key to understanding how the progenitors of typical type Ia supernovae evolve and explode[3, 4, 5, 6, 7]. Recent X-ray studies of the intracluster medium found that the abundance ratios of these elements differ substantially from those seen in the Sun[8, 9, 10, 11, 12], suggesting differences between the nature of type Ia supernovae in the clusters and in the Milky Way. However, because the K-shell transition lines of chromium and manganese are weak and those of iron and nickel are very close in photon energy, high-resolution spectroscopy is required for an accurate determination of the abundances of these elements. Here we report observations of the Perseus cluster, with statistically significant detections of the resonance emission from chromium, manganese and nickel. Our measurements, combined with the latest atomic models, reveal that these elements have near-solar abundance ratios with respect to iron, in contrast to previous claims. Comparison between our results and modern nucleosynthesis calculations[13, 14, 15] disfavours the hypothesis that type Ia supernova progenitors are exclusively white dwarfs with masses well below the Chandrasekhar limit (about 1.4 times the mass of the Sun). The observed abundance pattern of the iron-peak elements can be explained by taking into account a combination of near- and sub-Chandrasekhar-mass type Ia supernova systems, adding to the mounting evidence that both progenitor types make a substantial contribution to cosmic chemical enrichment[6, 16, 17].
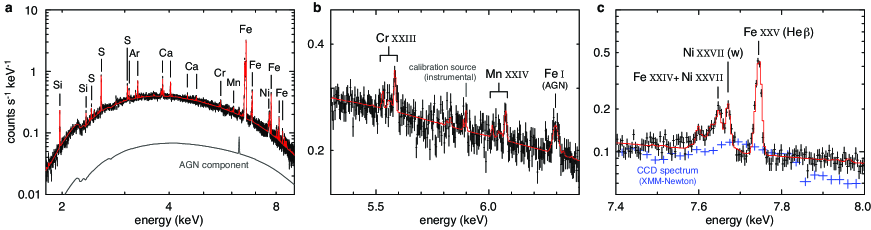
The Soft X-ray Spectrometer (SXS) on board Hitomi achieved unprecedented spectral resolution in orbit ( eV in the 2–10 keV band)[18]. Fig. 1 shows the SXS spectrum of the Perseus Cluster core ( 40 kpc) in the 1.8–9.0 keV band. This was obtained from the same series of observations as our previous work that constrained turbulent velocities in the intracluster medium (ICM)[18], but with 25% more exposure totaling 290 ks. The refined calibration of the telescope effective area and the SXS aperture window transmission now allows the first flux measurement of each individual line in the 1.8–9.0 keV band, encompassing the H- and He-like transitions from Si through Ni.
The excellent performance of the SXS also makes possible the detection of weak resonance lines from He-like Cr, Mn, and Ni, with statistical significance of 6, 4, and 12, respectively (Fig. 1b and 1c). Measurements of these line fluxes in celestial sources have been extremely challenging with traditional non-dispersive X-ray detectors (e.g., charge coupled devices, or CCDs), because such weak features readily blend into the bremsstrahlung continuum under lower spectral resolution and the Ni XXVII He and Fe XXV He lines cannot be resolved (see Fig. 1c).
The hot ICM, confined in the deep cluster gravitational potential well, contains the dominant fraction (80%) of metals in the cluster[2]. Among these, the Fe-peak elements (Cr, Mn, Fe, and Ni) are thought to be predominantly created by type Ia supernovae (SNe Ia) occurring over a cosmological time period[19, 20]. Therefore, the abundance of these elements provides crucial information about the integrated SN Ia nucleosynthesis and its relevant physics.
Despite the importance of SNe Ia as distance indicators in cosmology[21, 22], many of their fundamental aspects remain elusive. One important open question is whether the mass of an exploding white dwarf (WD) is close to the Chandrasekhar limit (), regardless of whether it originates from a single WD accreting mass from a non-degenerate companion[23] or a violent merger of two WDs[24]. Recent hydrodynamical simulations show that both so-called delayed-detonation explosions of near- WDs[5, 13] and full detonations of sub- WDs[25, 15, 14] can reproduce the observed properties (such as optical light curves and spectra) of SNe Ia. Therefore, it is difficult to distinguish the two scenarios from optical observations of individual explosions alone.
From the point of view of SN Ia nucleosynthesis, the main difference between near- and sub- explosions is whether the WD core is dense enough for electron capture () to take place during the initial phase of the explosion. The threshold density for this reaction ( g cm-3) is only achieved when the WD mass is close to . A distinguishing characteristic of the two models is, therefore, the production efficiency of neutron-rich species, like Ni and Mn, that is higher in the near- scenario[5, 6, 7]. We may exploit this distinction to identify the dominant type of SN Ia progenitors in galaxy clusters by measuring the abundance of the Fe-peak elements in the ICM. The results may apply globally, since rich galaxy clusters represent a scale sufficiently massive to be representative of the universe as a whole.
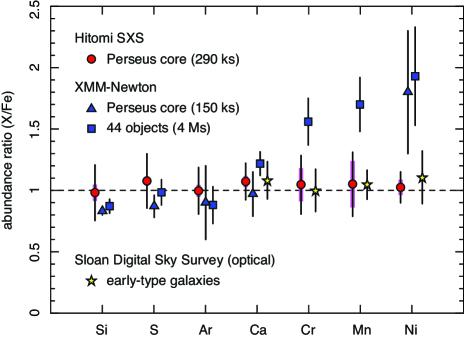
Here we model the SXS spectrum of the Perseus Cluster in the 1.8–9.0 keV band (Fig. 1a) with an optically thin thermal plasma in collisional ionization equilibrium using the latest atomic codes (AtomDB v.3.0.8 and SPEX v.3.03). The emission from the active galactic nucleus (AGN) of the cD galaxy NGC 1275 is taken into account by adding a power law and redshifted Fe I K and K lines. Details about the analysis and systematic uncertainty assessment are described in the Methods section. Our constraints on the elemental abundances, with respect to Fe, are shown in Fig. 2 (red circles). These are fully consistent with the solar abundance ratios[26].
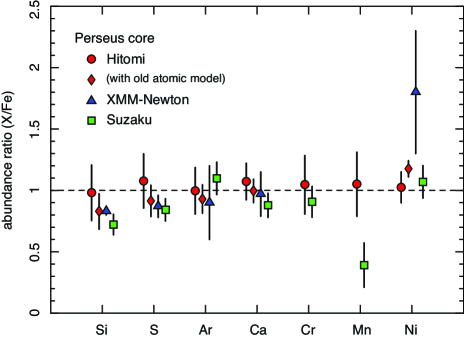
Fig. 2 also plots previously measured ICM abundances of the Perseus Cluster core as well as the average of 44 objects including galaxy clusters, groups, and elliptical galaxies from XMM-Newton observations (blue triangles and squares)[12]. This plot highlights some important differences between the measurements. First, the SXS-measured abundances have statistical uncertainties comparable to the XMM-Newton results from the combined data of the 44 objects, despite a 15-times shorter exposure and a much smaller field of view. Second, while the abundances of Si, S, Ar, and Ca are identical between the two studies, the earlier measurements systematically obtained supersolar abundances of the Fe-peak element from both the Perseus Cluster and the 44-object average.
Previous X-ray studies of clusters and elliptical galaxies often obtained a supersolar Ni/Fe ratio, leading the study authors to argue for differences in the nature of SNe Ia between the early-type galaxies and the Milky Way[8, 9, 10, 11, 4]. By contrast, optical spectra of old stars in early-type galaxies indicate that the relative abundances among the Fe-peak elements are consistent with the solar value (see yellow stars in Fig. 2)[27]. Our new X-ray measurement relieves this discrepancy and strongly suggests that the average nature of SNe Ia is independent of the star formation history of their host galaxies. This robust result, unaffected by complicated radiative transfer that may lend uncertainty to optical studies, is obtained by an accurate determination of the Ni abundance primarily based on the intensity of its resonance emission line that is easily resolved from the Fe He line and other weak emission of Fe XXIV and Fe XXV.
Since Cr and Mn abundances of individual objects were not constrained by the previous XMM-Newton observations[12], we cannot exclude the possibility that sample variance leads at least in part to the discrepancy between the two studies. Nevertheless, we demonstrate in Methods that high resolution spectroscopy is essential for robust measurements of these abundances. In short, only the SXS can clearly separate the weak resonance lines from the continuum component, enabling abundance measurements much less subject to systematic uncertainties in spectral modeling. The high-resolution SXS data have also stimulated the development of atomic models, reducing the uncertainties in the modeled line emissivities and improving the accuracy of the abundances with respect to the previous work.
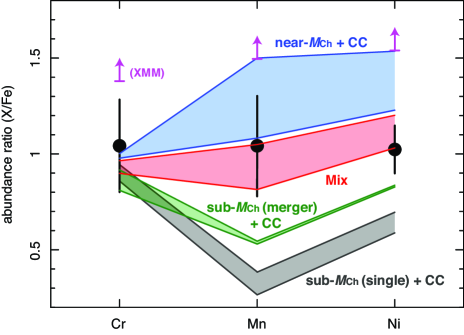
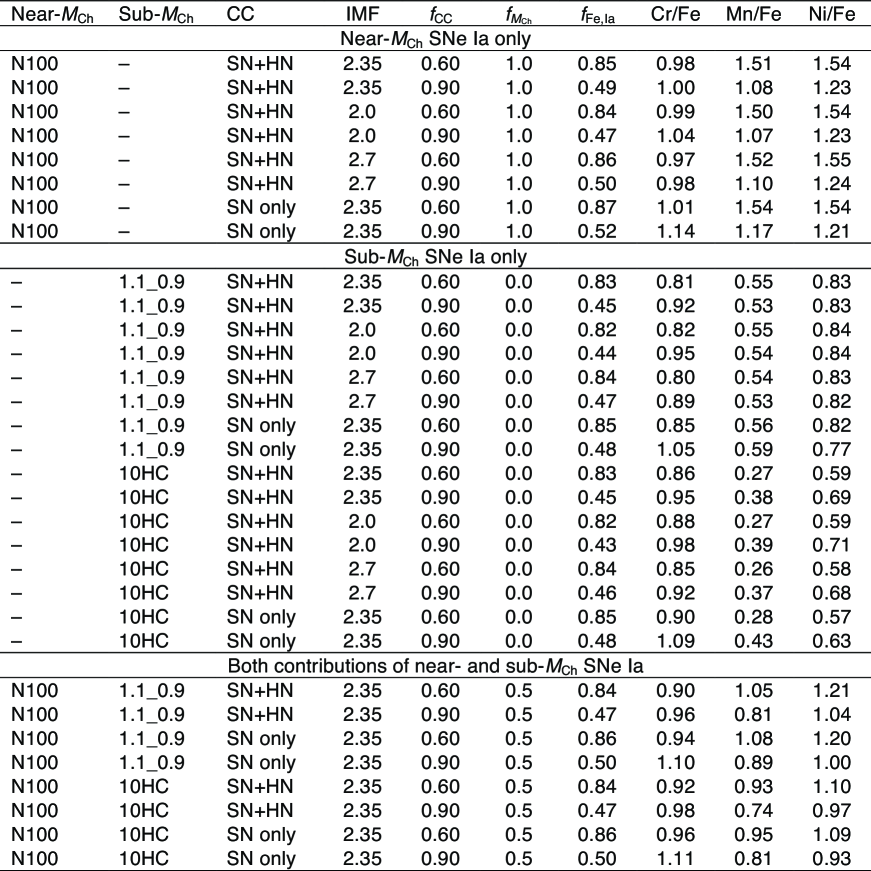
Fig. 3 compares the SXS-measured abundances of the Fe-peak elements (black data points) with theoretical yields from the latest three-dimensional calculations of the near- SN Ia[13] (blue region) and sub- merger[14] (green region). We also consider a one-dimensional explosion of a single 1.0 WD[15] (gray region) as an alternative example of a sub- SN Ia model. All of these models predict typical SN Ia brightness and a synthesized 56Ni mass of 0.6 . In addition, contributions of core-collapse (CC) SNe are accounted for in each model given in the figure, utilizing mass-dependent yields[28] averaged over the Salpeter initial mass function (IMF). We allow a conservatively wide range for the CC SN fraction, = 0.6–0.9 (typical for cluster cores[29, 10, 30, 20]), instead of constraining an actual value from our observation (see Methods for more details). As expected, the near- model predicts higher abundances of Mn and Ni owing to the efficient electron capture. The observed abundance pattern disfavors a hypothesis that all SNe Ia involve sub- WD, and prefers the combination of the near- and sub- SNe Ia with roughly equal numbers (red region in the figure). We also find that our result starkly contrasts with previous claims[8, 4], where introduction of rather non-standard full-deflagration SN Ia models was required to understand a Ni/Fe ratio that was estimated to be much higher than our measurement. In Methods, we investigate other current SN Ia and CC models and find that our main conclusion remains valid, although an exact ratio of near- to sub- contributions may depend on the model details.
The Hitomi SXS observation has demonstrated the power of high-resolution X-ray spectroscopy: through measurement of the chemical enrichment of a single object, new insight has been gained into fundamental phenomena shaping the present-day universe. A common abundance pattern between the solar neighborhood and the Perseus Cluster suggests that the Sun’s chemical composition is likely to be a good indicator of the average SN Ia nature in the universe. It is extremely important to scrutinize other environments like outskirts of galaxy clusters[31] at high spectral resolution, a task left for future X-ray observatories.
References
References
- [1]
- [2] Mushotzky, R. et al. Measurement of the Elemental Abundances in Four Rich Clusters of Galaxies. I. Observations. ApJ 466, 686 (1996).
- [3] Finoguenov, A., Matsushita, K., Böhringer, H., Ikebe, Y. & Arnaud, M. X-ray evidence for spectroscopic diversity of type Ia supernovae:. XMM observation of the elemental abundance pattern in M 87. A&A 381, 21–31 (2002).
- [4] Mernier, F. et al. Origin of central abundances in the hot intra-cluster medium. II. Chemical enrichment and supernova yield models. A&A 595, A126 (2016).
- [5] Maeda, K. et al. Nebular Spectra and Explosion Asymmetry of Type Ia Supernovae. ApJ 708, 1703–1715 (2010).
- [6] Seitenzahl, I. R., Cescutti, G., Röpke, F. K., Ruiter, A. J. & Pakmor, R. Solar abundance of manganese: a case for near Chandrasekhar-mass Type Ia supernova progenitors. A&A 559, L5 (2013).
- [7] Yamaguchi, H. et al. A Chandrasekhar Mass Progenitor for the Type Ia Supernova Remnant 3C 397 from the Enhanced Abundances of Nickel and Manganese. ApJ 801, L31 (2015).
- [8] Dupke, R. A. & White, R. E., III. Constraints on Type IA Supernova Models from X-Ray Spectra of Galaxy Clusters. ApJ 528, 139–144 (2000).
- [9] Gastaldello, F. & Molendi, S. Ni Abundance in the Core of the Perseus Cluster: An Answer to the Significance of Resonant Scattering. ApJ 600, 670–680 (2004).
- [10] de Plaa, J. et al. Constraining supernova models using the hot gas in clusters of galaxies. A&A 465, 345–355 (2007).
- [11] de Grandi, S. & Molendi, S. Metal abundances in the cool cores of galaxy clusters. A&A 508, 565–574 (2009).
- [12] Mernier, F. et al. Origin of central abundances in the hot intra-cluster medium. I. Individual and average abundance ratios from XMM-Newton EPIC. A&A 592, A157 (2016).
- [13] Seitenzahl, I. R. et al. Three-dimensional delayed-detonation models with nucleosynthesis for Type Ia supernovae. MNRAS 429, 1156–1172 (2013).
- [14] Pakmor, R. et al. Normal Type Ia Supernovae from Violent Mergers of White Dwarf Binaries. ApJ 747, L10 (2012).
- [15] Woosley, S. E. & Kasen, D. Sub-Chandrasekhar Mass Models for Supernovae. ApJ 734, 38 (2011).
- [16] Scalzo, R. A., Ruiter, A. J. & Sim, S. A. The ejected mass distribution of Type Ia supernovae: a significant rate of non-Chandrasekhar-mass progenitors. MNRAS 445, 2535–2544 (2014).
- [17] Blondin, S., Dessart, L., Hillier, D. J. & Khokhlov, A. M. Evidence for sub-Chandrasekhar-mass progenitors of Type Ia supernovae at the faint end of the width-luminosity relation. MNRAS 470, 157–165 (2017).
- [18] Hitomi Collaboration. The quiescent intracluster medium in the core of the Perseus cluster. Nature 535, 117–121 (2016).
- [19] Loewenstein, M. & Mushotzky, R. F. Measurement of the Elemental Abundances in Four Rich Clusters of Galaxies. II. The Initial Mass Function and Mass Loss in Elliptical Galaxies, Enrichment, and Energetics in the ICM. ApJ 466, 695 (1996).
- [20] Matsushita, K., Sakuma, E., Sasaki, T., Sato, K. & Simionescu, A. Metal-mass-to-light Ratios of the Perseus Cluster Out to the Virial Radius. ApJ 764, 147 (2013).
- [21] Riess, A. G. et al. Observational Evidence from Supernovae for an Accelerating Universe and a Cosmological Constant. AJ 116, 1009–1038 (1998).
- [22] Perlmutter, S. et al. Measurements of and from 42 High-Redshift Supernovae. ApJ 517, 565–586 (1999).
- [23] Whelan, J. & Iben, I., Jr. Binaries and Supernovae of Type I. ApJ 186, 1007–1014 (1973).
- [24] Webbink, R. F. Double white dwarfs as progenitors of R Coronae Borealis stars and Type I supernovae. ApJ 277, 355–360 (1984).
- [25] Sim, S. A. et al. Detonations in Sub-Chandrasekhar-mass C+O White Dwarfs. ApJ 714, L52–L57 (2010).
- [26] Lodders, K., Palme, H. & Gail, H.-P. Abundances of the Elements in the Solar System. Landolt Börnstein (2009).
- [27] Conroy, C., Graves, G. J. & van Dokkum, P. G. Early-type Galaxy Archeology: Ages, Abundance Ratios, and Effective Temperatures from Full-spectrum Fitting. ApJ 780, 33 (2014).
- [28] Nomoto, K., Kobayashi, C. & Tominaga, N. Nucleosynthesis in Stars and the Chemical Enrichment of Galaxies. ARA&A 51, 457–509 (2013).
- [29] Sato, K. et al. Type Ia and II Supernovae Contributions to Metal Enrichment in the Intracluster Medium Observed with Suzaku. ApJ 667, L41–L44 (2007).
- [30] Bulbul, E., Smith, R. K. & Loewenstein, M. A New Method to Constrain Supernova Fractions Using X-Ray Observations of Clusters of Galaxies. ApJ 753, 54 (2012).
- [31] Werner, N., Urban, O., Simionescu, A. & Allen, S. W. A uniform metal distribution in the intergalactic medium of the Perseus cluster of galaxies. Nature 502, 656–658 (2013). References for Methods
- [32] Eckart, M. E. et al. Ground calibration of the Astro-H (Hitomi) soft x-ray spectrometer. In Society of Photo-Optical Instrumentation Engineers (SPIE) Conference Series, vol. 9905 of Proc. SPIE, 99053W (2016).
- [33] Angelini, L. et al. Astro-H data analysis, processing and archive. In Space Telescopes and Instrumentation 2016: Ultraviolet to Gamma Ray, vol. 9905 of Proc. SPIE, 990514 (2016).
- [34] Leutenegger, M. A. et al. In-flight verification of the calibration and performance of the ASTRO-H (Hitomi) Soft X-Ray Spectrometer. In Society of Photo-Optical Instrumentation Engineers (SPIE) Conference Series, vol. 9905 of Proc. SPIE, 99053U (2016).
- [35] Kelley, R. L. et al. The Astro-H high resolution soft x-ray spectrometer. In Society of Photo-Optical Instrumentation Engineers (SPIE) Conference Series, vol. 9905 of Proc. SPIE, 99050V (2016).
- [36] Porter, F. S. et al. In-flight performance of the Soft X-ray Spectrometer detector system on Astro-H. In Society of Photo-Optical Instrumentation Engineers (SPIE) Conference Series, vol. 9905 of Proc. SPIE, 99050W (2016).
- [37] Ferruit, P., Adam, G., Binette, L. & Pécontal, E. TIGER observations of the low and high velocity components of NGC 1275. NEWA 2, 345–363 (1997).
- [38] Okajima, T. et al. First peek of ASTRO-H Soft X-ray Telescope (SXT) in-orbit performance. In Society of Photo-Optical Instrumentation Engineers (SPIE) Conference Series, vol. 9905 of Proc. SPIE, 99050Z (2016).
- [39] Cash, W. Parameter estimation in astronomy through application of the likelihood ratio. ApJ 228, 939–947 (1979).
- [40] Tamura, T. et al. X-ray Spectroscopy of the Core of the Perseus Cluster with Suzaku: Elemental Abundances in the Intracluster Medium. ApJ 705, L62–L66 (2009).
- [41] Foster, A. R., Ji, L., Smith, R. K. & Brickhouse, N. S. Updated Atomic Data and Calculations for X-Ray Spectroscopy. ApJ 756, 128 (2012).
- [42] Churazov, E., Forman, W., Jones, C., Sunyaev, R. & Böhringer, H. XMM-Newton observations of the Perseus cluster - II. Evidence for gas motions in the core. MNRAS 347, 29–35 (2004).
- [43] Kalberla, P. M. W. et al. The Leiden/Argentine/Bonn (LAB) Survey of Galactic HI. Final data release of the combined LDS and IAR surveys with improved stray-radiation corrections. A&A 440, 775–782 (2005).
- [44] Zhuravleva, I. et al. Resonant scattering in the Perseus Cluster: spectral model for constraining gas motions with Astro-H. MNRAS 435, 3111–3121 (2013).
- [45] Sanders, J. S. & Fabian, A. C. A deeper X-ray study of the core of the Perseus galaxy cluster: the power of sound waves and the distribution of metals and cosmic rays. MNRAS 381, 1381–1399 (2007).
- [46] Kaastra, J. S., Mewe, R. & Nieuwenhuijzen, H. SPEX: a new code for spectral analysis of X & UV spectra. In Yamashita, K. & Watanabe, T. (eds.) UV and X-ray Spectroscopy of Astrophysical and Laboratory Plasmas, 411–414 (1996).
- [47] Simionescu, A. et al. Chemical enrichment in the cluster of galaxies Hydra A. A&A 493, 409–424 (2009).
- [48] Ezer, C. et al. Uniform Contribution of Supernova Explosions to the Chemical Enrichment of Abell 3112 out to R 200. ApJ 836, 110 (2017).
- [49] Mulchaey, J. S., Kasliwal, M. M. & Kollmeier, J. A. Calcium-rich Gap Transients: Solving the Calcium Conundrum in the Intracluster Medium. ApJ 780, L34 (2014).
- [50] Fink, M. et al. Three-dimensional pure deflagration models with nucleosynthesis and synthetic observables for Type Ia supernovae. MNRAS 438, 1762–1783 (2014).
- [51] Travaglio, C., Hillebrandt, W., Reinecke, M. & Thielemann, F.-K. Nucleosynthesis in multi-dimensional SN Ia explosions. A&A 425, 1029–1040 (2004).
- [52] Travaglio, C., Röpke, F. K., Gallino, R. & Hillebrandt, W. Type Ia Supernovae as Sites of the p-process: Two-dimensional Models Coupled to Nucleosynthesis. ApJ 739, 93 (2011).
- [53] Bravo, E. & Martínez-Pinedo, G. Sensitivity study of explosive nucleosynthesis in type Ia supernovae: Modification of individual thermonuclear reaction rates. Phys. Rev. C 85, 055805 (2012).
- [54] Tsujimoto, T. & Shigeyama, T. Diversity of Type Ia Supernovae Imprinted in Chemical Abundances. ApJ 760, L38 (2012).
- [55] Langanke, K. & Martínez-Pinedo, G. Shell-model calculations of stellar weak interaction rates: II. Weak rates for nuclei in the mass range /A=45-65 in supernovae environments. Nuclear Physics A 673, 481–508 (2000).
Acknowledgements are provided in the Supplementary Information.
H. Yamaguchi wrote the manuscript. H. Yamaguchi, S. Nakashima, A. Simionescu, E. Bulbul, and M. Loewenstein analyzed the data specifically for this project. H. Yamaguchi, K. Matsushita, M. Loewensterin, A. Simionescu, S. Nakashima, K. Sato, and R. Mushotzky discussed the results. Y. Ishisaki confirmed the reliability of the observed results based on his expertise in the SXS signal processing system. The science goals of Hitomi were discussed and developed over more than 10 years by the ASTRO-H Science Working Group (SWG), all members of which are authors of this manuscript. All the instruments were prepared by joint efforts of the team. Calibration of the Perseus dataset was carried out by members of the SXS team. The manuscript was subject to an internal collaboration-wide review process. All authors reviewed and approved the final version of the manuscript.
Reprints and permissions information is available at www.nature.com/reprints. The authors declare no competing financial interests. Correspondence and requests for materials should be addressed to H. Yamaguchi (hiroya.yamaguchi@nasa.gov) and K. Matsushita (matusita@rs.kagu.tus.ac.jp).
Felix Aharonian1,2,3, Hiroki Akamatsu4, Fumie Akimoto5, Steven W. Allen6,7,8, Lorella Angelini9, Marc Audard10, Hisamitsu Awaki11, Magnus Axelsson12, Aya Bamba13,14, Marshall W. Bautz15, Roger Blandford,6,7,8, Laura W. Brenneman16, Gregory V. Brown17, Esra Bulbul15,16, Edward M. Cackett18, Maria Chernyakova1, Meng P. Chiao9, Paolo S. Coppi19,20, Elisa Costantini4, Jelle de Plaa4, Jan-Willem den Herder4, Chris Done21, Tadayasu Dotani22, Ken Ebisawa22, Megan E. Eckart9, Teruaki Enoto23,24, Yuichiro Ezoe25, Andrew C. Fabian26, Carlo Ferrigno10, Adam R. Foster16, Ryuichi Fujimoto27, Yasushi Fukazawa28, Akihiro Furuzawa29, Massimiliano Galeazzi30, Luigi C. Gallo31, Poshak Gandhi32, Margherita Giustini4, Andrea Goldwurm33,34, Liyi Gu4, Matteo Guainazzi35, Yoshito Haba36, Kouichi Hagino37, Kenji Hamaguchi9,38, Ilana M. Harrus9,38, Isamu Hatsukade39, Katsuhiro Hayashi22,40, Takayuki Hayashi40, Kiyoshi Hayashida41, Junko S. Hiraga42, Ann Hornschemeier9, Akio Hoshino43, John P. Hughes44, Yuto Ichinohe25, Ryo Iizuka22, Hajime Inoue45, Yoshiyuki Inoue22, Manabu Ishida22, Kumi Ishikawa22, Yoshitaka Ishisaki25, Masachika Iwai22, Jelle Kaastra4,46, Tim Kallman9, Tsuneyoshi Kamae13, Jun Kataoka47, Satoru Katsuda48, Nobuyuki Kawai49, Richard L. Kelley9, Caroline A. Kilbourne9, Takao Kitaguchi28, Shunji Kitamoto43, Tetsu Kitayama50, Takayoshi Kohmura37, Motohide Kokubun22, Katsuji Koyama51, Shu Koyama22, Peter Kretschmar52, Hans A. Krimm53,54, Aya Kubota55, Hideyo Kunieda40, Philippe Laurent33,34, Shiu-Hang Lee23, Maurice A. Leutenegger9,38, Olivier Limousine34, Michael Loewenstein9,56, Knox S. Long57, David Lumb35, Greg Madejski6, Yoshitomo Maeda22, Daniel Maier33,34, Kazuo Makishima58, Maxim Markevitch9, Hironori Matsumoto41, Kyoko Matsushita59, Dan McCammon60, Brian R. McNamara61, Missagh Mehdipour4, Eric D. Miller15, Jon M. Miller62, Shin Mineshige23, Kazuhisa Mitsuda22, Ikuyuki Mitsuishi40, Takuya Miyazawa63, Tsunefumi Mizuno28,64, Hideyuki Mori9, Koji Mori39, Koji Mukai9,38, Hiroshi Murakami65, Richard F. Mushotzky56, Takao Nakagawa22, Hiroshi Nakajima41, Takeshi Nakamori66, Shinya Nakashima58, Kazuhiro Nakazawa13,14, Kumiko K. Nobukawa67, Masayoshi Nobukawa68, Hirofumi Noda69,70, Hirokazu Odaka6, Takaya Ohashi25, Masanori Ohno28, Takashi Okajima9, Naomi Ota67, Masanobu Ozaki22, Frits Paerels71, Stéphane Paltani10, Robert Petre9, Ciro Pinto26, Frederick S. Porter9, Katja Pottschmidt9,38, Christopher S. Reynolds56, Samar Safi-Harb72, Shinya Saito43, Kazuhiro Sakai9, Toru Sasaki59, Goro Sato22, Kosuke Sato59, Rie Sato22, Makoto Sawada73, Norbert Schartel52, Peter J. Serlemitsos9, Hiromi Seta25, Megumi Shidatsu58, Aurora Simionescu22, Randall K. Smith16, Yang Soong9, Łukasz Stawarz74, Yasuharu Sugawara22, Satoshi Sugita49, Andrew Szymkowiak20, Hiroyasu Tajima5, Hiromitsu Takahashi28, Tadayuki Takahashi22, Shin’ichiro Takeda63, Yoh Takei22, Toru Tamagawa75, Takayuki Tamura22, Takaaki Tanaka51, Yasuo Tanaka76,22, Yasuyuki T. Tanaka28, Makoto S. Tashiro77, Yuzuru Tawara40, Yukikatsu Terada77, Yuichi Terashima11, Francesco Tombesi9,56,78, Hiroshi Tomida22, Yohko Tsuboi48, Masahiro Tsujimoto22, Hiroshi Tsunemi41, Takeshi Go Tsuru51, Hiroyuki Uchida51, Hideki Uchiyama79, Yasunobu Uchiyama43, Shutaro Ueda22, Yoshihiro Ueda23, Shin’ichiro Uno80, C. Megan Urry20, Eugenio Ursino30, Cor P. de Vries4, Shin Watanabe22, Norbert Werner81,82,28, Daniel R. Wik83,9,84, Dan R. Wilkins6, Brian J. Williams57, Shinya Yamada25, Hiroya Yamaguchi9,56, Kazutaka Yamaoka5,40, Noriko Y. Yamasaki22, Makoto Yamauchi39, Shigeo Yamauchi67, Tahir Yaqoob9,38, Yoichi Yatsu49, Daisuke Yonetoku27, Irina Zhuravleva6,7, Abderahmen Zoghbi62
Dublin Institute for Advanced Studies, 31 Fitzwilliam Place, Dublin 2, Ireland
Max-Planck-Institut für Kernphysik, P.O. Box 103980, 69029 Heidelberg, Germany
Gran Sasso Science Institute, viale Francesco Crispi, 7 67100 L’quila (AQ), Italy
SRON Netherlands Institute for Space Research, Sorbonnelaan 2, 3584 CA Utrecht, The Netherlands
Institute for Space-Earth Environmental Research, Nagoya University, Furo-cho, Chikusa-ku, Nagoya, Aichi 464-8601, Japan
Kavli Institute for Particle Astrophysics and Cosmology, Stanford University, 452 Lomita Mall, Stanford, CA 94305, USA
Department of Physics, Stanford University, 382 Via Pueblo Mall, Stanford, CA 94305, USA
SLAC National Accelerator Laboratory, 2575 Sand Hill Road, Menlo Park, CA 94025, USA
NASA, Goddard Space Flight Center, 8800 Greenbelt Road, Greenbelt, MD 20771, USA
Department of Astronomy, University of Geneva, ch. d’Écogia 16, CH-1290 Versoix, Switzerland
Department of Physics, Ehime University, Bunkyo-cho, Matsuyama, Ehime 790-8577, Japan
Department of Physics and Oskar Klein Center, Stockholm University, 106 91 Stockholm, Sweden
Department of Physics, The University of Tokyo, 7-3-1 Hongo, Bunkyo-ku, Tokyo 113-0033, Japan
Research Center for the Early Universe, School of Science, The University of Tokyo, 7-3-1 Hongo, Bunkyo-ku, Tokyo 113-0033, Japan
Kavli Institute for Astrophysics and Space Research, Massachusetts Institute of Technology, 77 Massachusetts Avenue, Cambridge, MA 02139, USA
Smithsonian Astrophysical Observatory, 60 Garden St., MS-4. Cambridge, MA 02138, USA
Lawrence Livermore National Laboratory, 7000 East Avenue, Livermore, CA 94550, USA
Department of Physics and Astronomy, Wayne State University, 666 W. Hancock St, Detroit, MI 48201, USA
Astronomy Department, Yale University, New Haven, CT 06520-8101, USA
Physics Department, Yale University, New Haven, CT 06520-8120, USA
Centre for Extragalactic Astronomy, Department of Physics, University of Durham, South Road, Durham, DH1 3LE, UK
Japan Aerospace Exploration Agency, Institute of Space and Astronautical Science, 3-1-1 Yoshino-dai, Chuo-ku, Sagamihara, Kanagawa 252-5210, Japan
Department of Astronomy, Kyoto University, Kitashirakawa-Oiwake-cho, Sakyo-ku, Kyoto 606-8502, Japan
The Hakubi Center for Advanced Research, Kyoto University, Kyoto 606-8302, Japan
Department of Physics, Tokyo Metropolitan University, 1-1 Minami-Osawa, Hachioji, Tokyo 192-0397, Japan
Institute of Astronomy, University of Cambridge, Madingley Road, Cambridge, CB3 0HA, UK
Faculty of Mathematics and Physics, Kanazawa University, Kakuma-machi, Kanazawa, Ishikawa 920-1192, Japan
School of Science, Hiroshima University, 1-3-1 Kagamiyama, Higashi-Hiroshima 739-8526, Japan
Fujita Health University, Toyoake, Aichi 470-1192, Japan
Physics Department, University of Miami, 1320 Campo Sano Dr., Coral Gables, FL 33146, USA
Department of Astronomy and Physics, Saint Mary’s University, 923 Robie Street, Halifax, NS, B3H 3C3, Canada
Department of Physics and Astronomy, University of Southampton, Highfield, Southampton, SO17 1BJ, UK
Laboratoire APC, 10 rue Alice Domon et Léonie Duquet, 75013 Paris, France
CEA Saclay, 91191 Gif sur Yvette, France
European Space Research and Technology Center, Keplerlaan 1 2201 AZ Noordwijk, The Netherlands
Department of Physics and Astronomy, Aichi University of Education, Aichi 448-8543, Japan
Department of Physics, Tokyo University of Science, 2641 Yamazaki, Noda, Chiba, 278-8510, Japan
Department of Physics, University of Maryland Baltimore County, 1000 Hilltop Circle, Baltimore, MD 21250, USA
Department of Applied Physics and Electronic Engineering, University of Miyazaki, 1-1 Gakuen Kibanadai-Nishi, Miyazaki, 889-2192, Japan
Department of Physics, Nagoya University, Furo-cho, Chikusa-ku, Nagoya, Aichi 464-8602, Japan
Department of Earth and Space Science, Osaka University, 1-1 Machikaneyama-cho, Toyonaka, Osaka 560-0043, Japan
Department of Physics, Kwansei Gakuin University, 2-1 Gakuen, Sanda, Hyogo 669-1337, Japan
Department of Physics, Rikkyo University, 3-34-1 Nishi-Ikebukuro, Toshima-ku, Tokyo 171-8501, Japan
Department of Physics and Astronomy, Rutgers University, 136 Frelinghuysen Road, Piscataway, NJ 08854, USA
Meisei University, 2-1-1 Hodokubo, Hino, Tokyo 191-8506, Japan
Leiden Observatory, Leiden University, PO Box 9513, 2300 RA Leiden, the Netherlands
Research Institute for Science and Engineering, Waseda University, 3-4-1 Ohkubo, Shinjuku, Tokyo, 169-8555, Japan
Department of Physics, Chuo University, 1-13-27 Kasuga, Bunkyo, Tokyo 112-8551, Japan
Department of Physics, Tokyo Institute of Technology, 2-12-1 Ookayama, Meguro-ku, Tokyo 152-8550, Japan
Department of Physics, Toho University, 2-2-1 Miyama, Funabashi, Chiba 274-8510, Japan
Department of Physics, Kyoto University, Kitashirakawa-Oiwake-Cho, Sakyo, Kyoto 606-8502, Japan
European Space Astronomy Center, Camino Bajo del Castillo, s/n., 28692 Villanueva de la Cañada, Madrid, Spain
Universities Space Research Association, 7178 Columbia Gateway Drive, Columbia, MD 21046, USA
National Science Foundation, 4201 Wilson Blvd, Arlington, VA 22230, USA
Department of Electronic Information Systems, Shibaura Institute of Technology, 307 Fukasaku, Minuma-ku, Saitama-shi, Saitama 337-8570, Japan
Department of Astronomy, University of Maryland, College Park, MD 20742, USA
Space Telescope Science Institute, 3700 San Martin Drive, Baltimore, MD 21218, USA
Institute of Physical and Chemical Research, 2-1 Hirosawa, Wako, Saitama 351-0198
Department of Physics, Tokyo University of Science, 1-3 Kagurazaka, Shinjuku-ku, Tokyo 162-8601, Japan
Department of Physics, University of Wisconsin, Madison, WI 53706, USA
Department of Physics and Astronomy, University of Waterloo, 200 University Avenue West, Waterloo, Ontario, N2L 3G1, Canada
Department of Astronomy, University of Michigan, 1085 South University Avenue, Ann Arbor, MI 48109, USA
Okinawa Institute of Science and Technology Graduate University, 1919-1 Tancha, Onna-son Okinawa, 904-0495, Japan
Hiroshima Astrophysical Science Center, Hiroshima University, Higashi-Hiroshima, Hiroshima 739-8526, Japan
Faculty of Liberal Arts, Tohoku Gakuin University, 2-1-1 Tenjinzawa, Izumi-ku, Sendai, Miyagi 981-3193
Faculty of Science, Yamagata University, 1-4-12 Kojirakawa-machi, Yamagata, Yamagata 990-8560, Japan
Department of Physics, Nara Women’s University, Kitauoyanishi-machi, Nara, Nara 630-8506, Japan
Department of Teacher Training and School Education, Nara University of Education, Takabatake-cho, Nara, Nara 630-8528, Japan
Frontier Research Institute for Interdisciplinary Sciences, Tohoku University, 6-3 Aramakiazaaoba, Aoba-ku, Sendai, Miyagi 980-8578, Japan
Astronomical Institute, Tohoku University, 6-3 Aramakiazaaoba, Aoba-ku, Sendai, Miyagi 980-8578, Japan
Astrophysics Laboratory, Columbia University, 550 West 120th Street, New York, NY 10027, USA
Department of Physics and Astronomy, University of Manitoba, Winnipeg, MB R3T 2N2, Canada
Department of Physics and Mathematics, Aoyama Gakuin University, 5-10-1 Fuchinobe, Chuo-ku, Sagamihara, Kanagawa 252-5258, Japan
Astronomical Observatory of Jagiellonian University, ul. Orla 171, 30-244 Kraków, Poland
RIKEN Nishina Center, 2-1 Hirosawa, Wako, Saitama 351-0198, Japan
Max Planck Institute for extraterrestrial Physics, Giessenbachstrasse 1, 85748 Garching, Germany
Department of Physics, Saitama University, 255 Shimo-Okubo, Sakura-ku, Saitama, 338-8570, Japan
Department of Physics, University of Rome “Tor Vergata”, Via della Ricerca Scientifica 1, I-00133 Rome, Italy
Faculty of Education, Shizuoka University, 836 Ohya, Suruga-ku, Shizuok a 422-8529, Japan
Faculty of Health Sciences, Nihon Fukushi University , 26-2 Higashi Haemi-cho, Handa, Aichi 475-0012, Japan
MTA-Eötvös University Lendület Hot Universe Research Group, Pázmány Péter sétány 1/A, Budapest, 1117, Hungary
Department of Theoretical Physics and Astrophysics, Faculty of Science, Masaryk University, Kotlářská 2, Brno, 611 37, Czech Republic
Department of Physics and Astronomy, University of Utah, 115 South 1400 East, Salt Lake City, Utah 84112, USA
The Johns Hopkins University, Homewood Campus, Baltimore, MD 21218, USA
0.1 Observations and Data Reduction:
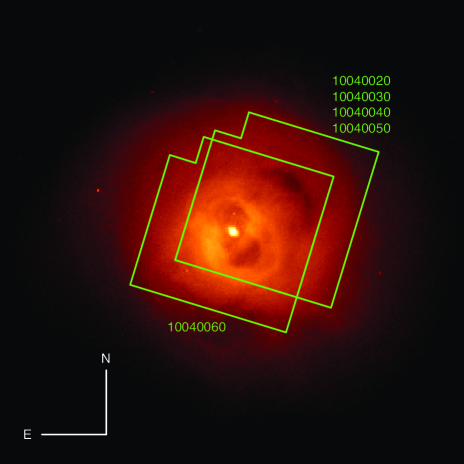
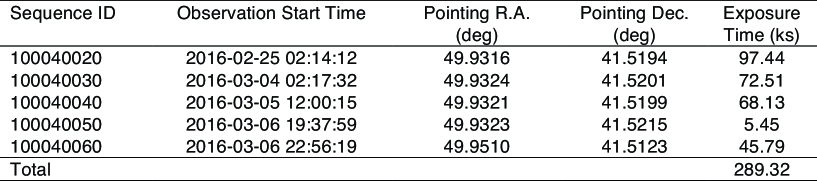
The Hitomi observations of the Perseus Cluster core were performed using the SXS in the sequences summarized in Extended Data Table 1. The SXS field of view (FoV) of each sequence is indicated in Extended Data Figure 1. The data from the first four sequences, whose aim points were almost identical, were used in our previous work as well[18]. The spacecraft attitude was slightly different for the last sequence, so that the nucleus of NGC 1275 was observed using the central pixels of the SXS. The aperture window consisting of a 262-m Be filter and several contaminant materials [32] was not opened before the loss of the mission. This filter significantly attenuated the SXS effective area especially in the soft X-ray band, limiting the SXS bandpass to above 1.8 keV.
The data reduction was made with public tools provided by NASA’s HEASARC. We used cleaned event data of the latest release version with the standard screening for the post-pipeline processes[33]. The spectral analysis was performed using only GRADE Hp (high-resolution primary) events that have the best energy resolution. The redistribution matrix file (RMF) was generated with the extra-large size option, which accounts for all components of the line spread function, including the main peak, low-energy exponential tail, escape peaks, and electron-loss continuum[32, 34]. The full width at half maximum (FWHM) of the main-peak component was measured to be 4.9 eV for the 55Fe calibration source[35, 36].
0.2 Additional Gain Correction:
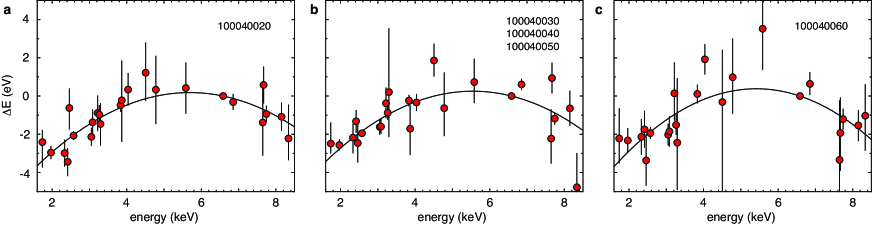
Because of the short life of the mission, opportunities for onboard calibration were limited. This caused some uncertainty in the detector gain (pulse height–energy conversion factors), particularly at the energies far from the Mn K calibration lines at 5.9 keV (in a calibration pixel irradiated by a 55Fe source). We thus applied the following gain calibration and correction using the Perseus data themselves.
First, we model the Fe He complex with an ionization equilibrium plasma for each pixel in each sequence (combining the second through fourth sequences in Extended Data Table 1, since these were parts of a continuous observation with almost identical instrumental conditions), and scaled the spectrum with a linear function such that the Fe He energies match the theoretical values at the redshift of NGC 1275 ()[37]. We then merged the data of all the pixels and measured the X-ray energies of detected lines. The differences between the measured and theoretical energies are plotted in Extended Data Figure 2. The discrepancy, while small, increases toward lower and higher energies with respect to the calibration source line (i.e., 5.9 keV). We empirically fit these plots with a parabolic function, and then updated the pulse invariant spectral channel of each detected event using the derived coefficients. Readers are cautioned that this empirical correction should not be used outside of the range of the fit; in particular, the actual gain error must be almost zero at the energies near 0 eV. The data from all sequences were then combined to increase the photon statistics. Hereafter, we use this merged, gain-corrected spectrum. We also appropriately took into account the off-axis effective area of the Soft X-ray Telescope (SXT) [38], when generating the telescope response for the merged data.
0.3 Spectral Analysis:
We analyzed the SXS spectrum in the 1.8–9.0 keV band with an energy bin size of 1 eV. The spectral fitting was made using the C statistic[39] without subtracting any background component, since its level is negligibly low ( counts s-1 keV-1 for the entire field of view), with even its strongest emission lines well below the source flux in the 1.8–9.0 keV energy band. In fact, no significant change in the spectral parameters is found, if we fit the source spectrum by simultaneously modeling the instrumental background data extracted from the night-Earth observations. The cosmic X-ray background is also negligible at this cluster core region; well below 1% of the source emission over the entire energy band[40].
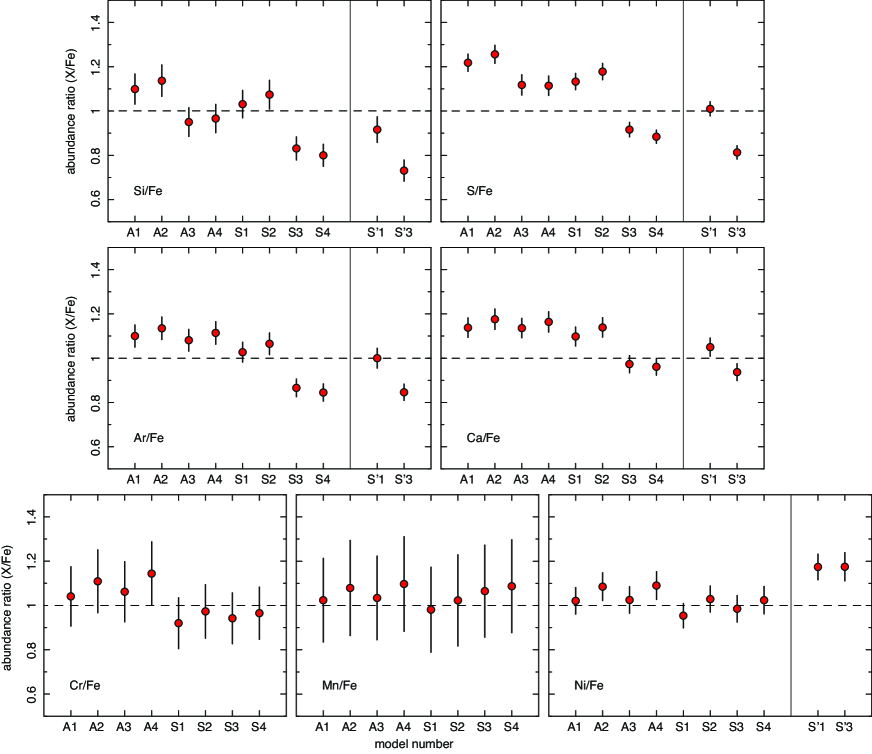
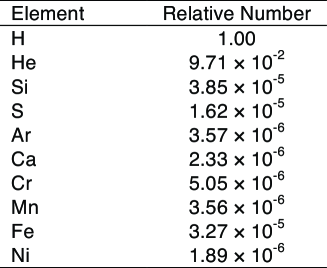
We fit the spectrum of the Perseus Cluster with a single-temperature optically thin thermal plasma model (bvvapec model in the XSPEC package) based on the latest version of the atomic database, AtomDB v.3.0.8[41]. The fitted parameters included the electron temperature (), redshift (), turbulence velocity (), emission measure, and the elemental abundances of Si, S, Ar, Ca, Cr, Mn, Fe, and Ni relative to the solar values (Extended Data Table 2)[26]. We included a power-law component and redshifted lines of Fe I K fluorescence (6.4 keV at the rest frame) to account for the emission from the AGN of NGC 1275[42]. The photon index and flux of the power law component were determined to be and erg s-1 cm-2 using an AGN-dominated spectrum derived by SXS image analysis decomposing AGN and ICM emissions, and fixed to these values in the analysis of the ICM spectrum (Fig. 1) that was extracted from the entire SXS array. A foreground absorption column () was fixed at cm-2 [43]. The possible effect of resonance scattering (RS)[44, 18] was accounted by adding a Gaussian at the energy of the Fe XXV resonance line with a negative flux. Weak 55Fe calibration source leakage events were taken into account by adding narrow Gaussians at the theoretical energies of the Mn K lines, although this has no impact on our analysis results. With this model (hereafter “Model A1”), we obtained best-fit values of = 3.97 0.02 keV and the absolute Fe abundance (i.e., the Fe/H number ratio relative to the solar values) of 0.63 0.01 solar, with a C-statistic and of 7483 and 7862, respectively (7180 degrees of freedom). The relative abundances of the other elements (with respect to Fe) are shown in Extended Data Figure 3. Note that the uncertainty in our gain correction is less than 1 eV at energies near the Mn K calibration lines (Extended Data Figure 2), and thus its effect is negligible for the determination of the Fe-peak element abundances.
We carefully estimated systematic uncertainties in the measured abundances by introducing different models and assumptions. First, we excluded the RS correction, i.e., the negative-flux Fe XXV line (Model A2). This did not substantially change the relative abundances, confirming suggestions in previous work on this object[42, 40]. We also fit the spectrum with two-temperature models, with and without the RS effect (Models A3 and A4, respectively). In these models, the parameters other than the temperatures and emission measures were linked between the two components. We obtained best-fit temperatures of = 4.04 0.05 keV and = 1.60 0.27 keV with 2–10-keV flux ratio () of 33.5 for Model A3, and similar values for Model A4. This indicates that the 4-keV component dominates over the entire SXS band and that the one-temperature modeling is already a good approximation for the observed region in this bandpass, although the presence of a multi-temperature plasma was previously inferred for this cluster[45, 44]. already a good approximation for the observed region in this bandpass, although the presence of a multi-temperature plasma was previously inferred for this cluster[45, 44]. We also treated the absorption columns and the AGN spectral index and flux as free parameters, and confirmed no significant change in the relative abundances among the Fe-peak elements. Finally, we used the SPEX atomic code v.3.03[46] to fit the same spectral data with the same model components and assumptions (Models S1–S4, equivalent to Models A1–A4, respectively). The measured abundance ratios for each model are summarized in Extended Data Figure 3. The ranges between the minimum and maximum values among Models A1–A4 and S1–S4 are given in Fig. 2 as the uncertainty for the abundance of each element. The systematic uncertainties owing to the different atomic codes and assumptions are larger than the statistical errors but reasonably small for most of the elements. All the metal abundances are found to be fairly consistent with the solar values[26]. There are no significant differences in abundances derived from analysis of a region excluding the box centered on the AGN of NGC 1275.
We have found that the abundance ratios of Cr/Fe, Mn/Fe, and Ni/Fe are systematically lower than those determined in recent XMM-Newton studies[12]. Because an old plasma model (SPEX v.2.05) was used in this previous work, we also fit the SXS spectrum using that model for direct comparison. The results from one- and two-temperature modeling with the RS correction are given in Extended Data Figure 3 (Models S′1 and S′3, respectively) and Extended Data Figure 4 (red diamonds) with the combined uncertainty ranges. Cr and Mn abundances are not presented, because the SPEX v.2.05 atomic code does not contain emission from these elements — in the previous work, abundances of these elements were calculated by referring to emissivity data in an early development version of SPEX v.3. The Ni abundance determined from this old atomic model is slightly higher than from the latest one (SPEX v.3.03), but still lower than the XMM-Newton results. In fact, there is little difference in the Ni-He emissivity itself between SPEX v.2.05 and v.3.03. We find significant differences between the two SPEX versions in the line emissivities of Fe XXIV and Fe XXV complex at the rest frame energies of 7.6–7.9 keV. Given that these emission cannot be separated from the Ni resonance line in CCD spectra, the Ni abundance might have been biased in the previous measurements.
Since Cr and Mn are rarely detected from individual objects with CCD observations, it is not obvious whether the supersolar abundances derived from the integrated XMM-Newton data of the 44 objects are real or biased. On the other hand, Suzaku observations (with similar CCDs) detected these elements from the same Perseus core region as in this work[40]. The Suzaku-measured abundances, converted to the same scale using the up-to-date solar abundance table[26], are compared with the Hitomi and XMM-Newton results in Extended Data Figure 4 (green squares). This earlier measurement of the Mn/Fe ratio is significantly lower than ours, further motivating the following demonstration of the robustness of our measurements compared to that of CCD observations.
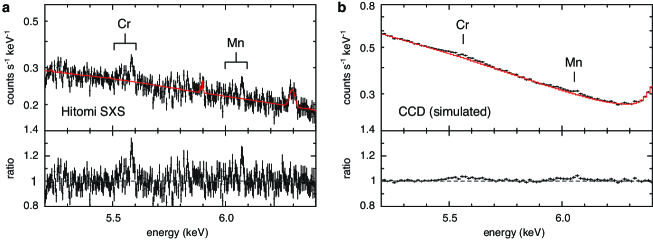
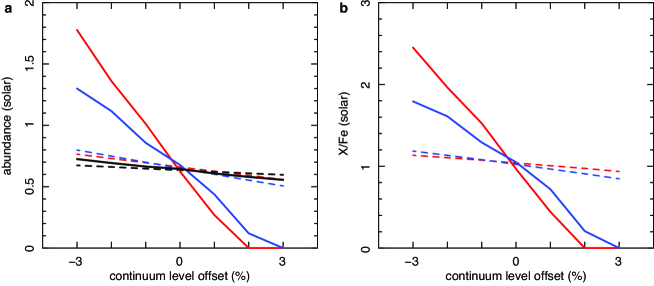
Extended Data Figure 5(a) shows the SXS spectrum near the Cr and Mn emission lines, of which equivalent widths are only a few electron volts. The red line indicates our best-fit model (Model A1) but with Cr and Mn abundances set to zero. As shown in the bottom panel of the figure, the photon count ratios between the line peak and the local continuum level is 1.2 for these weak emission lines in this high-resolution spectrum. Extended Data Figure 5(b) is a similar plot but the spectrum is convolved to the resolution of CCDs using a representative XMM-Newton response function. Unlike the SXS spectrum, the peak-to-continuum level ratios for the Cr and Mn emission are extremely low (only a few percent above unity). Moreover, the emission lines no longer have a sharp profile, implying the difficulty in separating lines from continuum. In fact, if we fit this simulated CCD spectrum with a model with 1% higher/lower continuum normalization, the line components with their broad profiles ‘compensate’ for the excess/lack of continuum flux by requiring 50% lower/higher values of the Cr/Fe and Mn/Fe abundance ratios. The high resolution SXS spectrum is much less subject to such systematic uncertainties, since the line and continuum intensities are measured almost independently and hence a slight over- or under-estimation of the continuum level has little effect on the abundance measurement. This point is more quantitatively illustrated in Extended Data Figure 6, the result of our test analysis.
0.4 Comparison with SN Nucleosynthesis Models:
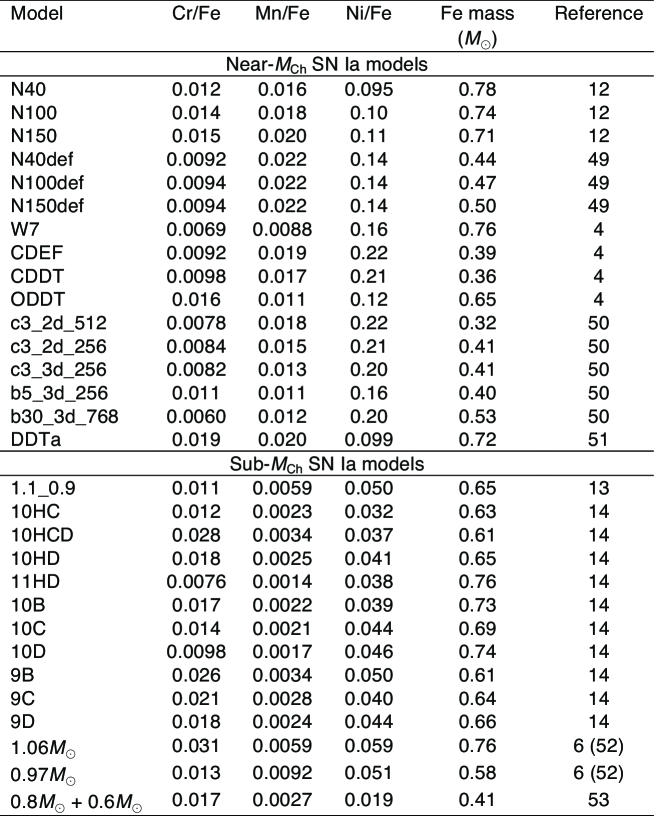
The measured abundances of the Fe-peak elements are compared with theoretical predictions to address the nature of SNe Ia that likely contributed to the chemical enrichment in the Perseus Cluster. As prototype SN Ia models, we select the latest three-dimensional calculations “N100”[13] and “1.1_0.9”[14]. The former assumes a delayed-detonation explosion of a near- WD with 100 deflagration ignition sites. The latter assumes the violent merger of two sub-WDs with masses of 1.1 and 0.9 and subsequent full detonation of the primary (more massive) WD. Both models successfully replicate typical observables of SNe Ia, including the average maximum brightness and synthesized 56Ni mass of 0.6 . The pre-explosion WD is composed of 47.5% 12C, 50% 16O, and 2.5% 22Ne by mass, which corresponds to nearly solar metallicity for the progenitor. As another example of a sub- explosion, we choose the “10HC” model[15], which assumes an explosion of a single C–O WD with a mass of 1.0 accreting helium at a rate yr-1. An initial detonation ignited at the helium layer triggers a second detonation in the CO core, resulting in a complete explosion of the WD with a kinetic energy of erg and 56Ni mass of 0.64 , as typically inferred for SNe Ia.
To account for the CC SN contributions, we consider mass-dependent yields[28] weighted by the Salpeter IMF ( = 2.35), with the assumption that 50% of 25 massive stars explode as hypernovae. Since SNe Ia efficiently produce Fe, whereas SNe CC dominate -element production, the SXS spectra we extracted might be used to constrain the SN Ia/CC ratio in the Perseus Cluster. However, we instead allow a conservatively wide range for the CC SN fraction, = 0.6–0.9[29, 10, 30, 20, 3, 47, 48], rather than determining the actual value. This choice was made because (1) the lighter elements that are most sensitive to (i.e., O, Ne, Mg) were not detected due to the attenuation of soft X-rays by the closed aperture window; (2) the measured abundances of the intermediate -burning elements, unlike those of the Fe-peak elements, are dominated by systematic, rather than the statistical, uncertainties (Extended Data Figure 3); and (3) the primary origins of Ar and Ca is currently under debate[49, 4]. Future high-resolution X-ray spectroscopy with sensitivity to softer X-rays will improve the accuracy of the abundances of the lighter elements, as well as of the ICM spectral model, hence enabling better constrains on the SN Ia/CC ratio. We emphasize that, in contrast to the intermediate -burning elements, the abundances of the Fe-peak elements are robustly determined with little model dependency (Extended Data Figure 3). As a result, the main conclusions of this paper are not affected by any of the issues described above.
The abundance ratios predicted by the model calculations are given in Fig. 3. Because of the efficient electron capture as well as the low entropy freeze-out from nuclear statistical equilibrium[6], higher abundances of Mn and Ni are expected in the near- SNe Ia. We also test other combinations of SN models as well as different IMF slopes (for CC SNe). Extended Data Table 3 summarizes the mass ratios among the Fe-peak elements and Fe yields (in ) predicted by the various SN Ia models we investigated[13, 50, 5, 51, 52, 14, 15, 53, 7, 54]. Since this paper exclusively discusses the products of electron capture, we consider only recent calculations that were based on up-to-date weak interaction rates[55]. For CC SN models, we use different IMF slopes ( = 2.0 and 2.7) and assume that all 10–50 stars explode as normal SNe without any hypernova contribution. These results are summarized in Extended Data Table 4. We reach essentially the same conclusion described in the main text, i.e., higher mass ratios of Mn/Fe and Ni/Fe are always expected from near- SNe Ia (Extended Data Table 3), and a combination of near- and sub- SNe Ia naturally explains the observed abundance pattern of the Fe-peak elements independently of contributions from CC SNe (Extended Data Table 4).
0.5 Data and Code Availability:
The observational data analysed during the current study are available in NASA’s HEASARC repository (https://heasarc.gsfc.nasa.gov). The atomic codes utilized in this study are also available online (AtomDB: http://www.atomdb.org/, SPEX: https://www.sron.nl/astrophysics-spex).
Supplementary Information
H. Yamaguchi thanks Drs. Ivo Seitenzahl, Rüdiger Pakmor, Eduardo Bravo, and Nozomu Tominaga for providing the SN nucleosynthesis models used in this paper. We thank the support from the JSPS Core-to-Core Program. We acknowledge all the JAXA members who have contributed to the ASTRO-H (Hitomi) project. All U.S. members gratefully acknowledge support through the NASA Science Mission Directorate. Stanford and SLAC members acknowledge support via DoE contract to SLAC National Accelerator Laboratory DE-AC3-76SF00515. Part of this work was performed under the auspices of the U.S. DoE by LLNL under Contract DE-AC52-07NA27344. Support from the European Space Agency is gratefully acknowledged. French members acknowledge support from CNES, the Centre National d’Etudes Spatiales. SRON is supported by NWO, the Netherlands Organization for Scientific Research. Swiss team acknowledges support of the Swiss Secretariat for Education, Research and Innovation (SERI). The Canadian Space Agency is acknowledged for the support of Canadian members. We acknowledge support from JSPS/MEXT KAKENHI grant numbers 15H00773, 15H00785, 15H02090, 15H03639, 15H05438, 15K05107, 15K17610, 15K17657, 16H00949, 16H06342, 16K05295, 16K05296, 16K05300, 16K13787, 16K17672, 16K17673, 21659292, 23340055, 23340071, 23540280, 24105007, 24540232, 25105516, 25109004, 25247028, 25287042, 25400236, 25800119, 26109506, 26220703, 26400228, 26610047, 26800102, JP15H02070, JP15H03641, JP15H03642, JP15H03642, JP15H06896, JP16H03983, JP16K05296, JP16K05309, and JP16K17667. The following NASA grants are acknowledged: NNX15AC76G, NNX15AE16G, NNX15AK71G, NNX15AU54G, NNX15AW94G, and NNG15PP48P to Eureka Scientific. H. Akamatsu acknowledges support of NWO via Veni grant. C. Done acknowledges STFC funding under grant ST/L00075X/1. A. Fabian and C. Pinto acknowledge ERC Advanced Grant 340442. P. Gandhi acknowledges JAXA International Top Young Fellowship and UK Science and Technology Funding Council (STFC) grant ST/J003697/2. Y. Ichinohe and K. Nobukawa are supported by the Research Fellow of JSPS for Young Scientists. N. Kawai is supported by the Grant-in-Aid for Scientific Research on Innovative Areas “New Developments in Astrophysics Through Multi-Messenger Observations of Gravitational Wave Sources”. S. Kitamoto is partially supported by the MEXT Supported Program for the Strategic Research Foundation at Private Universities, 2014-2018. B. McNamara and S. Safi-Harb acknowledge support from NSERC. T. Dotani, T. Takahashi, T. Tamagawa, M. Tsujimoto and Y. Uchiyama acknowledge support from the Grant-in-Aid for Scientific Research on Innovative Areas “Nuclear Matter in Neutron Stars Investigated by Experiments and Astronomical Observations”. N. Werner is supported by the Lendület LP2016-11 grant from the Hungarian Academy of Sciences. D. Wilkins is support by NASA through Einstein Fellowship grant number PF6-170160, awarded by the Chandra X-ray Center, operated by the Smithsonian Astrophysical Observatory for NASA under contract NAS8-03060 We thank contributions by many companies, including in particular, NEC, Mitsubishi Heavy Industries, Sumitomo Heavy Industries, and Japan Aviation Electronics Industry.
Finally, we acknowledge strong support from the following engineers. JAXA/ISAS: Chris Baluta, Nobutaka Bando, Atsushi Harayama, Kazuyuki Hirose, Kosei Ishimura, Naoko Iwata, Taro Kawano, Shigeo Kawasaki, Kenji Minesugi, Chikara Natsukari, Hiroyuki Ogawa, Mina Ogawa, Masayuki Ohta, Tsuyoshi Okazaki, Shin-ichiro Sakai, Yasuko Shibano, Maki Shida, Takanobu Shimada, Atsushi Wada, Takahiro Yamada; JAXA/TKSC: Atsushi Okamoto, Yoichi Sato, Keisuke Shinozaki, Hiroyuki Sugita; Chubu U: Yoshiharu Namba; Ehime U: Keiji Ogi; Kochi U of Technology: Tatsuro Kosaka; Miyazaki U: Yusuke Nishioka; Nagoya U: Housei Nagano; NASA/GSFC: Thomas Bialas, Kevin Boyce, Edgar Canavan, Michael DiPirro, Mark Kimball, Candace Masters, Daniel Mcguinness, Joseph Miko, Theodore Muench, James Pontius, Peter Shirron, Cynthia Simmons, Gary Sneiderman, Tomomi Watanabe; ADNET Systems: Michael Witthoeft, Kristin Rutkowski, Robert S. Hill, Joseph Eggen; Wyle Information Systems: Andrew Sargent, Michael Dutka; Noqsi Aerospace Ltd: John Doty; Stanford U/KIPAC: Makoto Asai, Kirk Gilmore; ESA (Netherlands): Chris Jewell; SRON: Daniel Haas, Martin Frericks, Philippe Laubert, Paul Lowes; U of Geneva: Philipp Azzarello; CSA: Alex Koujelev, Franco Moroso.