Defect induced Anderson localization and magnetization in graphene quantum dots
Abstract
We theoretically investigate the effects of atomic defect related short-range disorders and electron-electron interactions on Anderson type localization and the magnetic properties of hexagonal armchair graphene quantum dots using an extended mean-field Hubbard model and wave packet dynamics for the calculation of localization lengths. We observe that randomly distributed defects with concentrations between 1-5% of the total number of atoms leads to localization alongside magnetic puddle-like structures. Although the localization lengths are not affected by interactions, staggered magnetism and localization are found to be enhanced if the defects are distributed unevenly between the sublattices of the honeycomb lattice.
I Introduction
Graphenenovoselov2004electric ; novoselov2005two ; zhang2005experimental ; rycerz2007valley ; Potemski+deHeer+06 , a promising single-layer material for electronics applications, has been getting increasing interest in understanding and engineering its properties at the nanoscale to form graphene nanoribbons and dots. Indeed, electronic, magnetic and optical properties of graphene can be tuned by changing edge, shape, doping and number of layersguclu+book14 ; Trauzettel+07 ; Schnez+Ensslin+08 ; Wimmer+10 ; Ihn+Ensslin+10 ; mueller_yan_nanolett2010 ; Hamalainen+Liljeroth+11 ; Subramaniam+12 ; Olle+Gambardella+12 ; isil+14 ; Ezawa+07 ; FRP+07 ; Wang+Meng+08 ; AHM+08 ; Guclu+09 ; Potasz+10 ; Zarenia+11 ; ma+12 ; Guclu+Potasz+Hawrylak+2013 ; Szalowski+13 ; altintas+2017 ; modarresi+guclu17 ; ozdemir+16 ; guclu2016 ; sevincli+08 ; guclu+bulut15 ; nanostructures1 ; nanostructures2 ; nanostructures3 ; nanostructures4 ; nanostructures5 ; nanoribbonedge5 ; YuanyuanSun+2017 . On the other hand, introducing adatomsAdatomExperimet1 ; AdatomExperimet2 ; AdatomExperimet3 ; AdatomExperimet4 ; AdatomExperimet5 ; AdatomExperimet6 or vacanciesMao+2016 ; VacancyExperimet1 ; VacancyExperimet2 ; VacancyExperimet3 ; AdatomandvacancyExperimet1 can also significantly affect its physical properties. For example, a dramatic increase in resistivity of graphene, metal-to-insulator (localization) behavior and magnetic moment induction which led to spin split state at the Fermi energy were observed in several experimental works by introducing hydrogen adatoms on graphene AdatomExperimet3 ; AdatomExperimet5 ; MetaltoInsulatorExperiment1 . Additionally, local magnetism due to vacancies created by irradiation of graphene samples were detectedVacancyExperimet1 ; AdatomandvacancyExperimet1 .
There have been many theoretical attempts to explain induction of metal-to-insulator transition and magnetism brought about by adatom or vacancy related disorders in graphene structuresAdatomVacancyDFT1 ; VacancyMFH1 ; AdatomMFH1 ; VacancyMixedTheory1 ; AdatomDFT1 ; AdatomDFTMFH1 ; VacancyDFT1 ; AdatomDFTTB ; AdatomDFTMFH2 ; AdatomDFTMFH3 ; AdatomAndersonLocaTB1 ; sevincli+08 ; guclu+bulut15 . For instance, ferromagnetic or antiferromagnetic behavior of quasilocalized states can be induced by introducing two atomic defects on the same or opposite sublattices of the honeycomb lattice. Furthermore, it was found that vacancy related sublattice imbalance which leads to total spin can induce global magnetism predicted by Lieb and sublattice balance which leads to total spin can induce local magnetism by using mean-field Hubbard model for graphene ribbonsVacancyMFH1 ; LiebsTheorem . On the other hand, Schubert et al.AdatomAndersonLocaTB1 used a tight-binding (TB) model ignoring magnetic effects to show that low concentrations of randomly distributed hydrogen adatoms lead to metal-to-insulator transition in graphene, although alongside formation of electron-hole puddles that tend to suppress Anderson localizationAnderson .
An interesting and natural question to ask is whether the magnetic and localization properties are affected by each other, which, to the best of our knowledge, remains unaddressed presumably due to difficulties in incorporating electron-electron interactions in large size systems. In this work, in order to find out the role of atomic defects in both the localization of electronic states and the magnetic behavior at the nanoscale, we perform mean-field Hubbard (MFH) calculations for medium sized graphene quantum dots (GQD). More specifically, we focus on hexagonal shaped GQDs with armchair edges which are, unlike zigzag edges, free of magnetized edge effects. Thus hexagonal armchair GQDs allow for an unbiased investigation of defect induced magnetization and provide a link between nanosize and bulk limits. The localization properties are investigated using wave function dynamics. We show that localization of electronic states can occur due to atomic defects, together with formation of magnetic puddles. We found that, although the localization lengths are not affected by interactions for evenly distributed defects between the two sublattices, an uneven distribution between the two sublattices can significantly enhance both the localization and the magnetization. Surprisingly, no spin dependent localization lengths were observed.
The structure of the paper is as follows. In Sec. II, we describe our model Hamiltonian including electron-electron interaction and the computational methods that we use in order to compute magnetic and localization properties of hexagonal armchair GQDs. The computational results are presented in Sec. III. Finally, Section IV provides summary and conclusion.
II Method and Model
We use the extended one-band MFH model where the single electron states can be written as a linear combination of orbitals on every carbon atom since the sigma orbitals are considered to be mainly responsible for mechanical stability of graphene. Within the extended MFH model, Hamiltonian can be written as:
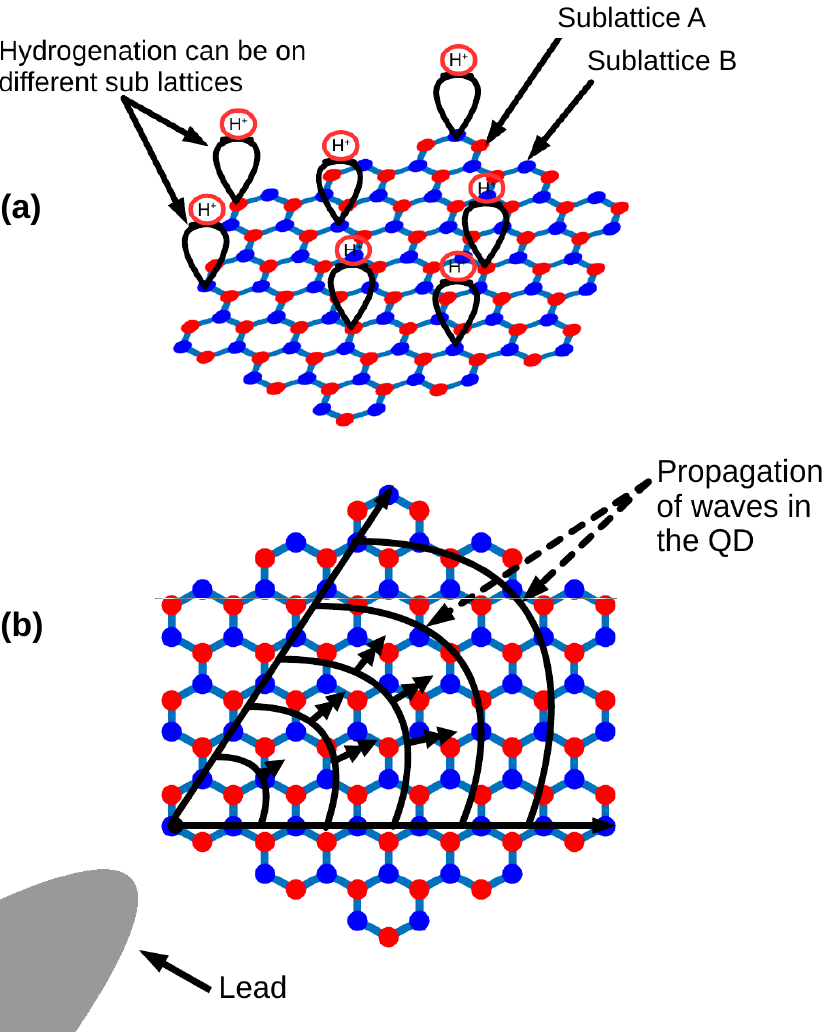
where the first term represents the TB Hamiltonian and are the hopping parameters given by eV for nearest neighbours and eV for next nearest-neighbourshopping1 . The and are creation and annihilation operators for an electron at the -th orbital with spin , respectively. Expectation value of electron densities are represented by . The second and third terms represent onsite and long range Coulomb interactions, respectively. We note however that, the inclusion of long-range Coulomb interactions did not significantly affect the numerical results in this work. This is in contrast with our previous workaltintas+2017 on the investigation of long range scatterers which cause strong density modulations, leading to non-negligible long-range Coulomb interactions. We take onsite interaction parameter as eV and long-range interaction parameters and for the first and second nearest neighbours with effective dielectric constant dielectricconstant1 , respectively. Distant neighbor interaction is taken to be and interaction matrix elements are obtained from numerical calculations by using Slater orbitals Slatermatrix1 . To account for short-range disorder effects (which may be due to vacancies or hydrogen adatoms. See Fig. 1a), we simply remove corresponding orbital sites. This model assumes that sp2 hybridization of atoms neighboring the defect and the honeycomb lattice are not distorted.
A critical step in the numerical calculations is the initial guess state used for the self-consistent diagonalization of the MFH Hamiltonian, as there is a high risk of getting stuck in a local energy minimum for systems with several thousands of atoms. Local version of Lieb’s theorem provides a convenient way to generate the initial state. According to Lieb’s theoremLiebsTheorem , if there is an overall imbalance between the number of A and B sublattice atoms in a bipartite lattice, a finite magnetic moment arises at zero temperature. Locally, such imbalance occurs in the vicinity of atomic defects. Therefore, in our initial density matrices, we assume a surplus of spin up (down) density around type-A (B) vacancies, leading to our lowest energy solution.
Once the self-consistent Hubbard quasi-particle states with energy are obtained, we proceed with the computation of time-dependent wave functions. Assuming an initial wave packet of the electron injected through one corner of the hexagonal QD (See Fig.1b) as with average energy of width , the evolution is given by . When the time scale is sufficiently large, , (where femto second) the system reaches a quasi-stationary state from which it is possible to deduce the localization propertiesAdatomAndersonLocaTB1 .
III Results and Discussions
In the following, we first present our tight-binding results which will serve as a basis to understand the interaction effects within mean-field approximation discussed in subsection (ii). Finally, in subsection (iii), we will focus on the interplay between Anderson localization and magnetization. In this work, we consider defect concentrations of 1%, 2% and 5%. While the defect sites are chosen randomly, we consider two idealized cases where the defects are either perfectly evenly distributed among the sublattices A and B (50-50%) or solely distributed in sublattice A (100-0%). Although these two cases do not represent realistic situations, they provide a good physical picture of possible magnetization effects. The tight-binding calculations are performed for armchair QDs containing 5514, 10806 and 21426 (13, 18 and 25 nm QD size, respectively) atoms, while the mean-field calculations are restricted to 5514 atoms due to computational limits.
III.1 i) Tight-binding results
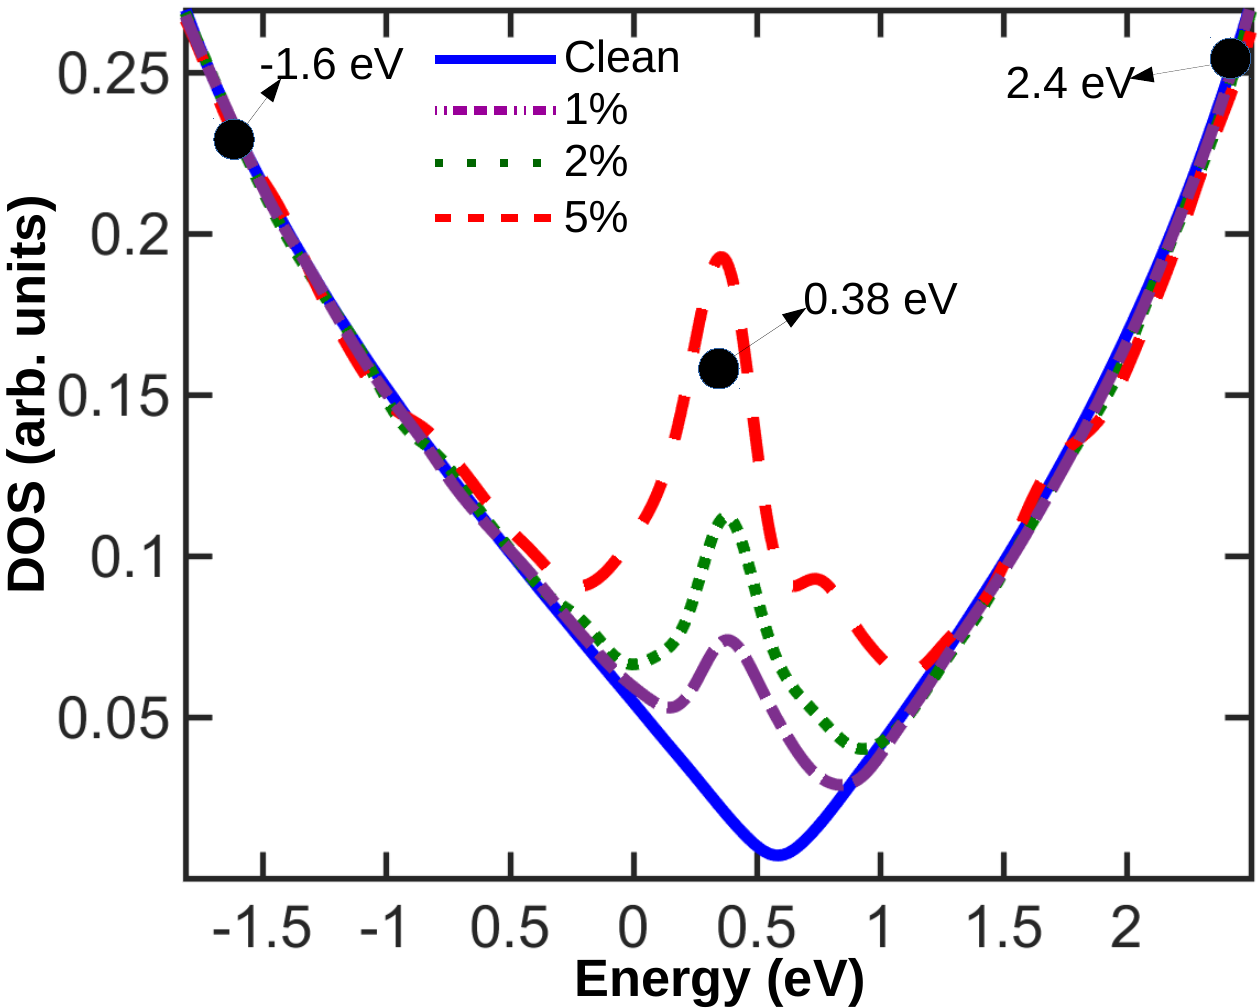
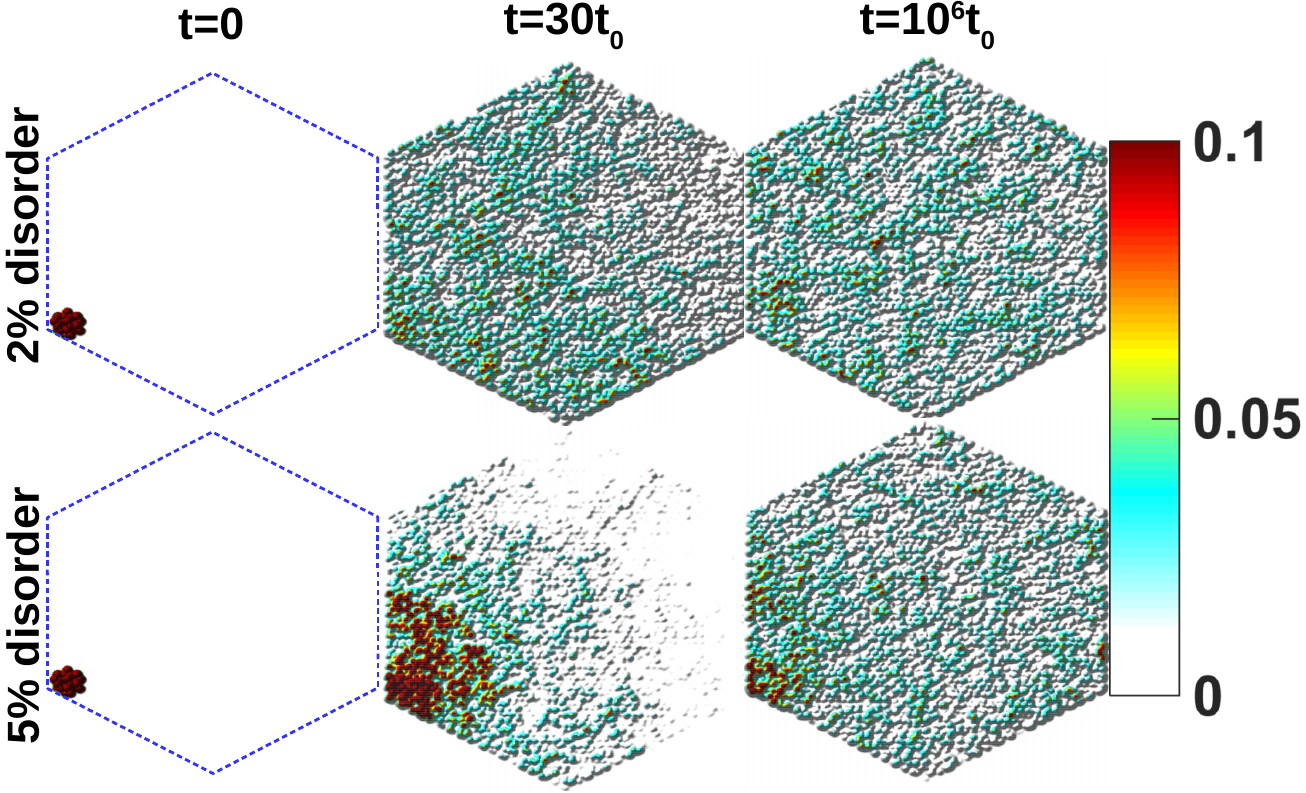
Figure 2 shows the density of states (DOS) in the vicinity of the Fermi level of a 5514 atoms QD for defect-free and disordered cases obtained from TB calculations. Black dots represent energies of interest at which an electron will be injected from the lead. In particular, as the defect concentration increases, a peak in DOS near the Fermi level () is observed, as expected. Corresponding time evolution density plots for a eV wave packet are shown in Fig.3, at , and (from left to right), for defects concentrations of 2% (upper panels) and 5% (lower panels). Initially, at , we assume that the injected wave packet occupies a small, defect-free region of the QD. As is increased, the density propagates slower for higher defect concentrations, before reaching a quasi-stationary state above . At higher time scales, (order of nano second), the wave packet is still localized around the corner of the QD, especially visible at the higher defect concentration.
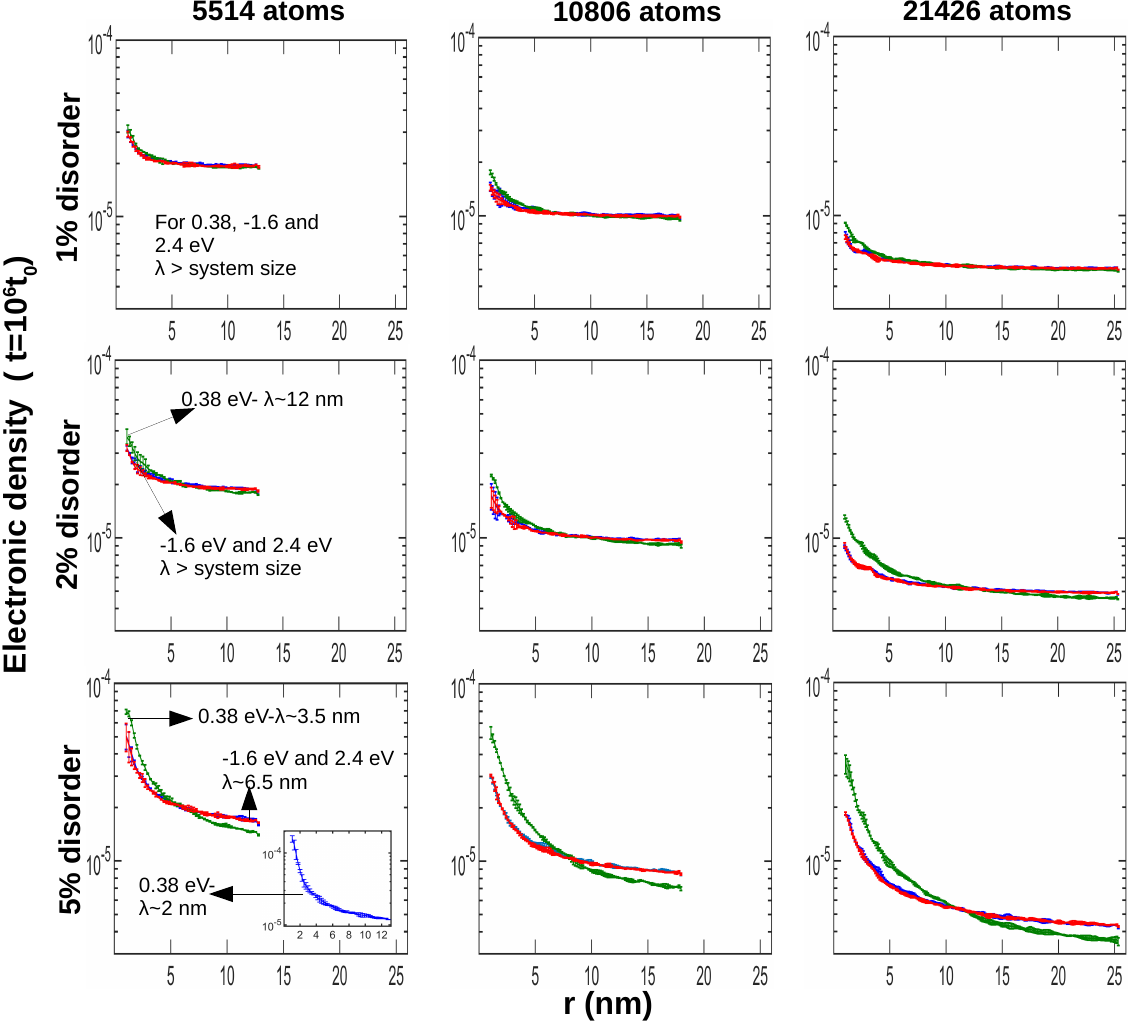
In order to investigate the localization more systematically including size dependence, in Fig.4 we plot the injected electron’s probability density as a function of distance to the lead corner, integrated over an angle of (see Fig.1b), and averaged over 20 randomly generated defect configurations (evenly distributed between sublattice A (50%) and B (50%) for the main frames but unevenly as A (100%) and B (0%) for the inset figure), obtained from TB calculations. Moreover, time averages over 36 samples between and were performed. Here, each column corresponds to a different size GQD while each row corresponds to a different defect concentration. Localization lengths denoted by were estimated for different injected electron energies (one near the Fermi level, other two in deep conduction and valence bands), by logarithmic curve fittingAdatomAndersonLocaTB1 . At defect concentration, size effects dominate the densities. Estimated localization length is larger than the system size even for the largest QD (25 nm wide) and the energy dependence is weak. As the defect concentration is increased to , we find nm for 0.38 eV (Fermi level energy) for all QD sizes. At -1.6 and 2.4 eV, exceeds the system size. Finally, increasing defect concentration to 5% decreases localization length to nm for eV for all QD sizes. Additionally, we start to observe localization ( nm) for the energies = -1.6 and 2.4 eV. The calculated localization lengths here are consistent with the TB results by Schubert et al.AdatomAndersonLocaTB1 obtained for ribbon geometries. Furthermore, as seen in the inset of Fig.4 , the localization is enhanced for an unbalanced distribution of 100-0%, consistent with the finding of Ref. cresti2013broken, obtained for bulk graphene.
III.2 ii) Mean-field Hubbard results
In previous subsection, we have shown that localization lenght in armchair QDs can be as low as nm as the disorder concentration is increased to 5% for a random but uneven distribution (50-50%) among the two sublattices of the honeycomb lattice, and nm for the same sublattice distribution. These localization lengths are lower than the system size of the smallest QD with 5514 atoms (13 nm wide). In the following, we will focus on 13 nm QDs in order to investigate the effects of interactions on spin densities and DOS through self-consistent mean-field Hubbard calculations.
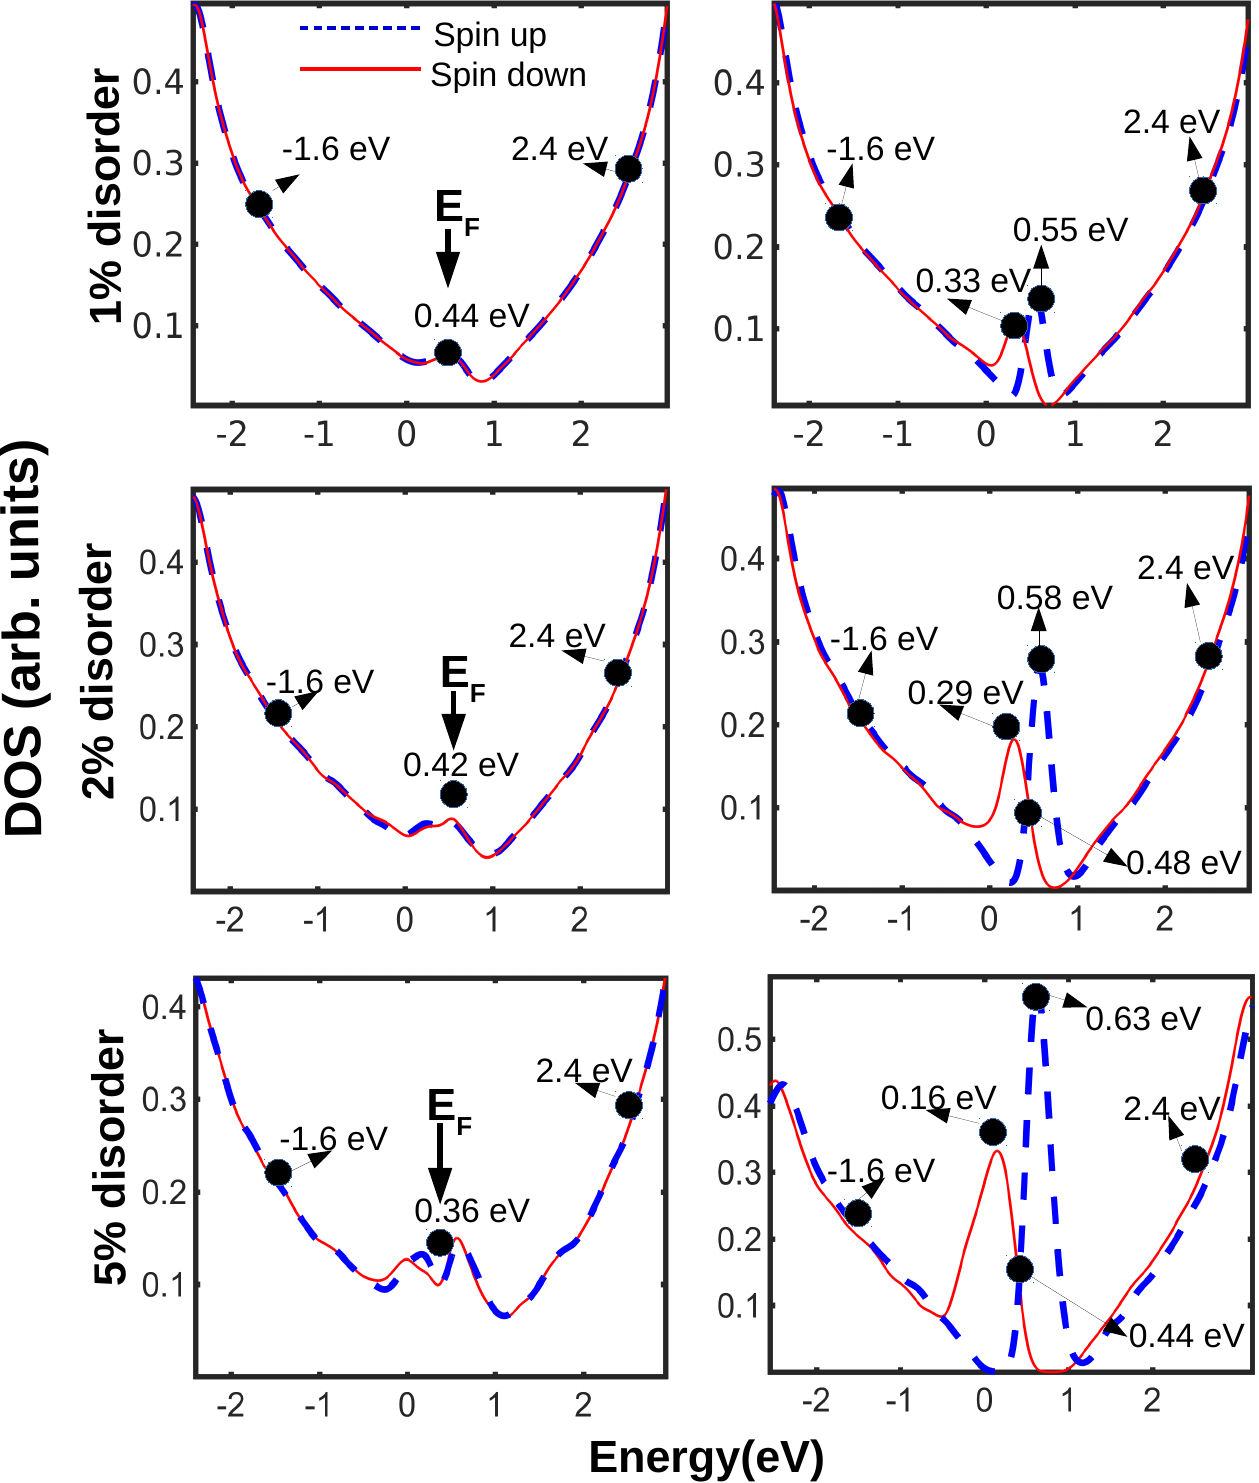
Figure 5 shows the spin resolved DOS for defects concentrations of 1% (upper panels), 2% (middle panels) and 5% (lower panels). On the left panels, we consider equal number of randomly distributed defects on A and B sublattices (50-50 %). Even though the total spin of such a system is zero as predicted by Lieb’s theoremLiebsTheorem , a slight asymmetry can be observed between spin up and down impurity peaks in the vicinity of Fermi level, due to broken sublattice symmetry. On the other extreme, if all defects are placed on sublattice A (right panel), total spin is equal to half of the total number of defects, and a clear spin splitting is observed in DOS, a signature of ferromagnetic coupling. As expected, as the concentration of defects is increased from 1% to 5%, impurity peaks become more pronounced. Again, the black dots represent energy values of interest which will be used below to calculate the localization lengths for wave packets with different average energies.
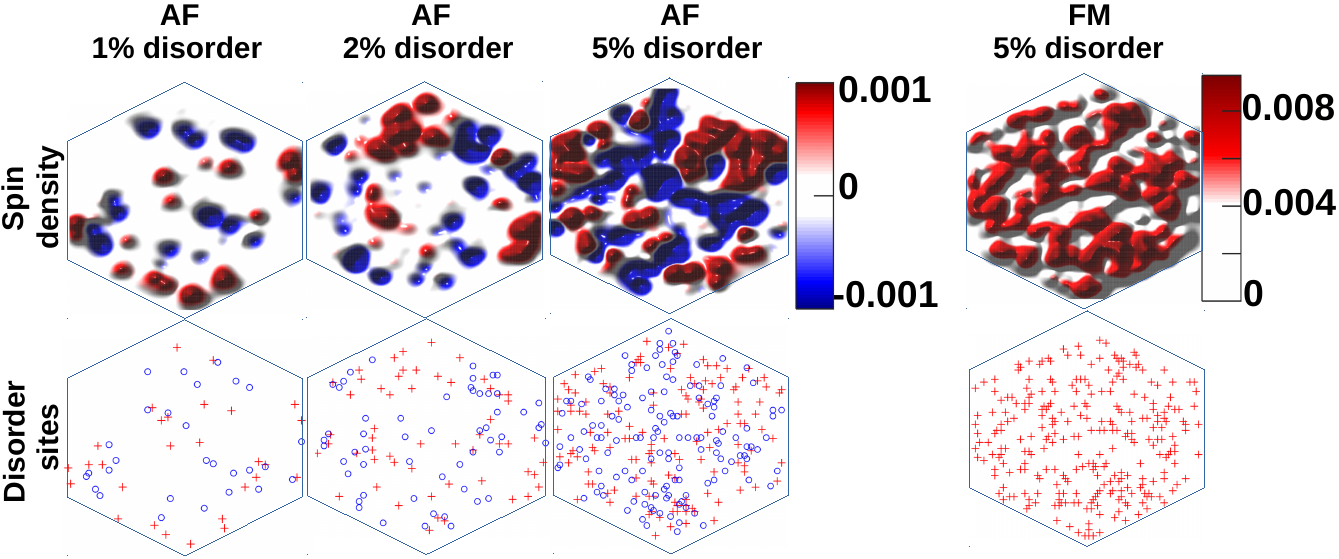
Before discussing the spin-dependent localization properties, in Fig. 6, we examine spin densities (upper panels) in terms of defect positions (lower panels) for different concentrations and sublattice distributions. When the system is antiferromagnetic (AFM, for even number of sublattice A and B defects), statistical distribution of defects gives rise to formation of magnetic puddles with opposite signs (shown in red and blue colors online). We note that, a formation of (non-magnetic) electron-hole puddles due to atomic defects was previously observed in a TB study of LDOS in large graphene ribbon structures AdatomAndersonLocaTB1 . It was found that as the defect concentration increases from 0.1% to 1%, the spatial extent of electronic puddles is reduced below 1 nm from 5-10 nm. Although the scale of our magnetic puddle size is consistent with the findings of Ref.AdatomAndersonLocaTB1, for 1% impurity concentration, we do not observe clear change in puddle size as we increase the defect concentrations. The formation of magnetic puddles observed in our calculations is presumably mainly due to the statistical distribution of defect-induced spins rather than more subtle quantum interference or interaction effects. We observed similar magnetic puddle-like structures for other 19 different disorder configurations. On the other hand, for the uncompensated distribution of defects (100-0%), the coupling between the local magnetic moments is ferromagnetic (FM), as shown in the rightmost panel. Interestingly, the magnitude of the magnetic moments is almost an order of magnitude larger than for the FM case. This is somewhat consistent with the findings of Ref.AdatomDFTMFH3, where it was found that for defect concentrations larger than 0.6%, the antiferromagnetic coupling is suppressed. However, in our results, we find a reduction of magnetization instead of a complete suppression, even at high defect concentrations. This difference is due to the complete randomization of defect positions (for a given concentration) assumed in our model, unlike the fixed inter-defect distance model used in Ref.AdatomDFTMFH3, . We will investigate this issue further through staggered magnetization in the next subsection.
III.3 iii) Localization versus magnetization
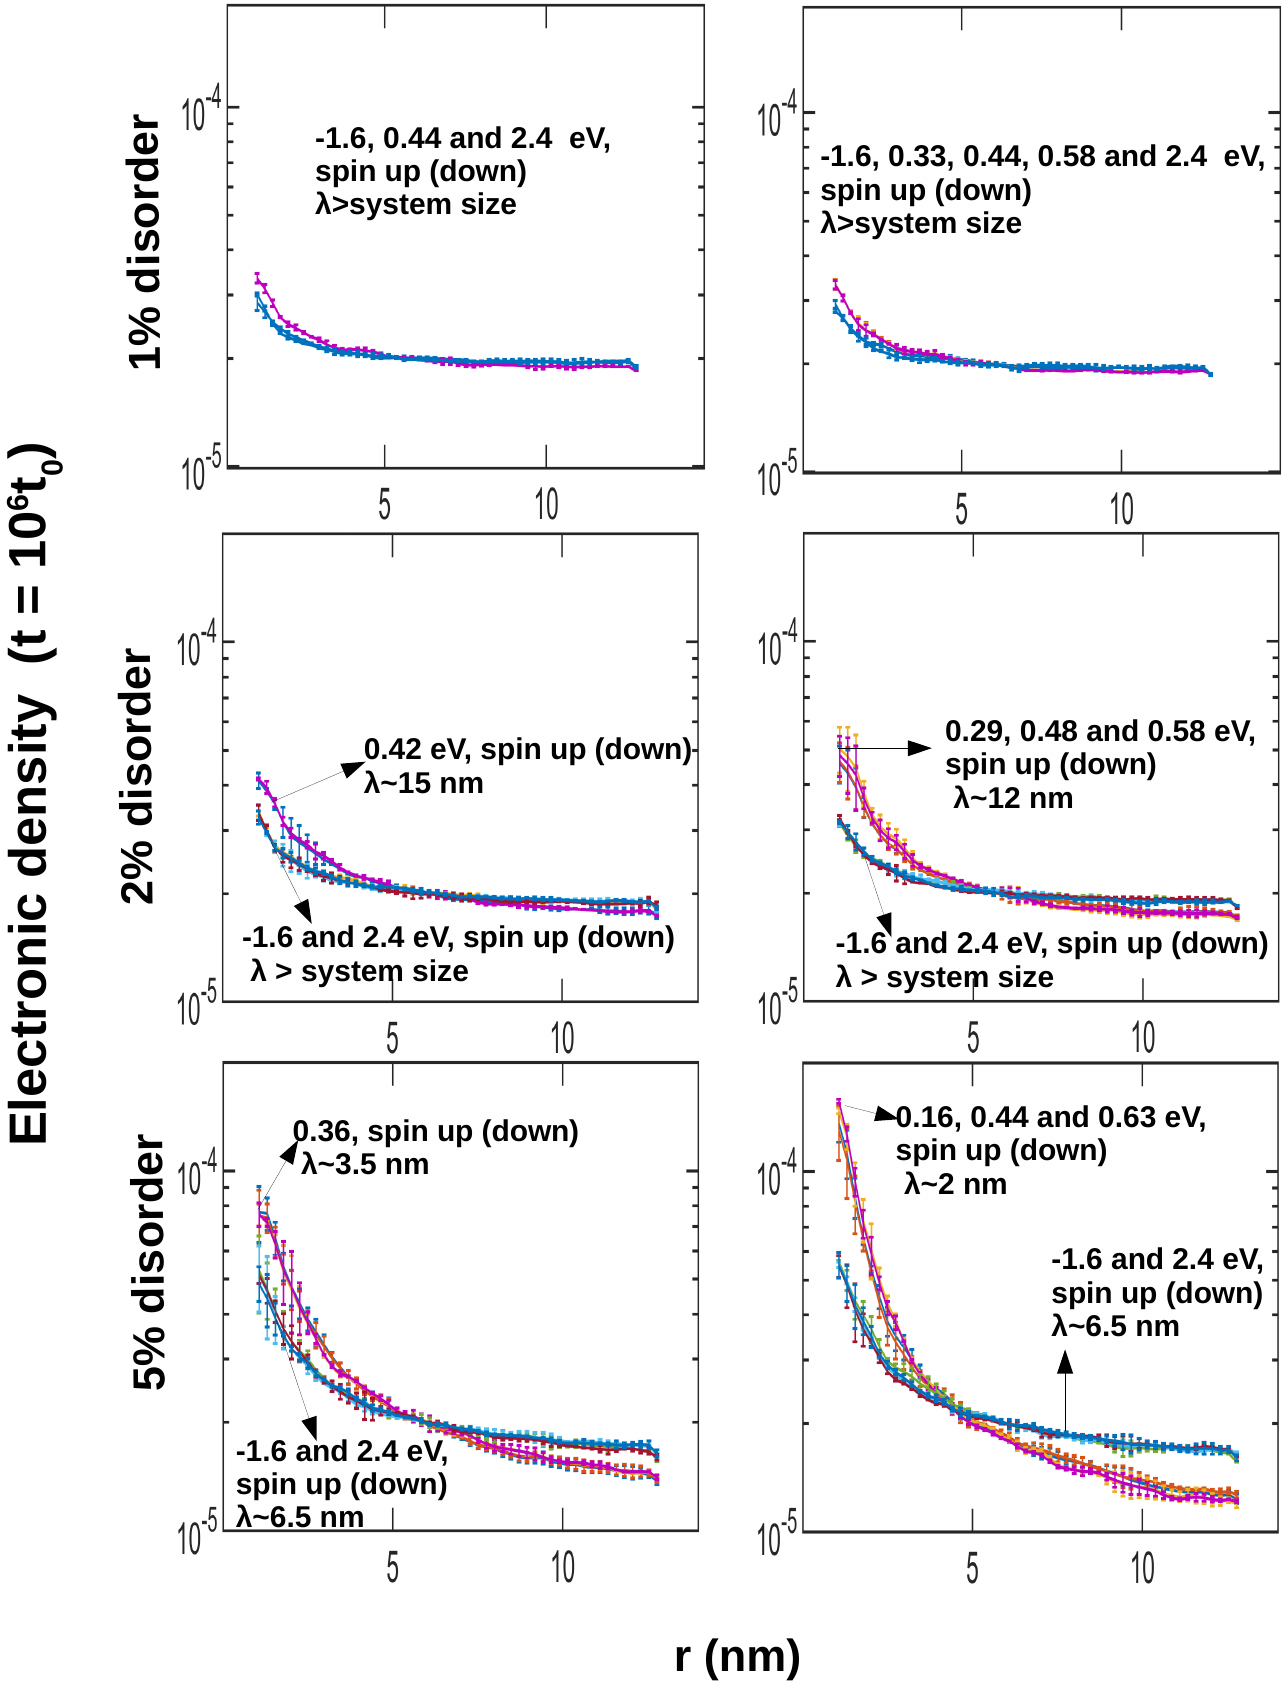
After having established the extend of disorder induced localization in within tight-binding model in subsection (i) and the extend of disorder induced magnetization within mean-field Hubbard model, we now focus on the relationship between localization and magnetization. In Fig.7, we plot the angle integrated quasistationary electronic densities, similar to Fig.4, but obtained using spin-resolved MFH quasiparticle states. As before, the densities are averaged over 20 configurations and the plots include corresponding error bars. Upper, middle and lower panels correspond to 1%, 2% and 5% defect concentrations, respectively, while left and right panels correspond to evenly (50-50%) and unevenly (100-0%) distributed defects among the two sublattices. Although both spin up and down densities are plotted in each subfigure, to our surprise no noticeable difference was found between them, within the statistical error based on 20 randomly distributed configurations. For evenly distributed defects, the estimated localization lengths from MFH calculations are similar to those obtained from TB calculations of Fig.4. Moreover, if the defects are distributed unevenly among the sublattices, localization lengths in the vicinity of Fermi level decreases considerably from nm to nm for 2% concentration and from nm to nm for 5% concentration of defects, consistent with the inset of Fig.4. This is due to the fact that an even distribution of defects causes more impurity-level hybridization around the Fermi level compared to uneven distribution that gives rise to sharper and stronger peak in DOS as seen in Fig.7. Away from Fermi level, no significant sublattice effect is observed, as expected.
A useful quantity that describes the magnetic properties is staggered magnetization defined as :
| (2) |
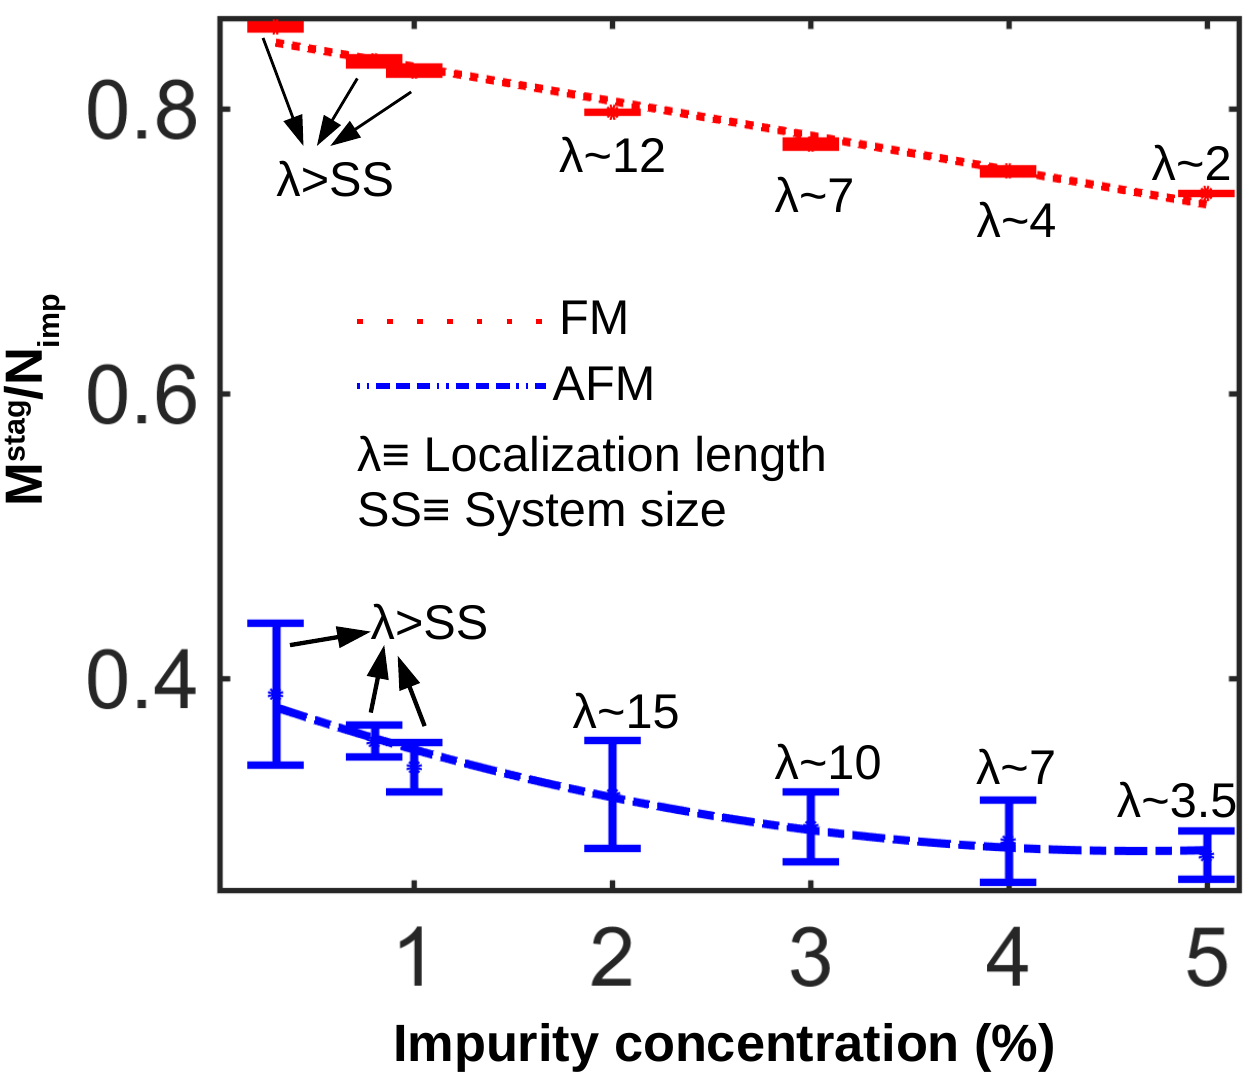
where x is even for A and odd for B sublattice sites. In Fig. 8, we plot the staggered magnetization per impurity, as a function of defects concentration of 0.3 - 5 % for the AFM and FM configurations, averaged over 20 disordered samples. For each case, the localization length is also shown. Several interesting observations can be made from Fig.8. First, magnetization of AFM configurations (same-sublattice defect distribution) is considerably lower than the FM configurations (even distribution). This reflects the suppression of antiferromagnetic coupling whenever two impurities are close to each other AdatomDFTMFH3 , as discussed above (see Fig.6). Also, the AFM error bars are much larger than the FM error bars, showing that the AFM magnetization is more sensitive to the specific distribution of the defect sites. Indeed, for some of the samples, large regions dominated by same-sublattice type defects may be present, causing weaker AFM suppression. However the net AFM magnetization is never completely suppressed. Another important observation is that the localization is consistently stronger for the FM configuration than for the AFM configurations. This results is consistent with the conductivity calculations based on tight-binding results of Ref.cresti2013broken, , where compensated distribution of defects in a graphene sheet leads to more localization than the same sublattice distribution. Finally, we see that as the defect concentration increases, the localization length decreases as expected, and the staggered magnetization per impurity slightly decreases. Net staggered magnetization of course increases with increasing number of defects.
IV Conclusions
To conclude, we studied random disorder induced localization and magnetic properties in medium sized hexagonal armchair graphene quantum dots, using tight-binding and mean-field Hubbard approaches. We observed magnetic puddle-like formations induced by random distribution of defects with concentrations between 1% and 5%. For QD sizes above 12 nm, defect concentrations of 2% is needed in order to observe localization effects. Although the localization lengths are not directly affected by interactions, we show that, if the disorder sites are distributed on a same sublattice of the honeycomb lattice, significantly enhanced magnetism and localization occurs compared to the evenly distributed antiferromagnetic case. Surprisingly, no spin dependence of localization length was observed in neither AFM or FM cases.
V ACKNOWLEDGMENT
This research was supported by the Scientific and Technological Research Council of Turkey TUBITAK under the 1001 grant project number 116F152, Turkey. The author thanks F. M. Peeters and K. E. Çakmak for valuable discussions.
References
- (1) K.S. Novoselov, A.K. Geim, S.V. Morozov, D. Jiang, Y. Zhang, S.V. Dubonos, I.V. Grigorieva and A.A. Firsov, Science 306, 666 (2004).
- (2) K.S. Novoselov, A.K. Geim, S.V. Morozov, D. Jiang, M.I. Katsnelson, I.V. Grigorieva, S.V. Dubonos and A. A. Firsov, Nature 438, 197 (2005).
- (3) Y. Zhang, Y. W. Tan, H. L. Stormer and P. Kim, Nature 438, 201 (2005).
- (4) A. Rycerz, J. Tworzydło and C.W.J. Beenakker, Nature 3, 172 (2007).
- (5) M. L. Sadowski, G. Martinez, M. Potemski, C. Berger, W. A. de Heer, Phys. Rev. Lett. 97, 266405 (2006).
- (6) A. D. Güçlü, P. Potasz, M. Korkusinski, and P. Hawrylak, Graphene Quantum Dots, Springer, Berlin, Heidelberg (2014).
- (7) B. Trauzettel, D. V. Bulaev, D. Loss, and G. Burkard, Nature 3, 192 (2007).
- (8) S. Schnez, K. Ensslin, M. Sigrist, and T. Ihn, Phys. Rev. B 78, 195427 (2008).
- (9) M. Wimmer, A. R. Akhmerov, and F. Guinea, Phys. Rev. B 82, 045409 (2010).
- (10) T. Ihn, J. Güttinger, F. Molitor, S. Schnez, E. Schurtenberger, A. Jacobsen, S. Hellmüller, T. Frey, S. Dröscher, C. Stampfer, K. Ensslin, Materials Today 44, 20-27 (2010).
- (11) M. L. Mueller, X. Yan, J. A. McGuire, and L. Li, Nano Lett. 10, 2679 (2010).
- (12) S. K. Hämäläinen, Z. Sun, M. P. Boneschanscher, A. Uppstu, M. Ijäs, A. Harju, D. Vanmaekelbergh, and P. Liljeroth, Phys. Rev. Lett. 107, 236803 (2011).
- (13) D. Subramaniam, F. Libisch, Y. Li, C. Pauly, V. Geringer, R. Reiter, T. Mashoff, M. Liebmann, J. Burgdörfer, C. Busse, T. Michely, R. Mazzarello, M. Pratzer, and M. Morgenstern, Phys. Rev. Lett. 108, 046801 (2012).
- (14) M. Olle, G. Ceballos, D. Serrate, and P. Gambardella, Nano Lett. 12, 4431 (2012).
- (15) I. Ozfidan, M. Korkusinski,A. D. Güçlü, J. A. McGuire and P. Hawrylak, Phys.Rev.B 89, 085310 (2014).
- (16) M. Ezawa, Phys. Rev. B 76, 245415 (2007).
- (17) J. Fernandez-Rossier and J. J. Palacios, Phys. Rev. Lett. 99, 177204 (2007).
- (18) W. L. Wang, S. Meng, and E. Kaxiras, Nano Lett. 8, 241 (2008).
- (19) J. Akola, H. P. Heiskanen, and M. Manninen, Phys. Rev. B 77, 193410 (2008).
- (20) A. D. Güçlü, P. Potasz, O. Voznyy, M. Korkusinski, and P. Hawrylak, Phys. Rev. Lett. 103, 246805 (2009).
- (21) P. Potasz, A. D. Güçlü, and P. Hawrylak, Phys. Rev. B 81, 033403 (2010).
- (22) M. Zarenia, A. Chaves, G. A. Farias, and F. M. Peeters, Phys. Rev. B 84, 245403 (2011).
- (23) W. L. Ma and S. S. Li, Phys. Rev. B 86, 045449 (2012)
- (24) A. D. Güçlü, P. Potasz, and P. Hawrylak, Phys. Rev. B 88, 155429 (2013).
- (25) K. Szalowski, Physica E 52, 46 (2013).
- (26) A. Altıntaş, K. E. Çakmak, A.D. Güçlü Phys. Rev. B 95, 045431 (2017).
- (27) M. Modarresi, A.D. Güçlü, Phys. Rev. B 95, 235103 (2017).
- (28) H. U. Ozdemir, A. Altıntaş, A.D. Güçlü Phys. Rev. B 93, 014415 (2016).
- (29) A.D. Güçlü Phys. Rev. B 93, 045114 (2016).
- (30) H. Sevincli, M. Topsakal, E. Durgun, S. Ciraci, Phys. Rev. B, 77, 195434 (2008).
- (31) A.D. Güçlü, N. Bulut, Phys. Rev. B 91, 125403 (2015).
- (32) X. Li, X. Wang, L. Zhang, S. Lee and H. Dai, Science 319, 1229 (2008).
- (33) J. Cai, P. Ruffieux, R. Jaafar, M. Bieri, T. Braun, S. Blankenburg, M. Muoth, A.P. Seitsonen, M. Saleh, X. Feng, K. Müllen and R. Fasel, Nature 466, 470(2010).
- (34) M. Treier, C.A. Pignedoli, T. Laino, R. Rieger, K. Müllen, D. Passerone and R. Fasel, Nature Chemistry 3, 61 (2011).
- (35) M.L. Mueller, X. Yan, J.A. McGuire and L.S. Li, Nano Letters 10, 2679 (2010).
- (36) Y. Morita, S. Suzuki, K. Sato and T. Takui, Nature Chemistry 3, 197 (2011).
- (37) T. Wassmann, A. P. Seitsonen, A. M. Saitta, M. Lazzeri and F. Mauri, Physical Review Letters 101, 096402 (2008).
- (38) Y. Sun, Y. Zheng, H. Pan, J. Chen, W. Zhang, L. Fu, K. Zhang, N. Tang and Y. Du, npj Quantum Materials 2, 5 (2017).
- (39) R. Balog, B. Jørgensen, J. Wells, E. Lægsgaard, P. Hofmann, F. Besenbacher and L. Hornekær, Journal of the American Chemical Society 131, 8744-8745 (2009).
- (40) Ž. Šljivančanin, E. Rauls, L. Hornekær, W. Xu, F. Besenbacher and B. Hammer, The Journal of chemical physics 131, 084706 (2009).
- (41) D. C. Elias, R. R. Nair, T. M. Mohiuddin, S. V. Morozov, P. Blake, M. P. Halsall, A. C. Ferrari, D. W. Boukhvalov, M. I. Katsnelson, A. K. Geim and K. S. Novoselov, Science 323, 610-613 (2009).
- (42) J. Balakrishnan, G. K. W. Koon, M. Jaiswal, A. H. Castro Neto and B. Özyilmaz, Nature Physics 9, 284 (2013).
- (43) H. González-Herrero, J. M. Gómez-Rodríguez, P. Mallet, M. Moaied, J. J. Palacios, C. Salgado, M. M. Ugeda, J. Y. Veuillen, F. Yndurain and I. Brihuega, Science 352, 6284 (2016).
- (44) K. M. McCreary, A. G. Swartz, W. Han, J. Fabian and R. K. Kawakami, Physical Review Letters 109, 186604 (2012).
- (45) J. Mao, Y. Jiang, D. Moldovan, G. Li, K. Watanabe, T. Taniguchi, M. R. Masir, F. M. Peeters and E. Y. Andrei, Nature Physics 129, 545 (2016).
- (46) M. M. Ugeda, I. Brihuega, F. Guinea and J. M. Gómez-Rodríguez, Physical Review Letters 104, 096804 (2010).
- (47) R. R. Nair, M. Sepioni, I. L. Tsai, O. Lehtinen, J. Keinonen, A. J. Krasheninnikov, T. Thomson, A. K. Geim and I. V. Grigorieva, Nature Physics 8, 199-202 (2012).
- (48) Y. Zhang, S. Y. Li, H. Huang, W. T. Li, J. B. Qiao, W. X. Wang, L. J. Yin, K. K. Bai, W. Duan, and L. He, Physical Review Letters 117, 166801 (2016).
- (49) R. R. Nair, I. L. Tsai, M. Sepioni, O. Lehtinen, J. Keinonen, J. Krasheninnikov, A. H. Castro Neto, M. I. Katsnelson, A. K. Geim and I. V. Grigorieva, Nature Communications 4, 2010 (2013).
- (50) A. Bostwick, J. L. McChesney, K. V. Emtsev, T. Seyller, K. Horn, S. D. Kevan and E. Rotenberg, Physical Review Letters 103, 056404 (2009).
- (51) O. V. Yazyev and L. Helm, Physical Review B 75, 125408 (2007).
- (52) N. M. R. Peres, F. Guinea, and A. H. Castro Neto, Physical Review B 73, 125411 (2006).
- (53) J. J. Palacios, J. Fernández-Rossier, L. Brey, Physical Review B 77, 195428 (2008).
- (54) B. Uchoa, V. N. Kotov, N. M. R. Peres and A.H. Castro Neto, Physical Review Letters 101, 026805 (2008).
- (55) D. W. Boukhvalov, M. I. Katsnelson, A. I. Lichtenstein, Physical Review B 77, 035427 (2008).
- (56) D. Soriano, F. Munoz-Rojas, J. Fernández-Rossier and J. J. Palacios, Physical Review B 81, 165409 (2010).
- (57) E. K. Safari, A. A. Shokri, M. BabaeiPour, Journal of Magnetism and Magnetic Materials 441, 230-237 (2017).
- (58) Q. Liang, Y. Song, A. Yang and J. Dong, Journal of Physics: Condensed Matter 23, 345502 (2011).
- (59) D. Soriano, N. Leconte, P. Ordejón, J. C. Charlier, J. J. Palacios and S. Roche, Physical Review Letters 107, 016602 (2011).
- (60) N. Leconte, D. Soriano, S. Roche, P. Ordejón, J. C. Charlier and J. J. Palacios, ACS nano 5, 3987-3992 (2011).
- (61) G. Schubert and H. Fehske, Physical Review Letters 108, 066402 (2012).
- (62) E. H. Lieb, Physical Review Letters 62, 1201 (1989).
- (63) P. W. Anderson, Physical Review 109, 1492 (1958).
- (64) S. Reich, J. Maultzsch, C. Thomsen and P. Ordejon, Physical Review B 66, 035412 (2002).
- (65) T. Ando, Journal of the Physical Society of Japan 75, 074716 (2006).
- (66) P. Potasz, A.D. Güçlü and P. Hawrylak, Phys. Rev. B 82, 075425 (2010).
- (67) A. Cresti, F. Ortmann, T. Louvet, D. Van Tuan and S. Roche, Physical Review Letters 110, 196601 (2013).