Distances of Stars by mean of the Phase-lag Method
Abstract
Variable OH/IR stars are Asymptotic Giant Branch (AGB) stars with an optically thick circumstellar envelope that emit strong OH 1612 MHz emission. They are commonly observed throughout the Galaxy but also in the LMC and SMC. Hence, the precise inference of the distances of these stars will ultimately result in better constraints on their mass range in different metallicity environments. Through a multi-year long-term monitoring program at the Nancay Radio telescope (NRT) and a complementary high-sensitivity mapping campaign at the eMERLIN and JVLA to measure precisely the angular diameter of the envelopes, we have been re-exploring distance determination through the phase-lag method for a sample of stars, in order to refine the poorly-constrained distances of some and infer the currently unknown distances of others. We present here an update of this project.
keywords:
masers, stars: late-type, stars: variables: OH/IR, stars: distances1 Introduction
Evolved stars at the tip of the AGB for low- and intermediary-mass
stars experience heavy mass loss surrounding the star with a circumstellar
envelope (CSE), which ultimately become opaque to visible light.
These enshrouded OH/IR stars
commonly exhibit strong periodic (ranging typically from 1 to 6 yr)
ground-state OH maser emission in the 1612-MHz transition.
Over 2000 OH masers of stellar origin are currently known in the Milky Way
([Engels & Bunzel, 2015), Engels & Bunzel, 2015]) and it is anticipated that the SKA
will detect thousands of OH maser sources of stellar origin in the anti-solar
Galactic hemisphere and Local Group of galaxies
([Etoka et al. (2015), Etoka et al. 2015]).
This makes OH/IR stars potentially valuable objects for a wide range of studies
in our Galaxy but also for stellar-evolution metallicity-related studies.
Because OH/IR stars are optically thick, their distances cannot be inferred using optical parallaxes. The period-luminosity relation found towards Miras ([Whitelock, Feast & Catchpole (1991), Whitelock, Feast & Catchpole 1991]) breaks down for P 450 days. Kinematic distances can be very imprecise due to peculiar motions ([Reid et al. (2009), Reid et al. 2009]). As it has been extensively demonstrated in this symposium, maser emission at high(er) frequency from e.g. water and methanol species is successfully used to infer distances via parallax measurements towards distant Galactic star forming regions. The use of ground-state OH maser to infer distances of AGB stars via parallax measurements has also been successfully done but only for objects relatively nearby (i.e., 2 kpc; [Vlemmings & van Langevelde (2007), Vlemmings & van Langevelde 2007]; [Orosz et al. (2017), Orosz et al. 2017]). Another alternative to distance determination for more distant evolved stars is the use of the “phase-lag” method.
2 Method and Observations
The determination of the distance of an OH/IR star via the phase-lag method
relies on the measurement of the linear and angular diameter of its
OH-maser CSE which are both obtained independently.
OH/IR stars typically exhibit a double-peaked spectral profile where the
blueshifted peak (“blue” peak here after) emanates from the front cap of the
CSE and the redshifted peak (“red” peak here after) emanates from the back
cap of the CSE while the faint interpeak emission emanates from the outer
part of the CSE.
We measure the phase lag () of a source with no external fitting
function, using simply the shape of the light curve, by scaling and shifting
the integrated-flux light curves of the blue peak with respect to the
red one , minimizing the function
(where and are constants for the amplitude and mean flux) leading to
the measurement of the linear diameter of the OH shell of the star.
The angular diameter is obtained from interferometric mapping.
[Schultz, Sherwood & Winnberg (1978), Schultz, Sherwood & Winnberg (1978)] performed the
first phase-lag measurements, and in the 1980’s,
[Herman & Habing (1985), Herman & Habing (1985)] and
[van Langevelde, van der Heiden & van Schooneveld (1990), van Langevelde, van der Heiden & van Schooneveld (1990)]
explored this method to retrieve distances from OH/IR stars, but there are
discrepancies in the phase-lag measurement of a good fraction of the sources
in common in these 2 works.
In an attempt to constrain the distance uncertainties achievable with this
method we are re-exploring it.
Our sample consists of 20 OH/IR stars that we have been monitoring
with the Nançay Radio Telescope (NRT) in order to measure
their phase-lags. About half of the sample is composed of sources for
which phase-lags were determined
in the 1980’s,
the ones for which both works are in agreement serving as benchmark objects
while for the objects with clear discrepancy the aim being re-determination
of their phase-lag. The rest of the sample consists of objects with no
recorded phase-lag measurements.
About half of the sources of the sample have been previously imaged but the
interferometric observations were taken at a random time and/or with poor
sensitivity.
We are currently in a process of imaging all the sources in the sample
with either eMERLIN or JVLA around the OH maxima of each source, as
predicted from the NRT light curves, in order to improve the angular diameter
determination by detecting the faint interpeak signal and better constrain the
shell (a)symmetries.
Past reports of the method and status of the project were presented in [Engels et al. (2015), Engels et al. (2012, 2015)] while a detailed description of the applicability of the method in measuring distances for objects beyond the solar vicinity can be found in [Etoka et al. (2014), Etoka et al. (2014)]. In the next section an update and discussion based on the results obtained so far is presented.
3 Discussion
| min. | max. | ||
| Pa | [yrs]: | 1.16 | 6.05 |
| a | [days]: | 110 | |
| 2 ROHa | [ AU]: | 19 | |
| [”]: | 0.8b | 8.0b | |
| D | [kpc]: | 0.5b | 10.6b |
| Object | P | 2 ROH | D | |||||||
|---|---|---|---|---|---|---|---|---|---|---|
| [yrs] | [days] | [ AU] | [”] | [kpc] | ||||||
| OH 83.4-0.9 | 4.11 | 30 | 5.2 | 1.8 | 3.0 | |||||
| OH 16.1-0.3 | 6.03 | 110 | 19.0 | 3.5 | 5.5 |
a: All the periods, phase lags and corresponding linear diameters are
inferred from our NRT monitoring. The status of which can be followed
here: http://www.hs.uni-hamburg.de/nrt-monitoring
b: from the literature
Table 2 presents the summary of the results
obtained so far. The first half of the table gives the range of periods,
phase-lags and linear diameters inferred from the NRT monitoring from all
the sources of the sample. The second half of the table gives the range of
angular diameters and inferred phase-lag distances.
The phase-lags measured account for linear shell diameter of 1700 to
19000 AU. Generally, the diameter is larger for longer-period objects.
Distances ranges from 0.5 to 10.6 kpc. But, it has to be noted, that at
the time of writing, although 70% of the sources of the sample have a
measured angular diameters, 60% are from the literature including these
2 extremas.
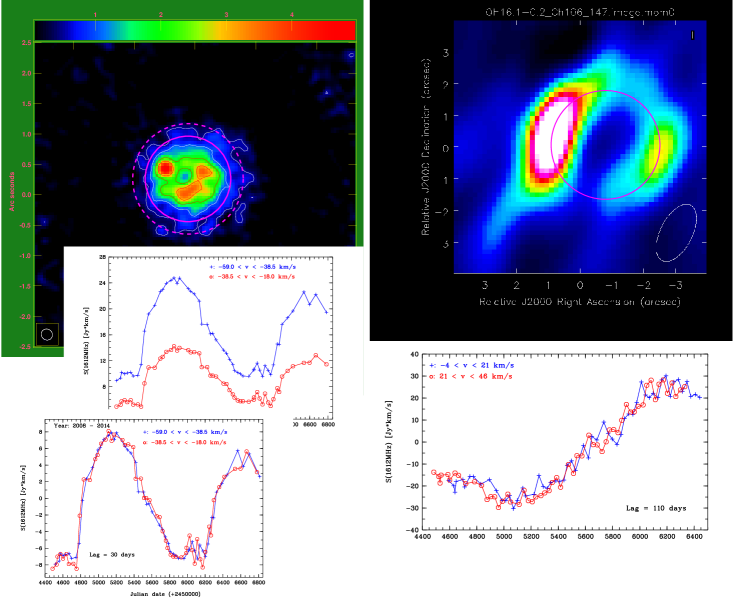
Figure 1 presents the NRT monitoring and interferometric mapping for OH 83.4-0.9 and OH 16.1-0.3, two objects of the sample for which there was no previous imaging. We mapped both objects around their OH maximum with eMERLIN and the JVLA respectively, which allowed us to retrieve a substantial amount of the faint interpeak emission. For both objects, the channel maps obtained are in agreement with the shells being spherically-thin in uniform radial expansion. As an illustration of the phase-lag determination method explained in Section 2, the left middle- and bottom-panels show the “raw” blue-peak and red-peak light curves of OH 83.4-0.9 and the scaled and shifted light curves leading to the phase-lag measurement. The period, phase lags and corresponding linear & angular diameters measured and subsequent inferred distances for these 2 objects are summarized in Table 2. For these 2 objects, we estimated the uncertainty of the linear diameter to be within 10%, while that of the angular diameter to be within 15%, leading to a distance determination uncertainty of less than 20%. On the other hand, the distance determinations given in Table 2 are still questionable as strongly dependent on the degree of exploration for the shell extent determination, i.e., faint tangential emission, which not only allow to better constrain the actual extent of the shell, but also its actual geometry, as in particular, a strong deviation from a spherically thin shell in uniform radial expansion can lead to distance uncertainty greater than 20% (Etoka & Diamond, 2010).
4 Closing Notes
The main contribution to the early phase-lag inconsistencies could be due to: incomplete coverage of lightcurves; inhomogeneous sampling; use of analytical functions to fit the lightcurves. Phase-lag distances can be determined with an uncertainty of less than %, provided that a good constraint on both the linear and angular diameter determinations can be achieved. The main factors for doing so are the following:
-
•
the shape of the light curves must be well defined. This can be obtained with high cadence monitoring observations (i.e., typically with 0.03 P);
-
•
the light curves cover more than one period;
-
•
the faint tangential emission tracing the actual full extent of the shell can be imaged via high-sensitivity interferometric observations better retrieved around the maximum of the OH cycle;
-
•
significant shell asymmetries can be excluded or modelled.
References
- [Engels & Bunzel, 2015)] Engels, D. & Bunzel, F. 2015 A&A, 582A, 68
- [Engels et al. (2015)] Engels, D., Etoka, S., Gérard, E., & Richards, A.M.S. 2015, ASPC, 497, 473
- [Engels et al. (2011)] Engels, D., Gérard, E., Hallet, N., 2012, IAUS 287, 254
- [Etoka et al. (2015)] Etoka, S., Engels, D., Imai, H. et al. 2015, Proc. Science, (AASKA14), 125
- [Etoka et al. (2014)] Etoka, S., Engels, D., Gérard, E., & Richards A.M.S. 2014, evn conf, 59
- [Etoka & Diamond (2010)] Etoka, S., & Diamond, P.D. 2010, MNRAS, 406, 2218
- [Herman & Habing (1985)] Herman, J. & Habing, H.J. 1985, A&AS, 59, 523
- [Orosz et al. (2017)] Orosz, G., Imai, H., Dodson, R. et al. 2017, AJ, 153, 119
- [Reid et al. (2009)] Reid, M.J., Menten, K.M., Zheng, X.W. et al. 2009, ApJ, 700, 137
- [Schultz, Sherwood & Winnberg (1978)] Schultz, G.V., Sherwood, W.A. & Winnberg, A. 1978, A&A, 63L, 5
- [van Langevelde, van der Heiden & van Schooneveld (1990)] van Langevelde, H.J., van der Heiden, R., van Schooneveld, C. 1990, A&A, 239, 193
- [Vlemmings & van Langevelde (2007)] Vlemmings, W.H.T., & van Langevelde, H.J. 2007, A&A, 472, 547
- [Whitelock, Feast & Catchpole (1991)] Whitelock, P., Feast, M. & Catchpole, R. 1991, MNRAS, 248, 276