Widespread SiO and CH3OH Emission in Filamentary Infrared-Dark Clouds††thanks: Based on observations carried out with the IRAM 30m Telescope under projects 134-12 and 027-13. IRAM is supported by INSU/CNRS (France), MPG (Germany) and IGN (Spain).
Abstract
Infrared-Dark Clouds (IRDCs) are cold, dense regions of high (optical and infrared) extinction, believed to be the birthplace of high-mass stars and stellar clusters. The physical mechanisms leading to the formation of these IRDCs are not completely understood and it is thus important to study their molecular gas kinematics and chemical content to search for any signature of the IRDCs formation process. Using the 30m-diameter antenna at the Instituto de Radioastronomía Milimétrica, we have obtained emission maps of dense gas tracers ( and ) and typical shock tracers (SiO and ) toward three IRDCs, G028.37+00.07, G034.43+00.24 and G034.77-00.55 (clouds C, F and G, respectively). We have studied the molecular gas kinematics in these clouds and, consistent with previous works toward other IRDCs, the clouds show complex gas kinematics with several velocity-coherent sub-structures separated in velocity space by a few km s-1. Correlated with these complex kinematic structures, widespread (parsec-scale) emission of SiO and is present in all the three clouds. For clouds C and F, known to be actively forming stars, widespread SiO and is likely associated with on-going star formation activity. However, for cloud G, which lacks either 8 m or 24 m sources and 4.5 m H2 shock-excited emission, the detected widespread SiO and emission may have originated in a large-scale shock interaction, although a scenario involving a population of low-mass stars driving molecular outflows cannot be fully ruled out.
keywords:
stars: formation; ISM: individual objects: G028.37+00.07, G034.43+00.24, G034.77-00.55; ISM: molecules.1 Introduction
The process that leads to the formation of high-mass stars (stars with masses 8 M⊙) is still under debate. The difficulty in tracing their evolutionary path lies in their short evolutionary time-scales, their crowded cluster environments, and the large distances at which they are typically found. In addition, their strong feedback (stellar winds, supernovae explosions and UV radiation) largely affects their birth place, making the study of their formation processes even more challenging.
One way to circumvent the problem of feedback is to study the earliest stages of high-mass star formation represented by infrared-dark clouds (or IRDCs; Simon et al. 2006, Rathborne et al. 2006, Peretto & Fuller 2010, Butler & Tan 2012). IRDCs are cold (T 25 K; Pillai et al. 2006), dense (n(H2) 105 cm-3) and highly-extinguished (Av 100 mag and N(H2) 1022 cm-2; Butler & Tan 2009, 2012) molecular clouds, first observed in extinction against the bright mid-IR Galactic background (Perault et al. 1996, Egan et al. 1998). The morphology ranges globular to very filamentary, with the latter morphology likely denoting the earliest stages in their evolution as predicted by simulations of molecular cloud formation (Van Loo et al. 2007, Hennebelle et al. 2008, Heitsch et al. 2009). Several scenarios have been proposed to explain the formation of IRDCs, including flow-driven formation, gravitational collapse and cloud-cloud collisions (e.g. Hennebelle et al. 2008, Heitsch et al. 2009, Tasker & Tan 2009, Van Loo et al. 2014, Wu et al. 2015). Among them, the cloud-cloud collision scenario proposes that IRDCs can form after the collision of already-molecular clouds, and since the collision is expected to be relatively gentle (with velocities from a few to 10 km s-1 as opposed for instance to the flow-driven scenario, e.g. Wu et al. 2016, 2017a, 2017b) signatures of the cloud-cloud collision (which involves a large-scale shock interaction) should be observable in the kinematics and excitation of the molecular line spectra observed toward young IRDCs (e.g Wu et al. 2015).
One of the best tracers of shock interactions in star-forming regions is silicon monoxide (or SiO). This molecule is known to be heavily depleted in the quiescent gas of molecular dark clouds (with measured upper limits to the SiO abundance of 10-12; Martin-Pintado et al. 1992, Jiménez-Serra et al. 2005), but its abundance is enhanced by up to six orders of magnitude in shocked regions associated with molecular outflows (measured SiO abundances as high as 10-6; Martin-Pintado et al. 1992, Jiménez-Serra et al. 2005). SiO is thought to be produced in shocks after the release of Si into the gas phase mainly by the sputtering of dust grains (either from the icy mantles or from the grain cores; see Schilke et al. 1997, Jiménez-Serra et al. 2008). Depending on the velocity of the shock, the SiO emission will show different line profiles: while the SiO gas in high-velocity shocks presents broad line emission red- and blue-shifted by tens of km s-1, the SiO emission in low-velocity shocks should be significantly narrower (with linewidths 1-2 km s-1; Jiménez-Serra et al. 2009).
One of the first attempts to detect the signature of a cloud-cloud collision in an IRDC was reported by Jiménez-Serra et al. (2010). In this work, These authors presented the detection of widespread emission of SiO toward the filamentary IRDC G035.39-00.33 (or cloud H in Butler & Tan 2009). The detailed analysis of the SiO line profiles across this cloud revealed two different contributions: i) a bright and compact component with broad line emission clearly associated with on-going star formation activity; and ii) a weak, narrow (linewidths 2 km s-1) and extended component detected even toward the most quiescent regions in the IRDC. Among other possibilities, Jiménez-Serra et al. (2010) proposed that the widespread and narrow component of SiO could have been generated by a large-scale cloud-cloud collision related to the origin of the IRDC itself. This cloud indeed shows a complex kinematic structure with several velocity-coherent filaments separated in velocity space by 3 km s-1, which seem to be interacting (see Henshaw et al. 2013, 2014, Jiménez-Serra et al. 2014). Therefore, the proposed gentle shock interaction between the velocity-coherent filaments in G035.39-00.33 may have injected enough Si into the gas phase, yielding narrow SiO line profiles as a distinct chemical signature.
Since this first study, other works have analyzed the morphology and kinematics of the line emission of SiO in massive molecular clouds, but mainly targeting regions with on-going star formation (see e.g. the W43 and Cygnus X star-forming regions; Nguyen-Luong et al. 2013, Duarte-Cabral et al. 2014). More recently, Csengeri et al. (2016) performed a spectral line survey of massive clumps located in the Galactic plane, covering different evolutionary stages from IRDCs to Ultra Compact (UC) HII regions. These authors found that the SiO emission is detected in almost all sources, although the shape of the SiO line profiles clearly varies as a function of evolutionary stage. Indeed, while the most active clumps show line profiles with two clear components (a 20 km s-1 wide broad component and a 5-6 km s-1 wide narrow component), in the most quiescent sources (mostly associated with IRDCs) only the narrow component is detected. These findings indicate that narrow SiO emission may be a common feature in IRDCs and that it may arise from low-velocity shocks. Unfortunately, Csengeri et al. (2016) carried out single-pointing observations and therefore, the overall morphology of this narrow SiO emission in other IRDCs remains unknown.
The aim of this work is to extend the study carried out by Jiménez-Serra et al. (2010) in G035.39-00.33 to other IRDCs known to be at a relatively early stage in their evolution (as measured by their low levels of star formation activity). To this purpose, we have carried out large-scale maps of the emission of SiO and methanol (CH3OH), and of dense gas tracers ( and ), toward three IRDCs, , and (clouds C, F and G respectively, following Butler & Tan 2012). Like SiO, CH3OH is also known to be enhanced in outflows by several orders of magnitude (e.g. L1157-mm and L1448-mm; Bachiller et al. 2001, Jiménez-Serra et al. 2005), and therefore it is a good probe of the interaction of low-velocity shocks. The three clouds of our study belong to the sample of ten clouds selected by Butler & Tan (2009) from the Rathborne et al. (2006) catalog. They were selected because they are nearby, massive and show high contrast compared to the surrounding diffuse emission.
The paper is organized as follows. In Sec. 2 we provide details about the observations while in Sec. 3 we describe the tools and procedures adopted for our data analysis. In Sec. 4, we present our results on the detection of widespread SiO and CH3OH emission toward , and and analyze their kinematics in detail. In Sec. 5, we calculate the abundances of SiO and CH3OH across the clouds, and in Sec. 7 and Sec. 8 we discuss our results and present our conclusions.
2 Observations
The rotational transitions of and , the line of SiO and the transitions of , were mapped toward the IRDCs G028.37+00.07, G034.43+00.24 and G034.77-00.55 in May and September 2013 using the IRAM (Instituto de Radioastronomía Milimétrica) 30m telescope in Pico Velata, Spain. For simplicity, hereafter we will refer to G028.37+00.07 as cloud C, G034.43+00.24 as cloud F and G034.77-00.55 as cloud G. The map sizes were 264′′252′′ for cloud C, 144′′264′′ for cloud F and 204′′240′′ for cloud G. Maps were obtained using the On-The-Fly (OTF) observing mode with central coordinates at , ′′ for cloud C, , ′′ for cloud F and , ′′for cloud G. The off-positions were, respectively, (-370′′, 30′′), (-200′′, 0′′), and (-240′′, -40′′) for clouds C, F and G and the angular separation in the direction perpendicular to the scanning direction was 6′′. In Table 1, we report the spectroscopic information of the observed transitions from the CDMS catalog111See https://www.astro.uni-koeln.de/cdms/catalog, as well as the beam size and beam efficiency of the IRAM 30m telescope at these frequencies.
For the observations both the VESPA and FTS spectrometers were used. VESPA provided a spectral resolution of 40 kHz, corresponding to a velocity resolution of 0.14 km s-1 for , and SiO, and of 0.08 km s-1 for . The FTS spectrometer provided a spectral resolution of 190 kHz, corresponding to velocity resolutions of 0.40 km s-1 for and 0.70 km s-1 for the other molecules. For our analysis, we used the data collected with the VESPA spectrometer for all the maps except for in clouds F and G, for which the FTS data have been used. The peak intensities were measured in units of antenna temperature, T, and converted into main-beam temperature, Tmb, using a beam and forward efficiencies of of 0.81 and 0.95 for the 3 mm data and 0.73 and 0.93 for the 2 mm spectra, respectively.
The final data cubes were created using the CLASS software within the GILDAS package222See http://www.iram.fr/IRAMFR/GILDAS.. The maps have a spatial resolution of 30′′ and a pixel size of 15′′15′′ for SiO, and , and a spatial resolution of 18′′ and a pixel size of 9′′9′′ for . For all the datacubes, we used a Gaussian convolving kernel with = 6′′ for and = 10′′ for all the other tracers. In most cases, the spectra were smoothed in velocity to improve the signal-to-noise ratio of the measured line emission. The final properties of every data cube are listed in Table 2.
| Molecule | Transition | Frequency | Eup | gup | Aul (10-5) | Beam Eff. | |
|---|---|---|---|---|---|---|---|
| (GHz) | (K) | s-1 | (′′) | ||||
| 86.75429 | 4.2 | 3 | 3.85 | 28 | 0.81 | ||
| 87.09083 | 4.2 | 3 | 2.38 | 28 | 0.81 | ||
| SiO | 86.84699 | 6.3 | 5 | 2.93 | 28 | 0.81 | |
| 31,2-21,1 | 145.13186 | 35.0 | 7 | 1.12 | 17 | 0.73 | |
| 3-2,2-2-2,1 | 145.12639 | 39.8 | 7 | 0.69 | 17 | 0.73 | |
| 30,3-2 | 145.10315 | 13.9 | 7 | 1.23 | 17 | 0.73 | |
| 3-1,3-2-1,2 | 145.09737 | 19.5 | 7 | 1.10 | 17 | 0.73 | |
| 30,3-20,2 | 145.09371 | 27.1 | 7 | 1.23 | 17 | 0.73 |
| Molecule | Beam size | v | |||
| (′′) | (km s-1) | (K) | (kHz) | ||
| Cloud C | (J2000)=18:42:52.3, (J2000)=-4:02:26.2, map size=264′′252′′ | ||||
| () | 30 | 0.28 | 0.010 | 80 | |
| () | 30 | 0.28 | 0.007 | 80 | |
| SiO ( ) | 30 | 0.56 | 0.010 | 160 | |
| (30,3-2 ) | 18 | 0.32 | 0.014 | 160 | |
| (3-1,3-2-1,2 ) | 18 | 0.32 | 0.014 | 160 | |
| (30,3-20,2 ) | 18 | 0.32 | 0.014 | 160 | |
| Cloud F | (J2000)=18:53:18, (J2000)=1:27:22.1, map size=144′′264′′ | ||||
| () | 30 | 0.14 | 0.012 | 40 | |
| () | 30 | 0.14 | 0.011 | 40 | |
| SiO ( ) | 30 | 0.56 | 0.006 | 160 | |
| (31,2-21,1 ) | 18 | 0.80 | 0.005 | 380 | |
| (3-2,2-2-2,1) | 18 | 0.80 | 0.005 | 380 | |
| (30,3-2 ) | 18 | 0.80 | 0.005 | 380 | |
| (3-1,3-2-1,2 ) | 18 | 0.80 | 0.005 | 380 | |
| (30,3-20,2 ) | 18 | 0.80 | 0.006 | 380 | |
| Cloud G | (J2000)=18:56:45, (J2000)=1:21:45.0, map size=204′′240′′ | ||||
| () | 30 | 0.28 | 0.011 | 80 | |
| () | 30 | 0.28 | 0.010 | 80 | |
| SiO ( ) | 30 | 0.28 | 0.011 | 80 | |
| (30,3-2 ) | 18 | 0.40 | 0.008 | 190 | |
| (3-1,3-2-1,2 ) | 18 | 0.40 | 0.008 | 190 | |
| (30,3-20,2 ) | 18 | 0.40 | 0.008 | 190 | |
3 Analysis Method: SCOUSE
As shown by Henshaw et al. (2014, 2016), if the molecular gas in a cloud has multi-component line profiles, a first moment analysis of the molecular emission only provides the average radial velocity between the different components along the line of sight. Therefore, to study in detail the kinematics of the molecular gas in IRDCs, a multi-Gaussian fitting approach needs to be used in order to isolate the gas motions of the individual velocity components. In our case, we performed multi-gaussian fitting of all the spectra measured in every data cube using the IDL SCOUSE333See https://github.com/jdhenshaw/SCOUSE code (Semi-automated multi-COmponent Universal Spectral-line fitting Engine) recently developed by Henshaw et al. (2016).
SCOUSE is a semi-automated procedure developed to fit large amounts of spectra from single-dish and interferometric data cubes in a systematic and efficient way. As a first step, the tool excludes from the analysis the regions where the line peak intensity is lower than a user-provided threshold. Then, it divides the significant remaining region into several smaller areas called Spatial Averaging Areas (SAAs), whose sizes are also defined by the user. All the spectra contained in a SAA are spatially averaged and the user is required to manually fit the average spectrum. Finally, SCOUSE uses the best fitting values of the average spectrum as input parameters to perform multi-gaussian fitting for every single spectrum in a SAA. This procedure is repeated for all the identified SAA. In order to make the final fittings physically consistent, the user is also required to provide tolerance levels for the derived peak line intensity, centroid radial velocity and linewidth (FWHM). The SCOUSE analysis thus provides information on the peak intensity, centroid radial velocity and FWHM for all velocity components in all emission lines, and on the measured RMS noise level in every spectrum. Other statistical parameters, such as the residual value, , (the divided by the number of free parameters) and the Akaike Information Criterion (AIC; Akaike 1974) are also calculated. All this information has been used to evaluate the distribution in radial velocity and line width of the mapped molecular emission in all the clouds of our sample. For a more detailed discussion on SCOUSE see Henshaw et al. (2016).
4 Results
4.1 The Dense Gas Tracers
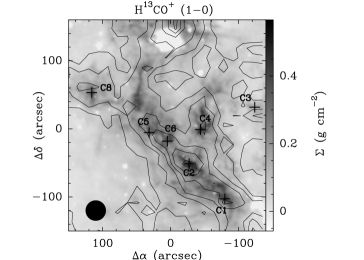
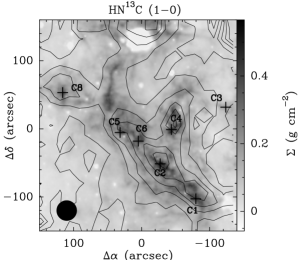
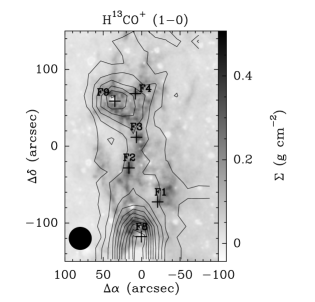
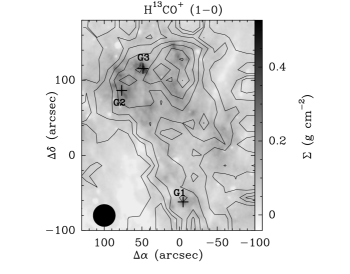
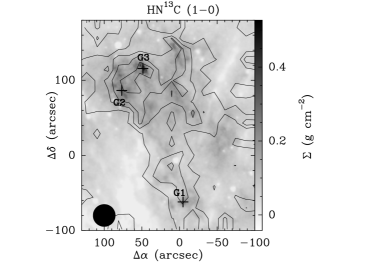
In Figure 1, we report the integrated intensity maps of the (left panels) and (right panels) emission for clouds C (top), F (middle) and G (bottom). The emission levels (black contours) are superimposed on the H2 mass surface density maps (in gray scale) obtained by Kainulainen & Tan (2013). In all the following maps, the names (Butler & Tan 2009, 2012) and positions (black crosses; Butler & Tan 2009 for F8 and F9; Butler & Tan 2012 for all the other cores) are indicated for all cores. In all clouds of our sample, the dense gas tracer emission highlights the filamentary morphology of the clouds, closely following the structure detected in extinction (or defined by the H2 mass surface density map). For clouds C (integrated velocity range 76 - 83 km s-1) and F (velocity range 51 - 64 km s-1), the and emission shows similar spatial distributions, with peaks mainly associated with the cores present in the clouds.
In contrast to clouds C and F, cloud G (integrated velocity range 39 - 45 km s-1) shows a slightly different spatial distribution for (left) and (right). The emission peaks coincide with the location of the two north-eastern cores G2 and G3, while the emission peaks toward the north-west of the cloud at offset (0′′, 130′′). The distance between the and the emission peaks is 54′′ (0.76 pc), larger than the angular resolution of our maps (30′′) and enough to conclude that the emission peak is not associated with the two north-eastern cores of the cloud. To the best of our knowledge, no cores are present at the position of the emission peak.

4.1.1 Sub-Structures identification
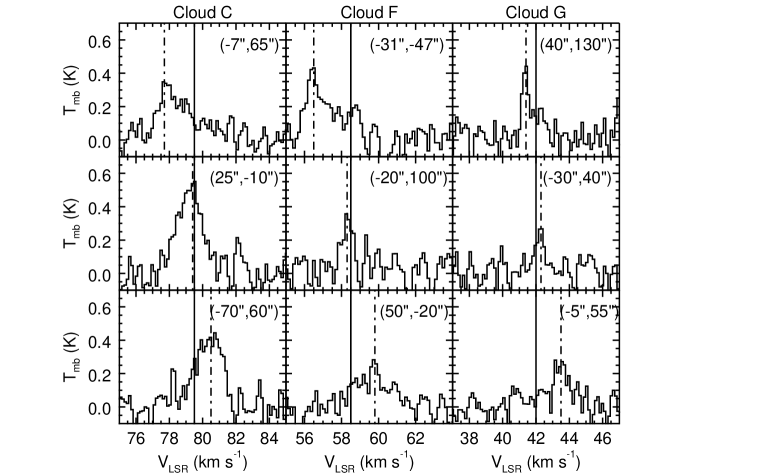
Visual inspection of the and spectra throughout each IRDC confirms that a single Gaussian component is a poor approximation to the spectral line profiles observed at certain locations. Each cloud appears to exhibit a dominant velocity component which largely follows the morphology of the IRDC as seen in extinction. For clouds C, F, and G these are situated at km s-1, km s-1, and km s-1, respectively. However, each cloud shows additional, morphologically-distinct features which are shifted from the dominant component in either position or velocity (or both). These additional features lead to asymmetries in the line profiles of the and lines. In Figure 2, spectra extracted toward different positions across the clouds are displayed. Form this Figure, it is clear that the spectra exhibit different central velocities toward different region in the clouds, indicating the presence of multiple velocity structures. These components show differences in the centroid radial velocities 1 km s-1, i.e. more than 2/3 the mean emission linewidth in all clouds and more than 7 and 3.5 the velocity resolution () for cloud F, and clouds C and G, respectively.
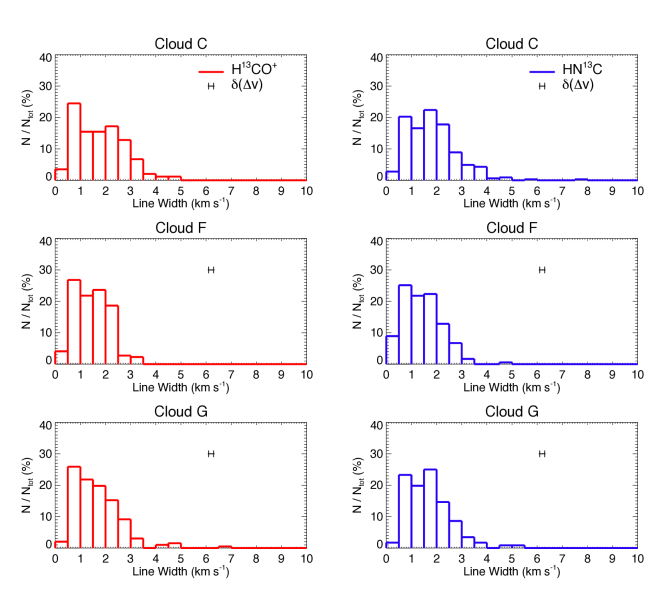
In order to determine the spatial extent and kinematics of these sub-structures, we further investigate the overall distribution of the central radial velocities and line widths of and extracted using SCOUSE across the clouds. In Figure 3, we show histograms of the velocity distributions obtained for (left panels, in red) and (right panels, in blue) toward clouds C (top), F (middle) and G (bottom). The bin size in the x-axis corresponds to 1/3 of the mean intensity-weighted linewidth, obtained from the SCOUSE results (see Section 4.1.2 and Table 6. This corresponds to 0.5 km s-1 for the three clouds. In the y-axis we plot the percentage of emission line components having central velocities falling within the bin. For each histogram, we also report the mean uncertainty on the central velocity, obtained by averaging the central velocity uncertainties derived by SCOUSE for each fitted line component.
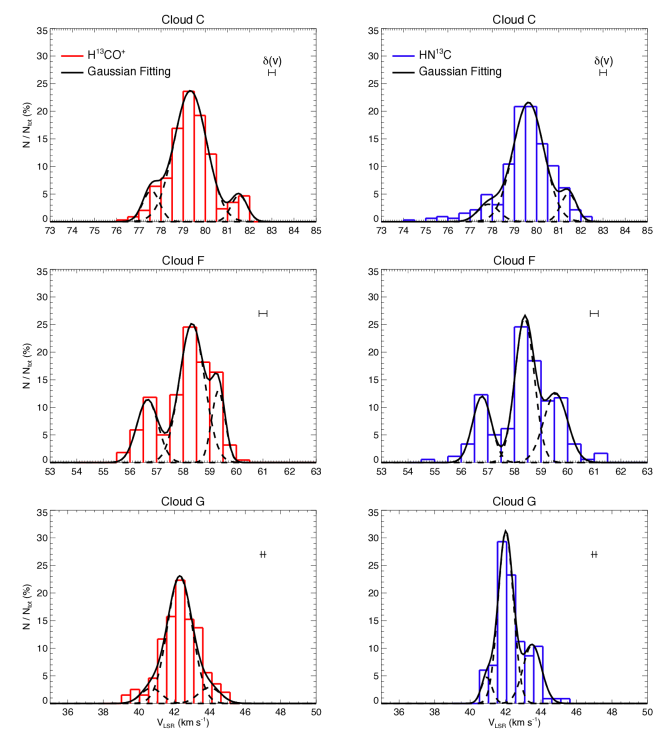
Asymmetries in the distribution of the radial velocities for each cloud are more pronounced in Figure 3. The velocity distribution of and are best fitted with three Gaussians (black lines). Using (right panels), where the asymmetries are most prominent, we define a velocity range for each cloud component as follows:
| (1) |
where is the velocity range of the sub-structures, is the central velocity and the standard deviation of the fitted Gaussian (gf = gaussian fitting). In Table 3, we report the velocity ranges defined for the sub-structures and their mean velocities obtained as (Jiménez-Serra et al. 2014):
| (2) |
The goodness of fit is provided by calculating the mean of the main residual values defined as:
| (3) |
where Gi indicates the value of the multi-gaussian fitting at the ith bin, (N/Ntot)i is the number of fitted lines falling within the ith bin and Nbin is the number of bins of the histogram.
Since both and are predominantly tracers of high-density material, and each component is well separated in velocity (Figure 3), the chances of confusion and/or blending between components is small. However, we note that a more comprehensive description of the gas kinematics of each cloud using more abundant, lower density gas tracers, and more sophisticated techniques (see Henshaw et al. 2014), will be presented in two forthcoming papers (Barnes et al., in prep.; Henshaw et al., in prep.).
| Cloud | Mean Residual | ||||||
|---|---|---|---|---|---|---|---|
| (km s-1) | (km s-1) | (km s-1) | (km s-1) | (km s-1) | (km s-1) | ||
| C | 77.8 | 77-78.5 | 79.5 | 79-80 | 81.4 | 81-82 | 0.30 |
| F | 56.6 | 56-57 | 58.5 | 58-59 | 59.5 | 59-60 | 0.13 |
| G | 41.0 | 40.5-41.5 | 41.9 | 41.5-42.5 | 43.5 | 43-44 | 0.13 |
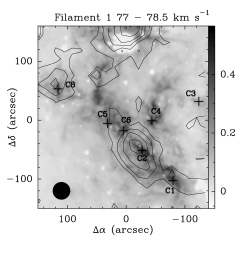
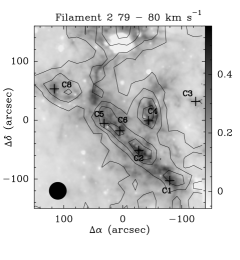
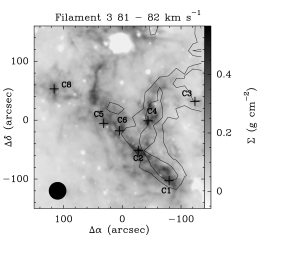
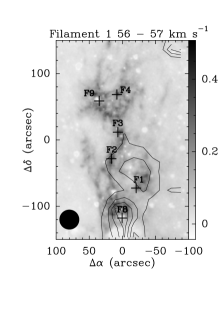
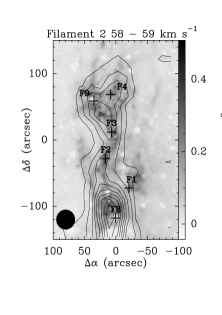
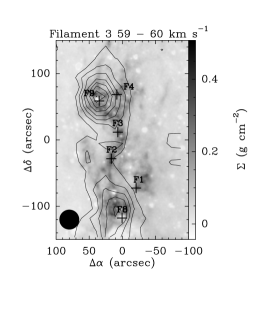
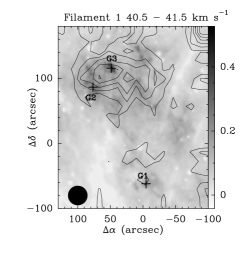
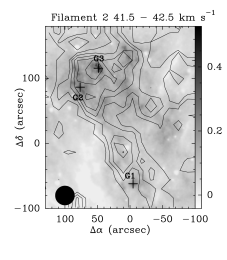
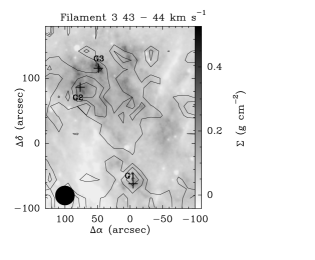
These sub-structures can be visualized in Figure 4 where we show the integrated intensity maps obtained for for the velocity ranges given in Table 3. The identified sub-structures have filamentary shapes and change in position as a function of velocity with respect to the IRDC seen in extinction. In particular, for cloud C (uppermost panels) the central and brightest sub-structure at 79.5 km s-1 extends from south-west to north, following the structure of the cloud. The blue-shifted sub-structure with mean velocity 77.8 km s-1 (uppermost left panel), however, is fainter and its emission arises mainly from the eastern part of the cloud peaking at cores C5, C2 and C1. The red-shifted sub-structure peaking at 81.4 km s-1 (uppermost right panel) shifts toward the western part of the cloud and runs from the south-west to the north-west exhibiting an arch-like shape. Its emission seems to be associated with cores C4 and C1. The three sub-structures spatially overlap toward the central chain of cores. A similar behavior was also noted for IRDC G035.39-00.33 (or cloud H) by Jiménez-Serra et al. (2014). For cloud F (Figure 4, middle panels), the blue-shifted sub-structures with mean velocity 56.6 km s-1 (left panel) is the faintest, least extended, and arises mainly from the western part of the cloud. As we move to more red-shifted velocities, the central elongated sub-structure at 58.5 km s-1 becomes apparent (middle panel), showing the brightest emission and following the filamentary structure of the cloud seen in the H2 mass surface density map. The red-shifted sub-structure peaking at 59.5 km s-1 (right panel) is also elongated but the bulk of the emission shifts towards the east of the cloud.
Very peculiar is the spatial distribution of the sub-structures in cloud G (bottom panels in Figure 4). The blue-shifted sub-structures centered at 41.0 km s-1 (left panel) is the least extended and its emission clearly originates from the G3 core. This is also true for the central sub-structure at 41.9 km s -1 (middle panel), although it shows two extensions toward the south-west following the H2 mass surface density map.
In contrast, the red-shifted sub-structure of cloud G at 43.5 km s-1 (right panel) shows a U-shape facing north-east unseen in the other sub-structures.
4.1.2 Line Width Distribution
We now investigate whether the velocity components of the dense gas show any difference in their measured line widths. In Figure 5, we report the line width distributions for both (in blue) and (in red) observed toward clouds C (top panel), F (middle panel) and G (bottom panel). The bin size has been evaluated as in Figure 3 and the percentage of emission lines having line widths falling in every bin is shown in the y-axis. For each histogram, we report the mean uncertainty in the linewidth, derived averaging the uncertainty in all the linewidths derived by SCOUSE. From Figure 5, we find a smooth distribution which peaks between 1 and 2 km s-1 with no multiple line width components. The line widths for both molecules are in any case narrower than 5 km s-1.
The overall intensity-weighted average line width, and the average linewidth of each sub-structure found in the three clouds, can be calculated as (Jiménez-Serra et al. 2014):
| (4) |
where is line width and Ii is the intensity measured for each velocity component in each position of the data cube. The obtained values are listed in Table 6.
From Table 6, the difference between the average line width of and is always for the three clouds, which implies that the dynamics of ion species is not significantly different from that of neutral molecules. Therefore, although these differences have been reported in more evolved high-mass star-forming regions (as e.g. DR21; see Hezareh et al. 2010), we do not find any evidence for this phenomena in the quiescent gas of IRDCs.
4.2 Shock tracer emission: SiO and CH3OH
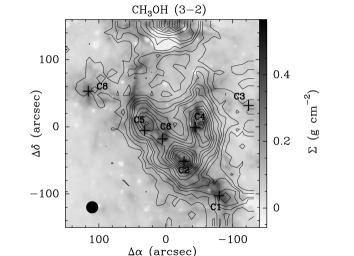
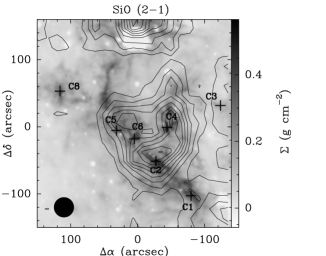
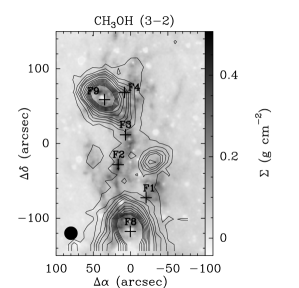
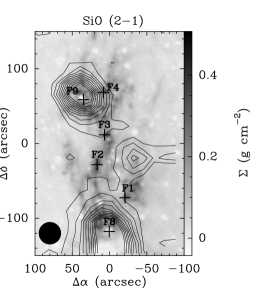
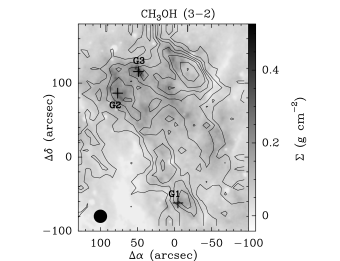
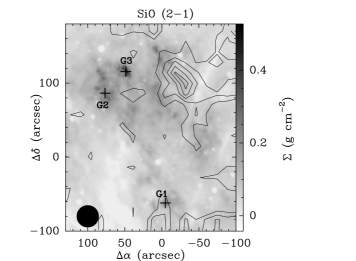
In Figure 6, the integrated intensity maps obtained for the shock tracers SiO and CH3OH are shown. The emission levels for SiO (right panels) and (left panels) are superimposed on the H2 mass surface density maps of Kainulainen & Tan (2013 ; in gray scale). Sample spectra extracted from different positions across clouds C (top panel), F (middle panel) and G (bottom panel) are also presented in Figure 7 to illustrate the change in line width and velocity across the clouds.
For simplicity, we only show the integrated intensity map obtained for the 320,2 transition.


4.2.1 Shock tracer emission in clouds C and F
From Figure 6, we find that the SiO and CH3OH emission detected toward clouds C and F is bright and widespread over several parsecs (spatial extent of 4.8 pc6.8 pc for SiO and 6.3 pc6.8 pc for toward cloud C, and spatial extent of 2.3 pc4.8 pc for both SiO and toward cloud F). For cloud C (top panels), SiO is mainly associated with the massive cores in the cloud, especially those located along the central ridge known to be actively forming massive stars (see Wang et al. 2011, Zhang et al. 2014). The emission is also bright toward the same regions where SiO is detected, although it shows an additional extension toward the northern quiescent parts of cloud C such as the emission toward C8 and the emission between C5 and the northern, very bright, infrared source (see 3 contour in the top left panel), following the morphology of the IRDC, and which remains unseen in SiO.
For cloud F (middle panels), the emission of both SiO and shows a similar pattern to that observed in cloud C. The brightest emission peaks of SiO and coincide with the location of two active massive star-forming cores F8 and F9 (see Rathborne et al. 2009, 2011), while the third SiO and CH3OH peak, at offset (-35′′,-20′′), is just 0.43 pc away from the low-mass star-forming cluster identified by Foster et al. (2014), offset (-17′′, -40′′). It is then very likely that this third SiO and emission peak is associated with this star-forming cluster. As with cloud C, note that an additional extension is detected in with respect to SiO toward the central regions of cloud F (see 3 contour in the middle left panel), coinciding with the most quiescent regions and cores in this cloud, such as core F2.
4.2.2 The case of cloud G
Very peculiar is the spatial distribution of the SiO and emission in cloud G (Figure 6, bottom panels). Unexpectedly, the SiO emission detected toward this cloud appears concentrated toward the north-west at a location off the cloud with a visual extinction of just Av20-30 mag [at offset (-28′′, 103′′)], corresponding to a mass surface density of 0.06-0.09 g cm-2, and far away from the massive cores reported in this cloud. This is also true for the brightest emission of detected in cloud G [offset (-15′′, 110′′)], as if both molecules had been enhanced by the same mechanism toward this position. We note however that, in contrast to SiO, is extended across the whole cloud and spatially follows the most quiescent regions in the IRDC (see Figure 6). Therefore, the spatial distribution of the shock tracers SiO and in cloud G shows that their emission peaks are completely offset from the known massive cores in the cloud, and that the SiO emission does not follow the morphology of the dense gas.
4.2.3 The broad and narrow components
By using SCOUSE and following a procedure similar to that performed for the dense gas tracers, in Figure 8 we present the line width distribution for SiO (in green) and (in orange) toward clouds C (top panels), F (middle panels) and G (bottom panels). The bin size in the x-axis is 1/3 of the mean intensity-weighted linewidth obtained for the dense gas tracers (i.e. 0.5 km s-1). This allows to have a direct comparison between the distributions of SiO/ and /. In the y-axis we plot the percentage of emission lines having line widths falling within the bin size. For each histogram, we report the mean uncertainty on the linewidth, derived by averaging the uncertainty in all the linewidths obtained by SCOUSE. The histograms have been obtained considering the contributions from the transitions 32, 32-1,2 and 320,2, which have been detected in all clouds. The fraction of velocities in each bin has been obtained considering the velocities obtained for the three transitions and then dividing by the total number of positions (i.e. the sum of the number of significant positions for each transition).
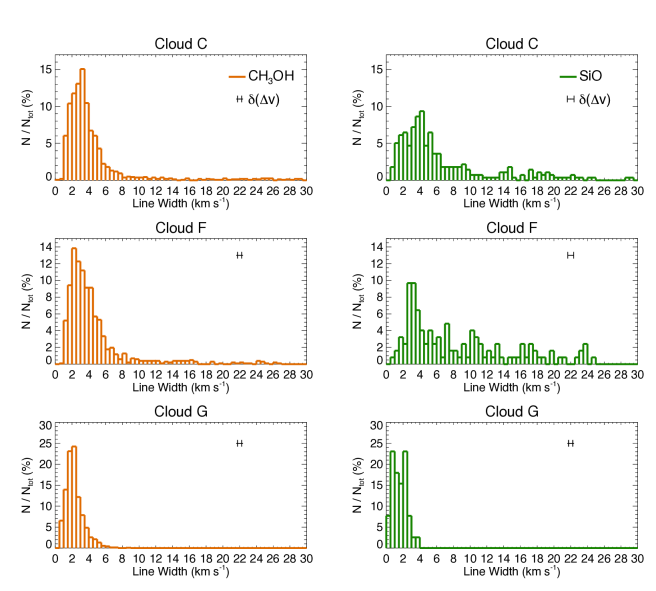
From Figure 8, we find that the line width distributions of both SiO and for clouds C and F, show two main contributions: a narrow component with a well-defined peak at line widths between 2 and 4 km s-1, and a more distributed broader component with line widths up to 30 km s-1. In contrast to clouds C and F, the line width distribution obtained for cloud G only shows the narrow component for both SiO and with typical linewidths 3 km s-1. From the line width distributions in Figure 8 only, it is difficult to define a clear threshold between the two components. Hence, we use the line width distribution of the high-density tracers and to define such as threshold (see Figure 5), since their emission is not affected by shocks. Since the linewidths from and are narrower than 5 km s-1, we thus establish the threshold between narrow and broad SiO and components at 5 km s-1. In Table 4, we report the percentage of SiO and lines having 5 km s-1.
. 3 km s-1 5 km s-1 Cloud C () F () G () C () F () G () SiO 28.9 25.8 97.4 62.1 45.2 100 47.7 46.7 83.4 81.0 85.6 99.9
From Table 4, it is clear that almost 100% of the SiO and emission in cloud G is narrow, and therefore this component dominates the shock tracer emission in this cloud. On the other hand, the narrow emission in clouds C and F accounts for 45-60 of the SiO emission and 80-85 of measured in these clouds. We note that this difference is even greater when considering a threshold of 3 km s-1, for which the fraction of SiO and narrow emission in cloud G is 83% while it accounts for 25-50% in clouds C and F. Hence, we conclude that while two line width components (narrow and broad) are clearly identified in clouds C and F, only the narrow component is observed in cloud G. This is clear in Figure 7 where SiO and spectra, extracted across the three clouds, are shown. In cloud C and F, the SiO and emission has linewidth 10 km s-1 in positions corresponding to the active cores (see C5 in cloud C and F9 in cloud F) while in the more quiescent regions (see offset (40′′,90′′) in cloud C and core F3 in cloud F) the emission linewidth is as narrow as 5 km s-1 or not detected. In cloud G (bottom right panels), the very broad component found in cloud C and F is not detected and even toward the SiO and peaks [see offset (-28′′, 103′′)] the emission is 4 km s-1.
4.2.4 Velocity Distribution
We now investigate the distribution of the radial velocities of the two linewidth components (broad and narrow) detected in SiO and toward the three clouds. Figures 9 and 10 present the velocity distribution of the broad (orange, left panels) and narrow (green, right panels) emission of, respectively, SiO and . We compare these velocity distributions with the gaussian fitting obtained for the high-density tracer (black curves; see also Figure 3). The velocity distribution of the narrow (broad) component is divided by the number of positions in which the total narrow (broad) emission has been detected.
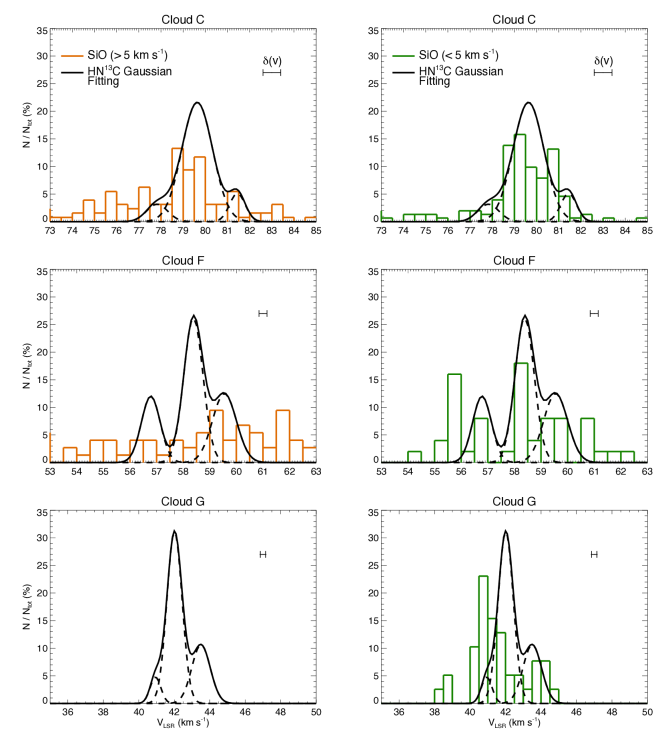
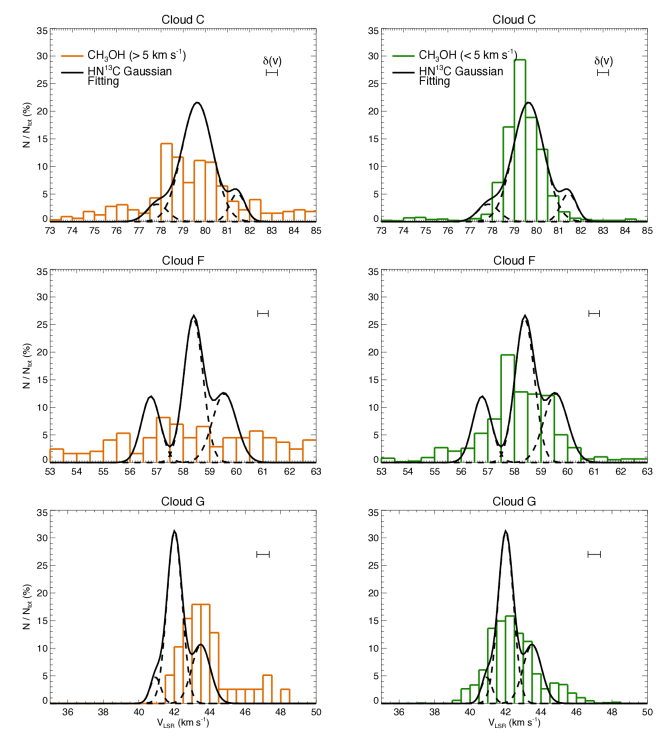
From Figures 9 and 10, it is clear that the SiO and broad components in clouds C and F show significant emission distributed across a wide range in central velocities. Furthermore, the velocity distributions are clearly unrelated to the velocity sub-structure identified from the dense gas (as probed by and ), and they do not show any coherent sub-structures by themselves. For cloud G, however, the SiO emission does not show any broad component at all, while the broad component corresponds to just 0.1 of the total emission and its line width is always 6 km s-1.
As shown in Figures 9 and 10, the narrow component is detected in all clouds and, in general, it arises mainly from the main (brightest) sub-structures detected in and . This indicates that the narrow component is moving as a whole at the central velocity of the corresponding cloud. One exception is found for the SiO narrow emission toward cloud G (right bottom panel in Figure 9), for which the emission appears skewed to blue-shifted velocities. Note that the SiO velocity distribution for the narrow component in cloud F also shows a blue-shifted peak centered at 56 km s-1 (see right middle panel in Figure 9). This component is associated to core F8 located toward the south of cloud F (see Figure 6), whose dense gas tracer emission also peaks at this blue-shifted velocity. However, unlike the narrow, blue-shifted SiO emission in cloud G, the SiO line profiles toward core F8 show both narrow and broad velocity components (see Figure 7), indicating that the kinematics of the SiO gas in core F8 are driven by active star formation activity.
5 Abundance of SiO and CH3OH in IRDCs
In this section, we estimate the abundance of the shock tracers SiO and measured for the narrow and broad components in the three clouds. The presence of several transitions allowed us to perform a multi-line excitation analysis for and estimate the excitation temperature, Tex, and total column density, Ntot, for this molecule. In order to evaluate these quantities we re-gridded the data to the largest beam size used in our observations (30′′) and extract spectra toward four positions in each cloud. The selected positions show either the broad or the narrow component and are representative of both the star-forming and quiescent gas. These positions are C1, C2, C8 and offset (40′′, 90′′) for cloud C; F2, F8, F9 and offset (-30′′, -20′′) for cloud F; and G1, G2, G3 and offset (-28′′, 103′′) for cloud G. Assuming the gas being in LTE conditions and the emission more extended than the beam size (filling factor1), we used the new software MADCUBAIJ (Rivilla et al. 2016) to calculate Tex and Ntot of the narrow emission toward the selected positions. The derived are in the range 6 - 11 K for all the clouds (see Table 5), similar to those obtained from N2H+ and CO observations (see e.g. Henshaw et al. 2014, Jiménez-Serra et al. 2014). The estimated Ntot() lie in the range 3.51013 - 5.81014 cm-2 for cloud C, 3.21013 - 2.41015 cm-2 for cloud F and 9.81013-1.91014 cm-2 for cloud G.
A similar analysis is not possible for SiO, since only one transition was covered in our observations. Hence, in order to estimate the total column density of this molecular species we assumed the Tex derived from in each position and used MADCUBAIJ to calculate the corresponding Ntot(SiO) (see Table 5). Toward cores F2, C8, G1, G2 and G3, no SiO emission was detected. Hence, only 3 upper limits to the abundance of this molecule have been estimated. The obtained Ntot(SiO) are in the range 3.01011 - 7.41012 cm-2 for cloud C, 2.51011 - 5.41013 cm-2 for cloud F and 2.91011-3.31012 cm-2 for cloud G.
In order to evaluate the enhancement of SiO in the narrow component of clouds C, F and G, we use the emission of as a probe of the H2 column density and calculate the column density ratio N(SiO)N(). The abundance of narrow SiO and is estimated as follows:
| (5) |
| (6) |
We assume a constant HCO+ fractional abundance of 10-8 (Irvine et al. 1987) and a 12C/13C ratios of 40.2, 46.8 and 49.8 for clouds C, F and G respectively (Zeng et al. 2017). The column densities are calculated following the same method as that used for SiO (see above). In the selected positions, the narrow emission from SiO and and the emission show similar central velocities and linewidths. (SiO) and () of the narrow component range between 6.310-11-7.410-10 and 0.910-8-5.810-8 for cloud C, 3.810-11-2.110-9 and 7.810-9-6.410-8 for cloud F, and 3.210-11-9.610-10 and 1.110-8-5.510-8 for cloud G.
The and SiO emission detected toward the active cores F8, F9, C1 and C2, also shows broad line profiles. Hence, we evaluated the column densities of the SiO and broad components observed toward these positions. We assumed Tex = 50 K, typical of shocked gas in molecular outflows (e.g. Jiménez-Serra et al. 2005), and we calculated the corresponding Ntot using MADCUBAIJ. Since no broad emission has been detected, we consider the 3 upper limits to the Ntot() to calculate the lower limits to the abundance of SiO and CH3OH using Eqs 5 and 6. The total column densities of the broad SiO and components are listed in Table 5 and corresponds to (SiO) and () in the range 9.510-10-2.010-9 and 1.610-8-9.710-8 for cloud C, and 8.710-9-9.310-9 and 1.210-7-5.610-7 for cloud F. A similar analysis is not possible in cloud G since no broad component has been detected toward this cloud.
From Table 5, we find that the SiO/ column density ratio for the narrow component is enhanced toward the active core positions in clouds C (e.g. C2) and F [e.g. F8, F9 and offset (-35′′, -20′′)] by a factor of 5 with respect to the upper limits measured in cores C8 and F2. In cloud G, the narrow SiO emission is enhanced by more than a factor of 10 toward its peak position, with respect to the upper limits measured in the core positions G1, G2 and G3, which implies that the (SiO) toward the SiO peak in this cloud is enhanced by a factor of 10 with respect to the quiescent gas.
| N() | N(SiO) | N() | |||||||||||||
|---|---|---|---|---|---|---|---|---|---|---|---|---|---|---|---|
| (1012 cm-2) | (1012 cm-2) | (1014cm-2) | (10-10) | (10-8) | |||||||||||
| Position | NC | BC | NC | BC | NC | BC | NC | BC | NC | BC | NC | BC | NC | BC | |
| C | C1 | 2.2 | 1.0-1.7 | 0.6 | 3.8 | 1.3 | 1.1 | 2.5 | 3.8 | 59.1 | 64.7 | 0.6 | 9.5 | 1.5 | 1.6 |
| C2 | 2.5 | 1.7 | 7.4 | 14 | 5.8 | 6.6 | 3.0 | 8.2 | 232.0 | 388.2 | 7.4 | 20.0 | 5.8 | 9.7 | |
| C8 | 1.0 | 0.3 | 0.3 | 0.3 | 34.0 | 0.8 | 0.9 | ||||||||
| (40′′, 90′′) | 0.8 | 0.4 | 0.6 | 0.5 | 72.5 | 1.2 | 1.8 | ||||||||
| F | F2 | 1.4 | 0.3 | 0.5 | 0.2 | 37.1 | 0.4 | 0.8 | |||||||
| F8 | 6.0 | 0.9-1.2 | 8.0 | 53.0 | 18.0 | 24.0 | 1.3 | 44.2 | 300.0 | 2696.6 | 2.8 | 92.8 | 6.3 | 56.6 | |
| F9 | 3.3 | 1.3 | 3.3 | 54.0 | 10.0 | 7.7 | 1.0 | 41.5 | 303.0 | 592.3 | 2.1 | 87.2 | 6.4 | 12.4 | |
| (-35′′, -20′′) | 0.6 | 6.4 | 1.6 | 10.2 | 254.0 | 21.0 | 5.3 | ||||||||
| G | G1 | 1.8 | 0.3 | 1.0 | 0.2 | 54.4 | 0.3 | 1.1 | |||||||
| G2 | 1.3 | 0.3 | 1.0 | 0.3 | 76.9 | 0.5 | 1.5 | ||||||||
| G3 | 0.9 | 0.3 | 1.0 | 0.4 | 108.7 | 0.7 | 2.2 | ||||||||
| (-28′′, 103′′) | 0.7 | 3.3 | 1.9 | 4.8 | 275.4 | 9.6 | 5.5 | ||||||||
6 Gas Mass of the Sub-structures
In this Section, we provide rough estimates of the H2 gas masses of all the velocity-coherent sub-structures identified in Clouds C, F and G from the emission of the dense gas tracers (see Section 4.1). To do this, we first calculate the total column density of H13CO+ within each velocity-coherent component by using its derived mean peak intensity , its mean intensity-weighted linewidth v and the number of emission lines fitted for each sub-structure, .
We assume an excitation temperature Tex = 9 K for all components, as discussed in Section 5. The inferred values of N() are converted into H2 mass surface densities by using (see also Hernandez et al. 2012):
| (7) |
where the mass per H nucleus is = 2.3410-24 gr, the assumed HCO+ fractional abundance is (HCO+) = 10-8 (Irvine et al. 1987) and the 12C/13C isotopic ratios for clouds C, F and G are 40.2, 46.8 and 49.8 respectively (see Zeng et al. 2017). The H2 gas mass of each velocity-coherent sub-structure is finally calculated by correcting by the pixel size area in units of cm2. The obtained values are listed in Table 6.
| v | N() | M | |||||
|---|---|---|---|---|---|---|---|
| (K) | (km s-1) | (1013 cm-2) | (gr cm-2) | (M⊙) | |||
| Cloud C | Fil1 | 0.24 | 1.47 | 58 | 2.0 | 0.4 | 227 |
| Fil2 | 0.29 | 2.05 | 155 | 8.8 | 1.7 | 988 | |
| Fil3 | 0.21 | 1.06 | 30 | 6.6 | 0.1 | 74 | |
| Cloud F | Fil1 | 0.30 | 1.31 | 39 | 1.5 | 0.3 | 109 |
| Fil2 | 0.50 | 1.82 | 94 | 8.5 | 1.9 | 606 | |
| Fil3 | 0.39 | 1.44 | 43 | 2.4 | 0.5 | 172 | |
| Cloud G | Fil1 | 0.25 | 1.59 | 30 | 1.2 | 0.3 | 55 |
| Fil2 | 0.30 | 1.87 | 74 | 4.1 | 1.0 | 192 | |
| Fil3 | 0.22 | 1.45 | 44 | 1.4 | 0.3 | 65 |
From Table 6, it is clear that the main velocity component in all clouds (Fil2) is always more massive (by factors 3-13) than their blue- (Fil1) and red-shifted (Fil3) components. This is in agreement with previous studies toward other filamentary IRDCs, which employed low-density gas tracers such as 13CO (Jiménez-Serra et al. 2014). As expected, the dense gas in each velocity component represents only a small fraction of the total mass of the cloud (as compared to the total gas masses derived from near- and mid-IR extinction mapping by Butler & Tan (2012) and Kainulainen & Tan (2013)). A future study will establish the exact mass fractions of dense gas within these sub-structures by using large-scale maps of low-density gas tracers such as 13CO and C18O obtained toward clouds C, F and G.
7 Discussion
In the past decade, several scenarios have been proposed to explain the formation of filamentary IRDCs. These include the flow-driven formation scenario and the cloud-cloud collision scenario. In the flow-driven scenario, rapid and warm atomic gas flows collide forming cold and filamentary structures due to thermal and gravitational instabilities (Vázquez-Semadeni et al. 2003, Van Loo et al. 2007, Hennebelle et al. 2008). The collision velocities are of tens of km s-1 and hence the emission of shock tracers (such as SiO and ) is expected to be very broad and the separation in velocities between sub-structures within the clouds are expected to be important (Hennebelle et al. 2008). This first scenario presents major problems when a small magnetic field is considered (Körtgen & Banerjee 2015, Körtgen et al. 2016).
Alternatively, in the cloud-cloud collision scenario, already-molecular clouds collide at moderate velocities as a result of Galactic shear motions (which are 10 km s-1; Li et al. 2017), and form filamentary structures that resemble IRDCs (Tan 2000, Tasker & Tan 2009, Van Loo et al. 2014, Wu et al. 2015, 2017a, 2017b). In this second scenario, the gas is already molecular and therefore fossil records of the cloud-cloud collision, such as high-J CO line emission or emission from molecular shock tracers such as SiO or CH3OH, are expected to be detected (Jiménez-Serra et al. 2010, Wu et al. 2015, Hernandez & Tan 2015, Pon et al. 2015, 2016a, 2016b). Since the shock velocities involved are low ( 10 km s-1) the fossil record emission is expected to be narrow, as opposed to the flow-driven scenario, where the high velocities involved in the flow collision would produce broader shock tracer emission.
From our results in Section 4.1, it is clear that the kinematic and physical structure of IRDCs is complex and shows multiple velocity-coherent structures separated in velocity space by just a few km s-1 (ranging from 2.5 to 3.6 km s-1; see Table 3), and which are clearly associated with the IRDC structures detected in extinction. This resembles the physical structure and kinematics of the molecular gas observed toward the filamentary IRDC G035.39-00.33 (already defined as cloud H; Henshaw et al. 2013, Jiménez-Serra et al. 2014). As with cloud H, the analysis of the emission of high-density gas tracers such as and suggests that these velocity-coherent structures are connected in velocity space toward the positions where massive dense cores are found in these clouds (see Figure 4), which would support the cloud-cloud collision scenario.
In order to test this hypothesis, in Section 4.2 we have investigated the morphology and kinematics of the emission of two typical shock tracers, SiO and CH3OH, to search for signatures of any possible cloud-cloud collision in clouds C, F and G. SiO and CH3OH indeed are widespread in the three clouds with spatial extents of a few parsecs across. In addition, the kinematics of these shock tracers show that clouds C and F present two clear linewidth components, i.e. a broad component showing line widths up to 30 km s-1 and a narrower component with line widths of 5 km s-1 (see Figures 8, 9 and 10). In contrast, the SiO and CH3OH emission from cloud G mainly shows narrow line profiles with a mean line width 2 km s-1, i.e. even narrower than the emission found in clouds C and F. In the following, we discuss the possible origins of the two components observed in SiO and CH3OH toward the three IRDCs analyzed in our study.
7.1 SiO emission in clouds C and F
Cloud F has been extensively studied in previous works (Rathborne et al. 2005, 2008, Foster et al. 2014) and evidence for ongoing star formation activity has been found toward several regions in the cloud. Shepherd et al. (2004) and Rathborne et al. (2005, 2008) studied the massive active core F8 (see Rathborne et al. 2006, Butler & Tan 2009) and classified it as a hot molecular core powered by an embedded B0 protostar. Sanhueza et al. (2010) and Sakai et al. (2013) found a hot core/outflow system associated with core F9. Furthermore, Chambers et al. (2009) showed that most of the massive cores in the cloud have 24 , 8 and 4.5 emission; and Foster et al. (2014), by performing deep near-IR images in H- and K-bands with the Keck telescopes, reported the presence of a distributed population of low-mass protostars in cloud F (see for instance, the embedded young cluster driving a collection of outflows coincident with the SiO emission peak detected at offset [-35′′,-20′′]; see also Figure 6).
From all this, it is not surprising that the broad SiO component contributes to almost 50 of the total SiO emission measured in this cloud (see Table 4). The SiO line profiles are clearly broad toward the most active cores in cloud F (see e.g. cores F8 and F9 in Figures 6 and 7), and toward the positions with weaker SiO emission the SiO line profiles clearly show a blue- or red-shifted broad component indicating that they are likely associated with outflow interaction (see offset (-35′′, -20′′) in Figure 7). This is supported by the fact that the abundances obtained for the SiO broad component are in agreement with those found in typical shocked outflowing gas (of some 10-9-10-8; see Martin-Pintado et al. 1992, Jiménez-Serra et al. 2005).
Signatures of ongoing star formation activity are also present in cloud C. Tan et al. (2016) and Kong et al. (2017) found a bipolar outflow in 12CO (2-1) emission associated with core C1, while most of the other cores show emission at 24 , 8 and 4.5 (Chambers et al. 2009). Feng et al. (2016) also reported a molecular outflow seen in SiO 21 emission toward core C1-S in this cloud, corresponding to a sub-structure in the C1 core of our sample. In fact, the SiO 21 line profiles measured toward this outflow show a combination of a narrow component centered at the velocity of the quiescent gas, and a broad component that appears red-/blue-shifted by a few 10 km s-1 with respect to the ambient gas. As proposed by Feng et al. (2016), while the broad component is associated with the most evolved post-shocked gas (with abundances 10-9, similar to those reported in Section 5), the narrow SiO component would correspond to an early stage in the propagation of MHD shock waves characterized by the magnetic precursor (see also Jiménez-Serra et al. 2004, 2009). The abundance estimated by Feng et al. (2016) for this narrow component, is 510-12, i.e. 10 times lower than reported in Table 5 toward this core (C1). However, note that Feng et al. (2016) use interferometric data for the abundance estimation and it likely misses a significant fraction of the extended narrow SiO emission detected within the IRAM 30m beam. It is therefore likely that the narrow and broad SiO emission detected in cloud C also arises from shocked gas in molecular outflows.
7.2 SiO emission in cloud G
As shown in Section 4.2, the SiO emission in cloud G only shows a narrow component having a mean line width of 1.6 km s-1, whose emission peaks at a position off the IRDC [offset (-28′′, 103′′)] and far away (56′′-167′′, i.e. 0.8-2.3 pc) from the location of the massive cores detected in this cloud (see Figure 6). In order to investigate the origin of this narrow SiO emission, we will investigate in detail this region of the cloud.
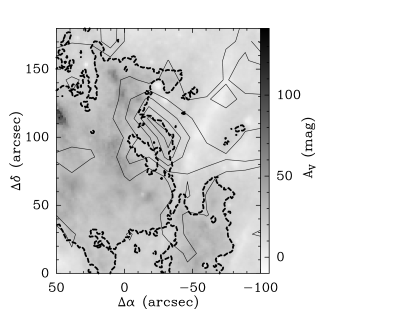
In Figure 11, we compare the morphology of the SiO emission in cloud G with that of the Av extinction map. With a dashed contour, we show the gas with dust extinctions higher than Av 20 mag. The comparison between the SiO emission and the dense gas in the cloud shows that SiO is extended and appears distributed mainly over the low extinction region in the map with Av 20 mag. However, the peak emission of SiO interestingly follows the spatial distribution of a dense ridge with Av 20 mag.
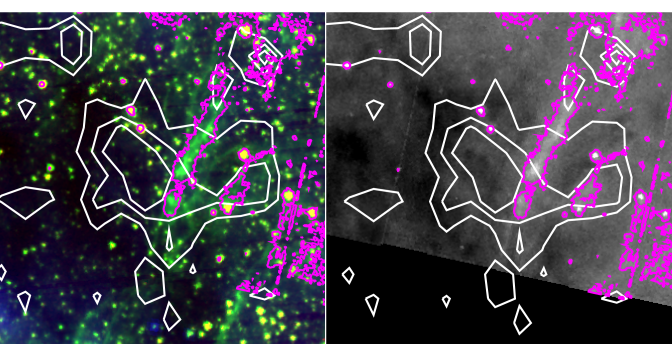
In Figure 12, we compare the SiO emission distribution (white contours) with the 8 m emission distribution (right panel) and a 3-color image of the 3.6 m (red), 4.5 m (green) and 24 m (blue) emission (left panel), all obtained with the Spitzer Telescope. From Figure 12, we find that most of the sources detected at 3.6 m and 4.5 m, and which overlap with the SiO emission, do not show any counterpart at 8 m (only two 8 m sources are detected toward the northern part of the SiO condensation). Emission at 4.5 m is believed to be associated with shocked H2 (Noriega-Crespo et al. 2004) or CO gas in outflows (Marston et al. 2004) and it is considered as an indirect evidence of on-going star formation if coupled with 8 m emission (typically associated with deeply embedded protostars). In addition, the 3.6 m and 4.5 m sources are mainly located outside the Av = 20 mag dense ridge and, therefore, it is unlikely that they represent young protostars driving outflows. Note that no 8 m source is observed toward the location of the SiO/ peak in cloud G.
Figure 12 also shows very extended 4.5 m emission running through the SiO extended emission from the north-west to the south-east (see magenta contours in both right and left panels). This emission is not associated with any 24 m object (in blue in the left panel) or 8 m source in the region (gray scale in right panel), and it does not seem to have originated from any embedded protostar. Instead, it appears as an extended nebulosity containing a collection of 4.5 m point sources. For this reason, and because the SiO emission does not peak toward this nebulosity (Figure 12), it is unlikely that this extended 4.5 m emission represents an outflow.
We speculate that the nebulous 4.5 m emission is a remnant of a large-scale interaction. In this scenario, this interaction would have compressed the region towards the western edge of cloud G, yielding the Av = 20 mag ridge seen in extinction. The extended SiO emission would then be a fossil record of this interaction. This idea would be supported by the fact that the radial velocities of SiO toward this condensation do not peak at the same velocity as the high-density gas probed by HN13C, but appear at blue-shifted velocities (see Figure 9). Note that the histogram with the radial velocities of the narrow CH3OH emission in cloud G also contains the contribution associated with the bulk of the IRDC and, as a result, it does not show the same pattern as the narrow SiO. The spread in velocities observed for SiO would support the cloud-cloud collision scenario, since it is expected from simulations of cloud-cloud collisions (Wu et al. 2017a, b). in addition, the differences in the kinematics of the SiO emission and the high-density gas may indicate that the gas compressed in the large-scale interaction did not have enough time to relax to the velocities of the bulk of the gas in the IRDC. This interaction had to be relatively gentle since the SiO emission shows linewidths 3 km s-1 (see Figure 8), which are much narrower than the ones found in clouds C and F.
Alternatively, the compression of the molecular gas in the Av = 20 mag dense ridge may have triggered the formation of a population of low-mass protostars. Bipolar outflows driven by the newly formed low-mass stars could be responsible for the presence of the detected SiO emission (Martin-Pintado et al. 1992, Zhang et al. 2000). In this scenario, the axis of the putative outflows would have to be close to the plane of the sky, with their red-shifted lobes being screened by the Av = 20 mag dense ridge. This configuration would explain the narrow SiO line profiles in cloud G that peak mostly at blue-shifted velocities. As recently shown by Stephens et al. (2017), such a configuration is highly unlikely since molecular outflows are found to be randomly oriented with respect to the molecular filaments in which they are embedded. In addition, projection effects are not expected to play a major role in the linewidth distribution of SiO in IRDCs, since the probability to detect outflows with broad emission assuming a random distribution of outflow inclination angles, is significantly lower than that to detect outflows with narrow SiO lines (see Section 3.2 in Beuther & Sridharan 2007). This is in contradiction with observations.
Narrow SiO emission has also been detected in very young outflows and proposed to be driven by the early stages of the propagation of magneto-hydrodynamic (MHD) shock waves (i.e. via the magnetic precursor; see Jiménez-Serra et al. 2004, 2005). This kind of emission is however rare and it has only been reported toward two sources (Jiménez-Serra et al. 2004, Feng et al. 2016). Another possibility would be that narrow SiO originates from shocked gas that has been decelerated by the interaction with the surrounding molecular gas envelope (see Lefloch et al. 1998). In this scenario, the extension of narrow SiO emission detected in cloud G would require 70 outflow sources for which their associated shocked gas would have been decelerated by the interaction with the Av=20 mag-extinction ridge. Higher angular resolution observations are therefore needed to establish the origin of narrow SiO in cloud G.
Finally, we note that it is very unlikely that the SiO emission detected in cloud G is arising from the merging of the internal sub-structures found in the dense gas (see Section 4.1.1, due to the fact that the separation in velocities is too low to account for the observed abundance toward the SiO peak. This is also supported by the fact that the sub-structures detected in cloud G do not spatially overlap in the region where the SiO emission is present.
7.3 SiO in actively star-forming ridges: Comparison with previous works
The emission from the 21 rotational transition of SiO has also been studied toward at least two very active high-mass star forming regions: W43 (Motte et al. 2003, Nguyen-Luong et al. 2011, 2013, Louvet et al. 2014, 2016) and Cygnus X (Wendker et al. 1991, Schneider et al. 2006, Motte et al. 2007, Duarte-Cabral et al. 2014, Duarte-Cabral & Dobbs 2016). These regions are both classified as mini-sturburts due to their high level of star formation activity, and their extended emission of SiO has been proposed to have originated in large-scale interactions (Nguyen-Luong et al. 2013, Louvet et al. 2016). The SiO lines detected toward W43 show a single gaussian line profile with typical linewidths 6 km s-1 (Nguyen-Luong et al. 2013, Louvet et al. 2016) and a mean SiO total column density of 61013 cm-2 has been estimated for this source (see Nguyen-Luong et al. 2013, Louvet et al. 2016). A similar analysis has been performed on Cygnus X by Motte et al. (2007) and Duarte-Cabral et al. (2014). The authors identified two linewidth components in the SiO line profiles: a very broad emission with linewidths 17 km s-1 and a narrower emission with linewidths in the range of 3-6 km s-1. Duarte-Cabral et al. (2014) report a SiO total column density of 0.1-41012 cm-2 toward Cygnus X.
If we compare the properties of the SiO emission toward W43 and Cygnus-X with our results from cloud G, we find that the SiO emission detected in W43 shows broader line profiles than those from cloud G ( 6 km s-1 in W43 vs. 3 km s-1 in cloud G; see Figure 8), and the total column density in W43 is higher by a factor 20 with respect to that found in cloud G. On the other hand, the SiO linewidth and the total column density estimated toward Cygnus X are comparable with the results found in cloud G and presented in Table 5. However, both W43 and Cygnus X show a level of star formation activity that is much higher than that of cloud G. This suggests that W43 and Cygnus X are in a more evolved evolutionary stage than cloud G and therefore, the SiO extended emission detected toward these sources may be affected/influenced by star formation. Cloud G may thus represent a unique case where the effects of large-scale interactions can be tested before the onset of star formation.
The SiO emission detected in W43 and Cygnus-X is comparable to our results from clouds C and F. Both the broad and narrow SiO components detected in the two clouds show linewidths similar to that in W43 and Cygnus-X and the SiO total column density in W43 is comparable to those listed in Table 5 for the two clouds of our sample. This similarity and the fact that all the four sources are hosting active sites of star formation would be an evidence of the common star-formation related origin of the SiO emission toward such sources.
7.4 emission in IRDCs
As with the SiO emission, the line profile shows a very broad linewidth component toward clouds C and F, the most active clouds of the sample. This broad component shows properties very similar to those of the broad SiO emission in the two clouds i.e. they show a similar spatial distribution and mean linewidth. It is hence likely that, as for SiO, the broad emission arises from post-shocked gas in molecular outflows (see Jiménez-Serra et al. 2005, Tafalla et al. 2010). This is supported by the fact that the broad component represents less than 0.1% of the total emission in cloud G, where the star formation activity is much lower.
As discussed in Section 4.2, the emission also shows a very narrow linewidth component in all the three clouds. This narrow component is very extended in all of the three clouds and, in particular, in cloud G where it is found to only be narrow (see Section 4.2). From the bottom panels of Figure 6, both SiO and emission are enhanced toward the north-west region of cloud G and hence it is likely that, toward this region the two molecules are affected by the same physical process and thus have the same origin (either large-scale interaction or a young population of low-mass protostars; see Section 7.2). The abundance of narrow CH3OH derived toward this position is indeed a factor of 2 higher than toward the quiescent cores G1, G2 and G3. However, unlike SiO, shows narrow emission associated with the bulk of the IRDC, where no SiO is detected. Narrow toward the cores in cloud G cannot be due to star formation because these cores are quiescent and do not show any signature of on-going star formation (see Chambers et al. 2009). Hence, some additional mechanism has to be responsible for this emission. This is also true for clouds C and F, where narrow appears more extended than the narrow SiO component. The narrow emission of also peaks at the radial velocity of the clouds (see Figure 10), indicating that most of this emission is related to the quiescent gas.
Several mechanisms can account for the release of into the gas phase. These include UV-induced photo-desorption and chemical reactive desorption444In the process of chemical reactive desorption, the newly formed molecule possesses an energy surplus that allows it to evaporate (see Minissale et al. 2016).. As reported by Martín-Doménech et al. (2016), UV-induced photo-desorption is very unlikely since UV photons dissociate into radicals forming smaller molecules such as CO, CO2 and H2CO that are then released into the gas phase. On the other hand, chemical reactive desorption allows the desorption of itself after its formation on grain surfaces via hydrogenation, representing a viable mechanism for the production of narrow in IRDCs not associated with star formation. This process also explains the presence of and other complex organics in the gas phase of pre-stellar cores such as L1498, L1517B and L1544 (Bizzocchi et al. 2014, Jiménez-Serra et al. 2016, Vasyunin et al. 2017). The abundance of in the L1544 pre-stellar core is 610-9 (Vastel et al. 2014), which is comparable to the abundances estimated toward clouds C, F and G in the quiescent gas for the narrow component (see Table 5).
The presence of internal shocks of a few km s-1 can also be responsible for the narrow emission in IRDCs (Pon et al. 2015). These shocks are due to virialized motions of the gas within the clouds and could possibly account for the estimated abundance. However, at the current spatial resolution it is not possible to resolve such internal shocks. We exclude the scenario of thermal desorption in the quiescent regions of clouds C, F and G because the typical temperatures of IRDCs (20 K; Pillai et al. 2006) are much lower than that required for to evaporate (Collings et al. 2004). However, note that this desorption mechanism is possibly responsible for the narrow lines detected toward star-forming cores in clouds C and F because they likely arise from the hot envelopes around young protostars.
8 Conclusions
Using the IRAM 30m single dish telescope, we performed a detailed analysis of the , , SiO and emission toward three filamentary IRDCs: G028.37+00.07, G034.43+00.24 and G034.77-00.55 (clouds C, F and G, respectively). We investigated the spatial distribution and kinematics of dense gas ( and ) and shock (SiO and ) tracers. We studied the line profiles for all the transitions, including studying the line width and central velocity distributions. The results we obtained can be summarized as follows:
-
i)
In all three clouds of our sample, the dense gas emission shows multiple velocity components corresponding to three independent sub-structures that are spatially and kinematically well defined. The brightest sub-structures probe the ambient gas moving at the central velocity of the clouds, while the red and blue shifted sub-structures have velocity drifts of 1 km s-1 with respect to the central velocity of the clouds.
-
ii)
The and emission lines show similar line width, always 5 km s-1. The mean line width values (in the range 1.8 -1.6 km s-1) obtained for the two molecules are comparable in the three clouds. Furthermore, from the linewidth distributions shown in Figure 5 only one line width component can be identified.
-
iii)
The spatial distribution of shock tracers is widespread at a parsec scale in all the clouds. In clouds C and F the emission is also affected by the presence of several active cores, while in cloud G, the SiO and emission distributions are very different. In this cloud the SiO emission is concentrated around its peak, in the north east region, while the emission is distributed along the cloud and follows well its filamentary structure. In both cases, the emission distribution is not correlated with the (inactive) cores of the cloud.
-
iv)
The shock tracers’ emission shows multiple line width components: a narrow ( 5 km s-1), widespread component across the clouds that is present in almost every position with significant emission, and a broad (up to 30 km s-1) component that is strictly related to the positions of the cores in the cloud. In clouds C and F, both components are detected. In cloud G, the SiO emission is only narrow, while for the emission, 0.1 of the total emission present lines broader than 5 km s-1. However, this small fraction presents line width always 6 km s-1 and is not significant compared to the total emission.
-
v)
Neither the broad nor the narrow component in the SiO and emission follow the high-density sub-filamentary structure. Furthermore, the broad component is distributed along a wide velocity range, while the narrow component is less extended in velocity. Narrow SiO emission in cloud G shows a radial velocity distribution skewed to blue-shifted velocities.
-
vi)
In clouds C and F, the shock tracers’ emission is likely due to the ongoing star formation activity. The presence of outflows in these clouds would be responsible for both the broad and the narrow components, corresponding to the post-shocked gas and the early stage in the propagation of MHD shock waves, respectively.
-
vii)
In cloud G, the very low level of star formation activity and the very narrow linewidth of the shock tracers emission suggest a different origin for the SiO and the enhanced emission toward the north-west of this cloud. Particularly, the SiO emission could be a fossil record of a previous large-scale interaction occurring nearby. As a second possibility, the mentioned large-scale interaction could have triggered the formation of a low-mass star population within a Av=20 mag-extinction ridge, whose SiO emission originates from outflows. Such outflows should show an almost parallel orientation in the plane of the sky with their red-shifted lobes being screened by the Av=20 mag ridge.
-
viii)
The narrow emission in cloud G is more extended than the corresponding SiO emission and shows velocities very close to the central velocity of the cloud. Hence, it is mainly associated with the quiescent gas and it is likely produced by the chemical-reactive desorption mechanism.
Acknowledgements
We thank the anonymous referee for their comments which have helped to improve the clarity of this paper. I.J.-S. acknowledges the financial support received from the People Programme (Marie Curie Actions) of the European Union’s Seventh Framework Programme (FP7/2007-2013) under REA grant agreement PIIF-GA-2011-301538, and from the STFC through an Ernest Rutherford Fellowship (proposal number ST/L004801). The research leading to these results has also received funding from the European Commission (FP/2007-2013) under grant agreement No 283393 (RadioNet3). P. C. acknowledges support from the European Research Council (ERC; project PALs 320620). Partial salary support for A. P. was provided by a Canadian Institute for Theoretical Astrophysics (CITA) National Fellowship.
References
- Akaike (1974) Akaike H., 1974, IEEE Transactions on Automatic Control, 19, 716
- Bachiller et al. (2001) Bachiller R., Pérez Gutiérrez M., Kumar M. S. N., Tafalla M., 2001, A&A, 372, 899
- Beuther & Sridharan (2007) Beuther H., Sridharan T. K., 2007, ApJ, 668, 348
- Bizzocchi et al. (2014) Bizzocchi L., Caselli P., Spezzano S., Leonardo E., 2014, A&A, 569, A27
- Butler & Tan (2009) Butler M. J., Tan J. C., 2009, ApJ, 696, 484
- Butler & Tan (2012) Butler M. J., Tan J. C., 2012, ApJ, 754, 5
- Chambers et al. (2009) Chambers E. T., Jackson J. M., Rathborne J. M., Simon R., 2009, ApJS, 181, 360
- Collings et al. (2004) Collings M. P., Anderson M. A., Chen R., Dever J. W., Viti S., Williams D. A., McCoustra M. R. S., 2004, MNRAS, 354, 1133
- Csengeri et al. (2016) Csengeri T. et al., 2016, A&A, 586, A149
- Duarte-Cabral et al. (2014) Duarte-Cabral A., Bontemps S., Motte F., Gusdorf A., Csengeri T., Schneider N., Louvet F., 2014, A&A, 570, A1
- Duarte-Cabral & Dobbs (2016) Duarte-Cabral A., Dobbs C. L., 2016, MNRAS, 458, 3667
- Egan et al. (1998) Egan M. P., Shipman R. F., Price S. D., Carey S. J., Clark F. O., Cohen M., 1998, ApJL, 494, L199
- Feng et al. (2016) Feng S., Beuther H., Zhang Q., Liu H. B., Zhang Z., Wang K., Qiu K., 2016, ApJ, 828, 100
- Foster et al. (2014) Foster J. B. et al., 2014, ApJ, 791, 108
- Heitsch et al. (2009) Heitsch F., Ballesteros-Paredes J., Hartmann L., 2009, ApJ, 704, 1735
- Hennebelle et al. (2008) Hennebelle P., Banerjee R., Vázquez-Semadeni E., Klessen R. S., Audit E., 2008, A&A, 486, L43
- Henshaw et al. (2014) Henshaw J. D., Caselli P., Fontani F., Jiménez-Serra I., Tan J. C., 2014, MNRAS, 440, 2860
- Henshaw et al. (2013) Henshaw J. D., Caselli P., Fontani F., Jiménez-Serra I., Tan J. C., Hernandez A. K., 2013, MNRAS, 428, 3425
- Henshaw et al. (2016) Henshaw J. D. et al., 2016, MNRAS, 457, 2675
- Hernandez & Tan (2015) Hernandez A. K., Tan J. C., 2015, ApJ, 809, 154
- Hezareh et al. (2010) Hezareh T., Houde M., McCoey C., Li H.-b., 2010, ApJ, 720, 603
- Irvine et al. (1987) Irvine W. M., Goldsmith P. F., Hjalmarson A., 1987, in Astrophysics and Space Science Library, Vol. 134, Interstellar Processes, Hollenbach D. J., Thronson Jr. H. A., eds., pp. 561–609
- Jiménez-Serra et al. (2014) Jiménez-Serra I., Caselli P., Fontani F., Tan J. C., Henshaw J. D., Kainulainen J., Hernandez A. K., 2014, MNRAS, 439, 1996
- Jiménez-Serra et al. (2008) Jiménez-Serra I., Caselli P., Martín-Pintado J., Hartquist T. W., 2008, A&A, 482, 549
- Jiménez-Serra et al. (2010) Jiménez-Serra I., Caselli P., Tan J. C., Hernandez A. K., Fontani F., Butler M. J., van Loo S., 2010, MNRAS, 406, 187
- Jiménez-Serra et al. (2009) Jiménez-Serra I., Martín-Pintado J., Caselli P., Viti S., Rodríguez-Franco A., 2009, ApJ, 695, 149
- Jiménez-Serra et al. (2004) Jiménez-Serra I., Martín-Pintado J., Rodríguez-Franco A., Marcelino N., 2004, ApJL, 603, L49
- Jiménez-Serra et al. (2005) Jiménez-Serra I., Martín-Pintado J., Rodríguez-Franco A., Martín S., 2005, ApJL, 627, L121
- Jiménez-Serra et al. (2016) Jiménez-Serra I. et al., 2016, ApJL, 830, L6
- Kainulainen & Tan (2013) Kainulainen J., Tan J. C., 2013, A&A, 549, A53
- Kong et al. (2017) Kong S., Tan J. C., Caselli P., Fontani F., Wang K., Butler M. J., 2017, arXiv:701.05953
- Körtgen & Banerjee (2015) Körtgen B., Banerjee R., 2015, MNRAS, 451, 3340
- Körtgen et al. (2016) Körtgen B., Seifried D., Banerjee R., Vázquez-Semadeni E., Zamora-Avilés M., 2016, MNRAS, 459, 3460
- Lefloch et al. (1998) Lefloch B., Castets A., Cernicharo J., Loinard L., 1998, ApJL, 504, L109
- Li et al. (2017) Li Q., Tan J. C., Christie D., Bisbas T. G., Wu B., 2017, arXiv:1706.03764
- Liszt et al. (1984) Liszt H. S., Burton W. B., Xiang D.-L., 1984, A&A, 140, 303
- Louvet et al. (2016) Louvet F. et al., 2016, A&A, 595, A122
- Louvet et al. (2014) Louvet F. et al., 2014, A&A, 570, A15
- Marston et al. (2004) Marston A. P. et al., 2004, ApJS, 154, 333
- Martín-Doménech et al. (2016) Martín-Doménech R., Muñoz Caro G. M., Cruz-Díaz G. A., 2016, A&A, 589, A107
- Martin-Pintado et al. (1992) Martin-Pintado J., Bachiller R., Fuente A., 1992, A&A, 254, 315
- Minissale et al. (2016) Minissale M., Dulieu F., Cazaux S., Hocuk S., 2016, A&A, 585, A24
- Motte et al. (2007) Motte F., Bontemps S., Schilke P., Schneider N., Menten K. M., Broguière D., 2007, A&A, 476, 1243
- Motte et al. (2003) Motte F., Schilke P., Lis D. C., 2003, ApJ, 582, 277
- Nguyen-Luong et al. (2013) Nguyen-Luong Q. et al., 2013, ApJ, 775, 88
- Nguyen-Luong et al. (2011) Nguyen-Luong Q. et al., 2011, A&A, 529, A41
- Noriega-Crespo et al. (2004) Noriega-Crespo A., Carey S., Eisloffel J., Latter W., Marleau F., Morris P., Raga A., Stapelfeldt K., 2004, Emission from H2, PAHs, and Warm Dust in Proto-stellar Jets. Spitzer Proposal
- Perault et al. (1996) Perault M. et al., 1996, A&A, 315, L165
- Peretto & Fuller (2010) Peretto N., Fuller G. A., 2010, ApJ, 723, 555
- Pillai et al. (2006) Pillai T., Wyrowski F., Menten K. M., Krügel E., 2006, A&A, 447, 929
- Pon et al. (2015) Pon A., Caselli P., Johnstone D., Kaufman M., Butler M. J., Fontani F., Jiménez-Serra I., Tan J. C., 2015, A&A, 577, A75
- Pon et al. (2016a) Pon A. et al., 2016a, A&A, 587, A96
- Pon et al. (2016b) Pon A. et al., 2016b, ApJ, 827, 107
- Rathborne et al. (2011) Rathborne J. M., Garay G., Jackson J. M., Longmore S., Zhang Q., Simon R., 2011, ApJ, 741, 120
- Rathborne et al. (2005) Rathborne J. M., Jackson J. M., Chambers E. T., Simon R., Shipman R., Frieswijk W., 2005, ApJL, 630, L181
- Rathborne et al. (2006) Rathborne J. M., Jackson J. M., Simon R., 2006, ApJ, 641, 389
- Rathborne et al. (2009) Rathborne J. M., Jackson J. M., Simon R., Zhang Q., 2009, Ap&SS, 324, 155
- Rathborne et al. (2008) Rathborne J. M., Jackson J. M., Zhang Q., Simon R., 2008, ApJ, 689, 1141
- Rathborne et al. (2007) Rathborne J. M., Simon R., Jackson J. M., 2007, ApJ, 662, 1082
- Rivilla et al. (2016) Rivilla V. M., Fontani F., Beltrán M. T., Vasyunin A., Caselli P., Martín-Pintado J., Cesaroni R., 2016, ApJ, 826, 161
- Sakai et al. (2013) Sakai T. et al., 2013, ApJL, 775, L31
- Sanhueza et al. (2010) Sanhueza P., Garay G., Bronfman L., Mardones D., May J., Saito M., 2010, ApJ, 715, 18
- Schilke et al. (1997) Schilke P., Walmsley C. M., Pineau des Forets G., Flower D. R., 1997, A&A, 321, 293
- Schneider et al. (2006) Schneider N., Bontemps S., Simon R., Jakob H., Motte F., Miller M., Kramer C., Stutzki J., 2006, A&A, 458, 855
- Shepherd et al. (2004) Shepherd D. S., Nürnberger D. E. A., Bronfman L., 2004, ApJ, 602, 850
- Simon et al. (2006) Simon R., Rathborne J. M., Shah R. Y., Jackson J. M., Chambers E. T., 2006, ApJ, 653, 1325
- Stark (1984) Stark A. A., 1984, ApJ, 281, 624
- Stephens et al. (2017) Stephens I. W. et al., 2017, ApJ, 846, 16
- Tafalla et al. (2010) Tafalla M., Santiago-García J., Hacar A., Bachiller R., 2010, A&A, 522, A91
- Tan (2000) Tan J. C., 2000, ApJ, 536, 173
- Tan et al. (2016) Tan J. C., Kong S., Zhang Y., Fontani F., Caselli P., Butler M. J., 2016, ApJL, 821, L3
- Tasker & Tan (2009) Tasker E. J., Tan J. C., 2009, ApJ, 700, 358
- Van Loo et al. (2007) Van Loo S., Falle S. A. E. G., Hartquist T. W., Moore T. J. T., 2007, A&A, 471, 213
- Van Loo et al. (2014) Van Loo S., Keto E., Zhang Q., 2014, ApJ, 789, 37
- Vastel et al. (2014) Vastel C., Ceccarelli C., Lefloch B., Bachiller R., 2014, ApJL, 795, L2
- Vasyunin et al. (2017) Vasyunin A. I., Caselli P., Dulieu F., Jiménez-Serra I., 2017, ApJ, 842, 33
- Vázquez-Semadeni et al. (2003) Vázquez-Semadeni E., Ballesteros-Paredes J., Klessen R., 2003, in Astronomical Society of the Pacific Conference Series, Vol. 287, Galactic Star Formation Across the Stellar Mass Spectrum, De Buizer J. M., van der Bliek N. S., eds., pp. 81–86
- Wang et al. (2011) Wang K., Zhang Q., Wu Y., Zhang H., 2011, ApJ, 735, 64
- Wendker et al. (1991) Wendker H. J., Higgs L. A., Landecker T. L., 1991, A&A, 241, 551
- Wu et al. (2017a) Wu B., Tan J. C., Christie D., Nakamura F., Van Loo S., Collins D., 2017a, arXiv:1702.08117
- Wu et al. (2017b) Wu B., Tan J. C., Nakamura F., Van Loo S., Christie D., Collins D., 2017b, ApJ, 835, 137
- Wu et al. (2016) Wu B., Tan J. C., Van Loo S., nakamura f., Bruderer S., 2016, in American Astronomical Society Meeting Abstracts, Vol. 227, American Astronomical Society Meeting Abstracts, p. 319.02
- Wu et al. (2015) Wu B., Van Loo S., Tan J. C., Bruderer S., 2015, ApJ, 811, 56
- Zeng et al. (2017) Zeng S. et al., 2017, arXiv:1705.04082
- Zhang et al. (2000) Zhang Q., Ho P. T. P., Wright M. C. H., 2000, AJ, 119, 1345
- Zhang et al. (2014) Zhang Q. et al., 2014, ApJ, 792, 116
- Zhang et al. (2009) Zhang Q., Wang Y., Pillai T., Rathborne J., 2009, ApJ, 696, 268