Stiffness-guided motion of a droplet on a solid substrate
Abstract
A range of technologies require the directed motion of nanoscale droplets on solid substrates. A way of realizing this effect is durotaxis, whereby a stiffness gradient of a substrate can induce directional motion without requiring an energy source. Here, we report on the results of extensive molecular dynamics investigations of droplets on a surface with varying stiffness. We find that durotaxis is enhanced by increasing the stiffness gradient and, also, by increased wettability of the substrate, in particular, when droplet size decreases. We anticipate that our study will provide further insights into the mechanisms of nanoscale directional motion.
I Introduction
A range of technologies require the control of liquids on surfaces, such as microfabrication Srinivasarao et al. (2001) and coating,Chaudhury and Whitesides (1992); Wong et al. (2011) with many of these applications also requiring a directed motion of nanodroplets onto the surface Lagubeau et al. (2011); Prakash et al. (2008); Chaudhury and Whitesides (1992); Darhuber and Troian (2005). To this end, many methods have been explored, for example heterogeneous surface chemistries for different patterns Gau et al. (1999); Sirringhaus et al. (2000); Hanakata et al. (2015), temperature and electric potential gradients Chaudhury and Whitesides (1992); Darhuber and Troian (2005), and surface topography Lafuma and Quéré (2003); Courbin et al. (2007); Tretyakov and Müller (2014, 2013); Karapetsas et al. (2016). Other techniques for moving nanoscale objects are based on electrical current Dundas et al. (2009); Regan et al. (2004); Zhao et al. (2010); Kudernac et al. (2011), charge Shklyaev et al. (2013); Fennimore et al. (2003); Bailey et al. (2008), thermal energy (selective heating) Barreiro et al. (2008); Somada et al. (2009); Chang and Guo (2010), simple stretch Huang et al. (2014), and complicated chemical reactions (e.g. in biological processes) van den Heuvel and Dekker (2007). In the context of biology, directional motion of cells takes place due to various stimuli, such as substrate chemicals, light, gravity and electrostatic potential Ridley et al. (2003). Recent studies have shown that cell movements are also guided by substrate stiffness (rigidity), a phenomenon known as durotaxis Lo et al. (2000).
Inspired by durotaxis in biology, solid substrate durotaxis has emerged as an attractive research field as the motion of nanoscale objects can be guided by substrate stiffness without the requirement for an energy source with implications for nanoscale actuation and energy conversion Style et al. (2013); Chang et al. (2015); Pham et al. (2016); Lazopoulos and Stamenović (2008); Becton and Wang (2016). Moreover, solid substrate durotaxis, which was investigated by using computer simulation in the context of a flake sliding on a graphene substrate with a stiffness gradient, shares similarities with the stiffness-guided directional motion in living cells as in both cases weak van der Waals interactions are present Chang et al. (2015). In particular, the interaction between the substrate and the flake was inversely proportional to the stiffness Chang et al. (2015). Lower potential energies are more stable than higher ones, and this explains the motion towards the higher stiffness adopting a thermodynamically favorable state Barnard (2015); Becton and Wang (2016). In this case, computer simulation has been an extremely useful tool to interpret the modeled process, as materials were electrically, chemically and thermally isolated free of defects and impurities. Here, we study durotaxis in the context of a liquid droplet on a solid substrate with a stiffness gradient by means of computer simulation. In particular, we explore different stiffness gradients, droplet sizes, and levels of attraction between the droplet and the substrate. Our results highlight the importance of interfacial energy between the droplet and the substrate, in agreement with Chang et al. Chang et al. (2015). We anticipate that our study will provide further insights into substrate patterning leading to new opportunities in nanoscale science and technology Barnard (2015).
II The Model
In this study we consider a system comprised of a liquid droplet on a substrate with stiffness gradient. The droplet consists of polymer chains (, or ) with segments each. For the chosen chain length the vapor pressure is sufficiently low and evaporation effects are negligible Tretyakov and Müller (2014). Owing to the comparatively small size of the droplets, important quantities that characterize the droplet, such as the contact angle, are subject to strong fluctuations, while in addition such properties become also size dependent Theodorakis et al. (2015).
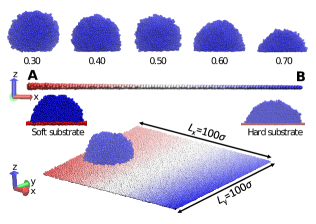
The substrate is formed by a layer of spherical beads, positioned on a square lattice with lattice constant , where , with bead diameter serving here also as a unit of length. The substrate is chosen with linear dimensions in the and directions , respectively (see Fig. 1).
Interactions between different components of the system, i.e., drop particles and substrate beads, are described by means of the Lennard-Jones potential, i.e.,
| (1) |
where is the distance between any pair of beads in the system, and and indicate the type of beads: “” stands for polymer beads, and “” denotes substrate beads. In the present consideration, . As usual, the LJ-potential is cut and shifted at a cutoff distance for the “” and “” interactions, while for the interaction between substrate beads (i.e., a purely repulsive interaction). The parameter of the LJ potential for the polymer and the substrate is , while was used to tune the affinity between the substrate and the droplet. Here, , , , , and in units of . For example, the choice of provides a droplet contact-angle of roughly 90o on stiff substrates, which, of course, is size and model dependent Theodorakis et al. (2015).
The finite extensible nonlinear elastic (FENE) potential Kremer and Grest (1990) was used to keep together consecutive beads in the polymer chain. The FENE potential reads
| (2) |
where is the distance between two consecutive bonded beads along the polymer backbone, expresses the maximum extension of the bond, and is an elastic constant.
Substrate beads are tethered to their lattice sites by a harmonic potential with spring constant (the factor is absorbed in the constant), which is used as a parameter for tuning the substrate stiffness. Small values of result in large fluctuations of the substrate beads around their position on the lattice sites, which corresponds to small substrate stiffness (soft substrates), whereas large values of result in strong tethering of the substrate beads to their lattice sites resulting in a large stiffness (hard substrate) Hanakata et al. (2015). The stiffness gradient is implemented along the -direction (see Fig. 1): Starting from an initial stiffness , (expressed in units with being the unit of energy) at the very left side (point in Fig. 1) of the substrate with coordinate , we increase the stiffness by every until the right end of the substrate (point B in Fig. 1) in the -direction with stiffness is reached. Hence, the stiffness for each bead depends on the set (, ), according to the relation , where is an integer that indicates the number of times we increased the stiffness in the direction by an amount every . In our study, we explore different sets of these parameters along with the adhesion parameter studying droplets of different size .
To evolve our system in time, we used Molecular Dynamics (MD) simulations by choosing the Langevin thermostat Schneider and Stoll (1978) as implemented in the LAMMPS package Plimpton (1995). The time unit in our simulations is , where is the mass unit of the drop particles and the substrate beads. The integration time-step for the velocity-Verlet integration of the equations of motion is . Thus, the temperature fluctuates around a predefined value , where is the Boltzmann constant, and the energy is measured in units of . The total number of beads of the system is fixed and the total volume of the system, which is also constant, corresponds to the size of the simulation box, that is, with large enough so as to guarantee that neither the substrate nor the polymer droplet interact with their periodic images in the -direction. Typical trajectories start at the left edge of the droplet positioned at point of the substrate (see Fig. 1) while the simulations run up to MD time steps. Our results are based on the analysis of ten independent trajectories for each set of values (, , , and ).
III Results
We have studied three different substrates with the same average stiffness in order to examine the role of the stiffness gradient in durotaxis (see Fig. 2). If the stiffness at the right most end of the substrate (
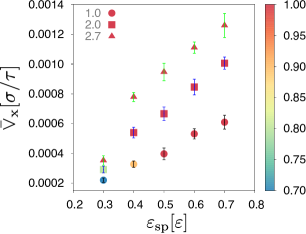
in Fig. 1) is , then the mean stiffness will be for substrates with constant gradient along the -direction. Here, we set , and the three chosen sets of (, ) are , and , corresponding to values of the gradient, , and , respectively. The degree of droplet adhesion to the substrate, governed by the droplet–substrate affinity also affects the process of durotaxis, and should be taken into account by varying the strength of . With this choice of parameters, the droplet is found to perform a predominantly translational movement from the soft edge towards the rigid end of the substrate. In Fig. 2 we plot the observed mean velocity , averaged over ten individual droplets, as function of the surface adhesion for the three rigidity gradients .
One should note, however, that drops, depending on the concrete values of the aforementioned parameters, undergo partially random displacements away from the gradient -direction, so that not all droplets manage to reach the stiff edge of the substrate within the time window of the computer experiment. Therefore, in Fig. 2 we use a color bar to indicate the share of droplets that successfully traverse the distance between the soft and the stiff edge of the substrate.
Apparently, the results, displayed on Fig. 2 indicate, that the mean velocity of drops, , on three substrates with the same average stiffness, increases steadily and proportionally to the magnitude of the stiffness gradient . In addition, the higher attraction between the droplet and the substrate leads to larger mean velocity of the droplet during durotaxis irrespective of the magnitude of the stiffness gradient. Moreover, the probability of durotaxis is lower than one in the case of small gradients and weak adhesion . These findings represent the central results of this investigation. A plot of our simulation data, cf. Fig. 3, as a function of the gradient, , for different strength of adhesion, , and comparison with Fig. 2 indicates that the mean speed of durotaxis changes
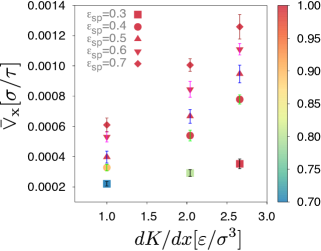
linearly with the stiffness gradient, , and with the strength of attraction between the droplet and the substrate, , namely, droplets move faster on better wettable substrates. Therefore, our parameter exploration for various cases, suggests that higher stiffness gradient and stronger affinity between the droplet and the substrate result in more efficient durotaxis.
.
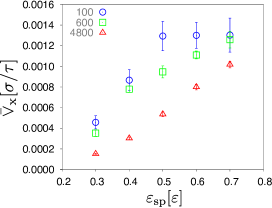
As is well known, the size of small (nano)droplets affects the resulting contact angle and the degree of droplet adhesion on surfaces whenever the free energy of the contact line becomes comparable to the surface free energy (surface tension). One may, therefore, expect that durotaxis will also depend on droplet size Chen et al. (2017). We have investigated different drop sizes (see Fig. 4) and we established that the bigger the droplet is, the less efficient durotaxis becomes. Our observation holds for the whole range of values considered in this study. In particular, the smallest droplet with () exhibits the fastest durotaxis reaching a threshold speed value when , whereas the largest droplet () exhibits a linear dependence with the parameter
. We interpret this result as consequence of the increased friction due to the larger area of contact with the substrate associated with the big droplet. One should also note that this observation is at variance with the results of Style et al. Style et al. (2013), who found that a drop moves spontaneously toward softer parts of the substrate, once the contact angle difference across the droplet, , exceeds some critical value, given that would be also larger for the bigger droplets. Our results comply, however, with those of Chang et al. Chang et al. (2015) who used similar architecture of the substrate as ours, which makes us believe that the concrete implementation of varying degree of stiffness along the substrate largely determines the outcome of durotaxis.
Based on our detailed analysis of a larger number of different properties and systems, the driving force for durotaxis on a substrate with variable stiffness stems from the possibility for the droplet to diminish its overall energy by displacement to stiffer regions on the substrate, in agreement with previous work in the context of a flake on a graphene layer Chang et al. (2015); Becton and Wang (2016). Fig. 5 illustrates examples of systems with different durotaxis efficiency. Comparing these results with those of Figures 2 and 3, we observe that larger variations in the interfacial energy with changing position lead to more efficient durotaxis.
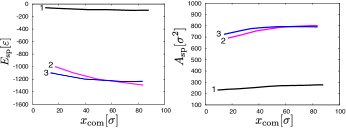
In this case, the droplet is able to establish a larger number of contacts with the substrate and get attracted stronger by the interface. This results in changes of many properties with the centre-of-mass displacement of the droplet, such as the radius of gyration of the droplet, the interfacial area between the droplet and the substrate, as well as the contact angle . Analyzing the various contributions to the total energy of the system, it appears that minimization of the interfacial energy (expressed through ) serves as the main driving force for efficient durotaxis.
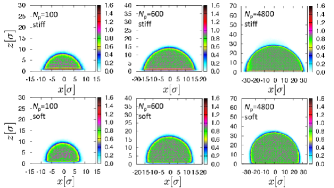
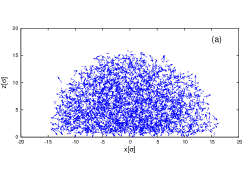
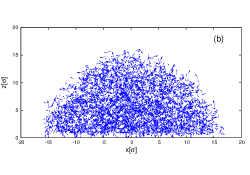
Moreover, by exploring droplets of different size, and analyzing the respective density profiles, cf. Fig. 6), we find that larger droplets are generally more hydrophobic than smaller ones for the same values of and degree of substrate stiffness. This indicates that as the drop size decreases, a gain from negative line tension compensates increasingly the energy expense related to the vapor-liquid surface of the drop Milchev and Milchev (2001) as established earlier by Gretz Gretz (1966).
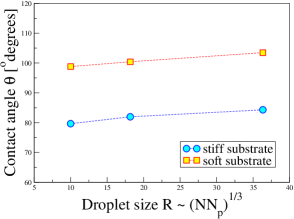
We also observe that the contact angle for droplets of different size is always smaller at stiffer substrates (whereby the stronger attraction to the substrate leads to layering effects) than it is for soft substrates (Figs. 6 and 7). As is evident from Fig. 6, the droplet does not “immerse” into the softer part of the substrate, but rather, irrespective of the stiffness, the substrate is able to support the droplet. One may, therefore, conclude that the interfacial energy, which is the governing force of durotaxis, depends on the size of the droplet, the substrate stiffness, as well as on the substrate wettability, whereby stronger stiffness gradients enhance the durotaxis.
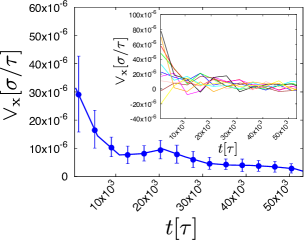

Eventually, we also analyzed the instantaneous velocity of the droplets for different cases. One of these cases is presented in Fig. 8. It shows that the droplet does not maintain a constant velocity while crossing the substrate along the gradient direction, but rather exhibits faster motion while on the softer part of the substrate. Individual trajectories, however, are seen to fluctuate strongly in their behavior in the course of the process. Overall, the existence of stiffness gradient in the substrate competes with thermal fluctuations, giving rise to a distorted translational movement of droplets to stiffer parts of the substrate. This conclusion is further corroborated by monitoring the velocity field of the droplet at various stages of durotaxis, where no particular pattern for the motion of the polymer chains in the droplet can be readily identified (Fig. 9). In fact, the droplet moves back and forth during durotaxis with the stiffness gradient determining the direction of the motion.
IV Concluding remarks
In this study, we have investigated the durotaxis of a droplet onto a substrate, characterized by stiffness gradient in one direction. We observe spontaneous directional movement of the drops from softer to more rigid parts of the substrate, whereby on substrates with equal mean stiffness, durotaxis becomes progressively enhanced upon increasing the stiffness gradient strength. Thereby the average speed of directional motion increases up to a limiting maximal value. Furthermore, at given stiffness gradient, droplets with better adhesion to the substrate exhibit as a rule essentially faster movement toward the rigid part of the substrate. The latter finding is corroborated by the fact, that smaller droplets are also observed to better wet the substrate Theodorakis et al. (2015), owing to a stronger interplay between contact line tension and surface tension of the vapor–polymer melt interface with decreasing size of the drop, exhibiting thus a more efficient durotaxis.
We interpret the observed motion of the droplet towards areas of larger stiffness of the substrate as manifestation of the tendency of the system to acquire energetically favorable states, where the droplet establishes a larger number of contacts between substrate and polymer beads, gaining thus van der Waals contact energy of the droplet particles interaction with the particles of the substrate, in agreement with previous work which considered the durotaxis motion of a flake on a graphene layer Chang et al. (2015). Our computer experiments demonstrate that this gain in contact energy increases with growing stiffness of the surface.
The present study explores the possibility of guided motion of droplets on variably stiff substrates with implications for nanofluidics, microfabrication, and coating. Our results establish the change in interfacial energy between droplet and substrate as the driving force for durotaxis, and we anticipate that this work will provide further insight into the mechanisms of nanoscale directional motion that has general implications in novel technologies and applications in biology and health care.
This research has been supported by the National Science Centre, Poland, under grant No. 2015/19/P/ST3/03541. This project has received funding from the European Union’s Horizon 2020 research and innovation programme under the Marie Skłodowska–Curie grant agreement No. 665778. This research was supported in part by PLGrid Infrastructure.
References
- Srinivasarao et al. (2001) M. Srinivasarao, D. Collings, A. Philips, and S. Patel, Science 292, 79 (2001).
- Chaudhury and Whitesides (1992) M. K. Chaudhury and G. M. Whitesides, Science 256, 1539 (1992).
- Wong et al. (2011) T.-S. Wong, S. H. Kang, S. K. Y. Tang, E. J. Smythe, B. D. Hatton, A. Grinthal, and J. Aizenberg, Nature 477, 443 (2011).
- Lagubeau et al. (2011) G. Lagubeau, M. Le Merrer, C. Clanet, and D. Quéré, Nat. Phys. 7, 395 (2011).
- Prakash et al. (2008) M. Prakash, D. Quéré, and J. W. Bush, Science 320, 931 (2008).
- Darhuber and Troian (2005) A. Darhuber and S. Troian, Annu. Rev. Fluid Mech. 37, 425 (2005).
- Gau et al. (1999) H. Gau, S. Herminghaus, P. Lenz, and R. Lipowsky, Science 283, 46 (1999).
- Sirringhaus et al. (2000) H. Sirringhaus, T. Kawase, R. H. Friend, T. Shimoda, M. Inbasekaran, W. Wu, and E. P. Woo, Science 290, 2123 (2000).
- Hanakata et al. (2015) P. Z. Hanakata, B. A. Pazmiño Betancourt, J. F. Douglas, and F. W. Starr, J. Chem. Phys. 142 (2015).
- Lafuma and Quéré (2003) A. Lafuma and D. Quéré, Nat. Mater. 2, 457 (2003).
- Courbin et al. (2007) L. Courbin, E. Denieul, E. Dressaire, M. Roper, A. Ajdari, and H. A. Stone, Nat. Mater. 6, 661 (2007).
- Tretyakov and Müller (2014) N. Tretyakov and M. Müller, Soft matter 10, 4373 (2014).
- Tretyakov and Müller (2013) N. Tretyakov and M. Müller, Soft Matter 9, 3613 (2013).
- Karapetsas et al. (2016) G. Karapetsas, N. T. Chamakos, and A. G. Papathanasiou, J. Phys.: Condens. Matter 28, 085101 (2016).
- Dundas et al. (2009) D. Dundas, E. J. McEniry, and T. N. Todorov, Nat. Nanotechnol. 4, 99 (2009).
- Regan et al. (2004) B. C. Regan, S. Aloni, R. O. Ritchie, U. Dahmen, and A. Zettl, Nature 428, 924 (2004).
- Zhao et al. (2010) J. Zhao, J.-Q. Huang, F. Wei, and J. Zhu, Nano Lett. 10, 4309 (2010).
- Kudernac et al. (2011) T. Kudernac, N. Ruangsupapichat, M. Parschau, B. Maciá, N. Katsonis, S. R. Harutyunyan, K.-H. Ernst, and B. L. Feringa, Nature 479, 208 (2011).
- Shklyaev et al. (2013) O. E. Shklyaev, E. Mockensturm, and V. H. Crespi, Phys. Rev. Lett. 110, 156803 (2013).
- Fennimore et al. (2003) A. M. Fennimore, T. D. Yuzvinsky, W.-Q. Han, M. S. Fuhrer, J. Cumings, and A. Zettl, Nature 424, 408 (2003).
- Bailey et al. (2008) S. W. D. Bailey, I. Amanatidis, and C. J. Lambert, Phys. Rev. Lett. 100, 256802 (2008).
- Barreiro et al. (2008) A. Barreiro, R. Rurali, E. R. Hernández, J. Moser, T. Pichler, L. Forró, and A. Bachtold, Science 320, 775 (2008).
- Somada et al. (2009) H. Somada, K. Hirahara, S. Akita, and Y. Nakayama, Nano Lett. 9, 62 (2009).
- Chang and Guo (2010) T. Chang and Z. Guo, Nano Lett. 10, 3490 (2010).
- Huang et al. (2014) Y. Huang, S. Zhu, and T. Li, Extreme Mechanics Letters 1, 83 (2014).
- van den Heuvel and Dekker (2007) M. G. L. van den Heuvel and C. Dekker, Science 317, 333 (2007).
- Ridley et al. (2003) A. J. Ridley, M. A. Schwartz, K. Burridge, R. A. Firtel, M. H. Ginsberg, G. Borisy, J. T. Parsons, and A. R. Horwitz, Science 302, 1704 (2003).
- Lo et al. (2000) C.-M. Lo, H.-B. Wang, M. Dembo, and Y.-L. Wang, Biophys. J. 79, 144 (2000).
- Style et al. (2013) R. W. Style, Y. Che, S. J. Park, B. M. Weon, J. H. Je, C. Hyland, G. K. German, M. P. Power, L. A. Wilen, J. S. Wettlaufer, et al., Proc. Natl. Acad. Sci. U.S.A. 110, 12541 (2013).
- Chang et al. (2015) T. Chang, H. Zhang, Z. Guo, X. Guo, and H. Gao, Phys. Rev. Lett. 114, 015504 (2015).
- Pham et al. (2016) J. T. Pham, L. Xue, A. Del Campo, and M. Salierno, Acta Biomaterialia 38, 106 (2016).
- Lazopoulos and Stamenović (2008) K. A. Lazopoulos and D. Stamenović, J. Biomech. 41, 1289 (2008), ISSN 00219290.
- Becton and Wang (2016) M. Becton and X. Wang, RSC Adv. 6, 51205 (2016).
- Barnard (2015) A. S. Barnard, Nature 519, 37 (2015), ISSN 0028-0836.
- Theodorakis et al. (2015) P. E. Theodorakis, E. A. Müller, R. V. Craster, and O. K. Matar, Soft Matter 11, 9254 (2015).
- Humphrey et al. (1996) W. Humphrey, A. Dalke, and K. Schulten, J. Mol. graph. 14, 33 (1996).
- Kremer and Grest (1990) K. Kremer and G. S. Grest, J. Chem. Phys. 92, 5057 (1990).
- Schneider and Stoll (1978) T. Schneider and E. Stoll, Phys. Rev. B 17, 1302 (1978).
- Plimpton (1995) S. Plimpton, J. Comp. Phys. 117, 1 (1995).
- Chen et al. (2017) S. Chen, B. Zhang, X. Gao, Z. Liu, and X. Zhang, Langmuir 33, 2472–2476 (2017).
- (41) qhull library used to determine the convex hull of the interfacial area, URL http://www.qhull.org.
- Milchev and Milchev (2001) A. I. Milchev and A. A. Milchev, Europhys. Lett. 56, 695 (2001).
- Gretz (1966) R. D. Gretz, The Journal of Chemical Physics 45, 3160 (1966).