Bilayer sheet protrusions and budding from bilayer membranes induced by hydrolysis and condensation reactions
Abstract
Shape transformations of flat bilayer membranes and vesicles induced by hydrolysis and condensation reactions of amphiphilic molecules are studied using coarse-grained molecular dynamics simulations. The hydrolysis and condensation reactions result in the formation and dissociation of amphiphilic molecules, respectively. Asymmetric reactions between the inner and outer leaflets of a vesicle can transport amphiphilic molecules between the leaflets. It is found that the resulting area difference between the two leaflets induces bilayer sheet protrusion (BP) and budding at low reduced volumes of the vesicles, whereas BP only occurs at high reduced volumes. The probabilities of these two types of transformations depend on the shear viscosity of the surrounding fluids compared to the membrane as well as the reaction rates. A higher surrounding fluid viscosity leads to more BP formation. The inhomogeneous spatial distribution of the hydrophobic reaction products forms the nuclei of BP formation, and faster diffusion of the products enhances BP formation. Our results suggest that adjustment of the viscosity is important to control membrane shape transformations in experiments.
pacs:
87.10.Tf,83.10.Rs,87.16.D-I Introduction
A lipid vesicle, which is one of the basic self-assembled structures of lipid molecules, has been studied as a minimum model of living cells. Although vesicles are composed of only lipid molecules, they exhibit various shape transformations such as discocyte, stomatocyte, and starfish depending on reduced volumes and spontaneous curvatures Seifert (1997). These various shape transformations can be well described using the elastic theory proposed by Helfrich Helfrich (1973); Seifert (1997). The theoretical prediction agrees well with experiments quantitatively Sakashita et al. (2012).
For the above-mentioned studies on vesicle morphology, it is assumed that the membrane composition is constant. However, in living cells, synthesis and decomposition of lipids continually occur by lipid metabolism so that the membrane composition changes. For example, phospholipids are synthesized from fatty acids on endoplasmic reticulum (ER) membrane Bell et al. (1981), after which these molecules are transported to other organelles via vesicle transport mechanisms. Another example is hydrolysis of phospholipids Nishizuka (1992, 1984). The reaction products, diacylglycerols (DAGs), play a key role in protein kinase C activation Bell (1986).
The effects of non-constant membrane composition on shape transformations of cells have been studied by several groups Allan et al. (1975, 1978); Ibarguren et al. (2013); Holopainen et al. (2000); Riske and Döbereiner (2003). The nature of non-constant membrane composition is often mimicked by hydrolysis and condensation reactions. For example, an injection of a hydrolase enzyme to red blood cells (RBCs) Allan et al. (1975, 1978) and lipid vesicles Ibarguren et al. (2013); Holopainen et al. (2000) hydrolyzes amphiphilic molecules into hydrophilic and hydrophobic molecules. In these chemical reactions, amphiphilic molecules, which are composed of hydrophilic (A) and hydrophobic (B) parts, change as follows:
| (1) |
where the right and left arrows represent the hydrolysis and condensation reactions, respectively. The experiments demonstrate that vesicles show the various shape transformations under these chemical reactions Allan et al. (1975, 1978); Ibarguren et al. (2013); Holopainen et al. (2000). The injection of hydrolase enzyme to RBCs and liposomes induces membrane invagination and rupture. Toyota et al. Toyota et al. (2006) reported that discocytes transform into tubular and invaginated shapes under the hydrolysis reaction of amphiphilic molecules.
A possible explanation of these morphological changes was proposed in terms of the area-difference-elasticity (ADE) model Allan et al. (1978). The hydrolase enzyme is injected from the outer solution so that the density of the amphiphilic molecules in the outer leaflet of a vesicle decreases, whereas the density of the inner leaflet is nearly constant. Therefore, the amphiphilic molecular densities in the inner and outer leaflets become different. To reduce the ADE energy Sheetz and Singer (1974); Seifert (1997) of this area difference, liposomes and RBCs form an invagination. A similar asymmetry in amphiphilic molecules that is induced by chemical reactions is widely observed in vitro Suzuki et al. (2009) and in vivo Bell et al. (1981).
However, in the previous works, the effects of the resulting products (A–H and B–OH molecules in eqn (1)) are not taken into account explicitly. Instead, the effect of these chemical reactions is taken into account implicitly by the change in the amphiphilic molecular densities of the inner and outer leaflets in the ADE model. The resulting hydrophobic molecules (B–OH) are included in the bilayer membrane, and such inclusions modify the elastic properties of the bilayer Ly and Longo (2004). We have previously examined how such inclusions affect shape transformations from an oil droplet to a bilayer membrane by a binding reaction of hydrophobic and hydrophilic molecules Nakagawa and Noguchi (2015). Tubular vesicles form via bicelles. The inclusions are concentrated in the branches of the membranes. The stabilization of branched structures by inclusions was also reported in Refs. Das and Rand (1986); Basanez et al. (1997). Thus, shape transformations of membranes occur due to the presence of the resulting hydrophobic molecules, but these shape transformations are not fully understood.
The aim of this paper is to clarify the effect of embedded hydrophobic products on shape transformations under the hydrolysis and condensation reactions. We use the coarse-grained molecular dynamics simulation technique, in which the hydrolysis and condensation reaction processes of amphiphilic molecules are taken into account explicitly. We will show that the shape transformation strongly depends on the distribution of the resulting products (B–OH) included in the bilayer. We will also show that not only membrane invagination but also bilayer sheet formation occur depending on the reduced volume. The shape transformation pathway is also affected by the transport coefficients of the surrounding fluids and membrane.
II Simulation methods
II.1 Model and method
We use the dissipative particle dynamics (DPD) simulation technique Groot and Warren (1997); Hoogerbrugge and Koelman (1992); Groot and Rabone (2001). In the DPD method, the particle motion is given by the following Newton’s equations with a pairwise Langevin thermostat:
| (2) | ||||
with
| (3) | ||||
| (4) |
where , and is the unit step function. A harmonic potential is used for the repulsive potential, i.e., , which vanishes at the finite cutoff . The Gaussian white noise satisfies the fluctuation and dissipation theorem, i.e., , where is the thermal energy. An amphiphilic molecule consists of hydrophilic head and hydrophobic tail segments that are represented by one and three particles, respectively. These four particles are connected via the bond potential and the angle potential with , , and .
Many DPD simulations Groot and Warren (1997); Venturoli et al. (2006) are carried out with in eqn (4) to reduce computational costs, but a liquid phase (Schmidt number ) is not obtained without increasing up to 50 Noguchi and Gompper (2007). Instead, we choose to increase the shear viscosity of the DPD fluids Fan et al. (2006). We use the Shaldrow S1 splitting algorithm Shardlow (2003) to discretize eqn (2). The multi-time-step algorithm Peters (2004); Tuckerman et al. (1992); Noguchi and Gompper (2007) is employed with the integration time step for the conservative forces and for dissipation and random forces.
The repulsive parameters are listed in Table 1. The dissipative parameters for the same type of particle pairs are shown in Section III. For different types of particle pairs, a harmonic mean rule is employed, i.e., , to ensure the correct hydrodynamic behavior for the multi-viscosity system Visser et al. (2006). A stable bilayer structure forms with bending rigidity and area expansion modulus . These elastic properties agree well with the experimental results at room temperature Seifert (1997); Boal (2012).
| W | H | T | |
|---|---|---|---|
| W | 25 | 25 | 200 |
| H | 25 | 25 | 200 |
| T | 200 | 200 | 25 |
We use reduced units with as the unit of length, as the unit of energy, and as the unit of mass. is the length scale of the molecule, nm, and is estimated to be 1 ns at room temperature K. Dimensionless quantities are denoted by ∗, e.g., .
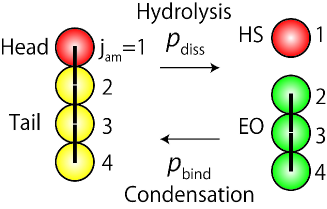
Several chemical reaction models combined with the DPD method have been proposed Lísal et al. (2006, 2009); Huang et al. (2016); Nakagawa and Noguchi (2015). In this work, we use the chemical reaction model, in which hydrolysis and condensation reactions of amphiphilic molecules are represented by a bond dissociation and bond binding as shown in Fig. 1. Because the dissociated hydrophilic and hydrophobic molecules are typically dissolved in surrounding fluids and embedded in the bilayer, we refer to them as the hydrophilic solute (HS) and embedded oil (EO), respectively. The HS can have a binding reaction to only the one end particle of the EO ( shown in Fig. 1). Both binding and dissociation processes are treated as stochastic processes, as in the polymerization model Huang et al. (2016). Probabilities for the bond binding and dissociation during are given by
| (5) | ||||
| (6) |
where and denote the transition rates of the dissociation and binding reactions, respectively. is the number of water particles that exist in a sphere with a radius of around a hydrophobic particle of connecting with a hydrophilic particle. The hydrophobic particles of in the EO bind with the closest HS by the reaction rate when the distances between the two particles are less than the cutoff length . In this study, is used. The bond dissociation probability relatively increases when the HS concentration is low. When the bond binding rate is equal to the bond dissociation rate, the system reaches chemical equilibrium.
We investigate the effects of the viscosity of the surrounding solutions and the effective viscosity in the membrane. The viscosity of the surrounding fluids can be controlled by . The shear viscosity of the DPD fluids increases with increasing . The shear viscosity is estimated from a simple shear flow for the DPD fluid consisting of only W particles Noguchi and Gompper (2007): and 0.007 for and , respectively. The diffusion constants of the DPD fluids are estimated from the mean square displacement: and for and , respectively. To change the effective viscosity in the membrane, we vary of the tail and EO particles: and . Thus, the DPD fluids consisting of nonbonded tail particles have and . However, the bond and angle potentials in the amphiphilic molecules modify this simple linear viscosity. In the bilayer membranes, the amphiphilic molecules in the membrane have two types of hydrodynamic interactions: lateral interactions that give rise to 2D membrane viscosity and the friction between two leaflets Seifert (1997); den Otter and Shkulipa (2007); Shkulipa et al. (2005). A greater value of yields a higher 2D viscosity and stronger friction. However, because the EOs in the bilayer modify both the interactions, it is difficult to quantitatively estimate them. Therefore, we consider only the qualitative effects of the membrane viscosity using the viscosity of the DPD fluid, in this study.
II.2 Simulation settings
All simulations are carried out in an ensemble (constant number of particles, volume , and temperature ) at the particle density . The cubic simulation boxes with and are used for a flat membrane and vesicle, respectively.
We prepare a flat bilayer membrane with and . The bounce-back rule is employed at the boundary of the simulation box along the normal () direction to the bilayer, and periodic boundary conditions are employed in the lateral () directions. Initially, the HS concentrations of the fluids above and below the membrane are and , respectively. Since these two fluids do not contact each other directly, their HS concentrations are changed only by the reactions on the membrane.
To investigate the spatial distribution of the EOs in the membrane in the absence of the chemical reactions, a flat membrane with and is used. The EOs are distributed uniformly in the bilayer membrane as initial conformations, and the positions of the EOs are fixed for the first to make the amphiphilic molecules relax first. The position constraint of the EOs is removed at . The surface density is calculated with a spatial mesh size of .
We consider initially a nearly spherical vesicle and a discocyte-shaped vesicle under periodic boundary conditions in all three directions. The spherical vesicle is formed by of amphiphilic molecules, and particles are inside the vesicle. The discocyte has and . The reduced volumes for the spherical vesicle and discocyte are nearly equal to 1 and 0.5, respectively, where and are the volume and surface area of the membrane. Initial vesicles are prepared using the methods described in Appendix A. The simulation time is set to zero when the chemical reactions start.
In the experimental studies Allan et al. (1975, 1978); Ibarguren et al. (2013); Holopainen et al. (2000) shown in Section 1, the chemical environment is different inside and outside a vesicle. As a model of such asymmetric situations, we consider the vesicle whose inner and outer solutions have different concentrations of HSs. One may consider that the asymmetric concentration along the bilayer membrane causes the osmotic pressure difference. However, the time scale of the volume change due to the osmotic pressure difference is much longer than the shape transformation timescale. We will show how the shape transformation of vesicles under the hydrolysis and condensation reactions is changed by the concentration difference of HSs. The initial concentration of HSs outside the vesicle is set to 0. The initial concentration of HSs inside the vesicle is varied to control the concentration difference.
III Simulation results
III.1 Bilayer sheet protrusion from flat membrane
First, we consider the shape transformations of the flat membrane by chemical reactions (see Fig. 2). The HS concentration difference causes different time developments of the number of amphiphilic molecules between the upper and lower leaflets as shown in Fig. 2(d): the number of amphiphilic molecules () of the upper (lower) leaflet increases (decreases). On the lower leaflet, the condensation reaction is very slow owing to the low HS concentration of the lower solution, with the result that the hydrolysis reaction largely proceeds. The EOs are then produced at the lower leaflet and embedded in the bilayer membrane, as indicated by the green color in Fig. 2(a). On the other hand, the condensation reaction largely proceeds on the upper leaflet owing to the high HS concentration of the upper solution, with the result that amphiphilic molecules are synthesized in the upper leaflet.
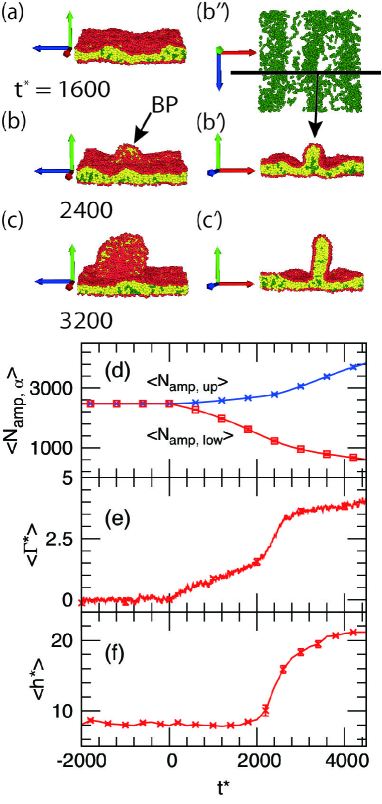
The resulting asymmetric distribution of amphiphilic molecules produces a negative surface tension in the upper leaflet and a positive surface tension in the lower leaflet, so that the upper (lower) leaflet is compressed (expanded). This compression induces a large undulation of the upper leaflet. Figures 2(e) and (f) show the time development of the surface tension of the bilayer and maximum height of the membrane. The surface tension (mechanical frame tension) is estimated as from the stress tensor Venturoli et al. (2006). Note that is the sum of two surface tensions: the surface tension of the upper leaflet and the surface tension of the lower leaflet. Since the hydrolysis reaction is faster than the condensation reaction, has a greater slope than , and the total surface tension then increases (see the data at in Figs. 2(d) and (e)). A further increase in the surface tension induces the buckling of the upper leaflet into the protrusion of a bilayer sheet (indicated by arrows in Fig. 2(b)). We hereafter refer to this deformation as bilayer protrusion (BP) formation. The edge of the BP is tongue-shaped owing to the edge line tension. Because the line tension of the branching junction between the BP and the bilayer is low in the high-EO-density area, the BP grows in the high-EO-density area as shown in Figs. 2(b’) and (b”). The surface tension and maximum height of the membrane rapidly increase during BP formation at (see Figs. 2(e) and (f)). The BP releases the compressive (negative) surface tension in the upper leaflet, which increases .
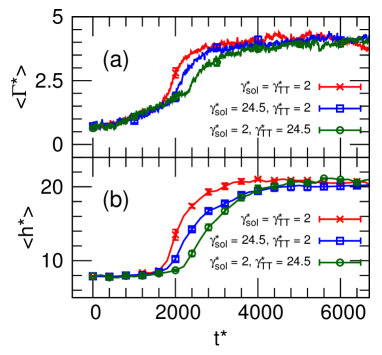
To investigate the effects of the viscosities of the surrounding fluids and membrane on the stress relaxation timescales of BP formation, we started simulations with different and values from membranes equilibrated at the EO ratio by stopping the chemical reactions. When the viscosity of the surrounding fluids and the effective membrane viscosity are increased roughly fivefold by changing and , BP formation is delayed by and , respectively (see Fig. 3). This larger delay shows that the viscosity in the membrane has a stronger influence on BP formation.
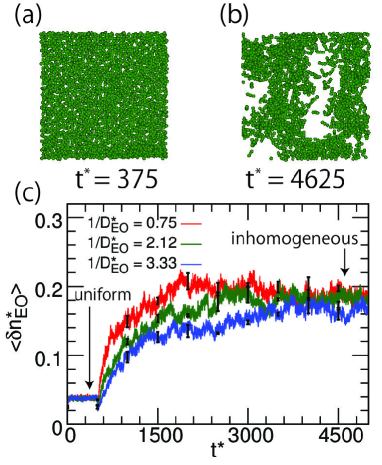
In our simulation, the EOs are inhomogeneously distributed in the membrane. To clarify whether this EO inhomogeneity is generated thermodynamically or kinetically, we simulate the equilibrium flat membrane in the absence of chemical reactions. Figure 4 shows the time development of the surface density inhomogeneity of the EOs. The distribution of the EOs becomes inhomogeneous even if their initial distribution is uniform. The EOs self-assemble into several clusters in the bilayer membrane (see Fig. 4(b)). Thus, this inhomogeneity exists in thermal equilibrium. The relaxation time from uniform to nonuniform spatial EO distributions depends on the diffusion constant of the EOs. Under faster EO diffusion, reaches equilibrium more rapidly (see Fig. 4(c)). This inhomogeneous nature is related to the orientational order of the bilayer membranes Nakagawa and Noguchi (2015). The orientational order of amphiphilic molecules is disturbed by the contacted EOs.
III.2 Morphological changes at
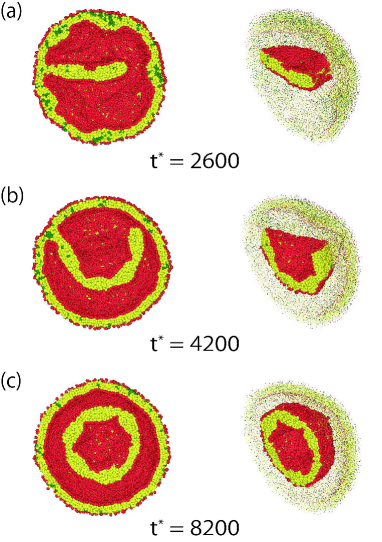
Next, we consider the shape transformations of a vesicle at and (see Fig. 5). This concentration difference causes the transport of amphiphilic molecules from the outer leaflet to the inner leaflet as in the flat membrane (see Fig. 5(e)).
We estimate the surface tension of the inner leaflet in the following manner. Since vesicles before shape transformations are nearly spherical because , the surface tension of the inner leaflet is approximately estimated as
| (7) |
where is the area per lipid molecule in the tensionless membrane, is the radius of the vesicle, and is the distance between the inner leaflet neutral surface and the bilayer mid-plane. The negative surface tension of induces the buckling of the inner leaflet, leading to the formation of multiple BPs (indicated by arrows in Fig. 5(c)). This BP formation process can be captured by the time development of the standard deviation of the bilayer thickness (the calculation method is described in Appendix B) as shown in Fig. 5(g). During the undulation, gradually increases, and after the buckling starts, rapidly increases at .
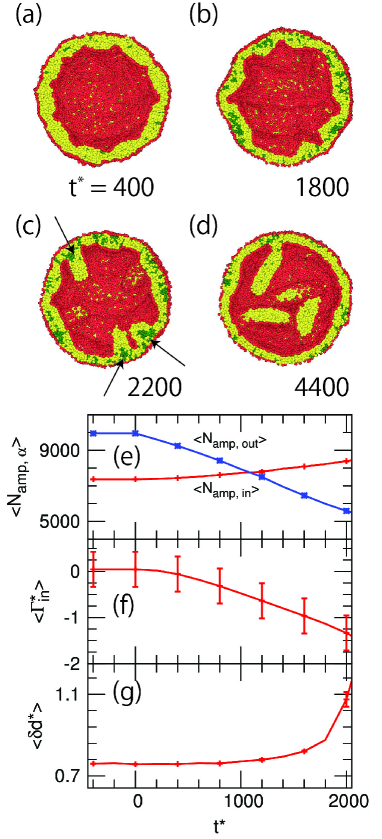
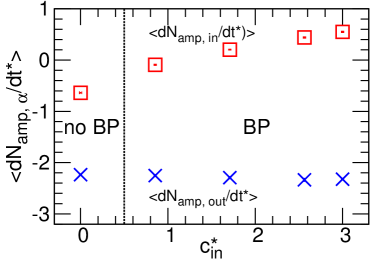
BP formation depends on the initial HS concentration inside the vesicle as shown in Fig. 6. As increases, the reaction rate increases, whereas shows little dependence. BP formation becomes faster with increasing as a result of the increase in . BP formation occurs everywhere except at . Thus, the synthesis of amphiphilic molecules and the resulting negative surface tension of the inner leaflet are necessary for BP formation.
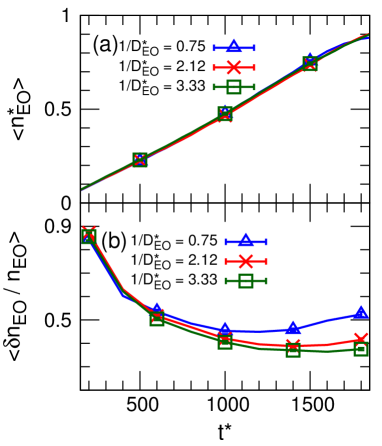
As shown in the flat membrane simulation in Section III.1, the BPs protrude from the EO clusters (Figs. 2 (b’) and (b”)). Thus, these clusters accelerate BP formation. Hence, we next examine the spatial inhomogeneity of the EOs in the bilayer membrane and its relation with BP formation. The spatial inhomogeneity of the EOs is determined by two processes: the synthesis and diffusion of the EOs. The synthesis of the EOs occurs uniformly on the outer leaflet, leading to a homogeneous EO distribution. The characteristic timescale of this process is the reciprocal of the EO synthesis speed. On the other hand, the EOs in the bilayer membrane self-assemble into several clusters, and thus the spatial distribution of the EOs becomes inhomogeneous as discussed in the case of the flat membrane. This characteristic timescale of the EO assembly into clusters decreases (increases) for faster (slower) diffusion of the EOs. The relationship between these two timescales and affects the inhomogeneity of the EOs. When , the EOs self-assemble into clusters rapidly, but otherwise they remain close to the uniform distribution. We confirm this tendency by simulations in which is varied by changing the diffusion constant of the EOs. Figures 7(a) and (b) show the time development of the mean surface density of the EOs and its inhomogeneity , which is defined as the standard deviation of the surface density of the EOs, for different values. The EO density is calculated by using a bin of solid angle in the spherical vesicle. The time development of is not affected by the change in , as shown in Fig. 7(a), so that does not depend on . On the other hand, the time development of clearly depends on at the late stage . In the beginning of the chemical reaction (at in Fig. 7(b)), the spatial inhomogeneity, , decreases as the EOs are synthesized. For fast diffusion , the EOs form clusters, and increases at . Thus, is satisfied. However, for slow diffusion, and , the EOs are uniformly distributed even at , and the cluster formation occurs at later stages.
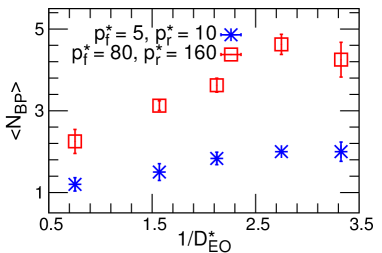
More BPs form at slower diffusion and faster reactions as shown in Fig. 8. At small values of the diffusion constant , slower EO cluster formation delays BP formation. Since the synthesis rate of EOs does not depend on the as shown in Fig. 7 (a), the number of EOs at the BP formation increases at lower . At high reaction rates and , the surface tension decreases more rapidly. In both cases, at BP formation, the larger number of EO clusters exist in the bilayer membrane, and the membrane is under a greater compressive tension. This leads to the formation of more BPs at the same time instead of a single large BP.
After the BP formation, the BP bends and subsequently transforms into a spherical vesicle as shown in Fig. 9 for small number of BPs. Since the initial shape of the BP is a nearly flat disk, this shape transformation can be understood as the shape transformation from a flat bilayer disk to a spherical vesicle. This type of shape transformation is described by the theory by Fromherz Fromherz (1983). Large flat bilayer disks are energetically unstable at , where , , and are the edge line tension, area, and saddle-splay modulus of the membrane, respectively. Therefore, the sufficiently grown flat BP spontaneously transforms into the spherical vesicle. At a large number of BPs, the contacts between the BPs prevent the shape transformation to the spherical shapes; thus the BPs remain flat.
III.3 Morphological changes at
Next, we consider the shape transformations at a low reduced volume, . The initial shape is discocyte (see Fig. 10(a)). The same settings as in Section III.2 are considered: the HS concentration is different inside and outside the vesicle. Thus, the hydrolysis and condensation reactions mainly occur on the outer and inner leaflets, respectively.
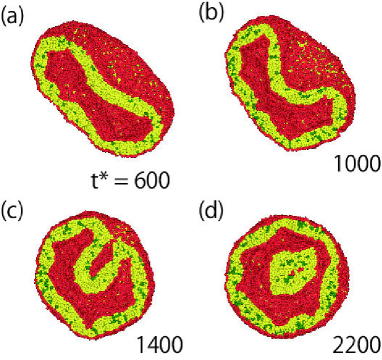
For the low reduced volume, large low-wavelength fluctuations of the bilayer are permitted unlike for , leading to a different type of shape transformation, budding into a stomatocyte. Figure 10 shows the typical shape transformation. As the hydrolysis and condensation reactions proceed, a dimple invagination forms (Fig. 10(b)), and eventually the discocyte transforms into a stomatocyte (see Figs. 10(c) and (d)). A decrease and increase in the amphiphilic molecular densities of the outer and inner leaflets, respectively, cause an effective negative spontaneous curvature according to the ADE model so that the inner bud is stabilized. After the budding, a further increase of amphiphilic molecular density of the inner leaflet causes BP formation, as in the case.
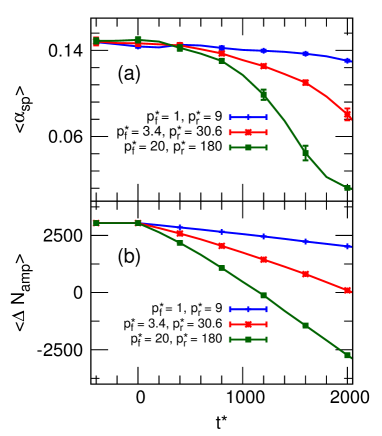
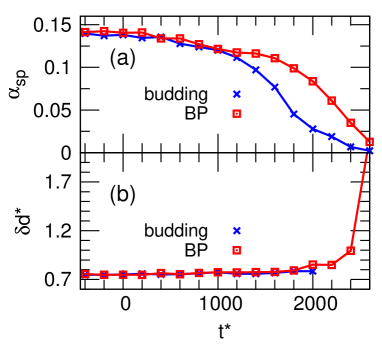
In order to clarify the relationship between shape transformations and chemical reactions, we calculate the time development of the asphericity Theodorou and Suter (1985) (Fig. 11(a)), and the amphiphilic molecular number difference, between the inner and outer leaflets (Fig. 11(b)). The asphericity is the degree of deviation from a spherical shape and is defined as , where , , and are the eigenvalues of the gyration tensor of the vesicle. It can distinguish the stomatocyte () and the discocyte () Noguchi and Gompper (2005). When the chemical reaction process speeds up by increasing and , the shape transformation also speeds up (from to in Fig. 11(a)). As the chemical reactions proceed, linearly decreases in time, but nonlinearly decreases. This rapid change corresponds to the shape transformation from the discocyte to the stomatocyte.
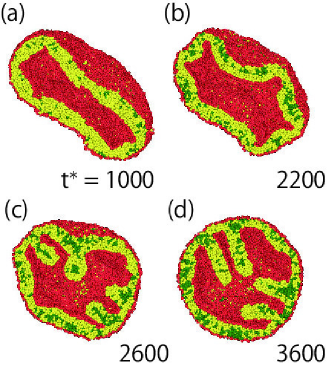
Interestingly, BP formation without budding occurs when the viscosity is increased (see Fig. 12). Initially, the bilayer bends inward (Fig. 12(b)) as in the budding, but these invaginations transform into BPs (Figs. 12(c) and (d)).
In order to distinguish the two types of shape transformations (budding (Fig. 10) and BP formation without budding (Fig. 12)), we calculate the bilayer thickness inhomogeneous during shape transformation from to (see Fig. 13). For BP formation, is diverged when changes from 0.14 to 0.025. For bud formation, is not diverged. We set as the threshold value to determine the divergence of the thickness inhomogeneity . When is satisfied from to , this shape transformation is regarded as BP formation.
Using this threshold of , we construct the dynamic phase diagram of the shape transformations as shown in Fig. 14 for different values. At each data point, we carry out eight independent runs. If the number of BP transformations without budding is more than four at one point, the shape transformation is regarded as BP formation without budding.
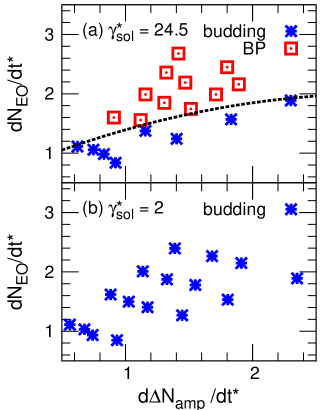
The shape transformation pathway depends on not only but also on as shown in Fig. 14(a). As mentioned in Section III.2, BP formation is strongly affected by the spatial distribution of the EOs. If the EOs are not sufficiently synthesized, the resulting shape transformations are budding (low in Fig. 14(a)) because a few EOs do not form clusters in the bilayer. When the EO synthesis rate increases, the EOs self-assemble into clusters in the bilayer, so that BP formation occurs. Thus, EO synthesis dramatically affects the resulting shape transformation.
However, at low viscosity , BP without budding does not occur, as shown in Fig. 14(b). In this case, the bud formation timescale is shorter than the timescale of the EO cluster formation. The area compressive stress caused by the chemical reactions is released via bud formation before BP formation starts. As pointed out by Sens Sens (2004), the surrounding solution that has high viscosity suppresses bud formation. This suppression of bud formation enhances BP formation. As mentioned in Section III.1, BP formation is more slowed by the membrane viscosity. Thus, compared to budding, BP formation more frequently occurs at low membrane viscosity and high solution viscosity .
IV Discussions and Conclusion
In this paper, we have shown the membrane shape transformations induced by hydrolysis and condensation reactions. We use the coarse-grained molecular simulation technique in which the hydrolysis and condensation reactions are taken into account explicitly by the bond dissociation and binding. The asymmetric chemical conditions, which are widely observed both in vitro and in vivo, cause the transport of amphiphiles between outer and inner leaflets leading to the BP formations. The growth process of BPs strongly depends on the EO density inhomogeneity that is determined by the competition between two different dynamics: diffusion of EOs and synthesis of EOs. At the faster EO diffusion compared to the EO synthesis, fewer BPs form. At a low reduced volume, budding transformation also occurs. The shape transformation pathway is affected by the EO synthesis rate and the shear viscosity of the surrounding solution. By increasing the solution viscosity while keeping the membrane viscosity constant, bud formation is suppressed so that BP formation is enhanced. In the budding, the membrane mainly moves normal to the membrane surface, but sliding between two leaflets occurs in BP formation. Thus, the viscosity of the surrounding fluids affects budding more than it does BP formation, while the viscosity in the membrane affects BP formation more.
Since the BPs transform into small spherical vesicles, it may be difficult to distinguish them from the buds formed by the budding process by optical microscopy. However, the inside of the small vesicles is filled with the solution originally inside of the vesicles, while the inside of the buds is filled with the outer solution. Thus, it can be experimentally identified by labeling the inner or outer solution.
Similar shape transformations in BP formation are observed in the Langmuir monolayer in both experiments Lu et al. (2002); Lee (2008) and simulations Baoukina et al. (2008). The compression leads to a collapse of the Langmuir monolayer into a bilayer sheet. The formed bilayer sheet finally transforms into the spherical vesicle Baoukina et al. (2008); Gopal and Lee (2001), which is also similar to the shape transformation in our simulations. Other experiments, in which bilayer vesicles are composed of SOPC (1-stearoyl-2-oleoyl-sn-glycero-3-phosphocholine), C16:0-SM (N-palmitoyl-sphingomyelin), and Bodipy-sphingomyelin (a fluorescent tracer), show the invagination of vesicles under the injection of the enzyme sphingomyelinase Holopainen et al. (2000). Ceramide, which is produced by the hydrolysis of SM, segregates into a domain in the membrane and causes the invagination of vesicle. We expect that such a domain helps BP formation in the inner leaflet of the vesicles.
Our results show that the relative viscosity ratio of the membrane and surrounding fluids is significant in determining budding or BP formation. We believe that two competing shape transformations accompanied by lateral and normal membrane motions are generally controlled by the viscosity ratio; the former and latter dynamics are slowed down by increases in viscosities of membrane and surrounding fluids, respectively. Fournier et al. Fournier et al. (2009) reported that higher friction between two leaflets slows down membrane tubulation. Thus, we expect a similar tendency in budding and tubulation. Recently, Fujiwara and Yanagisawa Fujiwara and Yanagisawa (2014); Fujiwara and Yanagisawa (2017) reported that vesicles containing high concentrations of macromolecules undergo bud or tube formation depending on the viscosity of the inner solution; the membrane tube formation appears at the high viscosity, otherwise, bud formation appears. The slow elastic relaxation due to the high viscosity suppresses the bud formations, and enhances the tube formations. We consider that the viscosity ratio of membrane and surrounding fluids is also important in their experiments as well as the viscosity ratio of the inner and outer fluids.
Although we focused on the effects of the viscosity ratio here, the static membrane properties, bending rigidity and edge line tension, also modify the shape transformations. Large bending rigidity and/or small edge tension suppress the transition from the BP to the spherical vesicle. Small edge tension likely also enhances the BP formation owing to the reduction of the nucleation energy. The bending rigidity can be reduced by EOs Nakagawa and Noguchi (2015), and the edge tension can be reduced by the addition of cone-shape surfactant molecules.
In living cells, lipid droplets are formed on the ER membrane Bell et al. (1981). The hydrophilic segments of the lipids are removed by chemical reactions. These reactions are similar to the hydrolysis reaction in our simulation. The resulting hydrolyzed hydrophobic molecules assemble into clusters in the bilayer membrane. We expect that a similar cluster formation plays a role in the initial lipid droplet formation.
In this work, the rupture of the vesicles is not observed due to the high edge line tension of the bilayer. However, in the experiments conducted by Riske et al. Riske and Döbereiner (2003), the rupture of liposomes occurs as a result of the injection of hydrolase enzyme. The coupling of the asymmetrical amphiphilic molecular density and membrane rupture causes the inside-out inversion Nomura et al. (2001). Under low edge tension, competition between ruptures and BP formation may occur.
Here, we only consider amphiphilic molecules that form the bilayer. Chemical reactions can change the shape of amphiphilic molecules from cylinder to cone or inverted-cone shapes. In the experiments by Suzuki et al. Suzuki et al. (2009), the molecular assembly changes their shapes from tubular micelles to vesicles. In the future, it will be interesting to investigate the molecular mechanism of these shape transformations involving non-bilayer structures.
Acknowledgements.
We would like to thank to K. Suzuki, T. Toyota, T. Sugawara, G. Gommper, and R. Hornung for helpful discussions. This work was supported by JSPS KAKENHI Grant Number JP25103010 and JP16J01728. The numerical calculations were partly carried out by SGI Altix ICE XA at ISSP Supercomputer Center, University of Tokyo.Appendix A Preparation of vesicles
We prepare the spherical vesicles in the following manner. First, a spherical-cap-shaped bilayer membrane is centered in the simulation box, and then the system is equilibrated during . A closed spherical membrane is thus obtained. Some water particles inside the vesicle are then ejected to tune the reduced volume . After that, the system is equilibrated for . For these system equilibrations, we use to speed up the equilibration processes. The system is then again equilibrated for using the same setting as for the production runs. After the above-mentioned equilibration processes, we turn on the chemical reactions.
Appendix B Calculation of thickness of vesicles
We calculate the bilayer thickness of vesicles from the two layers of the hydrophilic particles. First, we extract the positions of hydrophilic particles in the bilayer membrane. Next, we carry out a clustering analysis using depth-first search with search radius . Two sets (clusters) of hydrophilic particles are obtained in most cases before the large shape deformations: One is the head-group of the inner leaflet, and the other is the head-group of the outer leaflet. We define the local bilayer thickness as
| (8) |
where and are the sets of hydrophilic particles in the inner and outer leaflets, respectively. The membrane thickness is defined as the mean value of . The thickness inhomogeneity defined as
| (9) |
where is the number of particles included in the inner leaflet.
References
- Seifert (1997) U. Seifert, Adv. Phys. 46, 13 (1997).
- Helfrich (1973) W. Helfrich, Z. Naturforschung. 28, 693 (1973).
- Sakashita et al. (2012) A. Sakashita, N. Urakami, P. Ziherl, and M. Imai, Soft Matter 8, 8569 (2012).
- Bell et al. (1981) R. M. Bell, L. M. Ballas, and R. A. Coleman, J. Lipid Res. 22, 391 (1981).
- Nishizuka (1992) Y. Nishizuka, Science 258, 607 (1992).
- Nishizuka (1984) Y. Nishizuka, Nature 308, 693 (1984).
- Bell (1986) R. M. Bell, Cell 45, 631 (1986).
- Allan et al. (1975) D. Allan, M. G. Low, J. B. Finean, and R. H. Michell, Biochim. Biophys. Acta 413, 309 (1975).
- Allan et al. (1978) D. Allan, P. Thomas, and R. H. Michell, Nature 276, 289 (1978).
- Ibarguren et al. (2013) M. Ibarguren, J. Sot, L.-R. Montes, A. I. Vasil, M. L. Vasil, F. M. Goñi, and A. Alonso, Chem. Phys. Lipids 166, 12 (2013).
- Holopainen et al. (2000) J. M. Holopainen, M. I. Angelova, and P. K. J. Kinnunen, Biophys. J. 78, 830 (2000).
- Riske and Döbereiner (2003) K. A. Riske and H.-G. Döbereiner, Biophys. J. 85, 2351 (2003).
- Toyota et al. (2006) T. Toyota, K. Takakura, J. Kose, and T. Sugawara, ChemPhysChem 7, 1425 (2006).
- Sheetz and Singer (1974) M. P. Sheetz and S. J. Singer, Proc. Natl. Acad. Sci. 71, 4457 (1974).
- Suzuki et al. (2009) K. Suzuki, T. Toyota, K. Takakura, and T. Sugawara, Chem. Lett. 38, 1010 (2009).
- Ly and Longo (2004) H. V. Ly and M. L. Longo, Biophys. J. 87, 1013 (2004).
- Nakagawa and Noguchi (2015) K. M. Nakagawa and H. Noguchi, Soft Matter 11, 1403 (2015).
- Das and Rand (1986) S. Das and R. P. Rand, Biochemistry 25, 2882 (1986).
- Basanez et al. (1997) G. Basanez, M. B. Ruiz-Argüello, A. Alonso, F. M. Goni, G. Karlsson, and K. Edwards, Biophys. J. 72, 2630 (1997).
- Groot and Warren (1997) R. D. Groot and P. B. Warren, J. Chem. Phys. 107, 4423 (1997).
- Hoogerbrugge and Koelman (1992) P. J. Hoogerbrugge and J. M. V. A. Koelman, Europhys. Lett. 19, 155 (1992).
- Groot and Rabone (2001) R. D. Groot and K. L. Rabone, Biophys. J. 81, 725 (2001).
- Venturoli et al. (2006) M. Venturoli, M. M. Sperotto, M. Kranenburg, and B. Smit, Phys. Rep. 437, 1 (2006).
- Noguchi and Gompper (2007) H. Noguchi and G. Gompper, Europhys. Lett. 79, 36002 (2007).
- Fan et al. (2006) X. Fan, N. Phan-Thien, S. Chen, X. Wu, and T. Y. Ng, Phys. Fluids 18, 063102 (2006).
- Shardlow (2003) T. Shardlow, SIAM J. Sci. Comput. 24, 1267 (2003).
- Peters (2004) E. A. J. F. Peters, Europhys. Lett. 66, 311 (2004).
- Tuckerman et al. (1992) M. Tuckerman, B. J. Berne, and G. J. Martyna, J. Chem. Phys. 97, 1990 (1992).
- Visser et al. (2006) D. C. Visser, H. C. J. Hoefsloot, and P. D. Iedema, J. Comput. Phys. 214, 491 (2006).
- Boal (2012) D. Boal, Mechanics of the Cell (Cambridge University Press, 2012).
- Lísal et al. (2006) M. Lísal, J. K. Brennan, and W. R. Smith, J. Chem. Phys. 125, 164905 (2006).
- Lísal et al. (2009) M. Lísal, J. K. Brennan, and W. R. Smith, J. Chem. Phys. 130, 104902 (2009).
- Huang et al. (2016) F. Huang, Y. Lv, L. Wang, P. Xu, J. Lin, and S. Lin, Soft Matter 12, 6422 (2016).
- den Otter and Shkulipa (2007) W. K. den Otter and S. A. Shkulipa, Biophys. J. 93, 423 (2007).
- Shkulipa et al. (2005) S. A. Shkulipa, W. K. den Otter, and W. J. Briels, Biophys. J. 89, 823 (2005).
- Fromherz (1983) P. Fromherz, Chem. Phys. Lett. 94, 259 (1983).
- Theodorou and Suter (1985) D. N. Theodorou and U. W. Suter, Macromolecules 18, 1206 (1985).
- Noguchi and Gompper (2005) H. Noguchi and G. Gompper, Phys. Rev. E 72, 011901 (2005).
- Sens (2004) P. Sens, Phys. Rev. Lett. 93, 108103 (2004).
- Lu et al. (2002) W. Lu, C. M. Knobler, R. F. Bruinsma, M. Twardos, and M. Dennin, Phys. Rev. Lett. 89, 146107 (2002).
- Lee (2008) K. Y. C. Lee, Annu. Rev. Phys. Chem. 59, 771 (2008).
- Baoukina et al. (2008) S. Baoukina, L. Monticelli, H. J. Risselada, S. J. Marrink, and D. P. Tieleman, Proc. Natl. Acad. Sci. U. S. A. 105, 10803 (2008).
- Gopal and Lee (2001) A. Gopal and K. Y. C. Lee, J. Phys. Chem. B 105, 10348 (2001).
- Fournier et al. (2009) J.-B. Fournier, N. Khalifat, N. Puff, and M. I. Angelova, Phys. Rev. Lett. 102, 01802 (2009).
- Fujiwara and Yanagisawa (2014) K. Fujiwara and M. Yanagisawa, ACS Synth. Biol. 3, 870 (2014).
- Fujiwara and Yanagisawa (2017) K. Fujiwara and M. Yanagisawa, Soft Matter 13, 9192 (2017).
- Nomura et al. (2001) F. Nomura, M. Nagata, T. Inaba, H. Hiramatsu, H. Hotani, and K. Takiguchi, Proc. Natl. Acad. Sci. U.S.A. 98, 2340 (2001).