Role of the global water ocean on the evolution of Titan’s primitive atmosphere
Abstract
During the accretion of Titan, impact heating may have been sufficient to allow the global melting of water ice and the release of volatile compounds, mainly constituted of CO2, CH4 and NH3. The duration and efficiency of exchange between the primitive massive atmosphere and the global impact-induced water ocean likely play a key role in the chemical evolution of the early Titan’s atmosphere. To investigate the atmospheric composition of early Titan for a wide range of global (atmosphere + ocean) composition in volatils, we first developed a gas-liquid equilibrium model of the NH3-CO2-H2O system, where the non-ideal behavior of both gas and liquid phases, and the speciation of volatiles dissolved in the aqueous phase are taken into account. We show that the relative abundance of CO2 and NH3 determine the composition of Titan’s atmosphere. For CO2/NH , CO2 is massively dissolved in the ocean. On the contrary, for CO2/NH, CO2 is the main constituent of Titan’s primitive atmosphere while the NH3 atmospheric content is dramatically decreased. We then investigate the conditions for the formation of CH4-rich clathrates hydrates at Titan’s surface that could be the main reservoir of methane for the present-day atmosphere. In absence of reliable experimental data in the CH4-CO2-NH3-H2O system, the dissolution of methane in water is included using a simplified Henry’s law approach. We find that if the concentration of CH4 in Titan’s building block was higher than 0.1 mol.kg-1 and CO2/NH, a large fraction of methane may be stored in the primordial crust, which would form at temperature below 10∘C.
keywords:
Abundances, atmospheres; Titan, atmosphere; Atmospheres, composition1 Introduction
Titan is the only satellite in the Solar System to possess a massive atmosphere that is mainly composed of N2 (98%) and CH4 (2%) [e.g. Niemann et al., 2010, Griffith et al., 2013]. Thanks to the Cassini-Huygens mission, the atmosphere of Titan has now been extensively studied. Still, the origin of this atmosphere is highly debated. Ammonia has long been advocated as the primordial source of nitrogen on Titan [Atreya et al., 1978, Prinn and Fegley Jr, 1981, Lunine and Stevenson, 1987]. The Huygens probe provided key constraints for the origin of nitrogen (and also carbon) in Titan’s atmosphere [Niemann et al., 2005, 2010], which favor a NH3 into N2 oxidation mechanism. A careful analysis of the rare gas abundances in Titan’s atmosphere shows that it is possible for a small fraction of the present-day atmosphere to be residual gas from the primitive nebula [Glein, 2017]. However, the low 36Ar/N2 abundance measured by the Gas Chromatograph Mass Spectrometer (GCMS) onboard (, which is times smaller that the solar value, Niemann et al. [2010]) indicates that the primordial blocks that formed Titan contained a very small fraction of 36Ar and N2 and that nitrogen has been brought on Titan in the form of easily condensable N-bearing compounds, most likely NH3 [Atreya and Lorenz, 2010]. The 14N/15N ratio measured in N2 in Titan’s atmosphere (167.7, Niemann et al. [2010]) appears also very close to the value recently inferred in NH2 radicals in comets produced by photodissociation of NH3 [Rousselot et al., 2013, Shinnaka et al., 2014], suggesting a similar origin.
Several mechanisms have been proposed to explain the conversion of NH3 into N2 and the formation of the N2-rich Titan’s atmosphere: photochemical conversion [Atreya et al., 1978], impact-induced conversion either in the atmosphere [McKay et al., 1988, Ishimaru et al., 2011] or in a NH3-enriched icy crust [Sekine et al., 2011, Marounina et al., 2015], and endogenic processes [Glein et al., 2009, Tobie et al., 2012, Glein, 2015]. An efficient conversion of NH3 into N2 in the primitive atmosphere requires a NH3-saturated warm atmosphere [Atreya et al., 1978, McKay et al., 1988], conditions which may have been met at the end of Titan’s accretion when a large fraction of ices incorporated in Titan’s interior was molten [Kuramoto and Matsui, 1994, Monteux et al., 2014].
During Titan’s accretion, impact heating may have been sufficient to allow the global melting of water ice leading to, the formation of a thick water ocean in contact with the atmosphere constituted by the release of volatile compounds, mainly CO2, CH4 and NH3 [Lunine and Stevenson, 1987, Tobie et al., 2012, Monteux et al., 2014]. As NH3 is highly soluble in water [e.g. Smolen et al., 1991], it should be mainly contained in the post-accretional global water ocean, thus contributing only weakly to the primitive atmosphere [e.g. Harms-Watzenberg, 1995]. Therefore, the conversion of NH3 into N2 should require efficient exchange processes from the global water ocean, the main reservoir of NH3, to the atmosphere where dissociation processes occur. To determine for how long the conditions inducing the conversion of NH3 into N2 might have been met on early Titan, it is essential to better understand the exchange processes between the primitive atmosphere and the surface ocean.
The ocean-atmosphere exchanges on early Titan have also likely affected the carbon inventory, in particular CH4 and CO2 the two main carbon bearing species expected at the end of accretion [Tobie et al., 2012]. Better understanding the partitioning of carbon species between the global ocean and the proto-atmosphere of Titan is essential to assess the most likely scenario for the origin of methane [Atreya and Lorenz, 2010]. The isotopic 13C/12C ratio in Titan’s CH4, measured by GCMS [Niemann et al., 2010] is similar to CI carbonaceous chondrites, which suggests that it has been injected in Titan’s atmosphere less than 1 Gyr ago [Mandt et al., 2012]. As its lifetime in present-day atmosphere is of the order of 20-30 Ma due to irreversible photochemical processes and atmospheric escape in the upper atmosphere [Wilson and Atreya, 2004, Yelle et al., 2008, Krasnopolsky, 2010, Lavvas et al., 2011], it must be replenished from a subsurface reservoir. The presence in the atmosphere of a significant amount of 40Ar, the decay product of 40K initially contained in the rocky core, indicates an efficient degassing from the interior [Niemann et al., 2005, 2010], which may explain the CH4 replenishment [Tobie et al., 2006]. However, the nature and the location of the CH4 subsurface reservoirs as well as their origin remain unconstrained. Methane could have been initially stored in the deep interior during the accretion [e.g. Tobie et al., 2006], trapped during the post-accretional cooling stage [e.g. Lunine and Lorenz, 2009] or converted in the interior from CO2 [e.g. Atreya et al., 2006, Owen et al., 2006, Glein et al., 2008]. In order to provide theoretical constraints on the origin of methane, we model the partitioning of the two main carbon species, CO2 and CH4, between the surface ocean and the primitive atmosphere during the early stage of Titan’s history.
The amount of volatile compounds incorporated on Titan depends on the composition of planetesimals from which the Saturnian system formed and on the accretion processes within the Saturnian circumplanetary disk [e.g. Mousis et al., 2009]. Mandt et al. [2014] indicate that the composition of Titan’s building blocks might be close to the cometary one. The cometary abundances range between 0.025 and 0.3 mol/mol H2O for CO2 (1.4 and 17 mol.kg), between 0.2 and 0.015 mol/mol H2O for NH3 (0.1 and 0.83 mol.kg), between 0.0014 and 0.015 mol/mol H2O for CH4 (0.08 and 0.83 mol.kg) and between 0.004 and 0.3 mol/mol H2O for CO (0.22 and 17 mol.kg), that is also an abundant volatile found in comets [Bockelée-Morvan and Crovisier, 2004, Mumma and Charnley, 2011, Cochran et al., 2015]. Unfortunately, even if comets are representative of the initial composition of planetesimals in the vicinity of Saturn’s forming region, some fraction of volatile compounds may have been lost during the accretion [e.g. Estrada et al., 2009] or converted in Titan’s interior by water-silicate exchanges [Matson et al., 2007].
On the other hand, the latest estimate of volatile abundance in Enceladus plume derived from Cassini INMS provide an interesting alternative constraint for the volatile content of Titan: 0.3-0.8 % (volume mixing ratio) of CO2 (0.16-0.44 mol.kg); 0.4-1.3 % NH3 (0.22-0.72 mol.kg); 0.1-0.3 % of CH4 (0.06-0.17 mol.kg); 0.4-1.4 % of H2 (0.22-0.78 mol.kg) [Waite et al., 2017]. We should, however, keep in mind that the volatile inventory in Enceladus have been re-processed due notably to aqueous alteration processes as suggested by the detection of H2, and as a consequence may not be fully representative of the primordial composition [e.g. Zolotov, 2007]. In any case, it is worth noticing that CO2 is a dominant species in both Enceladus’ plume and comets.
Although CO2 is predicted to be the main carbon species in models of Titan’s formation [Alibert, Y. and Mousis, O., 2007, Hersant et al., 2008, Tobie et al., 2012], its role in the chemical evolution of Titan has been ignored so far. This may be due to the fact that present CO2 abundances are still unknown. Cassini detected only a small amount of CO2 in Titan’s upper atmosphere, most certainly originating from a recombination of CO and OH- [Hörst et al., 2008]. But it might be present in significant quantities on the surface, and potentially in the interior, as suggested both by the apparent CO2 evaporation subsequent to the landing of the Huygens probe [Niemann et al., 2010], and the spectral absorptions indicative of CO2 ice at different locations on Titan’s surface [McCord et al., 2008].
CO2 presence may have significantly affected the chemical evolution of the primitive atmosphere and ocean, the primitive cooling of the surface, as well as the formation of a primitive crust through clathration processes [e.g. Lunine and Lorenz, 2009, Choukroun et al., 2010]. Gas clathrate hydrates are crystalline water-based structures forming cages in which gas compounds such as CH4 or CO2 can be trapped [Sloan and Koh, 2008, Choukroun and Grasset, 2010]. It is then essential to determine in which conditions CH4-CO2 clathrates hydrates form and what were their composition and density during Titan’s early history, in order to better understand the fate of the main carbon species during the post-accretional cooling stage and their potential impact on the subsequent evolution of Titan.
In this study, we investigate the partitioning of CO2, CH4 and NH3 between the global water ocean of primitive Titan and its atmosphere, for variable initial volatile content. We also estimate the amount of volatile compounds that may be trapped in clathrates hydrates during the post-accretional cooling stage as well as the consequences for the formation of a primitive clathrate-rich crust. In section 2, we detail the model developed to characterize the equilibrium between the atmosphere and a surface water ocean, including the description of the post-accretional structure of Titan, the gas-liquid equilibrium model and the clathration parameterization. In section 3, the model results are displayed, with special focus on both the influence of the relative abundance of CO2 and NH3 on the ocean-atmosphere equilibrium, and the role of primordial CH4 as well as N2 resulting from NH3 conversion on the clathration process. Finally, we discuss in section 4 the implications of our results for the conversion of NH3 into N2 and the trapping of CH4 in the crust in Titan’s primordial stages.
2 Model
2.1 Post-accretional structure of Titan
To determine the amount of volatile species that are available to form Titan’s primitive atmosphere at the end of the accretion, we consider a redistribution of the primordial material between the internal layers as shown in Figure 1 and described in detail later. When Titan reaches a critical radius, which typical value varies between 750 and 1500 km, the impact heating during accretion becomes sufficient to melt the outer layer of the satellite [Monteux et al., 2014], thus allowing for the separation of water and volatiles and the deposit of silicates at the bottom of the global ocean. This could affect the overall chemical composition of volatiles due to chemical reactions between liquid water and silicates. Here we consider that this separation is fast enough that the chemical reactions do not modify considerably the initial volatile content of Titan’s building blocks.
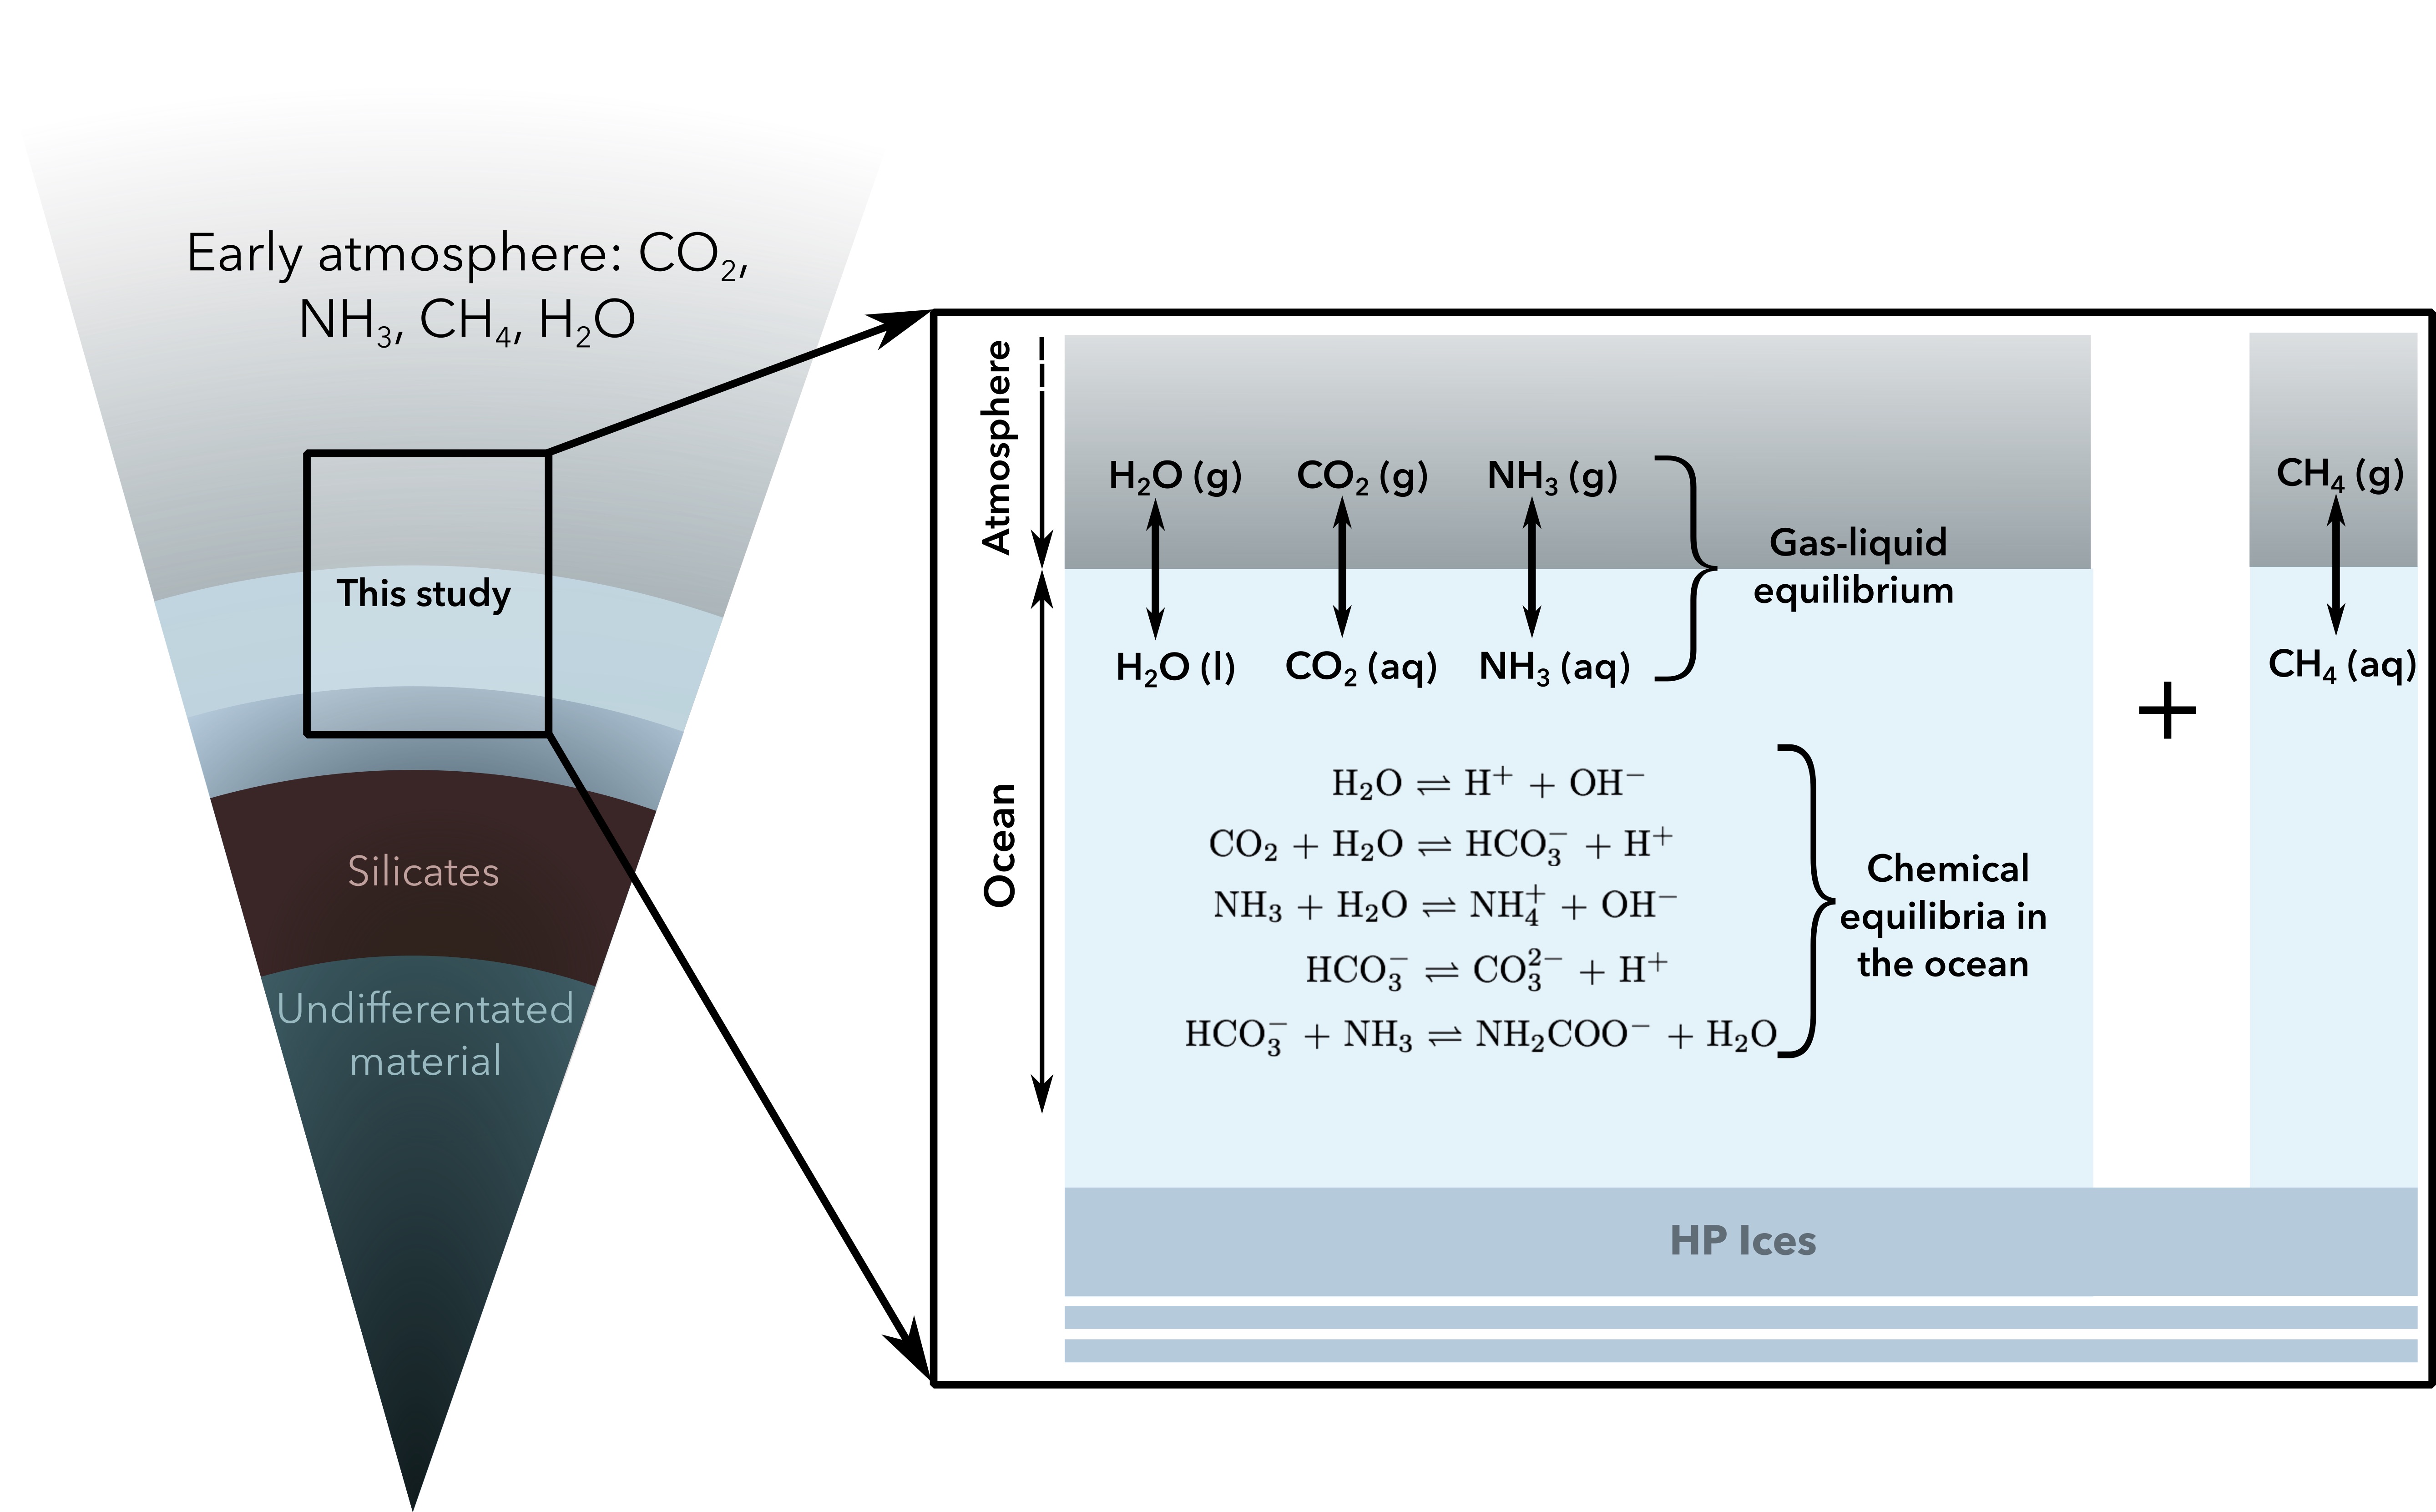
In the model, the interior structure is divided in four main envelopes: an atmosphere, a water ocean, a high-pressure ice mantle and an ice-rock inner core and is sketched in Fig. 1. The mass ratio among the outer envelopes (atmosphere and ocean, made only of water and volatiles) and the inner parts (undifferentiated core + silicate mantle) is determined by the parameter xmelt and the bulk mass fraction silicates of the satellite. Here we consider that Titan is formed from a mixture of 50 wt% of silicates, and 50 wt% of water and volatiles, Lunine and Stevenson [e.g. 1987], Tobie et al. [e.g. 2013]. xmelt depends on the accretion timescale[e.g. Monteux et al., 2014] and was varied between 0.05 and 0.5 (the maximum value corresponding to all of the mixture water+volatiles melted during the accretion). Second, the bulk composition of the outer envelopes (i.e. the nature and the amount of volatiles compared to the amount of water) is fixed within a range consistent with what was discussed in section 1. Finally, one must chose a surface temperature at the interface between the surface ocean and the atmosphere, which can be understood as being an indicator of the time evolution. Our model is not time-dependent since each structure is at thermodynamic equilibrium. But a warmer surface temperature must be understood as being representative of an earlier stage in Titan’s evolution. Using these four inputs (surface temperature, primordial silicate fraction, primordial melt fraction, and bulk composition of the water-rich primordial material), it is then possible to describe both the size but also the composition of each sublayers of the outer part of the satellite (high-pressure icy layer, clathrate hydrate layer, liquid ocean, atmosphere).
To determine the structure and composition at equilibrium for a given melt fraction, surface temperature, and bulk volatile content, the following iterative procedure is used. First, we assume that the outer parts of the satellite are made of an ocean and an atmosphere only. Then, for starting the iterative process, an initial surface pressure and an initial mass ratio between the vapor/atmosphere and the liquid/ocean phases are chosen arbitrarily. The existence of high-pressure ices and/or clathrates hydrates is then explored in depth (see sections 2.3 and 2.4 respectively). Depending on the ocean/ice interface depth, the total amount of volatiles that will be incorporated either in the ocean or the atmosphere is adjusted. By combining on one side the thermodynamic laws for L-V equilibrium (see section 2.2 for details), and the mass conservation constraints on the other side, one can find iteratively the unique solution of the problem for the initially chosen surface pressure, and the chosen mass ratio between ocean and atmosphere.
On the other hand, the surface pressure is constrained by the thickness and composition of the atmosphere. We assume an atmosphere that is isothermal, and uniform in composition, which implies that both pressure and density decreases exponentially with altitude with the same scale-height. In this condition, the surface pressure can be directly related to the total atmospheric mass (corresponding from the integration of the density profile from the surface to the space) (cf. eq. 1). As most of the atmospheric mass is contained beneath the scale-height where the gravity varies only slightly with altitude, the exact surface pressure deviates only slightly from the value given by the following simple relationship:
| (1) |
where is the gravity at the surface of the satellite and is Titan’s radius. By comparing the pressure obtained with equation (1) to the one chosen at the first step of this iterative process, the mass ratio between ocean and atmosphere can be adjusted. Then, the new pressure obtained from eq. 1 is chosen and the process is restarted from the determination of the HP ices and clathrate hydrate layers. At the end of this iterative process, one must find a unique solution as sketched in figure 1, where bulk composition and sizes of each layers are determined.
2.2 Gas-liquid equilibrium model
At thermodynamic equilibrium in gas-liquid systems, fugacities of each component in both phases are equal: . This equality of fugacities are commonly expressed as:
| (2) |
where is the total pressure, is the molar fraction of the component in the gas phase, is the molar fraction of the component in the liquid phase, is the fugacity coefficient, the activity coefficient of in the aqueous phase, and is the reference state if in the liquid phase. Water is considered to be the only solvent and its reference state fugacity is its the fugacity of the pure component at system pressure and temperature (namely, the pressure of saturation at temperature T). The corresponding definition is not always possible for the solutes, unless one is willing to extrapolate the properties of some chemical species above their critical temperatures [for a detailed description on the reference states see Prausnitz, 1963, Prausnitz et al., 1998]. A more satisfactory procedure is to define the reference fugacity for solutes as follows:
| (3) |
where is the Henry’s constant of in water. The Henry’s constant has here the dimension of pressure. The expression of the water saturation vapor pressure as a function of temperature was taken from the NIST database [Linstrom, P. J. Mallard, 2016], while the expression for the Henry’s constant was taken from Rumpf and Maurer [1993a] and Rumpf and Maurer [1993b] for CO2 and NH3, respectively.
We use the Peng-Robinson-Gasem equation of state [Peng and Robinson, 1976, Gasem et al., 2001] to compute the fugacity coefficients of H2O, CO2 and NH3 in the gas phase [Englezos, 1993, Pazuki et al., 2006]. This is a semi-empirical approach that accounts for the non-zero volume of molecules and attractive forces between pairs of gas molecules. In the range of pressures and temperatures explored in this study, this approach is adequate for gas mixtures containing water but it requires sometimes to take into account the binary interaction coefficients for each pair of constituents. The comparison between the partial pressures in the gas phase predicted by our model and the experimental measurements for binary CO2-H2O and NH3-H2O systems [e.g. Smolen et al., 1991, Bamberger et al., 2000] indicates that binary interaction parameters are required only for the pair CO2-H2O, in which case the coefficient from [Dhima et al., 1999] is used.
For the liquid phase and for the CO2-NH3-H2O system, speciation equilibria occurring in the liquid water must necessarily be taken into account [Edwards et al., 1975, 1978, Thomsen, 2005]:
| (4) |
| (5) |
| (6) |
| (7) |
| (8) |
Dissolution of CO2 in liquid water causes its partial dissociation and the formation of a weak acid, while the dissolution of NH3 causes the formation of a weak base. Neglecting these dissociations for the ternary CO2-NH3-H2O system induces large overestimations of the partial pressures in the gas phase. For the binary systems CO2-H2O and NH3-H2O, these reactions in water have almost no influence on the solubility of gases [e.g. Spycher et al., 2003, for CO2-H2O system]. However for the ternary system CO2-NH3-H2O, ionic species interact with each other and induce a significant increase in the amount of dissolved gases in water due to the formation of new ionic species, such as NH2COO- [Edwards et al., 1975, 1978]. The equilibrium relations of the reactions described in Eq. 4 to 8 can be written:
| (9) |
| (10) |
| (11) |
| (12) |
| (13) |
where represent the molality of the indicated compound in water (i.e. the number of mol of the chemical compound normalized to 1 kg of water, units: mol.kg-1) and are the dissociation coefficients, which depend on temperature only. The model is extremely sensitive to the values of Ki. The best correspondence between experimental data (see the compiled list the experimental points of CO2-NH3-H2O system in Darde et al. [2010]) and our model was obtained by using the parameters from Darde et al. [2010]. In this study, Ki are considered to be function of temperature only. The parameters proposed by Darde et al. [2010] are valid up to 100 bar and we do not cross this limit.
The presence of ionic species makes the computation of activity coefficients for the chemical species in the liquid phase (both for water and dissolved species) mandatory. To estimate these activity coefficients, we use the extended UNIQUAC model (short for extended Universal QUAsi-Chemical model) [Anderson and Prausnitz, 1978, Sander et al., 1986, Nicolaisen et al., 1993, Thomsen and Rasmussen, 1999] with parameters taken from Darde et al. [2010]. For the ternary system CO2-NH3-H2O, the state of equilibrium is obtained by solving simultaneously the equilibrium relations for the dissolved species (Eq. 9 to 13), mass balance, charge balance and gas-liquid equilibrium for the non-ionic species: CO2, NH3 and H2O (Eq. 2).
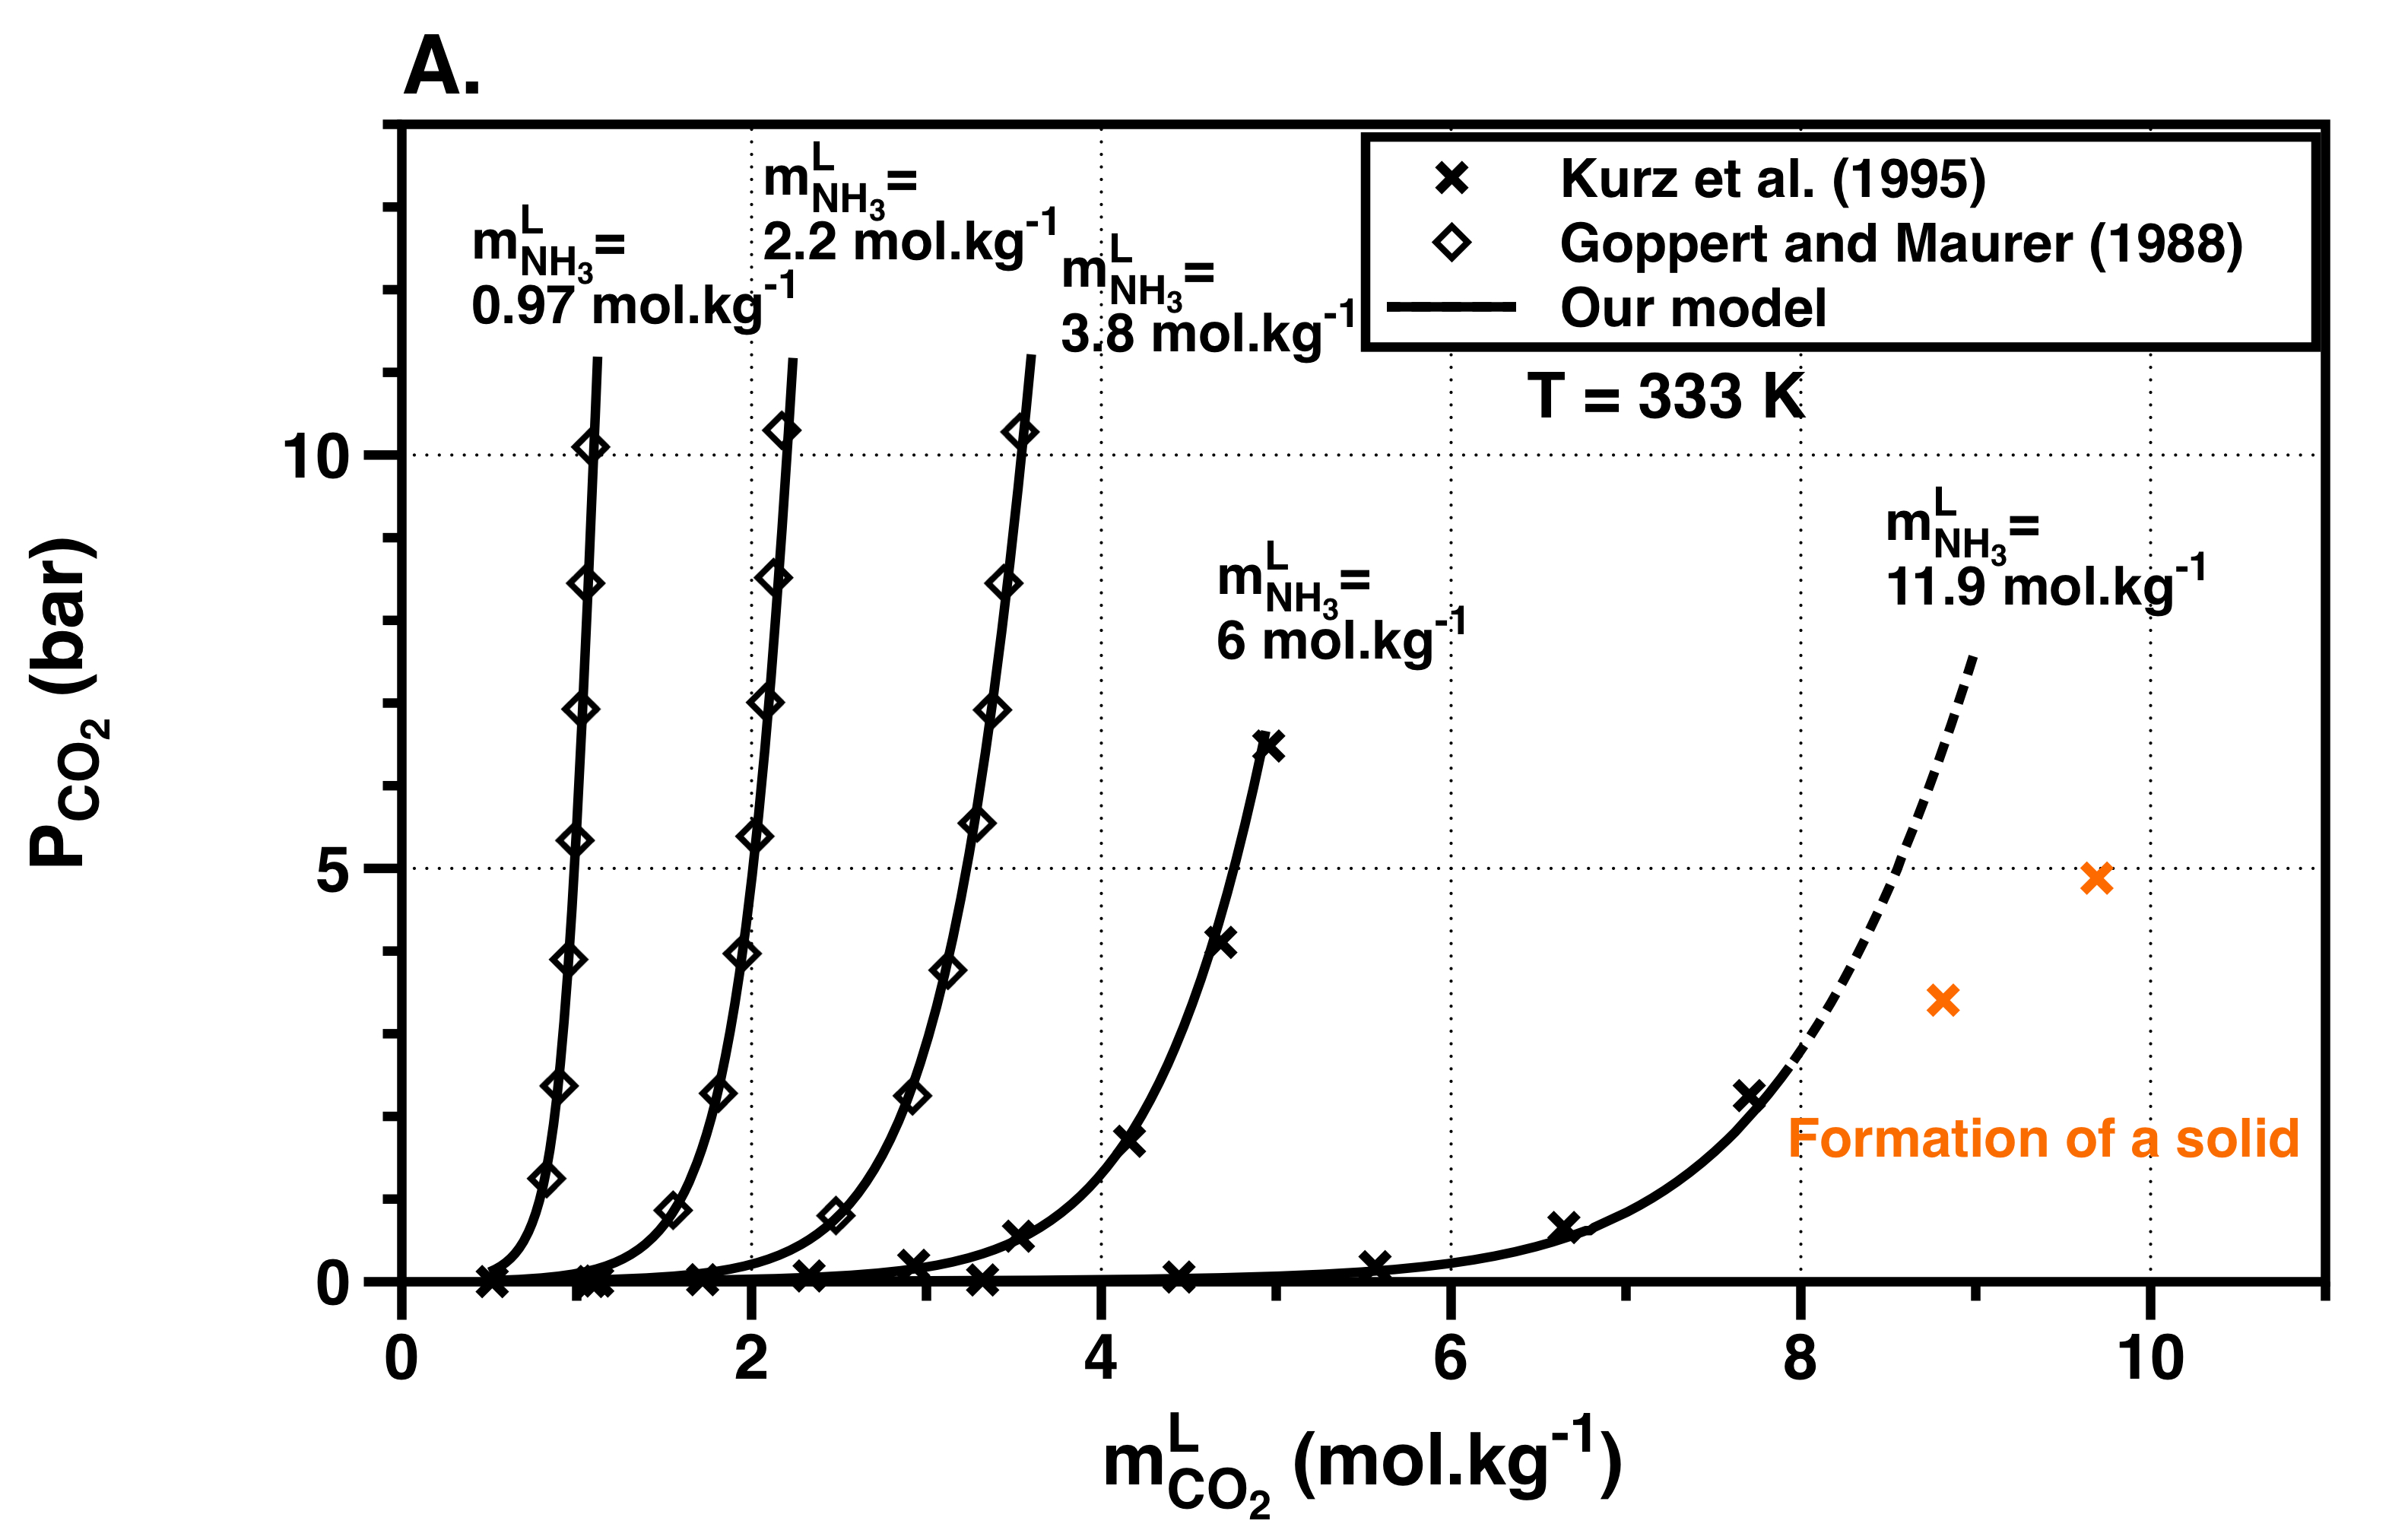
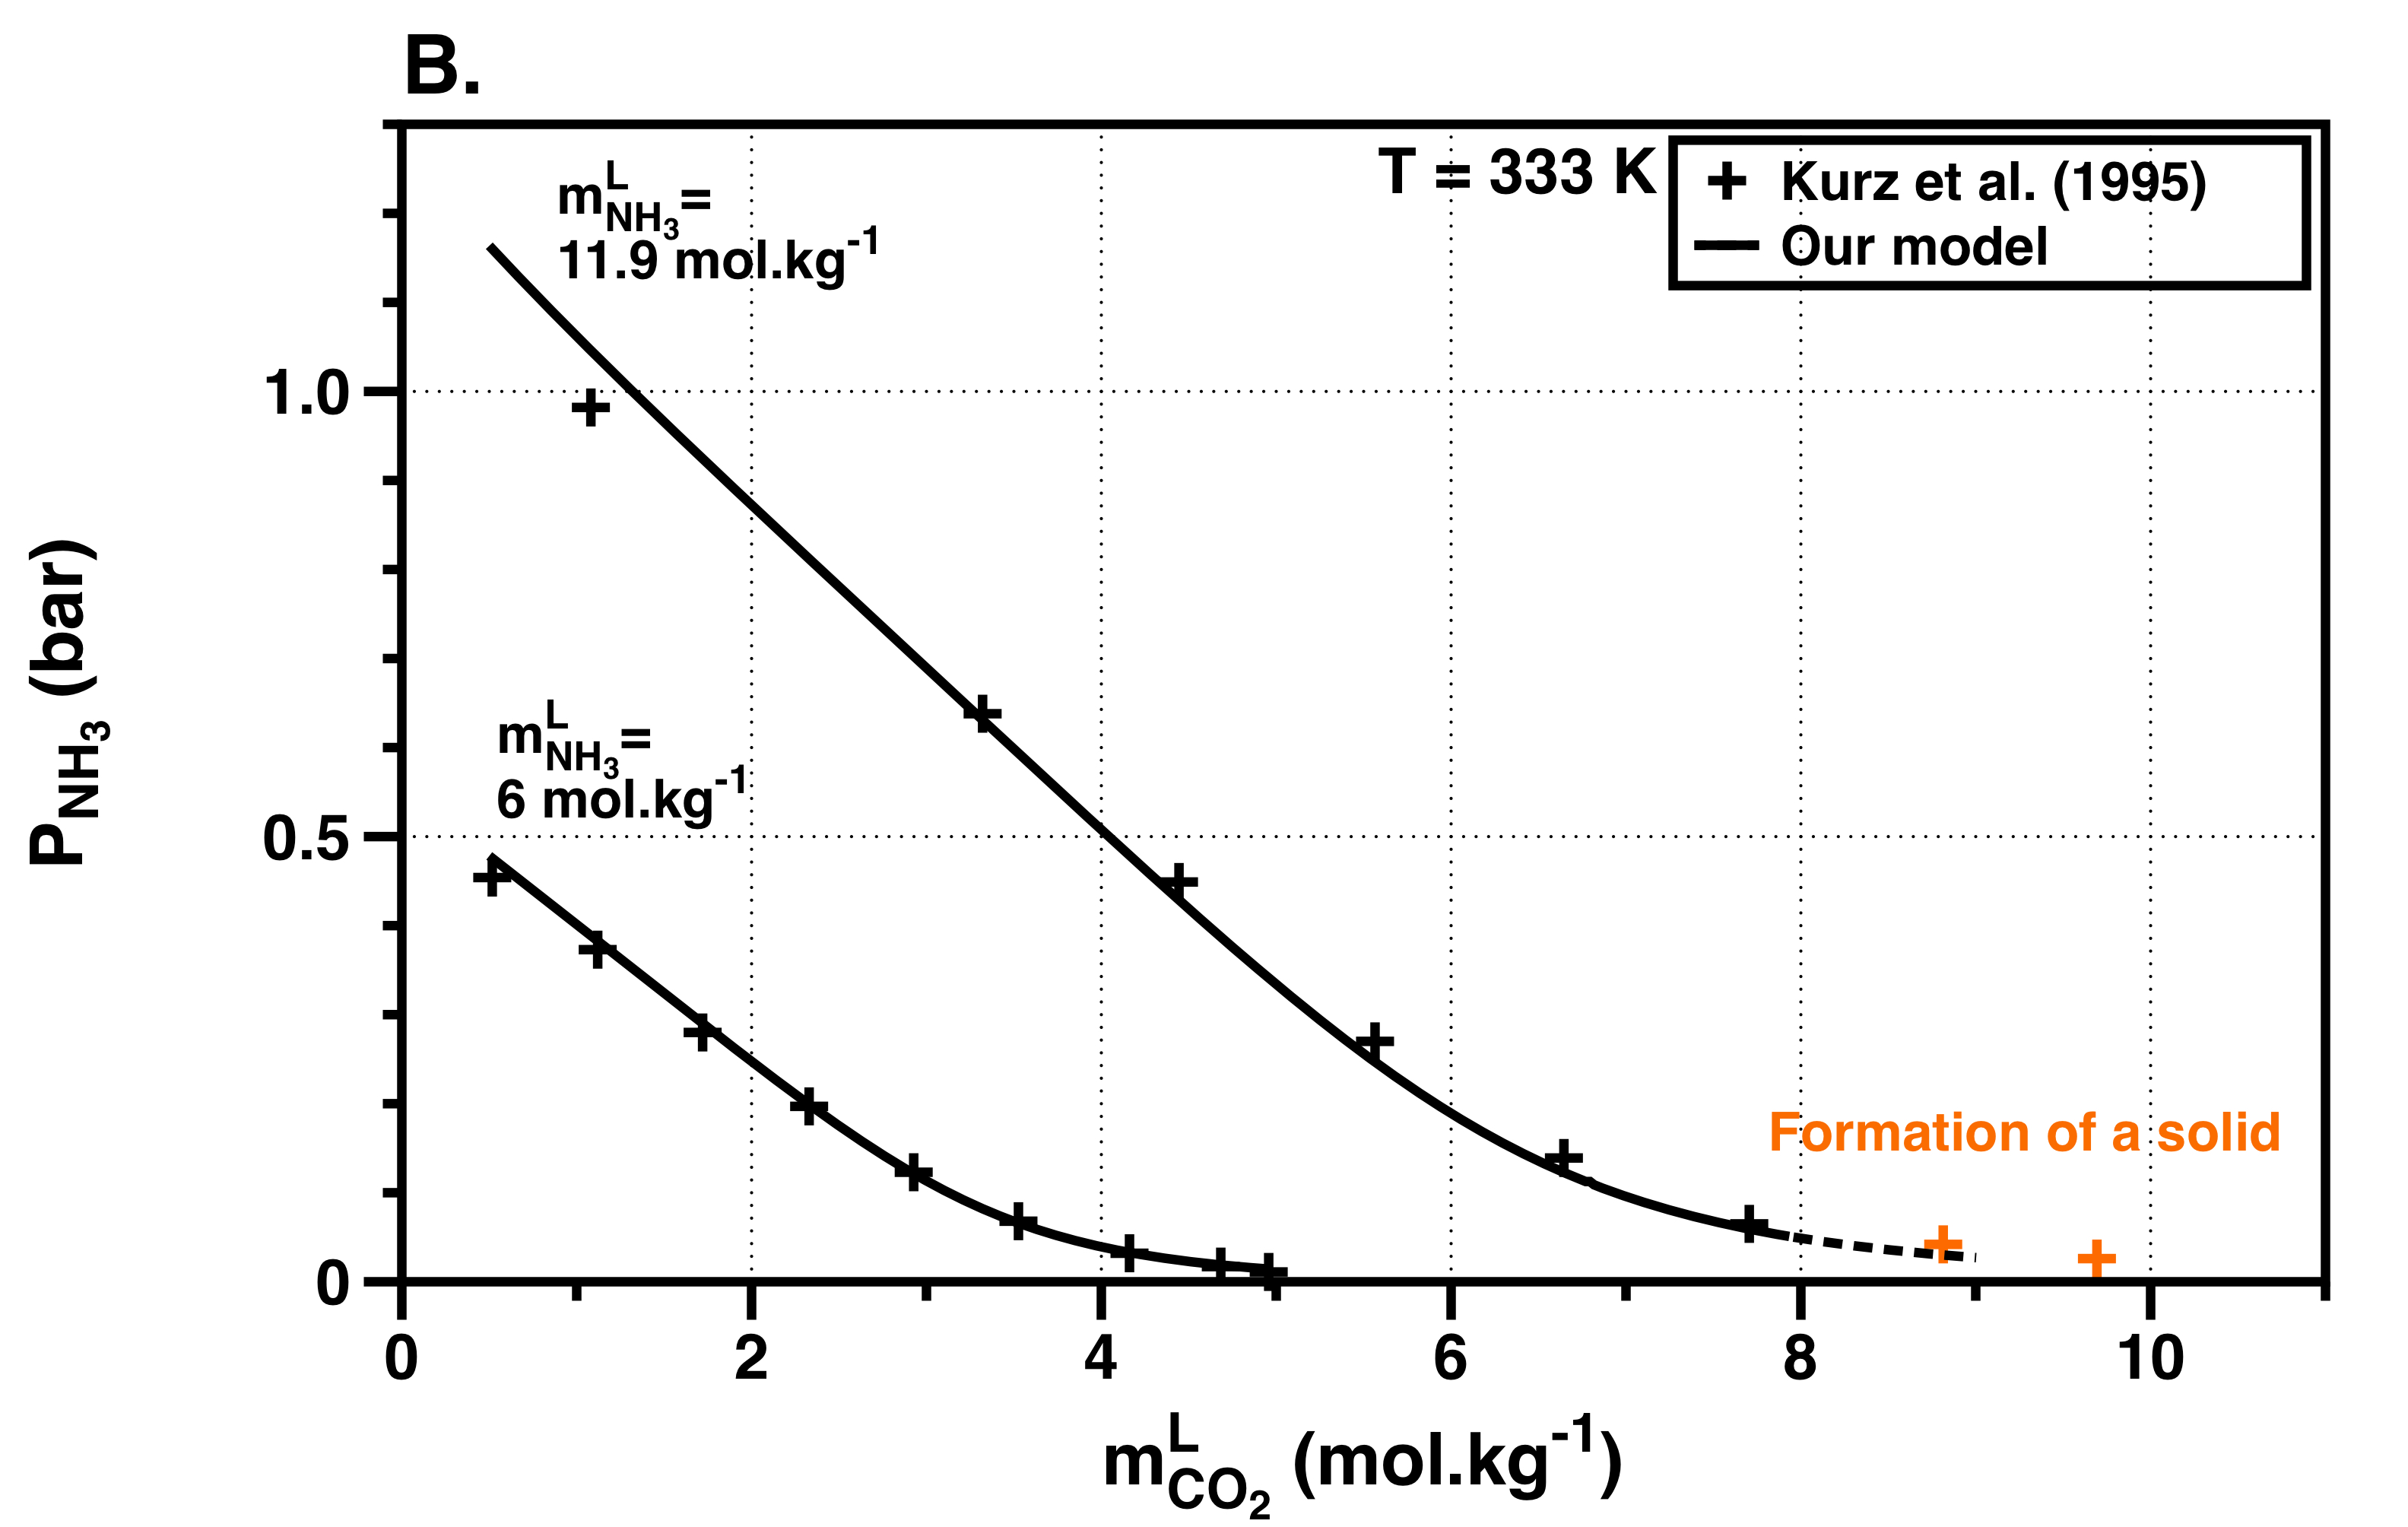
Our comparisons between experimental data listed in Darde et al. [2010] and the model are similar to those obtained by Darde et al. [2010], who reproduced the CO2 and NH3 partial pressure (, ) with mean deviation of 11% and 12%, respectively (see Fig. 2).
The partial pressure of water is almost not affected by the dissociation reactions that occur in the liquid and remains close to its saturation vapor pressure. Deviation to this value occurs only for high concentration of CO2 and NH3, typically and larger than 10 mol.kg-1 [Göppert and Maurer, 1988], that corresponds to values up to 10 times larger than the one expected on primitive Titan for NH3. Moreover, for high CO2 and NH3 concentrations, the formation of solid phases (NH4HCO3, NH4COONH4, (NH4)2CO3H2O or (NH4)2CO32NH4 HCO3) was observed experimentally [c.f. Kurz et al., 1995, Jilvero et al., 2015]. The composition of the precipitated solid depends on the relative abundances of CO2 and NH3 [Thomsen and Rasmussen, 1999, Darde et al., 2010, 2012] and it formation lead to a decrease of the CO2 partial pressure in the gas phase. As we do not account for the formation of the solid phases, our model is valid for (i) concentrations up to 6 mol.kg-1 for NH3 and up to 4 mol.kg-1 for CO2 (see Fig. 2) and (ii) temperatures between 273.15 and 373.15 K. Considering the limitations in volatile concentrations of our gas-liquid equilibrium model and the volatile abundances observed in comets and in Enceladus’ plume, we will explore the range of concentrations up to 4 mol.kg-1 for CO2 and up to 1 mol.kg-1 for NH3, which is in between the validity range of our domain.
To model the dissolution of CH4 along with CO2 and NH3 in water using the extended UNIQUAC model, one has to fit the experimental data to retrieve the binary interaction coefficients. However, only limited experimental data exists for the CO2-CH4-H2O system below 373K, the upper temperature limit that is relevant for this study [Al Ghafri et al., 2014]. To our knowledge, no experimental data are available for the gas-liquid equilibrium of CH4-NH3-H2O and CH4-CO2-NH3-H2O systems. Consequently, we model the dissolution of CH4 using the Henry’s law and therefore we neglect the interactions between CH4 and (CO2, NH3) and the resulting ionic species in water. The CH4-H2O Henry’s constant was obtained by a fit of the experimental data of Cramer [1984]:
| (14) |
where the Henry’s law constant is in bar and the temperature in kelvin.
The comparison between the computed CH4 partial pressures in the CO2-CH4-H2O system using the Henry’s constant and the experimental data for the same system at T=323.15K [Al Ghafri et al., 2014] shows a difference up to 12 bar. This deviation is greater for lower pressures, leading to an error up to 100%. This error decreases with the increasing pressure.
2.3 Formation of high-pressure ices
Depending on the surface oceanic temperature and on the thickness and the thermal structure of the ocean, a high-pressure (HP) ice layer may form in between the ocean and the silicate mantle (1). Assuming an adiabatic pressure-temperature profile in pure water system, the HP ice layer forms only if the surface temperature is colder than 291 K. Its higher thickness is about 180 km when the surface temperature is down to the freezing point of pure water. Neglecting the possible formation of clathrates hydrates, the position of the HP icy layer-ocean interface is fixed from the intersection between the adiabatic temperature profile in the ocean and the melting curve of ice VI [Choukroun and Grasset, 2007]. The melting temperature depends on pressure, but also on the amount of volatiles dissolved in the liquid layer. For sake of simplicity, we neglect the effect of the dissolved salts and volatile compounds on the melting curve, a reasonable assumption since the volatile content does not exceed a few percents, and we use the pure water ice VI melting curve in this model. This implies a small underestimate of the thickness of the water reservoir, as well as an overestimate of the volatile contents in the liquid. This effect is considered negligible when compared to the degree of uncertainty on the bulk composition of Titan’s building blocks.
2.4 Formation of clathrate hydrates
Carbon dioxide and methane can also be mixed with water in clathrate hydrate solid phases (refererred simply as clathrates for the rest of the manuscript), with a relative proportion that is controlled by the surface temperature and their partial pressure in the atmosphere. As we also explore the influence of nitrogen on the formation of clathrates, we need to account for the incorporation of N2 in the CO2-CH4 clathrate. In order to determine the formation temperature and the composition of the clathrate hydrates for a mixture of gases, we use the simplified modeling approach of Lipenkov and Istomin [2001]. We used a RMS analysis to fit the experimental data for liquid water-hydrate-gas equilibrium of CH4, CO2 or N2 between 273.15K and 283.15K [Sloan and Koh, 2008] to a third degree polynomial:
| (15) |
where is the pressure of formation of a pure clathrate (CH4, CO2 or N2) and coefficients A, B, C, and D are summed up in Table 2.4.
| Component | (bar.K-3) | (bar.K-2) | (bar.K-1) | (bar) |
|---|---|---|---|---|
| CH4 | -3.132710-4 | 0.511707 | -207.353 | 2.4870104 |
| CO2 | 1.06214210-2 | -8.63639 | 2342.1086 | -2.11830105 |
| N2 | 8.4893310-2 | -70.17086 | 19359.66 | -1.78255106 |
These stability curves are derived from experiments for single gas compound. They can be used to approximate the stability curve of a multiple compound gas hydrate at first order, by assuming that clathrate hydrate behaves as an ideal solution and that the ratio of occupancies for the small and large cages is constant and equal for all guest molecules [e.g Miller, 1974, Lipenkov and Istomin, 2001, McKay et al., 2003]. Within these assumptions, the formation pressure of multiple compound clathrates is predicted using the following relationship:
| (16) |
where is the mole fraction in the gas mixture that account only for species that are trapped in clathrates (NH3 and H2O gases are not considered for computation).
For a given surface temperature, the clathrate formation pressure is computed using the atmospheric composition that is determined with the gas-liquid equilibrium model described in section 2.2. If the predicted clathrate formation pressure is equal to or exceeds the total surface pressure, clathrate hydrates form with a composition that is fixed from the following relationship:
| (17) |
where and are the mole fraction of gases and in the clathrate phase, and are fugacities in liquid water (right-hand term of Eq. 2). This approach has been used to determine the clathrate formation in the Lake Vostok [Lipenkov and Istomin, 2001, McKay et al., 2003] or the formation of CH4 clathrates in the marine sediments. The computations of using the equation 16 give nearly the same results as those obtained from more rigorous thermodynamic models [Lipenkov and Istomin, 2001, Choukroun et al., 2013].
In order to determine whether the formed clathrate hydrate would remain stable at the ocean surface or sink to the oceanic floor, we compute its density using the following formula [Sloan and Koh, 2008]:
| (18) |
Where is the number of water molecules per unit cell (46 for structure sI that is considered here), is the Avogadro number, is the volume of unit cell (12 for the sI structure), M is the molecular weight of H2O, Mj is the molecular weight of component , is the fractional occupation of cavity by component , assumed to be equivalent in small and large cages and equal to (corresponding to full occupancy), is the number of type cavities per water molecule in unit cell (2 and 6 for small and large cages respectively), is the number of cavities in the unit cell and is the total number of compounds trapped in hydrate phase.
3 Results
In this section, we explore various primordial composition characterized by different values of / molar ratio. We first outline the general behavior of the CO2-NH3-H2O system and define two compositions that are relevant for the atmosphere of early Titan. In the second part, the effect of the surface temperature on the gas-liquid equilibrium is explored for these two cases. Finally, methane and diatomic nitrogen are included to investigate the conditions for formation of clathrate hydrates during Titan’s primordial history.
3.1 The effect of the / molar ratio in the CO2-NH3-H2O system
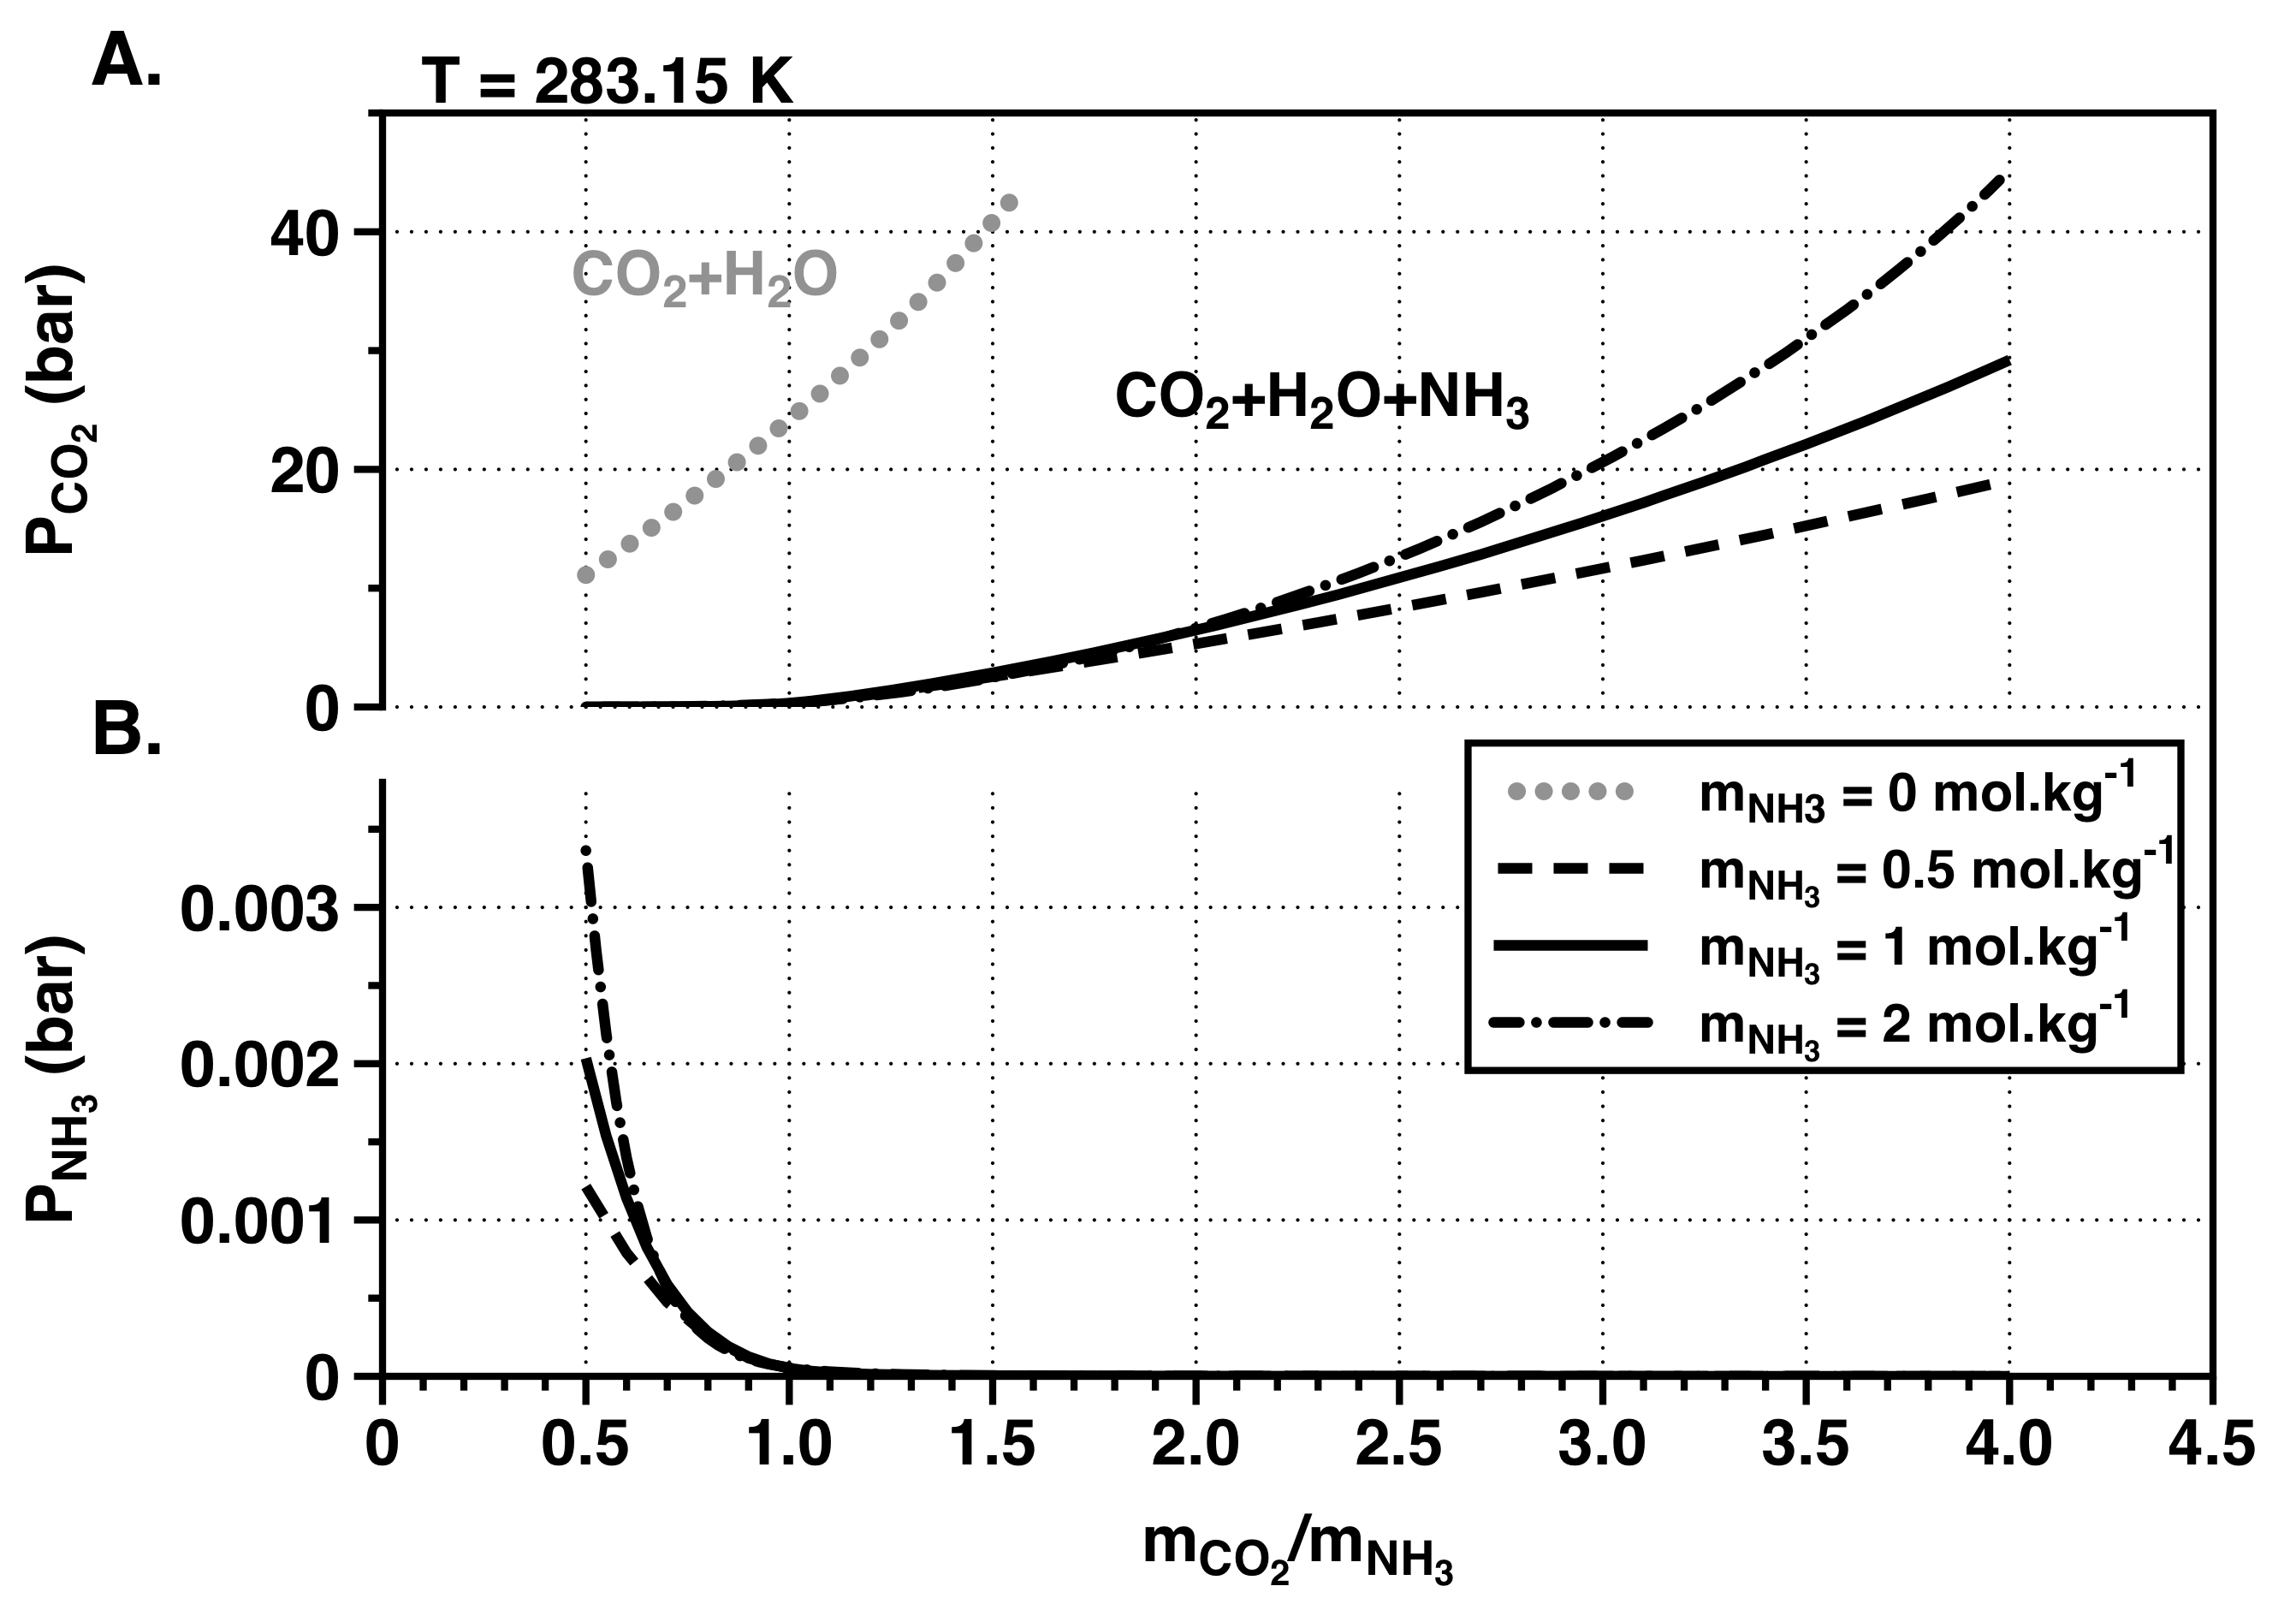
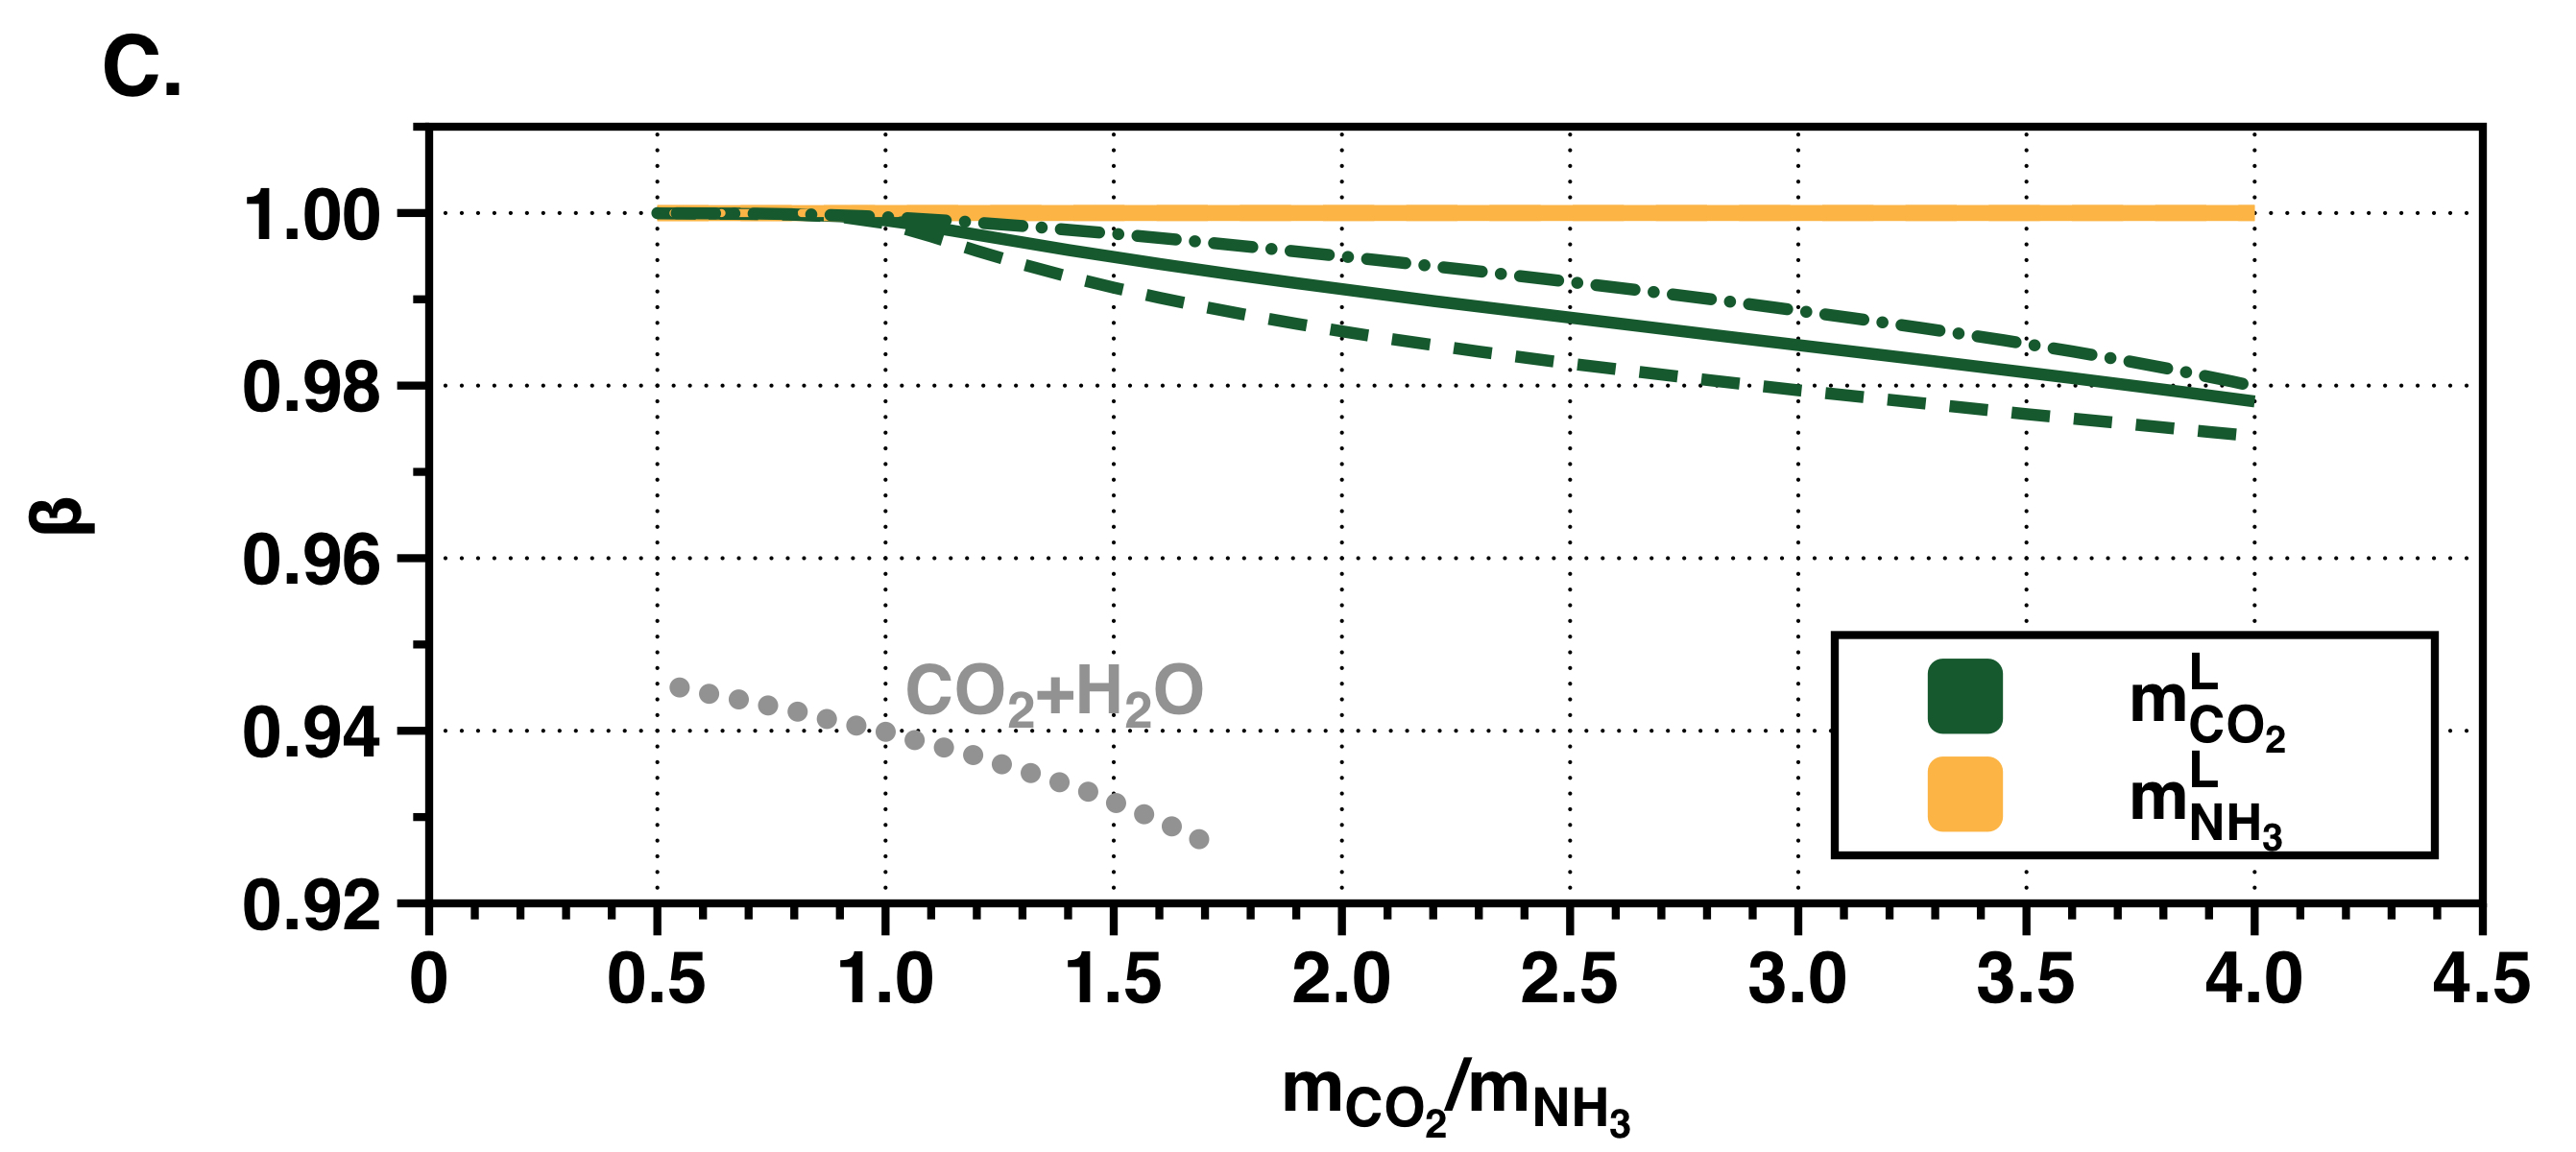
Figure 3 summarizes the general behavior of the gas-liquid equilibrium in the CO2-NH3-H2O system for a temperature of 283.15 K. It displays the repartition of CO2 and NH3 in both liquid and gas phases as a function of the ratio of molalities /. Two distinct cases can be identified depending on the fact that NH3 is the dominant compound of the system (/1), or CO2 is the main compound (/1) (Fig. 3 A and B). When CO2 is less abundant than NH3, the partial pressure of CO2 in the gas phase remains low, because the equilibrium reactions (eq. 4 to 8) in liquid water trap almost all the carbon dioxide in the liquid phase. When CO2 is more abundant than NH3, the partial pressure of CO2 in the gas phase increases with its molality in the ocean + atmosphere system. Figure 3 C displays , the number of mols of CO2 dissolved in water relative to the total number of moles of CO2 in the ocean + atmosphere system, as a function of / concentration ratio. It shows that, for the ternary CO2-NH3-H2O system, more than 97% of CO2 available in the hydrosphere is dissolved in water. For a case without NH3, this fraction is systematically lower than 95%, as displayed in Figure 3 C, and the CO2 partial pressure in the atmosphere is higher (see Fig. 3 A).
On the other hand, ammonia is almost entirely dissolved in water. The ammonia molality in the ocean , is almost equal to its global molality . The NH3 partial pressure in the gas phase is several orders of magnitude lower than the partial pressure of CO2 and is always decreasing with the CO2 increasing global molality. This trend will be observed at all temperatures explored in this study, and is in agreement with previous experimental works [see Van Krevelen et al., 1949, Verbrugge, 1973, Müller et al., 1988, Göppert and Maurer, 1988, Kurz et al., 1995, Jilvero et al., 2015].
3.2 Effect of the temperature and the presence of high pressure ices in the CO2-NH3-H2O mixture for primitive Titan
For this set of calculations with varying surface temperature of the global water ocean, the NH3 global concentration is set to 1 mol.kg-1, and the concentration of CO2 is fixed either to 0.5 or 2 mol.kg-1, in order to consider the two regimes described above. In both cases, the composition of the gas phase will be explored throughout the entire possible temperature range (273-373 K) of the gas-liquid interface. This temperature variation could be assimilated to a time evolution from early stages (high temperature) to later stages prior to the upper crust formation (low temperature) on early Titan’s surface. The position of the interface between ice VI and ocean must also vary with the surface temperature (see details below), as the intersection between the ocean adiabatic curve and the melting curve shifts upward with decreasing surface temperature.
Figure 4 shows the evolution of the total atmospheric pressure at all surface temperatures, and the contribution of each gas to this total pressure. For all cases, NH3 is mainly dissolved in water, and its partial pressure in the atmosphere remains low with respect to the two other compounds. The atmospheric pressure of NH3 decreases with increasing concentration in CO2 (Fig. 4 A and B), as already demonstrated in Figure 3. As for CO2, it was shown previously that its partial pressure varies significantly depending on the relative abundance of CO2 and NH3. For / 1, the partial pressure of CO2 in the atmosphere remains low and two regimes can be identified: at low temperatures (323 K in this case), water vapor is the main atmospheric component; at high temperatures (323 K in this case), CO2 is the major component in the atmosphere (see Fig. 4 A). When / 1 (Fig. 4 B), the main atmospheric component is the carbon dioxide, whatever the temperature is, and water vapor is about two order of magnitude less abundant.
Finally, we find that the partial pressure of water is weakly affected by the dissociation reactions that occur in the liquid and remains close to the saturation vapor pressure at all temperatures and all compositions.

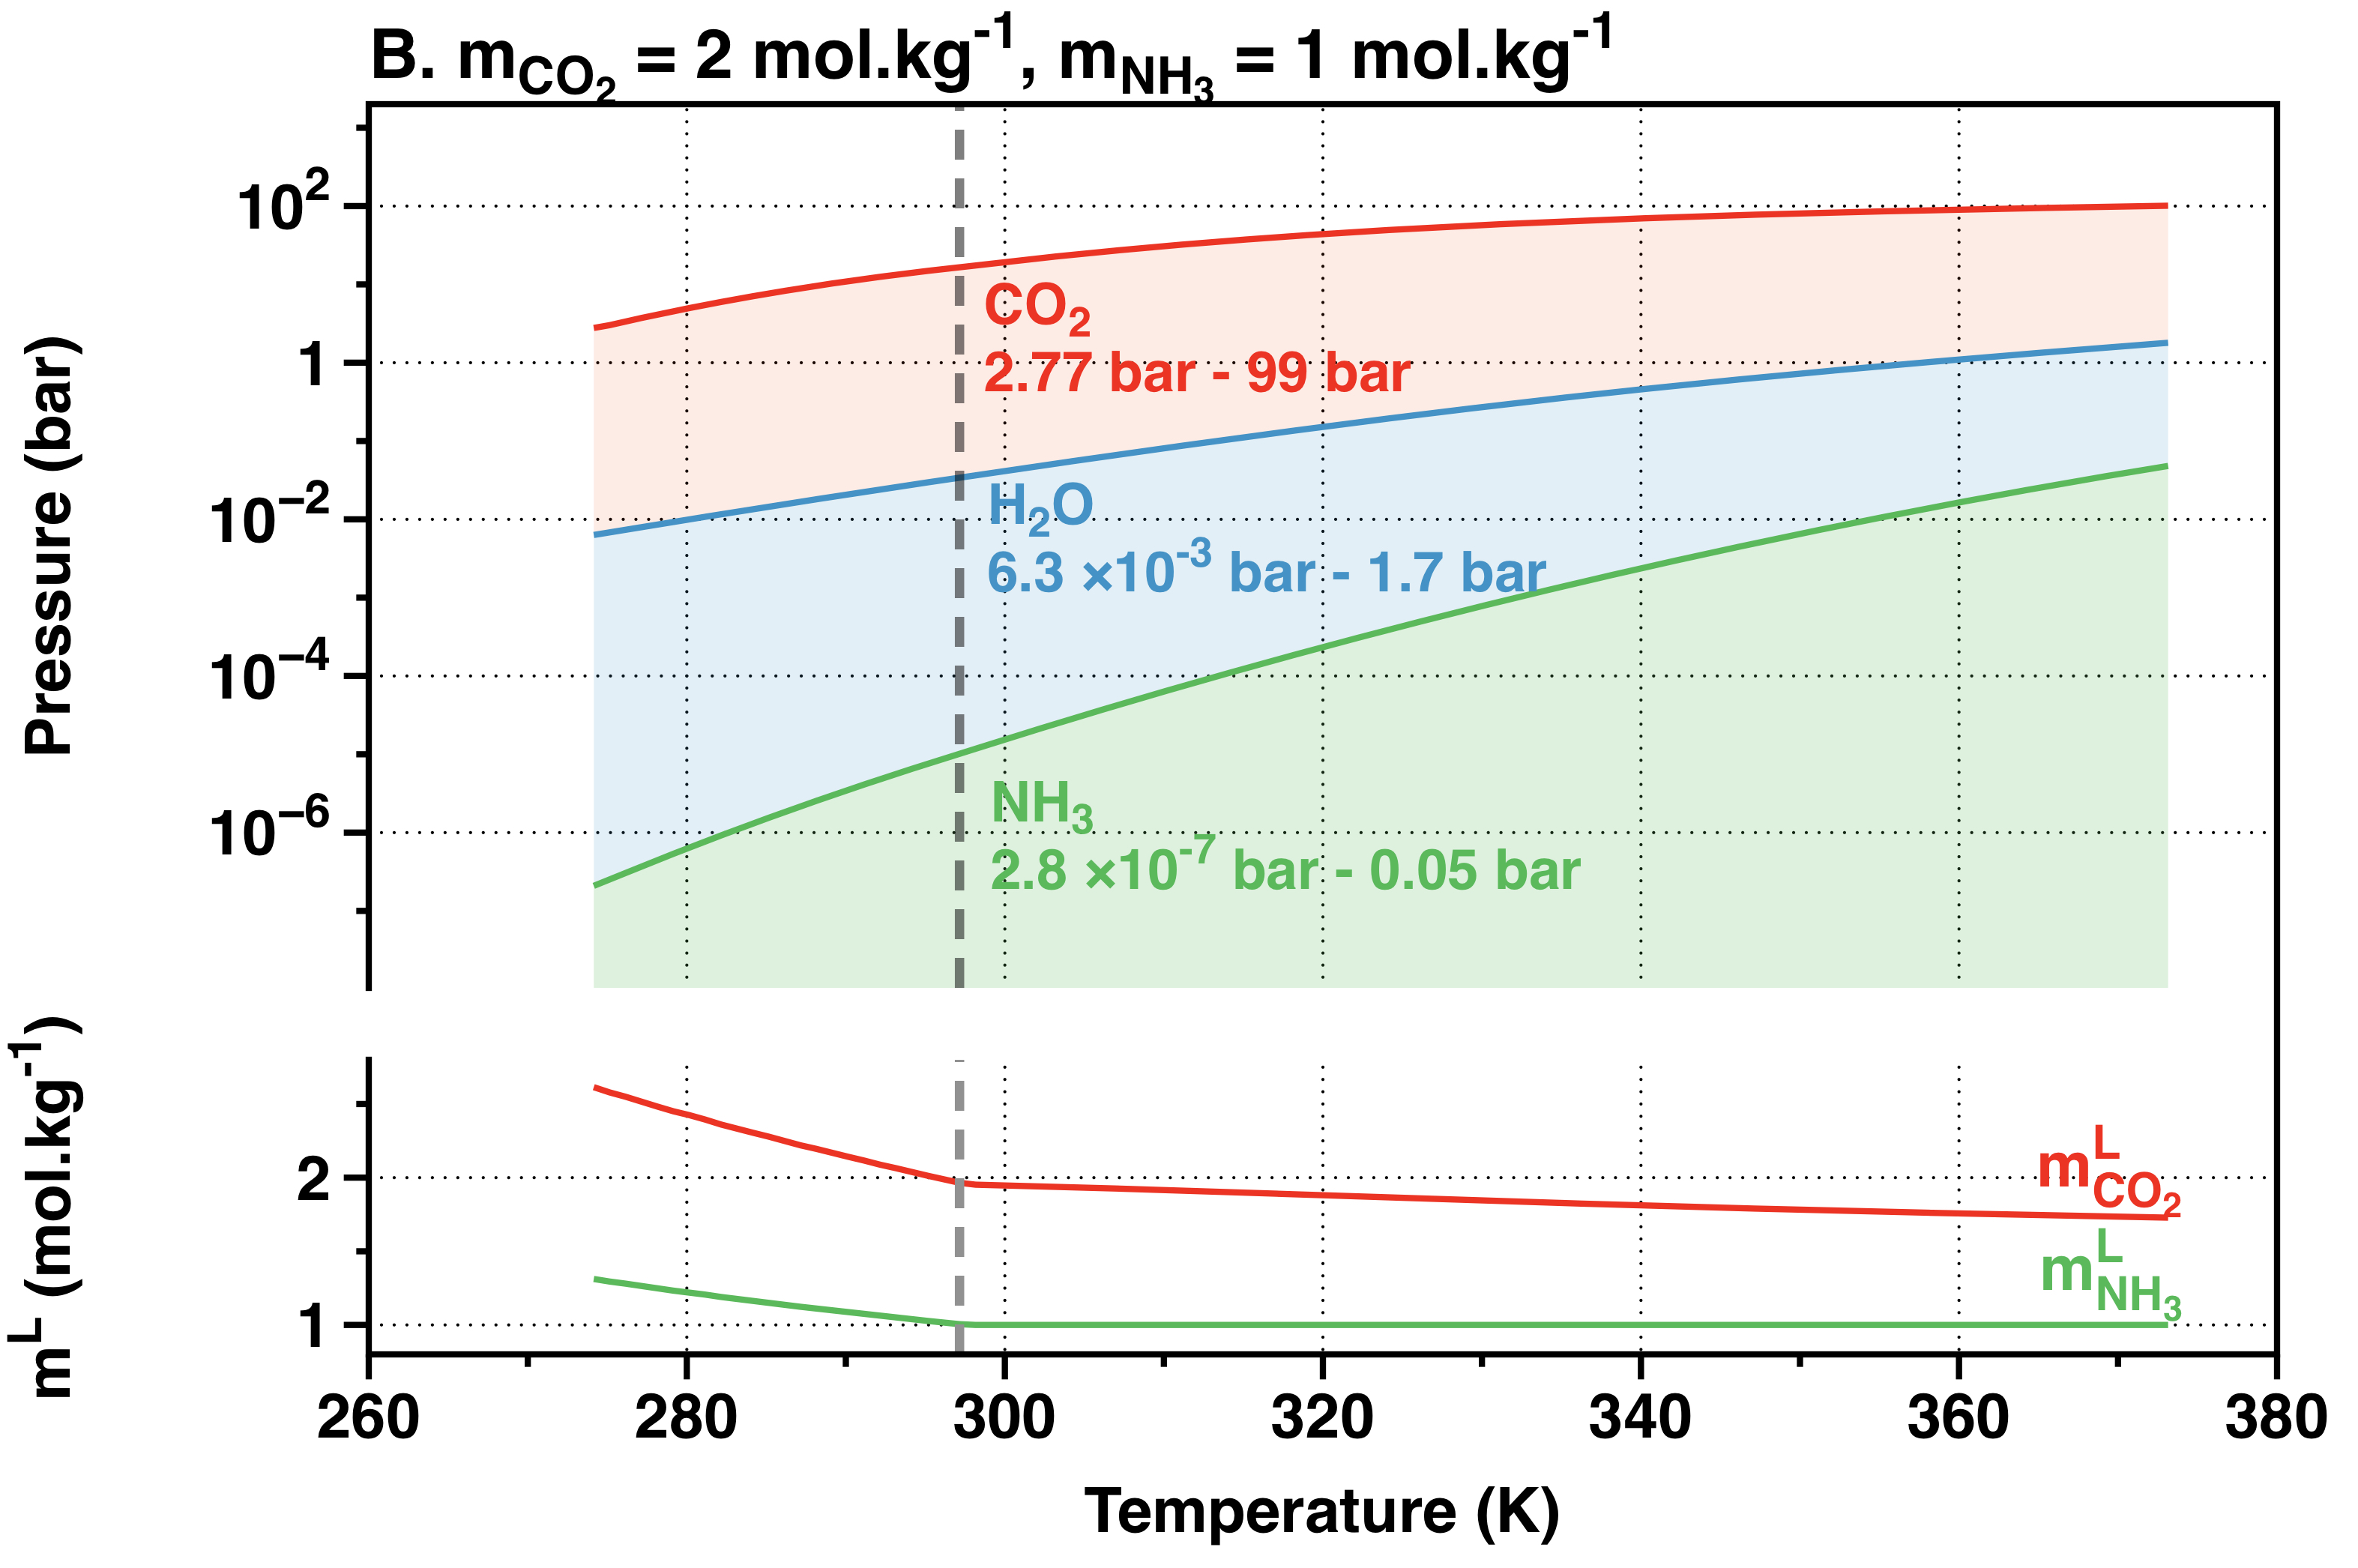
In this simulation we used =0.5, possibly the highest value that could be envisaged when considering that Titan is mostly half water, half silicates by mass. Within this assumption, it turns out that ice VI starts to form on the oceanic floor for temperatures lower than T=297K. Since it is assumed that ice VI is made of pure water (i.e. neglecting the small amount of volatiles that could be incorporated in the ice and/or possible hydrates), the amount of volatiles in the liquid layer is increased significantly as the HP ice layer thickens (see bottom panels of Fig. 4 A and B). Furthermore, the increase of ammonia concentration in liquid water imposes a higher solubility of carbon dioxide because of the dissociation reactions in water, as explained above. It leads to an accentuated decrease of the partial pressures of these gases in the atmosphere at temperatures where ice VI could be formed.
3.3 Formation of methane-rich clathrates in the CH4 - CO2 - NH3 - N2 - H2O system
To investigate the formation of clathrate hydrates, we accounted for the presence of CH4 and N2 in CO2-NH3-H2O system. The effect of the methane is investigated by using the Henry’s law (see section 2.2), which limits its validity to cases where the interaction of dissolved methane with other compounds in solution can be neglected. In principle, this does not mean that the amount of methane must be very small since it is not very reactive (methane is neither polar nor reactive, not very soluble, and it does not dissociate in water. Nonetheless, since it influences the solubility of other compounds [see Al Ghafri et al., 2014], we suggest to restrain our investigations to small amounts of methane where possible interactions should be limited. A fixed CH4 concentration of 0.2 mol.kg-1 has been chosen for illustrative purposes. Results are very preliminary, but illustrate well what are the two different regimes that could have existed on early Titan.
First of all, it must be reminded that the solubility of CH4 in water is extremely low, thus implying that the atmosphere constitutes the main reservoir of CH4. Consequently, a first regime can be easily described. Indeed, if , it has been shown in section 3.1 that CO2 is efficiently dissolved in water and its partial pressure in the atmosphere remains low. Thus, the main gas in the atmosphere is methane. Therefore, when the total surface pressure reaches the pressure of formation of clathrates, these clathrates are mostly made of CH4 and are consequently less dense that the oceanic water. It turns out that a crust must be formed rapidly at the interface between the ocean and the methane-rich primordial atmosphere, thus limiting exchanges between the two reservoirs. The question is then to determine the critical amount of carbon dioxide above which another evolution involving clahtrate sinking could be envisaged.


Indeed, if the amount of CO2 is sufficiently high for ensuring that a significant part of the carbon dioxide is trapped in the clathrate phase (), both composition and densities of clathrate hydrates are changed up to a point where they may become denser than the liquid reservoir at the surface. In Figure 5, the composition of the atmosphere is indicated for two examples as a function of temperature. Ammonia and water compounds are not plotted because they exist only in negligible quantities in the gas phase. The trend is comparable in both cases, with the atmosphere being mostly composed of the two gases (CO2 and CH4) with similar abundances, and with the existence of a critical temperature below which clathrates hydrates are formed (see Fig. 6 for =0.2). In Figure 5A, where the / ratio is fixed to 2, clathrates are less dense than water and then should form a crust at Titan’s surface. This should once again strongly reduce the possible exchanges between the two reservoirs, but the primordial atmosphere is then significantly enriched in carbon dioxide. In the second case (Fig. 5B), where the / ratio is fixed to 3, the CO2 abundance in the atmosphere is much more important and clathrates are significantly enriched in CO2.
Consequences of the atmospheric enrichment of CO2 relative to CH4 on the clathrate hydrates densities is illustrated in Figure 6, where the densities of clathrates are computed from Equation 18. It turns out that in this second case the clathrates are denser than the liquid, and should fall down so that further exchanges between the liquid and the atmosphere should continue down to the freezing temperature of water ice.

In Figure 6, the transition domain between the two regimes is plotted with the red curve that displays the surface density of the liquid reservoir. For the range of parameters explored in this study, it is extremely clear that one key parameter is the bulk abundance of methane. If CH4 molality is above 0.3 mol.kg-1, it seems that the crust will form very rapidly whatever the amount of carbon dioxide is. Even the adding of some nitrogen cannot change this conclusion. Possible exchanges of the atmosphere with the liquid reservoir down to very cold temperatures can be achieved only if the amount of methane is very low (for molalities lower than 0.1 mol.kg-1). In between these two values, and as discussed just above, it is the amount of carbon dioxide with respect to ammonia that controls the density of the clathrate hydrates that form at low temperatures.
4 Implication for Titan’s primitive atmosphere and the formation of Titan’s early crust
Whatever the surface temperature is (above 273 K), there is no high pressure ices for 0.32. For the internal structures without a HP ice layer, the surface pressure depends on the volatile abundances of Titan’s building blocks only, and do not depend on the fraction. The maximal thickness of the ice VI layer is 290 km and is reached for =0.5 and T=273.15 K, i.e. the case which is displayed in Figure 4. The value of controls the amount of HP ice with respect to the liquid reservoir at a given temperature, and consequently the amount of volatiles in the system ocean-atmosphere since no volatiles are trapped in the HP ice layer. The formation of this layer leads to an increase of concentrations of dissolved species in the ocean-atmosphere system. Therefore, in this second case where the HP layer forms, the results do depend on the fraction. However, this dependence implies negligible effects when compared to the uncertainties on the bulk composition in volatiles of the satellite and it does not affect our conclusions or the following discussion (see Fig. 4).
4.1 The conversion of NH3 into N2 in the atmosphere
In the previous section, we demonstrated that depending on the relative abundances of CO2 and NH3 in planetesimals that formed Titan, two scenarios may have occurred. For a global water ocean formed by impact heating, the repartition of the volatile compounds between the water ocean and the atmosphere are governed by the dissolution of gases in liquid water. We apply a thermodynamic model based on Darde et al. [2010] to model the dissolution of NH3 and CO2 in water and we show that if , the partial pressure of CO2 in the atmosphere remains low whatever the temperature is, and the partial pressure of NH3 stays close to the saturation vapor pressure of the binary NH3-H2O system. On the contrary, for , the partial pressure in the atmosphere of NH3 is significantly reduced (see values displayed in Fig. 4) and the CO2 is the main compound of Titan’s primitive atmosphere.
Ishimaru et al. [2011] suggested that the conversion of NH3 into N2 by impacts would be favored for NH3-rich atmospheres where the main atmospheric compound is CO2 (CO2:NH3 ratios from 1:1 to 4:1 for a 1 bar atmosphere). Such atmospheric composition favors the NH3 into N2 conversion during impacts because of the low heat capacity of CO2, allowing maintaining high temperatures over longer timescales than those obtained for impacts in reducing gases such as NH3 or CH4. However in our study, it has been shown that an atmospheric composition that is simultaneously rich in CO2 and NH3 is certainly not compatible with the presence of massive water ocean at the surface, as the excess of one chemical compound tends to favor the dissolution of the other one in water.
4.2 Formation of methane-rich clathrate crust
If the presence of clathrates allows the formation of a crust, it must be at a higher temperature than for the pure water ice crust. Thus, it implies an earlier separation of ocean and atmosphere and a rapid cessation of NH3 into N2 conversion in the atmosphere at low temperatures. In this study we explore the conditions of formation of CO2-CH4 clathrate hydrates, as well as the evolution of the primordial CH4 at Titan’s surface. Our results show that methane clathrates should form during cooling at the ocean-atmosphere interface, at low temperatures. The evolution of the formed CH4-rich clathrates depends on the total amount of methane and also on the ratio. For very low CH4 molalities (0.1 mol.kg-1), clathrate hydrates should sink as soon as they are formed. For higher values (above 0.3 mol.kg-1), an upper crust should rapidly appear, thus strongly reducing exchanges between the atmosphere and the ocean. In between these values, it is the ratio that controls the system. For high ratios (roughly above 3), the clathrates possibly appearing at Titan’s surface are CO2-rich, denser than water, and consequently should sink in the ocean. On the contrary, for lower values of the ratio, CH4-CO2 clathrates with low CO2 content are formed, thus resulting in the formation of an upper clathrate crust.
Primitive Titan’s atmosphere may have contained up to 20 bar of N2 if the NH3 into N2 conversion could occur at this epoch [Atreya et al., 1978, Lunine et al., 1999, Adams, 2006, Atreya and Lorenz, 2010]. Adding N2 to the atmosphere leads to two competing effects. On one hand, the increase of the total surface pressure favor the formation of clathrate since clathrate hydrates form when the total atmospheric pressure is higher than the pressure of formation of clathrates (eq.16). On the other hand, the pressure of formation of the mixture of clathrates from eq. 16 increase upon the addition of N2 because the pressure of formation of N2 pure clathrates ( 159 bar, for liquid water+N2) is an order of magnitude higher that the pressure of formation of pure CO2 ( 12 bar, for liquid water+CO2) or pure CH4 clathrates ( 24 bar, for liquid water+CH4). As an example, adding 20 bar of N2 in to the total surface pressure increase the clathrate formation pressure of eq. 16 by 8-10 bar (depending on the composition of the atmosphere prior the addition of N2).
The resulting effect for the formation of clathrates at the surface of Titan is shown in Fig. 6. The addition of 20 bar of N2 tends to favor the clathrate formation, as they form at higher temperatures and higher methane concentration when compared to the case without N2. This figure indicates that nitrogen should not affect the main results presented just above, but should increase the amount of clathrates hydrates formed in the primordial stages.
5 Conclusion
Considering a wide range of surface temperatures and global compositions of CO2, NH3 and CH4 in Titan’s building blocks, we compute the corresponding atmospheric compositions on early Titan in equilibrium with a global surface ocean. We show that the ratio is crucial for the determination of the main atmospheric constituents, as NH3 and CO2 mutually increase their solubility in liquid water. For 1, CO2 would be massively dissolved in water, and its partial pressure won’t exceed 1 bar for temperatures lower than 323K at Titan’s surface. For 1 the partial pressure can exceed more than 10 bars, making the partial pressure of CO2 comparable or larger to that of CH4. Assuming that Titan’s initial volatile composition is comparable to that measured in Enceladus’ plume [Waite et al., 2017], the ratio would be comprised between 0.2 and 2, and even larger values assuming cometary composition. Moreover, the observed abundances in Enceladus’ plume may also reflect different solubilities of CO2 and NH3 in water. Due to an alkaline pH, most of the inorganic carbon might be dissolved as CO in Enceladus’ inner ocean, leading for an initial CO2 abundance much higher than the one currently observed in the plumes [Zolotov, 2007, Glein, 2015]. In this case, the range of possible could be extended to higher values. The lower estimate would imply an atmosphere dominated by CH4 with small abundances of CO2, while an atmosphere with several tens of bars of CO2 and CH4 could be generated for the upper bound.
We then showed that the abundance of CH4 relative to CO2 plays a crucial role in the clathration processes and the formation of the primordial crust. If the CH4 abundance is lower than 0.1 mol.kg-1, then the partial pressure of CH4 in Titan’s atmosphere is low relative to the partial pressure of CO2 and clathrates formed at Titan’s surface are CO2-rich and denser than the liquid water. If the concentration of CH4 in Titan’s building blocks is higher than 0.3 mol.kg-1, then the clathrates formed at Titan’s surface are CH4-rich and less dense than water and constitute a crust at Titan’s surface, ceasing the further exchanges between the ocean and the atmosphere at temperatures higher than the melting temperature of water. Between 0.1 and 0.3 mol.kg-1 of CH4 concentration, the density of clathrates depend on the ratio in Titan’s building blocks: a buoyant clathrate-rich crust is formed only if the ratio is lower than 3.
More investigations using an atmospheric radiative and photochemical model coupled with the chemical interaction model between the ocean and the atmosphere are required to estimate the amount of NH3 that could be converted to N2 before the formation of a crust at Titan’s surface and form the present-day N2-rich atmosphere. Considering the volatile abundances in comets and in Enceladus’ plume, which indicate a CO2 abundance comparable and higher than that of NH3, future studies would probably need to take in account a CO2-rich atmosphere for the early Titan, in order to evaluate the consequences it might have for the chemical evolution of this water-rich environment. Moreover, the volatile abundances of CH4 in comets and Enceladus plume also indicate us that the formation of an early methane-rich crust at Titan’s surface, before the surface of the satellite reaches the freezing point of water, could be a possible scenario. Our conclusions remain unchanged if we add a significant amount of N2 that could originate from the NH3 into N2 conversion occurring in Titan’s early atmosphere.
6 Acknowledgments
The authors would like to thank Chris McKay and an anonymous reviewer for their insightful comments and suggestions that helped improve the manuscript. The research leading to these results has received funding from the European Research Council under the European Community’s Seventh Framework Program (FP7/2007-2013 Grant Agreement no. 259285).
References
References
- Adams [2006] Adams, E., 2006. Titan’s Thermal Structure and the Formation of a Nitrogen Atmosphere. Ph.D. thesis. University of Michigan.
- Al Ghafri et al. [2014] Al Ghafri, S.Z.S., Forte, E., Maitland, G.C., Rodriguez-Henríquez, J.J., Trusler, J.P.M., 2014. Experimental and modeling study of the phase behavior of (methane + co2 + water) mixtures. The Journal of Physical Chemistry B 118, 14461–14478. doi:10.1021/jp509678g, arXiv:http://dx.doi.org/10.1021/jp509678g. pMID: 25406634.
- Alibert, Y. and Mousis, O. [2007] Alibert, Y., Mousis, O., 2007. Formation of titan in saturn’s subnebula: constraints from huygens probe measurements. Astronomy and Astrophysics 465, 1051--1060. doi:10.1051/0004-6361:20066402.
- Anderson and Prausnitz [1978] Anderson, T.F., Prausnitz, J.M., 1978. Application of the UNIQUAC equation to calculation of multicomponent phase equilibria. 1. Vapor-liquid equilibria. Industrial & Engineering Chemistry Process Design and Development 17, 552--561.
- Atreya et al. [2006] Atreya, S.K., Adams, E.Y., Niemann, H.B., Demick-Montelara, J.E., Owen, T.C., Fulchignoni, M., Ferri, F., Wilson, E.H., 2006. Titan’s methane cycle. Planetary and Space Science 54, 1177 -- 1187. doi:https://doi.org/10.1016/j.pss.2006.05.028. Surfaces and Atmospheres of the Outer Planets, their Satellites and Ring Systems from Cassini-Huygens DataEuropean Geosciences Union General Assembly - Sessions PS1.5, PS3.02 and PS3.03.
- Atreya et al. [1978] Atreya, S.K., Donahue, T., Kuhn, W., 1978. Evolution of a nitrogen atmosphere on Titan. Science 201, 611--613.
- Atreya and Lorenz [2010] Atreya, S.K., Lorenz, Ralph D.and Waite, J.H., 2010. Volatile Origin and Cycles: Nitrogen and Methane. Springer Netherlands. chapter 7. pp. 177--199. doi:10.1007/978-1-4020-9215-2_7.
- Bamberger et al. [2000] Bamberger, a., Sieder, G., Maurer, G., 2000. High-pressure (vapor + liquid) equilibrium in binary mixtures of (carbon dioxide + water or acetic acid) at temperatures from 313 to 353 K. Journal of Supercritical Fluids 17, 97--110. doi:10.1016/S0896-8446(99)00054-6.
- Bockelée-Morvan and Crovisier [2004] Bockelée-Morvan, D., Crovisier, J., 2004. The composition of cometary volatiles, in: Comets II. University of Arizona Press, pp. 391--424.
- Choukroun and Grasset [2007] Choukroun, M., Grasset, O., 2007. Thermodynamic model for water and high-pressure ices up to 2.2 gpa and down to the metastable domain. The Journal of chemical physics 127, 124506.
- Choukroun and Grasset [2010] Choukroun, M., Grasset, O., 2010. Thermodynamic data and modeling of the water and ammonia-water phase diagrams up to 2.2 GPa for planetary geophysics. The Journal of chemical physics 133, 144502. doi:10.1063/1.3487520.
- Choukroun et al. [2010] Choukroun, M., Grasset, O., Tobie, G., Sotin, C., 2010. Stability of methane clathrate hydrates under pressure: Influence on outgassing processes of methane on Titan. Icarus 205, 581--593. doi:10.1016/j.icarus.2009.08.011.
- Choukroun et al. [2013] Choukroun, M., Kieffer, S.W., Lu, X., Tobie, G., 2013. Clathrate Hydrates : Implications for Exchange Processes in the outer Solar System, in: Gudipati, M.S., Castillo-Rogez, J. (Eds.), The Science of Solar System Ices.
- Cochran et al. [2015] Cochran, A.L., Levasseur-Regourd, A.C., Cordiner, M., Hadamcik, E., Lasue, J., Gicquel, A., Schleicher, D.G., Charnley, S.B., Mumma, M.J., Paganini, L., et al., 2015. The composition of comets. Space Science Reviews 197, 9--46.
- Cramer [1984] Cramer, S.D., 1984. Solubility of methane in brines from 0 to 300C. Industrial & Engineering Chemistry Process Design and Development 23, 533--538. doi:10.1021/i200026a021.
- Darde et al. [2012] Darde, V., Maribo-Mogensen, B., van Well, W.J.M., Stenby, E.H., Thomsen, K., 2012. Process simulation of CO2 capture with aqueous ammonia using the Extended UNIQUAC model. International Journal of Greenhouse Gas Control 10, 74--87. doi:10.1016/j.ijggc.2012.05.017.
- Darde et al. [2010] Darde, V., van Well, W.J.M., Stenby, E.H., Thomsen, K., 2010. Modeling of carbon dioxide absorption by aqueous ammonia solutions using the Extended UNIQUAC model. Industrial & Engineering Chemistry Research 49, 12663--12674. doi:10.1021/ie1009519.
- Dhima et al. [1999] Dhima, A., Hemptinne, J.D., Jose, J., 1999. Solubility of hydrocarbons and CO2 mixtures in water under high pressure. Industrial & engineering chemistry research 38, 3144--3161.
- Edwards et al. [1978] Edwards, T.J., Maurer, G., Newman, J., Prausnitz, J.M., 1978. Vapor-liquid equilibria in multicomponent aqueous solutions of volatile weak electrolytes. AIChe Journal 24, 966--976.
- Edwards et al. [1975] Edwards, T.J., Newman, J., Prausnitz, J.M., 1975. Thermodynamics of aqueous solutions containing volatile weak electrolytes. AIChe Journal 21, 248--259.
- Englezos [1993] Englezos, P., 1993. The clathrate hydrates. Industrial & Engineering Chemistry Research 32, 1251--1274.
- Estrada et al. [2009] Estrada, P.R., Mosqueira, I., Lissauer, J., D’Angelo, G., Cruikshank, D., 2009. Formation of jupiter and conditions for accretion of the galilean satellites. Europa, edited by RT Pappalardo, WB McKinnon, and K. Khurana, University of Arizona Press, Tucson , 27--58.
- Gasem et al. [2001] Gasem, K.A.M., Gao, W., Pan, Z., Robinson, R.L., 2001. A modified temperature dependence for the Peng-Robinson equation of state. Fluid Phase Equilibria 181, 113--125. doi:10.1016/S0378-3812(01)00488-5.
- Glein et al. [2008] Glein, C., Zolotov, M., Shock, E., 2008. The oxidation state of hydrothermal systems on early Enceladus. Icarus 197, 157--163. doi:10.1016/j.icarus.2008.03.021.
- Glein [2015] Glein, C.R., 2015. Noble gases, nitrogen, and methane from the deep interior to the atmosphere of Titan. Icarus 250, 570--586. doi:10.1016/j.icarus.2015.01.001.
- Glein [2017] Glein, C.R., 2017. A whiff of nebular gas in titan’s atmosphere – potential implications for the conditions and timing of titan’s formation. Icarus 293, 231 -- 242. doi:https://doi.org/10.1016/j.icarus.2017.02.026.
- Glein et al. [2009] Glein, C.R., Desch, S.J., Shock, E.L., 2009. The absence of endogenic methane on Titan and its implications for the origin of atmospheric nitrogen. Icarus 204, 637--644. doi:10.1016/j.icarus.2009.06.020.
- Göppert and Maurer [1988] Göppert, U., Maurer, G., 1988. Vapor-liquid equilibria in aqueous solutions of ammonia and carbon dioxide at temperatures between 333 and 393 K and pressures up to 7 MPa. Fluid Phase Equilibria 41, 153--185.
- Griffith et al. [2013] Griffith, C., Mitchell, J., Lavvas, P., Tobie, G., 2013. Titan’s Evolving Climate, in: Comparative Climatology of Terrestrial Planets, pp. 1--27.
- Harms-Watzenberg [1995] Harms-Watzenberg, F., 1995. Measurement and correlation of the thermodynamic properties of water-ammonia mixtures. VDI Progress Reports .
- Hersant et al. [2008] Hersant, F., Gautier, D., Tobie, G., Lunine, J.I., 2008. Interpretation of the carbon abundance in Saturn measured by Cassini. Planetary and Space Science 56, 1103--1111. doi:10.1016/j.pss.2008.02.007.
- Hörst et al. [2008] Hörst, S.M., Vuitton, V., Yelle, R.V., 2008. Origin of oxygen species in Titan’s atmosphere. Journal of Geophysical Research 113. doi:10.1029/2008JE003135.
- Ishimaru et al. [2011] Ishimaru, R., Sekine, Y., Matsui, T., Mousis, O., 2011. Oxidizing proto-atmosphere on Titan: Constraint from N2 formation by impact shock. The Astrophysical Journal 741, L10. doi:10.1088/2041-8205/741/1/L10.
- Jilvero et al. [2015] Jilvero, H., Jens, K.J., Normann, F., Andersson, K., Halstensen, M., Eimer, D., Johnsson, F., 2015. Equilibrium measurements of the NH3--CO2--H2O system -- measurement and evaluation of vapor liquid equilibrium data at low temperatures. Fluid Phase Equilibria 385, 237--247. doi:10.1016/j.fluid.2014.11.006.
- Krasnopolsky [2010] Krasnopolsky, V.A., 2010. The photochemical model of Titan’s atmosphere and ionosphere: A version without hydrodynamic escape. Planetary and Space Science 58, 1507--1515. doi:10.1016/j.pss.2010.07.010.
- Kuramoto and Matsui [1994] Kuramoto, K., Matsui, T., 1994. Formation of a hot proto-atmosphere on the accreting giant icy satellite: Implications for the origin and evolution of titan, ganymede, and callisto. Journal of Geophysical Research: Planets 99, 21183--21200.
- Kurz et al. [1995] Kurz, F., Rumpf, B., Maurer, G., 1995. Vapor-liquid-solid equilibria in the system NH3-CO2-H2O from around 310 to 470 K: New experimental data and modeling. Fluid Phase Equilibria 104, 261--275.
- Lavvas et al. [2011] Lavvas, P., Galand, M., Yelle, R., Heays, A., Lewis, B., Lewis, G., Coates, A., 2011. Energy deposition and primary chemical products in Titan’s upper atmosphere. Icarus 213, 233--251.
- Linstrom, P. J. Mallard [2016] Linstrom, P. J. Mallard, W.G., 2016. NIST WebBook of Chemistry, Standart refernce database num. 69. National Institute of Standards and Technology, Gaithersburg MD, 20899. doi:doi:10.18434/T4D303.
- Lipenkov and Istomin [2001] Lipenkov, V.Y., Istomin, V., 2001. On the stability of air clathrate-hydrate crystals in subglacial lake vostok, antarctica. Materialy Glyatsiol. Issled 91, 2001.
- Lunine and Lorenz [2009] Lunine, J.I., Lorenz, R.D., 2009. Rivers, Lakes, Dunes, and Rain: Crustal Processes in Titan’s Methane Cycle. Annual Review of Earth and Planetary Sciences 37, 299--320. doi:10.1146/annurev.earth.031208.100142.
- Lunine and Stevenson [1987] Lunine, J.I., Stevenson, D.J., 1987. Clathrate and ammonia hydrates at high pressure: Application to the origin of methane on Titan. Icarus 70, 61--77. doi:10.1016/0019-1035(87)90075-3.
- Lunine et al. [1999] Lunine, J.I., Yung, Y.L., Lorenz, R.D., 1999. On the volatile inventory of Titan from isotopic abundances in nitrogen and methane. Planetary and space science 47, 1291--303.
- Mandt et al. [2014] Mandt, K.E., Mousis, O., Lunine, J., Gautier, D., 2014. Protosolar ammonia as the unique source of Titan’s nitrigen. The Astrophysical Journal 788, L24. doi:10.1088/2041-8205/788/2/L24.
- Mandt et al. [2012] Mandt, K.E., Waite, J.H., Teolis, B., Magee, B.a., Bell, J., Westlake, J.H., Nixon, C.a., Mousis, O., Lunine, J.I., 2012. The 12C/13C ratio on Titan from Cassini INMS measurements and implications for the evolution of methane. The Astrophysical Journal 749. doi:10.1088/0004-637X/749/2/160.
- Marounina et al. [2015] Marounina, N., Tobie, G., Carpy, S., Monteux, J., Charnay, B., Grasset, O., 2015. Evolution of Titan’s atmosphere during the Late Heavy Bombardment. Icarus 257, 324--335. doi:10.1016/j.icarus.2015.05.011.
- Matson et al. [2007] Matson, D.L., Castillo, J.C., Lunine, J., Johnson, T.V., 2007. Enceladus’ plume: Compositional evidence for a hot interior. Icarus 187, 569--573. doi:10.1016/j.icarus.2006.10.016.
- McCord et al. [2008] McCord, T.B., Hayne, P., Combe, J.P., Hansen, G.B., Barnes, J.W., Rodriguez, S., Le Mouélic, S., Baines, E.K.H., Buratti, B.J., Sotin, C., Nicholson, P., Jaumann, R., Nelson, R., the Cassini VIMS Team, 2008. Titan’s surface: Search for spectral diversity and composition using the Cassini VIMS investigation. volume 194. doi:10.1016/j.icarus.2007.08.039.
- McKay et al. [2003] McKay, C.P., Hand, K.P., Doran, P.T., Andersen, D.T., Priscu, J.C., 2003. Clathrate formation and the fate of noble and biologically useful gases in Lake Vostok, Antarctica. Geophysical Research Letters 30, 1702. doi:10.1029/2003GL017490.
- McKay et al. [1988] McKay, C.P., Scattergood, T., Pollack, J.B., Borucki, W.J., Van Ghyseghem, H.T., 1988. High-temperature shock formation of N2 and organics on primordial Titan. Nature 332, 520--522.
- Miller [1974] Miller, S.L., 1974. The Nature and Occurrence of Clathrate Hydrates. Springer US, Boston, MA. pp. 151--177. doi:10.1007/978-1-4684-2757-8_10.
- Monteux et al. [2014] Monteux, J., Tobie, G., Choblet, G., Le Feuvre, M., 2014. Can large icy moons accrete undifferentiated? Icarus 237, 377--387. doi:10.1016/j.icarus.2014.04.041.
- Mousis et al. [2009] Mousis, O., Lunine, J.I., Thomas, C., Pasek, M., Marbœuf, U., Alibert, Y., Ballenegger, V., Cordier, D., Ellinger, Y., Pauzat, F., et al., 2009. Clathration of volatiles in the solar nebula and implications for the origin of titan’s atmosphere. The Astrophysical Journal 691, 1780.
- Müller et al. [1988] Müller, G., Bender, E., Maurer, G., 1988. Das Dampf-Flüssigkeitsgleichgenwicht des ternären Systems Ammoniak-Kohlendioxid-Wasser bei hohen Wassergehalten im Bereich zwischen 373 un 474 Kelvin. Berichte der Bunsengesellschaft für Physikalische Chemie 92, 148--160.
- Mumma and Charnley [2011] Mumma, M.J., Charnley, S.B., 2011. The Chemical Composition of Comets -- Emerging Taxonomies and Natal Heritage. Annual Review of Astronomy and Astrophysics 49, 471--524. doi:10.1146/annurev-astro-081309-130811.
- Nicolaisen et al. [1993] Nicolaisen, H., Rasmussen, P., Sørensen, J.M., 1993. Correlation and prediction of mineral solubilities in the reciprocal salt system (Na+, K+)(Cl-, SO2-4)-H2O at 0-100°C. Chemical Engineering Science 48, 3149--3158. doi:10.1016/0009-2509(93)80201-Z.
- Niemann et al. [2005] Niemann, H.B., Atreya, S.K., Bauer, S.J., Carignan, G.R., Demick, J.E., Frost, R.L., Gautier, D., Haberman, J.A., Harpold, D.N., Hunten, D.M., Israel, G., Lunine, J.I., Kasprzak, W.T., Owen, T.C., Paulkovich, M., Raulin, F., Raaen, E., Way, S.H., 2005. The abundances of constituents of Titan’s atmosphere from the GCMS instrument on the Huygens probe. Nature 438, 779--784. doi:10.1038/nature04122.
- Niemann et al. [2010] Niemann, H.B., Atreya, S.K., Demick, J.E., Gautier, D., Haberman, J.a., Harpold, D.N., Kasprzak, W.T., Lunine, J.I., Owen, T.C., Raulin, F., 2010. Composition of Titan’s lower atmosphere and simple surface volatiles as measured by the Cassini-Huygens probe gas chromatograph mass spectrometer experiment. Journal of Geophysical Research 115, E12006. doi:10.1029/2010JE003659.
- Owen et al. [2006] Owen, T.C., Niemann, H., Atreya, S., Zolotov, M.Y., 2006. Between heaven and Earth: the exploration of Titan. Faraday Discussions 133, 387--391. doi:10.1039/b517174a.
- Pazuki et al. [2006] Pazuki, G., Pahlevanzadeh, H., Ahooei, A.M., 2006. Prediction of phase behavior of co 2--nh 3--h 2 o system by using the uniquac-non random factor (nrf) model. Fluid phase equilibria 242, 57--64.
- Peng and Robinson [1976] Peng, D.Y., Robinson, D.B., 1976. A New Two-Constant Equation of State. Industrial & Engineering Chemistry Fundamentals 15, 59--64. doi:10.1021/i160057a011.
- Prausnitz [1963] Prausnitz, J., 1963. Thermodynamic representation of high-pressure vapour-liquid equilibria. Chemical Engineering Science 18, 613--630.
- Prausnitz et al. [1998] Prausnitz, J., Lichtenthaler, R., de Azevedo, E., 1998. Molecular Thermodynamics of Fluid-Phase Equilibria. Prentice Hall international series in the physical and chemical engineering sciences, Prentice-Hall PTR.
- Prinn and Fegley Jr [1981] Prinn, R.G., Fegley Jr, B., 1981. Kinetic inhibition of co and n2 reduction in circumplanetary nebulae-implications for satellite composition. The Astrophysical Journal 249, 308--317.
- Rousselot et al. [2013] Rousselot, P., Pirali, O., Jehin, E., Vervloet, M., Hutsemékers, D., Manfroid, J., Cordier, D., Martin-Drumel, M.A., Gruet, S., Arpigny, C., Decock, A., Mousis, O., 2013. Toward a Unique Nitrogen Isotopic Ratio in Cometary Ices. The Astrophysical Journal Letters 780, L17. doi:10.1088/2041-8205/780/2/L17.
- Rumpf and Maurer [1993a] Rumpf, B., Maurer, G., 1993a. An experimental and theoretical investigation on the solubility of carbon dioxide in aqueous solutions of strong electrolytes. Berichte der Bunsengesellschaft fuer physikalische chemie 97, 85--97.
- Rumpf and Maurer [1993b] Rumpf, B., Maurer, G., 1993b. Solubility of ammonia in aqueous solutions of sodium sulfate and ammonium sulfate at temperatures from 333.15 k to 433.15 k and pressures up to 3 mpa. Industrial & engineering chemistry research 32, 1780--1789.
- Sander et al. [1986] Sander, B., Rasmussen, P., Fredenslund, A., 1986. Calculation of vapour-liquid equilibria in nitric acid-water-nitrate salt systems using an extended UNIQUAC equation. Chemical engineering science 41, 1185--1195.
- Sekine et al. [2011] Sekine, Y., Genda, H., Sugita, S., Kadono, T., Matsui, T., 2011. Replacement and late formation of atmospheric N2 on undifferentiated Titan by impacts. Nature Geoscience 4, 359--362. doi:10.1038/NGEO1147.
- Shinnaka et al. [2014] Shinnaka, Y., Kawakita, H., Kobayashi, H., Nagashima, M., Boice, D.C., 2014. 14NH2/15NH2 Ratio in Comet C/2012 S1 (Ison) Observed During Its Outburst in 2013 November. The Astrophysical Journal 782, L16. doi:10.1088/2041-8205/782/2/L16.
- Sloan and Koh [2008] Sloan, D., Koh, C.A., 2008. Clathrate Hydrates of Natural Gases, 3rd edition. CRC Press.
- Smolen et al. [1991] Smolen, T.M., Manley, D.B., Poling, B.E., 1991. Vapor-Liquid Equilibrium Data for the Ammonia-water System and Its Description with a Modified Cubic Equation of State. Journal of Chemical & Engineering Data 36, 202--208. doi:10.1021/je00002a017.
- Spycher et al. [2003] Spycher, N., Pruess, K., Ennis-King, J., 2003. CO2-H2O mixtures in the geological sequestration of CO2. I. Assessment and calculation of mutual solubilities from 12 to 100°C and up to 600 bar. Geochimica et Cosmochimica Acta 67, 3015--3031. doi:10.1016/S0016-7037(03)00273-4.
- Thomsen [2005] Thomsen, K., 2005. Modeling electrolyte solutions with the extended universal quasichemical (UNIQUAC) model. Pure and Applied Chemistry 77, 531--542. doi:10.1351/pac200577030531.
- Thomsen and Rasmussen [1999] Thomsen, K., Rasmussen, P., 1999. Modeling of vapor–-liquid-–solid equilibrium in gas–-aqueous electrolyte systems. Chemical Engineering Science 54, 1787--1802. doi:10.1016/S0009-2509(99)00019-6.
- Tobie et al. [2012] Tobie, G., Gautier, D., Hersant, F., 2012. Titan’S Bulk Composition Constrained By Cassini-Huygens : Implication for Internal Outgassing. The Astrophysical Journal 752, 125. doi:10.1088/0004-637X/752/2/125.
- Tobie et al. [2013] Tobie, G., Lunine, J., Monteux, J., Mousis, O., Nimmo, F., 2013. The origin and evolution of titan. Titan: Interior, Surface, Atmosphere and Space Environment , 24--55.
- Tobie et al. [2006] Tobie, G., Lunine, J.I., Sotin, C., 2006. Episodic outgassing as the origin of atmospheric methane on Titan. Nature 440, 61--64. doi:10.1038/nature04497.
- Van Krevelen et al. [1949] Van Krevelen, D.W., Hoftijzer, P.J., Huntjens, F.J., 1949. Composition and vapour pressures of aqueous solutions of ammmonia, carbon dioxide and hydrogen sulphide. Recueil des Travaux Chimiques des Pays-Bas 68, 191--216. doi:10.1002/recl.19490680213.
- Verbrugge [1973] Verbrugge, P., 1973. Vapour-liquid equilibria of the ammonia-carbon dioxide-water system. Ph.D. thesis.
- Waite et al. [2017] Waite, J.H., Glein, C.R., Perryman, R.S., Teolis, B.D., Magee, B.A., Miller, G., Grimes, J., Perry, M.E., Miller, K.E., Bouquet, A., Lunine, J.I., Brockwell, T., Bolton, S.J., 2017. Cassini finds molecular hydrogen in the enceladus plume: Evidence for hydrothermal processes. Science 356, 155--159. doi:10.1126/science.aai8703.
- Wilson and Atreya [2004] Wilson, E.H., Atreya, S.K., 2004. Current state of modeling the photochemistry of Titan’s mutually dependent atmosphere and ionosphere. Journal of Geophysical Research 109, E06002. doi:10.1029/2003JE002181.
- Yelle et al. [2008] Yelle, R., Cui, J., Müller-Wodarg, I., 2008. Methane escape from Titan’s atmosphere. Journal of Geophysical Research: Planets 113.
- Zolotov [2007] Zolotov, M.Y., 2007. An oceanic composition on early and today’s Enceladus. Geophysical Research Letters 34, 1--5. doi:10.1029/2007GL031234.