MHD stability analysis of ideal wall modes for CFETR upgrade phase-I scenario using NIMROD
Abstract
Ideal MHD stability of China Fusion Engineering Test Reactor (CFETR) upgrade phase-I baseline scenario has been evaluated using the initial value code NIMROD. The toroidal mode numbers for n=1-30 have been considered for stability analysis both in single-fluid and two-fluid MHD models. Our calculation rusults show that all modes are found to be unstable with characteristics of edge-localized modes. For n 13 modes, two-fluid MHD model gives a slightly higher growth rates than single-fluid MHD model, while for n 13 modes, this trend becomes opposite, which means two-fluid MHD model is needed for high-n mode analysis. In addition, modes are found to be more unstable with increasing wall position and eventually their growth rates approach values in the no-wall limit.
I Introduction
The China Fusion Engineering Test Reactor (CFETR) project has been proposed for conducting experiments in plasma regimes of the future fusion reactor Song et al. (2014); Chan et al. (2015). The dual purpose of performing long duration steady state operation with conservative physics parameters as well as demonstrating high end fusion power gain has led to the design of the latest scenario larger in dimension than that of ITER. This project is envisioned to resolve many advanced issues such as DEMO blanket and divertor solution, advancement of remote-handling facilities for maintaining in-vessel components, performance of high annual duty factor of , demonstration of tritium self-sufficiency with target tritium breeding ratio greater than one. The upgraded CFETR design has two phases having same geometrical parameters: the phase-I is designed to have more restricted stable parameter regimes with a target to yield less fusion power () , whereas phase-II is more reactor-like to demonstrate high fusion power GW with gain .
Due to the planned requirements of high beta and high value of non-inductive bootstrap current fraction in CFETR, both pressure driven and current driven modes are likely to be excited. The requirement of moderate (Phase-I) to high fusion power gain (phase-II) in CFETR, would require higher pedestal top pressure value resulting in a steeper gradient in pressure profile near to last closed surface. The aim to operate CFETR in nearly fully non-inductive regime, has proposed requirement of of bootstrap current at phase-I and at phase-II. These essential requirements are expected to lead to the excitation of ideal MHD edge localized peeling-ballooning modes or ELMs. For machines at future reactor scale, the sizes of ELMs are likely to be larger than the observations in currently operating medium sized tokamaks like EAST Li et al. (2013). The repetitive expulsion of stored plasma energy and particles outside of magnetic confined domain would lead to continuous degradation of fusion power and high damaging heat loads onto divertor and first wall components.
This article reports the results of analysis of ideal modes for CFETR phase-I scenario using both single-fluid and two-fluid models implemented in the extended MHD initial value code NIMROD Sovinec et al. (2004). This baseline case is found to be unstable for edge localized modes with toroidal mode numbers . In addition, we have studied the effects of wall position. All n-modes are found to be less unstable when the wall gets closer to the plasma boundary, and they will be well stabilized inside a particular wall position.
The rest of this paper is organized as follows. Section II introduces the CFETR phase-I baseline equilibrium. Section III describes MHD model in NIMROD with the MHD equations considered. In Section IV, we present the numerical results in details. Finally, the main points are summarized and conclusion is drawn in Section V.
II CFETR Upgrade Phase-I Equilibrium
Both 0-D and 1.5D transport simulation methods have led to the latest phase of design. In 2014-15, different 0-D system codes were employed to provide initial phases of design with relatively smaller size plasma and more conservative target of fusion power as a starting point Wan et al. (2014); Chan et al. (2015). Later, more advanced scenarios have been designed for more optimized parameters including plasma size, normalized beta, projected fusion power gain and bootstrap power drive fraction Shi et al. (2016). Besides 0-D calculation, 1.5D integrated modeling has been used to explore these scenarios as described in recent article Jian et al. (2017). Now the immediate issue to address is whether these equilibrium profiles are stable or not in terms of the most dominant ideal and non-ideal MHD modes.
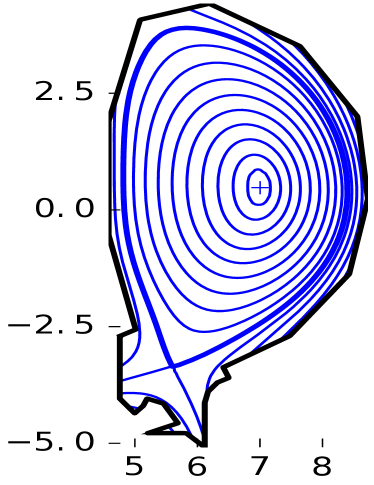
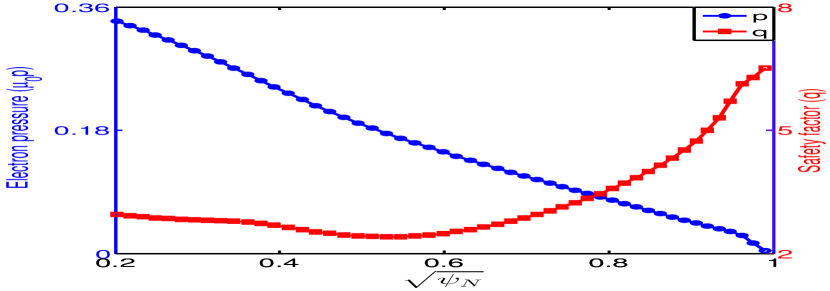
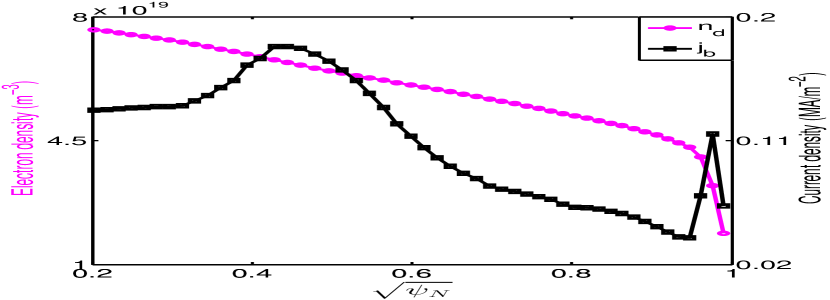
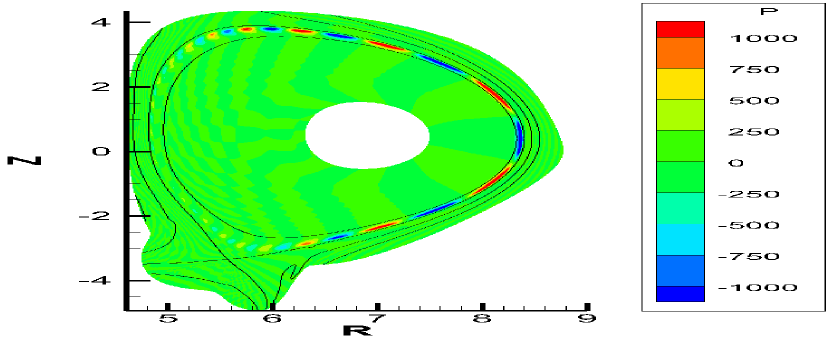
We consider the CFETR upgrade phase-I equilibrium with major radius 6.6m and minor radius 1.8m, as shown in Fig.1. This equilibrium has self-consistently been generated through transport modelling in the OMFIT framework Meneghini et al. (2015, 2016) using the auxiliary heating schemes such as neutral beam injection (NBI) and electron cyclotron wave (ECH, ECCD). As phase-I case is not designed for high fusion gain, the normalized is set to be , which is meant to ensure this equilibrium away from stability limits, e.g. below than no wall beta limit of , where is the plasma inductance. However, steep pressure gradient and high bootstrap current fraction at the edge pedestal may lead to the excitation of ELMs (Fig.2).
III Extended MHD Model in NIMROD
We use the NIMROD code Sovinec et al. (2004) for our stability analysis. The MHD equations used in our NIMROD calculations are:
| (1) |
| (2) |
| (3) |
| (4) |
| (5) |
where u is the center-of-mass flow velocity, the particle density, the ion mass, the combined pressure of electron () and ion (), the resistivity, and the ion stress tensor. The initial value NIMROD code has been broadly applied to studying different ideal and non-ideal MHD processes in both fusion and space plasmas Burke et al. (2010); King et al. (2016); Zhu and Raeder (2013).
Unlike the true vacuum model (i.e. no particle or current) used in the ideal MHD eigenvalue codes such as ELITE and AEGIS, NIMROD uses a vacuum-like halo region to model free boundary modes. The halo region is specified as a region with a low temperature, low density plasma, in contrast to the high density, high temperature plasma in the core region Burke et al. (2010). This modeling is more physically relevant in the sense that the region between the plasma separatrix and vacuum vessel usually consists of relatively cold plasma.
The Spitzer resistivity model is used in our simulation. The resistivity along the magnetic field takes the form Kuritsyn et al. (2006); Trintchouk et al. (2003); Zarnstorff et al. (1990):
| (6) |
where is the electron temperature, is the effective ionic charge, is the Coulomb logarithm. The crossfield or transverse resistivity is approximately twice as large as the parallel resistivity, i.e. .
IV Ideal MHD Stability Analysis Results
Stability analysis of CFETR upgrade phase-I scenario equilibrium has been carried out using NIMROD code in the context of extended-MHD model. First, linear stability of toroidal modes has been calculated based on single-fluid MHD and Spitzer resistivity models. Then the same calculation is extended including two-fluid and finite Larmor radius effects. The wall is considered to be perfectly conducting throughout this calculation and the influence of wall position on the stability of MHD modes has been investigated. The detailed results of single-fluid and two-fluid MHD stability analysis are presented in the following two subsections.
IV.1 Comparison of results from single-fluid and two-fluid MHD models
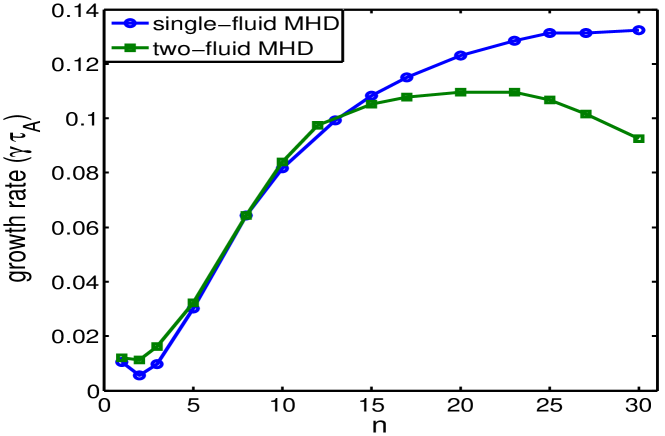
Our NIMROD calculation of CFETR baseline equilibrium introduced in previous section, finds the excitation of peeling-ballooning modes localized in the edge pedestal region. All the toroidal mode numbers ranging are found to have finite growth rate at the proposed CFETR ideal wall position at , where is the distance of wall from magnetic axis and the minor radius of plasma. However, no excitation of internal modes covering the core region of plasma is seen in the mode structure. Linear analysis shows the monotonous character of growth rate for n 2 modes in single-fluid MHD model as shown with blue line in Fig.3, while the growth rate of n = 1 mode is little higher than that of n=2 mode, where the growth rates are normalized with the Alfvénic time .
For further study, we have employed two-fluid MHD model where two-fluid (i.e. Hall and electron diamagnetic effects) and finite Larmour radius effects are added to the single-fluid MHD model in our calculation to see the change in MHD growth rates and modes structure. The comparison of growth rates of between results from single-fluid and two-fluid MHD are shown in Fig. 3. The difference varies in different range of toroidal mode numbers. Overall a slight increase in growth rate is noticed for the low-n modes with due to two-fluid effects, whereas the intermediate modes with have similar growth rates in both models. A clear stabilizing role of two-fluid correction terms have been observed for the modes with . The higher the toroidal mode number is, the stronger is the stabilizing effect from two-fluid MHD models. For the mode with , about reduction in growth rate is calculated.
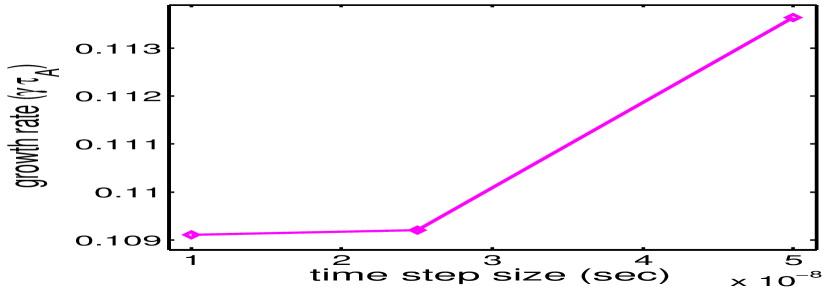
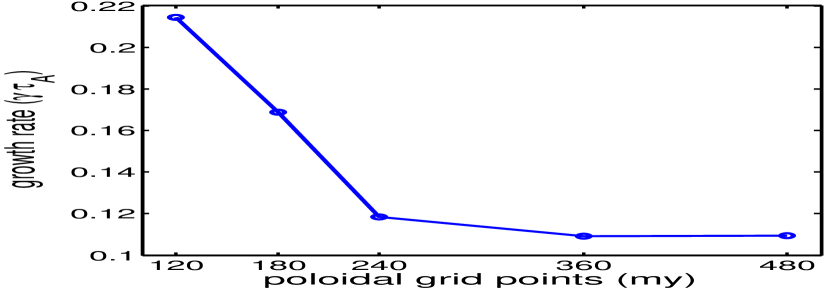
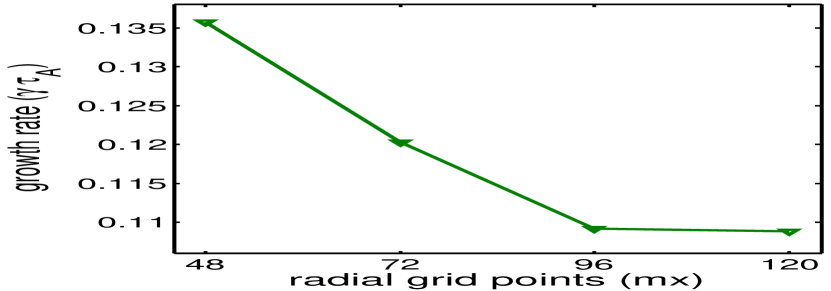
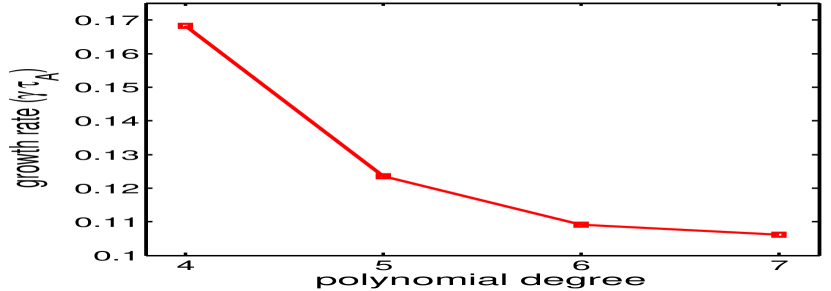
Convergence test has been carried out for time step size, poloidal grid points, radial grid points and polynomial degree of finite element basis used in NIMROD calculation, and the n=20 mode case is shown in Fig. 4 for example. The growth rate of mode reaches convergence when the time step size decreases from to , the poloidal grid number increases from 360 to 480, and the radial grid number increases from 96 to 120. Although there is small difference in growth between polynomial degree 6 and 7, the relative change (() in growth rate is about 2.7% . These results indicate that the key numerical parameters used in our simulations are well within the converged regimes.
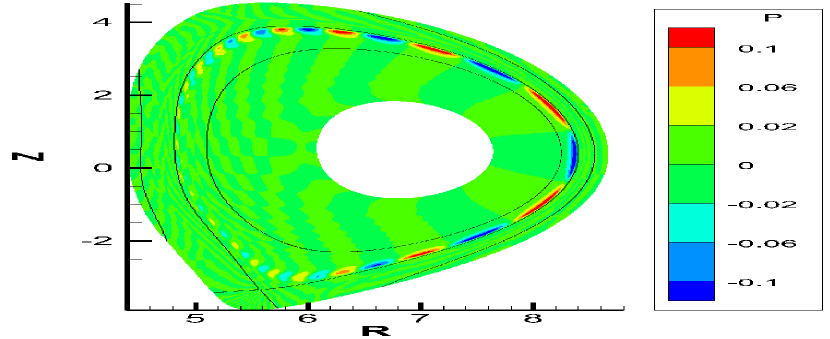
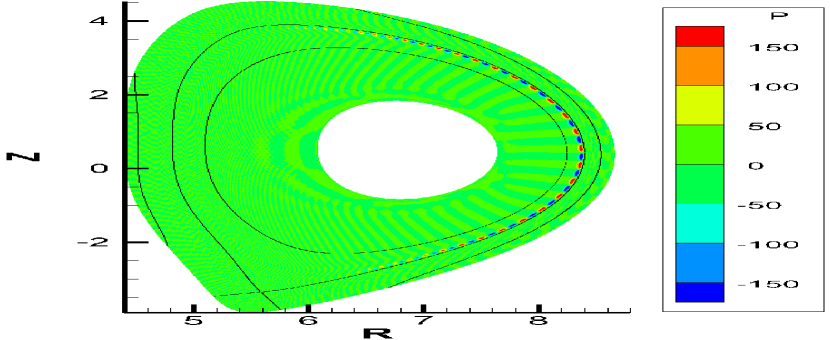
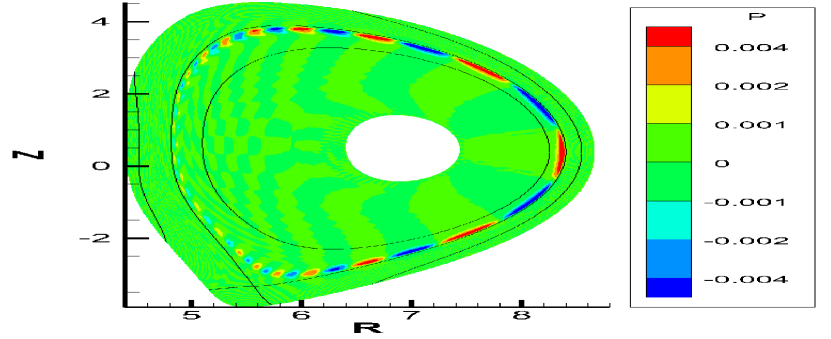
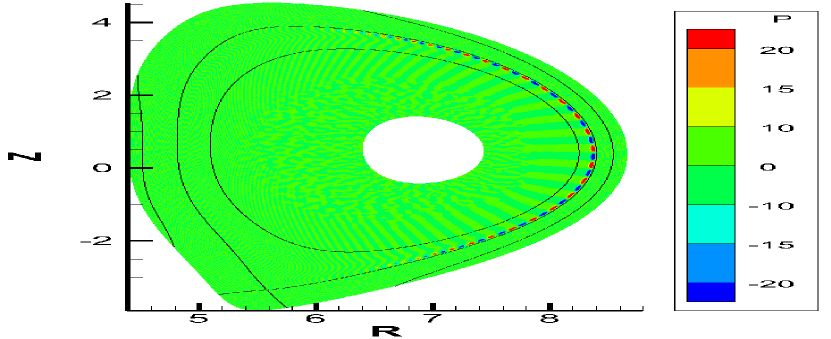
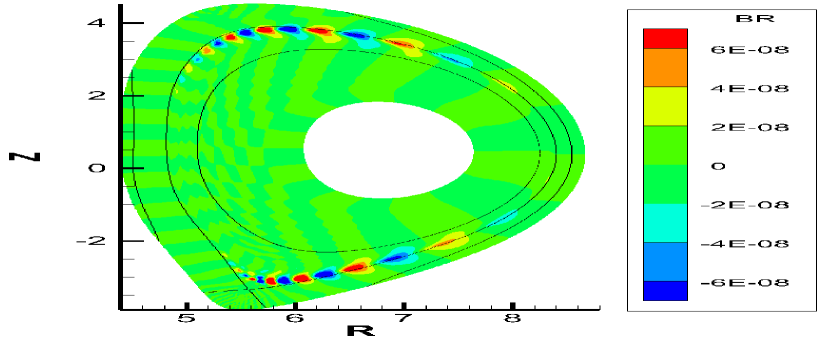
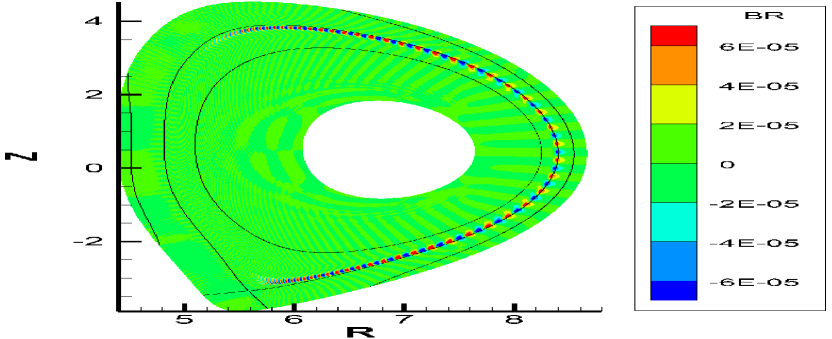
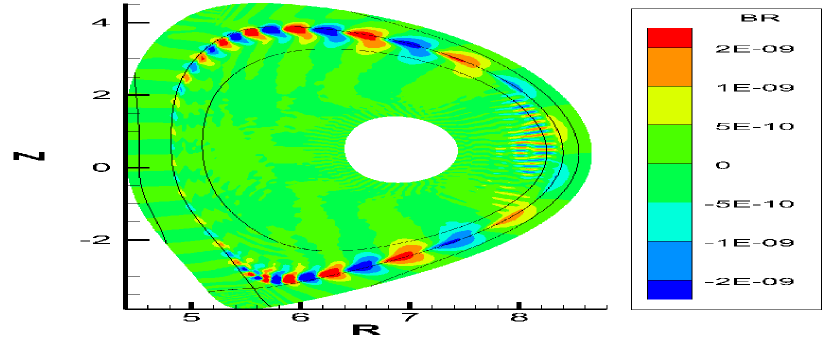
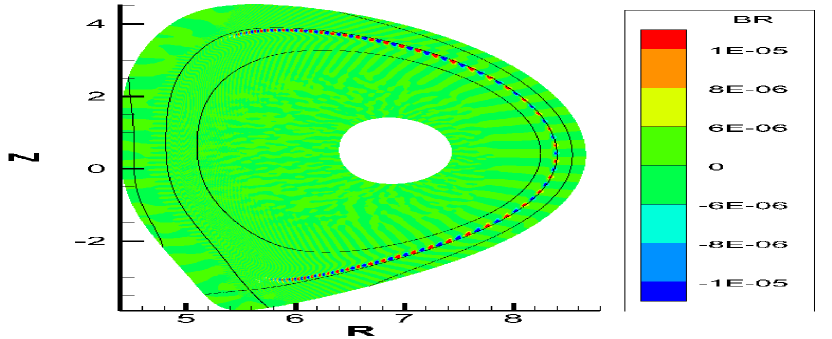
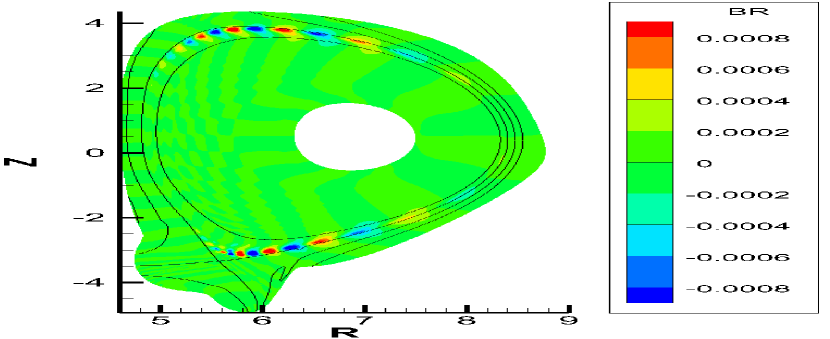
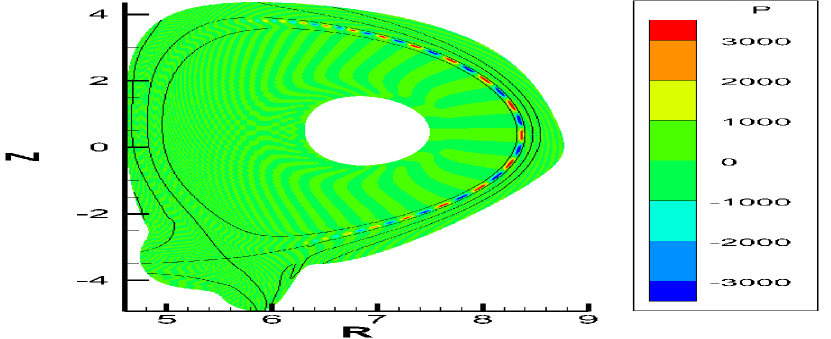
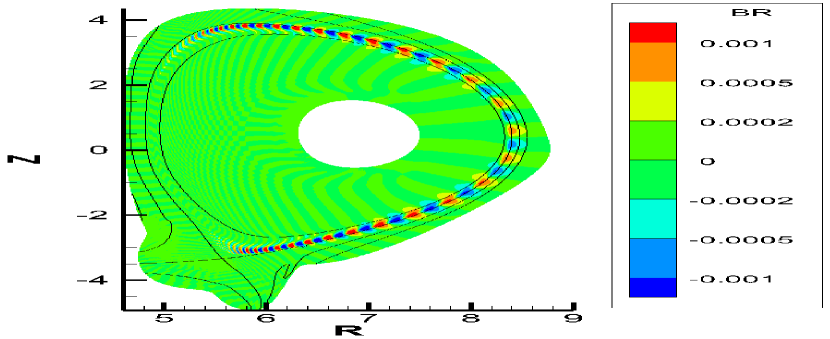
The detailed structure of modes and for both single-fluid and two-fluid MHD models are generated. The perturbed pressure (Fig.5) and the radial component of magnetic field (Fig.6) are plotted in the poloidal plane, where the dark contour lines of poloidal magnetic flux function in each plot show the locations of separatrices. All these modes are very close to the separatrix from inside in the pedestal region and show features of the peeling-ballooning mode structures.
IV.2 Wall stabilization effects
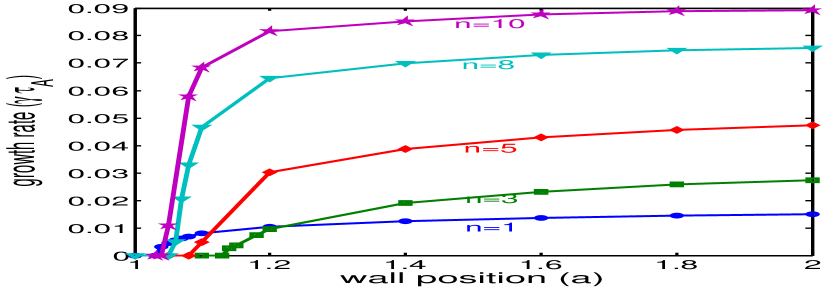
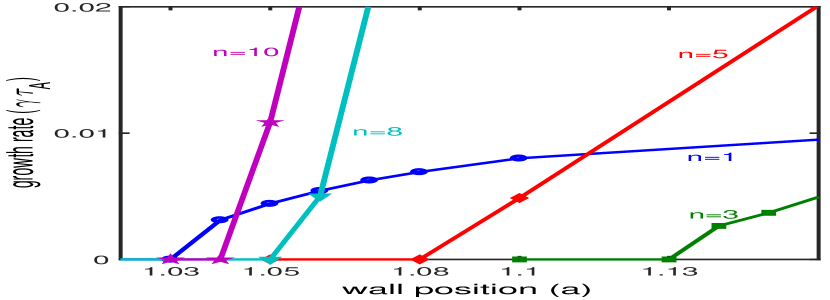
To illustrate the wall position effects and provide physics base for the engineering design on the optimal choice of wall position of CFETR, we calculate the growth rates of low- modes () with wall position varying from to sequentially. Single-fluid MHD model is used for calculation because two-fluid effects on low- modes are very weak. The wall is set to be ideal, fully conducting and conformal to the plasma edge shape in our calculation. The main results are summarized in Fig.7. The growth rate initially increase as the wall position increases from to , then becomes constant as for the considered modes.
As expected, these modes become less unstable when wall position gets closer to the plasma boundary. They become fully stabilized when wall position is within certain but different radius respectively. Specifically, mode is stabilized at , mode at , mode at , mode at and mode at for example. It should be noted that in reality the wall is not perfectly conducting, it could bring in another essential instability such as resistive wall mode (RWM) Ward and Bondeson (1995).
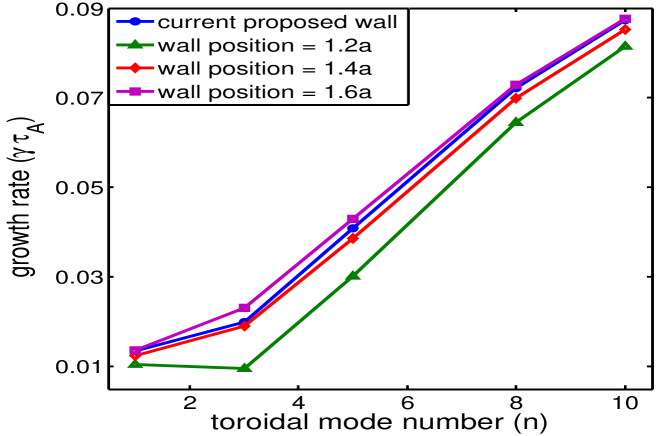
In addition, considering recently proposed wall of CFETR configuration, the growth rates of modes have also been carried out in single-fluid MHD model. These results are summarized in Fig.8. Three different self-similar wall positions with and are shown along with proposed wall shape. The growth rates of modes are almost same for the self-similar wall at , while those of modes are very close to the self-similar wall at . The perturbed pressure and radial component of perturbed magnetic field contour plots of CFETR proposed wall configuration are shown in Fig.9, which indicates that wall configuration has little effect on the edge localized mode structure.
V Summary & Discussions
In summary, stability of CFETR upgrade phase-I scenario has been studied in context of ideal MHD analysis in single-fluid and two fluid MHD models. The initial-boundary value full MHD code NIMROD is employed to analyze the stability of modes numerically. It is predicted that all ideal MHD modes are unstable but edge localized in nature based on the single-fluid MHD model. No global core ideal MHD modes like internal kink mode is found to be dominantly unstable. In the two-fluid MHD analysis, all modes remain unstable and localized at the pedestal region. A clear yet weak effect of two-fluid stabilization on high- modes is noted, where all modes with have lower growth rates in two-fluid than in single-fluid MHD models. For modes with , two-fluid effects have little, if any, influence on the growth rates. Overall, the two-fluid stabilization is less than expected from the comentional local dispersion relation.
In addition, we have studied the wall position effects. The modes are found to be more unstable with increasing wall position from plasma and finally the growth rates of these modes approach the no wall limit value. On the other hand, growth rates decrease as the wall position becomes closer to plasma boundary, and all modes can be fully stabilized when the wall becomes sufficiently close. Taking the proposed wall of CFETR configuration into consideration, we have found the growth rates of modes are very close to those in the self-semilar wall cases at and .
On basis of our analysis, we conclude that the upgrade phase-I scenario of CFETR will not become dominantly unstable for global ideal MHD modes. Such a design might help avoid disruption event caused by ideal MHD instabilities. But, due to steep pedestal gradient and peaked edge current, this scenario can suffer from medium to large size ELMs and the characteristics of ELMs need to be determined from nonlinear simulation. The stable position of conducting wall is too close to plasma boundary to be a viable scheme for avoiding ELMs. To achieve long duration of steady state operation maintaining fixed , efficient schemes for ELM control are necessary. Among those schemes, the toroidal flow shear has been found influential on transforming large type-I ELMs to grassy ELMs in experiments on present tokamaks. The toroidal rotation with self-consistent equilibrium pressure and density profiles will be considered in our next evaluation of the linear stability of all toroidal modes. Finally, nonlinear simulation will be performed to quantify ELM frequency and heat flux to divertor plates and plasma facing components.
Acknowledgements.
The research was supported by the National Magnetic Confinement Fusion Program of China under Grant Nos. 2014GB124002, 2015GB101004, and the 100 Talent Program of the Chinese Academy of Sciences (CAS). Author D. B. is partially supported by CAS President International Fellowship Initiative (PIFI). Author P. Zhu also acknowledges the supports from U.S. DOE grant Nos. DE-FG02-86ER53218 and DE-FC02- 08ER54975. We are grateful for the support from the NIMROD team. This research used the computing resources from the Supercomputing Center of University of Science and Technology of China, and the National Energy Research Scientific Computing Center, a DOE Office of Science User Facility supported by the Office of Science of the U.S. Department of Energy under Contract No. DE-AC02-05CH11231.References
- Song et al. (2014) Y. T. Song, S. T. Wu, J. G. Li, B. N. Wan, Y. X. Wan, P. Fu, M. Y. Ye, J. X. Zheng, K. Lu, X. Gao, S. M. Liu, X. F. Liu, M. Z. Lei, X. B. Peng, and Y. Chen, IEEE Transactions on Plasma Science 42, 503 (2014).
- Chan et al. (2015) V. Chan, A. Costley, B. Wan, A. Garofalo, and J. Leuer, Nuclear Fusion 55, 023017 (2015).
- Li et al. (2013) J. G. Li, H. Y. Guo, B. N. Wan, X. Z. Gong, Y. F. Liang, G. S. Xu, K. F. Gan, J. S. Hu, H. Q. Wang, L. Wang, L. Zeng, Y. P. Zhao, P. Denner, G. L. Jackson, A. Loarte, R. Maingi, J. E. Menard, M. Rack, and X. L. Zou, Nature Phys. 9, 817 (2013).
- Sovinec et al. (2004) C. Sovinec, A. Glasser, T. Gianakon, D. Barnes, R. Nebel, S. Kruger, D. Schnack, S. Plimpton, A. Tarditi, and M. Chu, Journal of Computational Physics 195, 355 (2004).
- Wan et al. (2014) B. Wan, S. Ding, J. Qian, G. Li, B. Xiao, and G. Xu, IEEE Transactions on Plasma Science 42, 495 (2014).
- Shi et al. (2016) N. Shi, V. S. Chan, Y. X. Wan, J. G. Li, X. Gao, and M. Y. Ye, Fusion Eng. Des. 112, 47 (2016).
- Jian et al. (2017) X. Jian, J. L. Chen, V. S. Chan, G. Zhuang, G. Q. Li, Z. Deng, N. Shi, G. L. Xu, G. M. Staebler, and W. F. Guo, Nucl. Fusion 57, 046012 (2017).
- Meneghini et al. (2015) O. Meneghini, S. Smith, L. Lao, O. Izacard, Q. Ren, J. Park, J. Candy, Z. Wang, C. Luna, V. Izzo, B. Grierson, P. Snyder, C. Holland, J. Penna, G. Lu, P. Raum, A. McCubbin, D. Orlov, E. Belli, N. Ferraro, R. Prater, T. Osborne, A. Turnbull, and G. Staebler, Nuclear Fusion 55, 083008 (2015).
- Meneghini et al. (2016) O. Meneghini, P. B. Snyder, S. P. Smith, J. Candy, G. M. Staebler, E. A. Belli, L. L. Lao, J. M. Park, D. L. Green, W. Elwasif, B. A. Grierson, and C. Holland, Physics of Plasmas 23, 042507 (2016).
- Burke et al. (2010) B. J. Burke, S. E. Kruger, C. C. Hegna, P. Zhu, P. B. Snyder, C. R. Sovinec, and E. C. Howell, Phys. Plasmas 17, 032103 (2010).
- King et al. (2016) J. R. King, A. Y. Pankin, S. E. Kruger, and P. B. Snyder, Physics of Plasmas 23, 062123 (2016).
- Zhu and Raeder (2013) P. Zhu and J. Raeder, Phys. Rev. Lett. 110, 235005 (2013).
- Kuritsyn et al. (2006) A. Kuritsyn, M. Yamada, S. Gerhardt, H. Ji, R. Kulsrud, and Y. Ren, Physics of Plasmas 13, 055703 (2006).
- Trintchouk et al. (2003) F. Trintchouk, M. Yamada, H. Ji, R. M. Kulsrud, and T. A. Carter, Physics of Plasmas 10, 319 (2003).
- Zarnstorff et al. (1990) M. C. Zarnstorff, K. McGuire, M. G. Bell, B. Grek, D. Johnson, D. McCune, H. Park, A. Ramsey, and G. Taylor, Physics of Fluids B: Plasma Physics 2, 1852 (1990).
- Ward and Bondeson (1995) D. J. Ward and A. Bondeson, Physics of Plasmas 2, 1570 (1995).