Deep learning analysis of the myocardium in coronary CT angiography for identification of patients with functionally significant coronary artery stenosis
Abstract
In patients with coronary artery stenoses of intermediate severity, the functional significance needs to be determined. Fractional flow reserve (FFR) measurement, performed during invasive coronary angiography (ICA), is most often used in clinical practice. To reduce the number of ICA procedures, we present a method for automatic identification of patients with functionally significant coronary artery stenoses, employing deep learning analysis of the left ventricle (LV) myocardium in rest coronary CT angiography (CCTA).
The study includes consecutively acquired CCTA scans of 166 patients who underwent invasive FFR measurements. To identify patients with a functionally significant coronary artery stenosis, analysis is performed in several stages. First, the LV myocardium is segmented using a multiscale convolutional neural network (CNN). To characterize the segmented LV myocardium, it is subsequently encoded using unsupervised convolutional autoencoder (CAE). As ischemic changes are expected to appear locally, the LV myocardium is divided into a number of spatially connected clusters, and statistics of the encodings are computed as features. Thereafter, patients are classified according to the presence of functionally significant stenosis using an SVM classifier based on the extracted features.
Quantitative evaluation of LV myocardium segmentation in 20 images resulted in an average Dice coefficient of and an average mean absolute distance between the segmented and reference LV boundaries of mm. Twenty CCTA images were used to train the LV myocardium encoder. Classification of patients was evaluated in the remaining 126 CCTA scans in 50 10-fold cross-validation experiments and resulted in an area under the receiver operating characteristic curve of . At sensitivity levels 0.60, 0.70 and 0.80, the corresponding specificity was 0.77, 0.71 and 0.59, respectively.
The results demonstrate that automatic analysis of the LV myocardium in a single CCTA scan acquired at rest, without assessment of the anatomy of the coronary arteries, can be used to identify patients with functionally significant coronary artery stenosis. This might reduce the number of patients undergoing unnecessary invasive FFR measurements.
keywords:
Functionally significant coronary artery stenosis , Convolutional autoencoder, Convolutional neural network, Fractional flow reserve , Coronary CT angiography, Deep learning1 Introduction
Obstructive coronary artery disease (CAD) is the most common type of heart disease [Mozaffarian et al., 2016]. Obstructive CAD occurs when one or more of the coronary arteries which supply blood to myocardium are narrowed owing to plaque buildup on the arteries’ inner walls, causing stenosis. Only functionally significant stenoses, i.e stenoses that significantly limit the blood flow to the myocardium and lead to myocardial ischemia need to be treated to reduce CAD morbidity [Pijls et al., 1996, Tonino et al., 2009, Pijls et al., 2010, van Nunen et al., 2015]. Conversely, treating stenoses that are not functionally significant leads to more harm than benefit [Pijls et al., 2010, 2013]. Therefore, it is important to assess the severity of coronary stenoses with respect to their impact on the myocardium.
To establish the functional significance of coronary ar-tery stenosis, patients undergo invasive coronary angiography (ICA). During ICA, fractional flow reserve (FFR), a quantitative marker of the functional significance of a stenosis [Pijls et al., 1996], is determined. FFR is determined as the ratio of the invasively measured pressure under maximal hyperemic conditions, distal to a stenosis, relative to the pressure before the stenosis. The ideal FFR value is 1.0. FFR is currently considered the reference standard to determine the significance of coronary stenoses and is used to decide on the treatment [Tonino et al., 2009]. Nevertheless, the FFR cut-off value that separates functionally significant from non-significant stenoses is not fully standardized: In clinical settings, cut-off values between 0.72 and 0.80 are commonly used [Pijls et al., 1996, De Bruyne et al., 2001, De Bruyne and Sarma, 2008, Petraco et al., 2013], where stenoses with FFR measurements below the cut-off value are defined as functionally significant. Coronary CT angiography (CCTA) is often used to identify patients with suspected CAD as it allows noninvasive detection of coronary artery stenosis [Budoff et al., 2008]. Even though CCTA detects CAD with high sensitivity, it has limited specificity in determining the functional significance of the detected stenosis [Meijboom et al., 2008, Bamberg et al., 2011, Ko et al., 2012]. Given the low specificity of CCTA, about 22-52% of patients undergo invasive FFR measurements unnecessarily [Ko et al., 2012]. To reduce the number of unnecessary invasive procedures, establishing FFR noninvasively, i.e. directly from CCTA images, and identifying the functionally significant stenoses has become an area of intensive research.
Thus far, the most successful and thoroughly evaluated noninvasive methods to determine the functional significance of coronary artery stenoses are based on the analysis of the blood flow through the coronary arteries. Taylor et al. [2013] proposed a noninvasive CT-derived FFR () measurement, that was evaluated by Min et al. [2012] and Nørgaard et al. [2014]. This technology employs computational fluid dynamics applied to CCTA scans to determine FFR values in the coronary tree and thereby determines the functional significance of a stenosis. However, requires accurate determination of the coronary artery tree geometry and the physiological boundary conditions. Hence, imaging artifacts such as blooming caused by large coronary calcifications, stents, and cardiac motion may compromise the accuracy of [Koo, 2014]. Itu et al. [2012] presented a technique to estimate FFR in the coronary artery tree using a CCTA scan by simulating blood flow, which was later evaluated by Renker et al. [2014] and Coenen et al. [2015]. The method uses a patient-specific parametric lumped heart model, while modeling the hemodynamics in both healthy and stenotic vessel tree. Additionally, the method combines anatomical, hemodynamic and functional information from medical image as well as other clinical observation. Nickisch et al. [2015] presented a technique to estimate FFR in the coronary artery tree using a CCTA scan by simulating blood flow using a patient-specific parametric lumped model. The authors modeled the coronary tree as an electrical circuit; volumetric flow rate was modeled as electrical current and pressure in the coronary artery as voltage. Using this analogy, the pressure in the coronary artery tree was simulated and FFR values were estimated within the coronary tree. While these techniques [Itu et al., 2012, Nickisch et al., 2015] achieved high accuracy and real-time feedback, they strongly depend on the accuracy of coronary artery tree segmentation and its centerline determination, like the method described by Taylor et al. [2013]. Manual delineation of the coronary artery centerline is a time consuming and cumbersome task, and most of the commercially available software packages occasionally require substantial manual interaction, especially in images with excessive atherosclerotic plaque or imaging artefacts [Schaap et al., 2009].
A number of approaches have been developed that do not rely on modeling the blood flow through the coronary arteries but exploit characteristics extracted from CCTA scans. For example, Steigner et al. [2010] presented a noninvasive approach to identify functionally significant coronary artery stenosis in a single CCTA scan using the transluminal attenuation gradient (TAG). TAG is defined as the gradient of the CT values attenuation along the artery lumen, and was shown to have a moderate positive correlation with the invasive FFR. However, like the method described by Nickisch et al. [2015] and Taylor et al. [2013], computing TAG requires an accurate determination of coronary artery centerlines. Furthermore, George et al. [2009] demonstrated that the comparison between myocardial regions imaged at rest and at stress may reveal myocardium perfusion defects that are caused by functionally significant coronary artery stenoses. This approach is interesting as it merges anatomical and functional information, obtained from CCTA scans. However, it requires acquisition of an additional CT scan which inevitably leads to a higher radiation dose, longer examination time, and injection of pharmacological stress agents. Xiong et al. [2015] presented a machine learning approach to classify patients with significant stenosis using myocardial characteristics derived from a single CCTA scan acquired at rest. The method automatically segments the left ventricle (LV) myocardium and aligns it with the standard 17-segments model [Cerqueira et al., 2002], which is used to relate a myocardial segment to its perfusing coronary artery. Supervised classification was employed to determine the significance of the evaluated stenosis based on three hand-crafted features describing each myocardial segment. Note that in this work stenosis was defined as significant based on the grade of the stenosis (with luminal narrowing) and not by its effect on myocardial perfusion. Contrary to FFR, the grade of stenosis, especially in the intermediate range 30%-70%, is not necessarily related to its functional significance [Tonino et al., 2009]. Han et al. [2017] employed the method described by Xiong et al. [2015] to classify patients with functionally significant stenosis according to the invasively measured FFR.
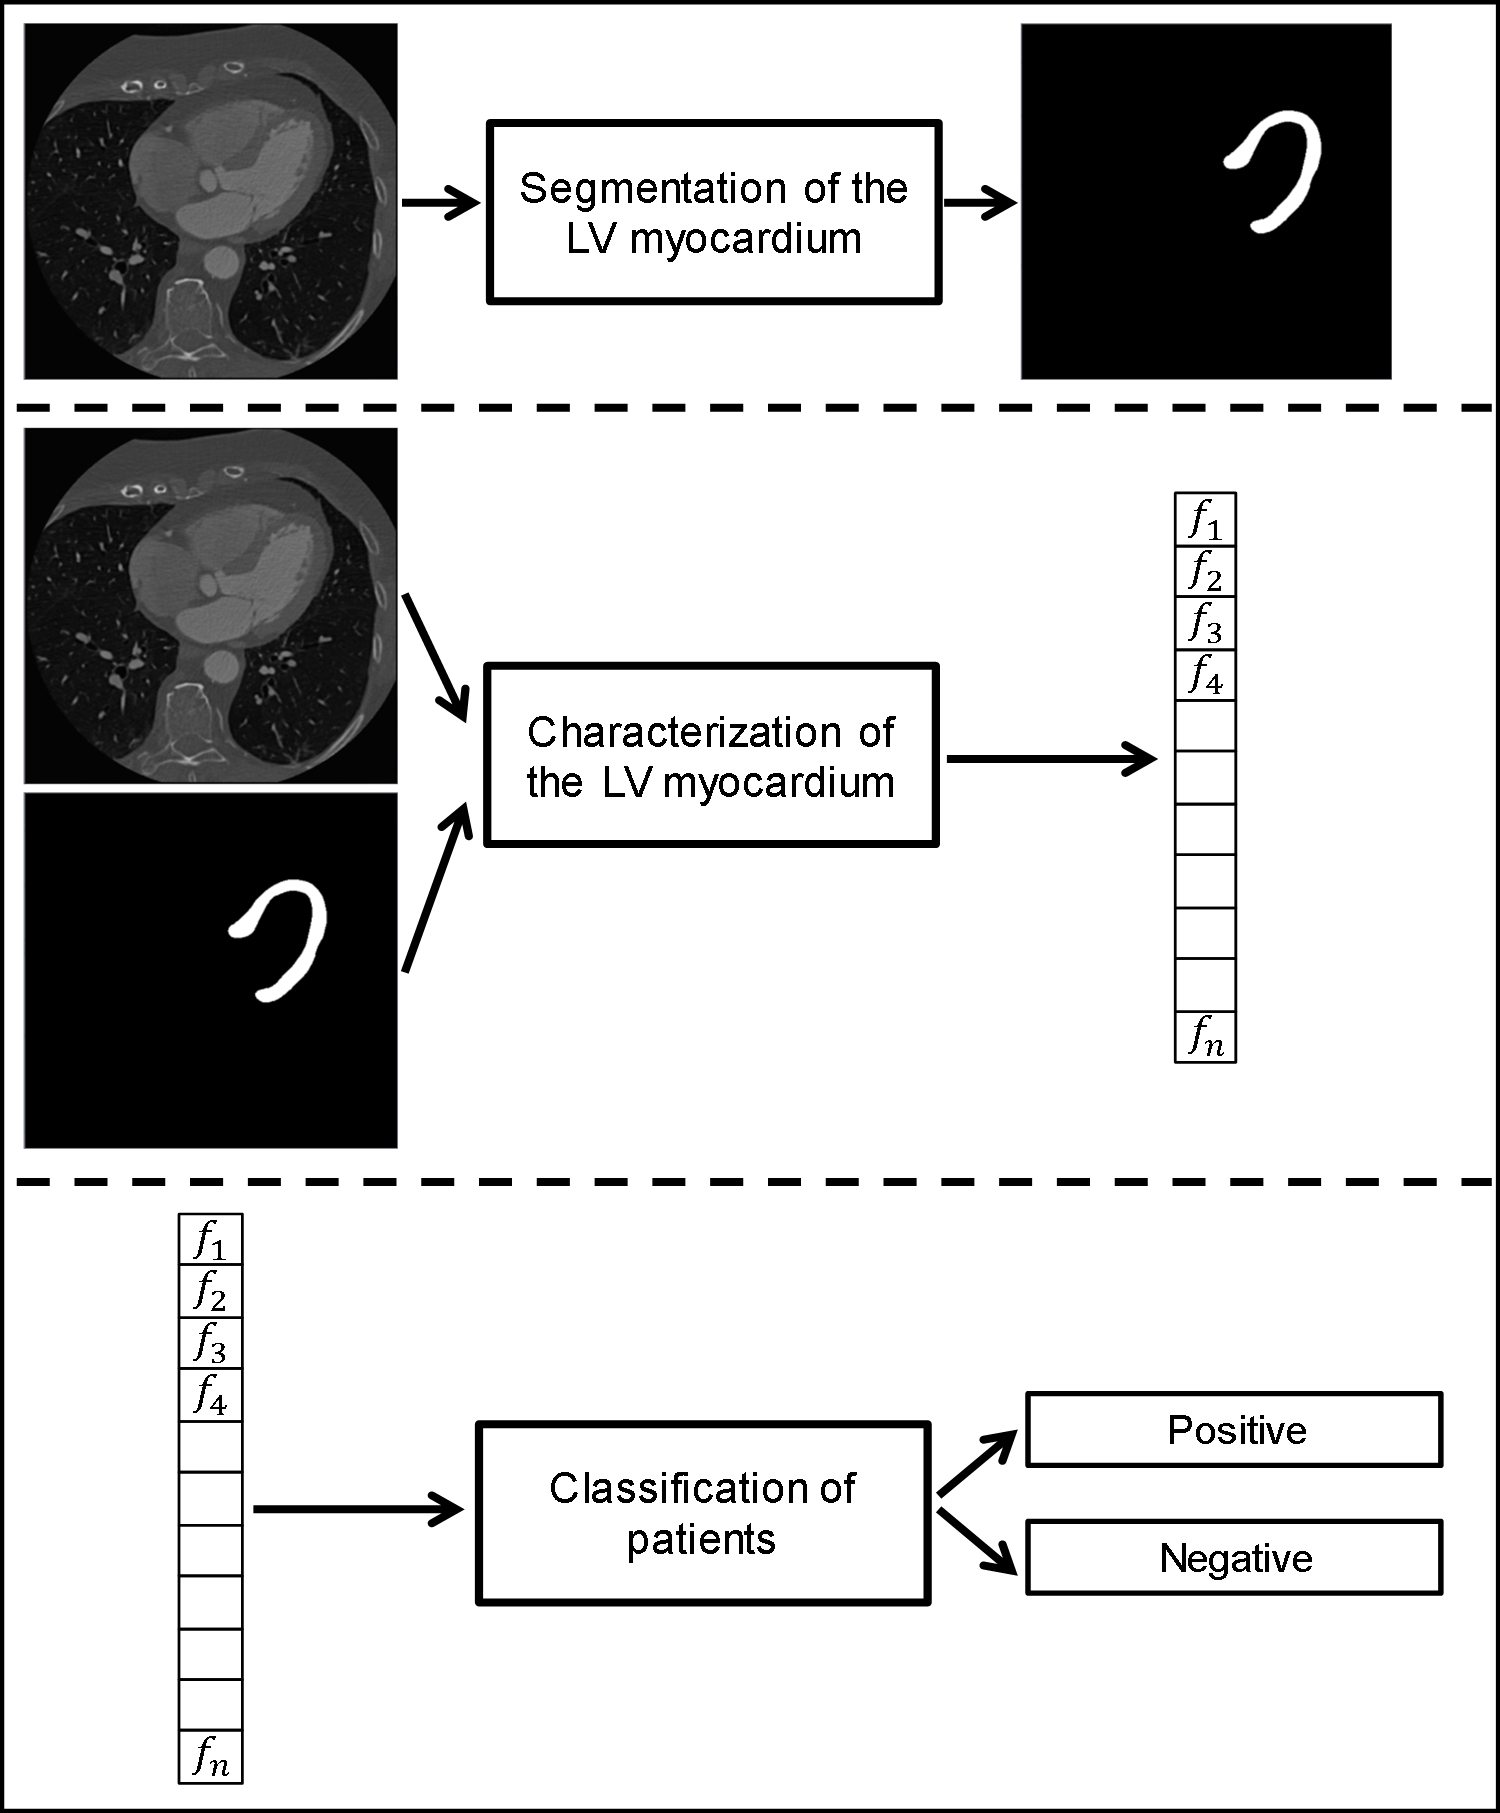
In this work, we present a novel method to identify patients with at least one functionally significant coronary artery stenosis in a single CCTA image acquired at rest. Given that obstruction of the blood flow in the coronaries may cause ischemia in the LV myocardium, only the myocardium is analyzed. This is in contrast to most methods that perform analysis of the coronary anatomy or stenosis and estimate the effect on the myocardium indirectly. In the proposed approach, deep learning, recently widely exploited in the analysis of medical images in a range of segmentation and detection tasks [Litjens et al., 2017, Shen et al., 2017, Zhou et al., 2017], is employed. First, the LV myocardium is segmented using a multiscale convolutional neural network (CNN). Then, characteristics of the LV myocardium are extracted using convolutional autoencoder (CAE) [Masci et al., 2011, Bengio et al., 2013]. Subsequently, using the extracted characteristics, patients are classified with a support vector machine (SVM) classifier [Cortes and Vapnik, 1995] into those with functionally significant stenosis and those without it. The reference for the functional significance of a coronary stenosis is provided by invasively determined FFR measurement, which is currently the clinical standard. The proposed approach is illustrated in Fig. 1.
2 Data
2.1 Patient and Image Data
This study includes retrospectively collected CCTA scans of 166 patients (age: years, 128 males) acquired between 2012 and 2016. The Institutional Ethical Review Board waived the need for informed consent.
All CCTA scans were acquired using an ECG-triggered step and shoot protocol on a 256-detector row scanner (Philips Brilliance iCT, Philips Medical, Best, The Netherlands). A tube voltage of 120 kVp and tube current between 210 and 300 mAs were used. For patients kg contrast medium was injected using a flow rate of 6 mL/s for a total of 70 mL iopromide (Ultravist 300 mg I/mL, Bayer Healthcare, Berlin, Germany), followed by a 50 mL mixed contrast medium and saline (50:50) flush, and next a 30 mL saline flush. For patients kg the flow rate was 6.7 mL/s and the volumes of the boluses were 80, 67 and 40 mL, respectively. Images were reconstructed to an in-plane resolution ranging from 0.38 to 0.56 mm, and 0.9 mm thick slices with 0.45 mm spacing.
2.2 FFR Measurements
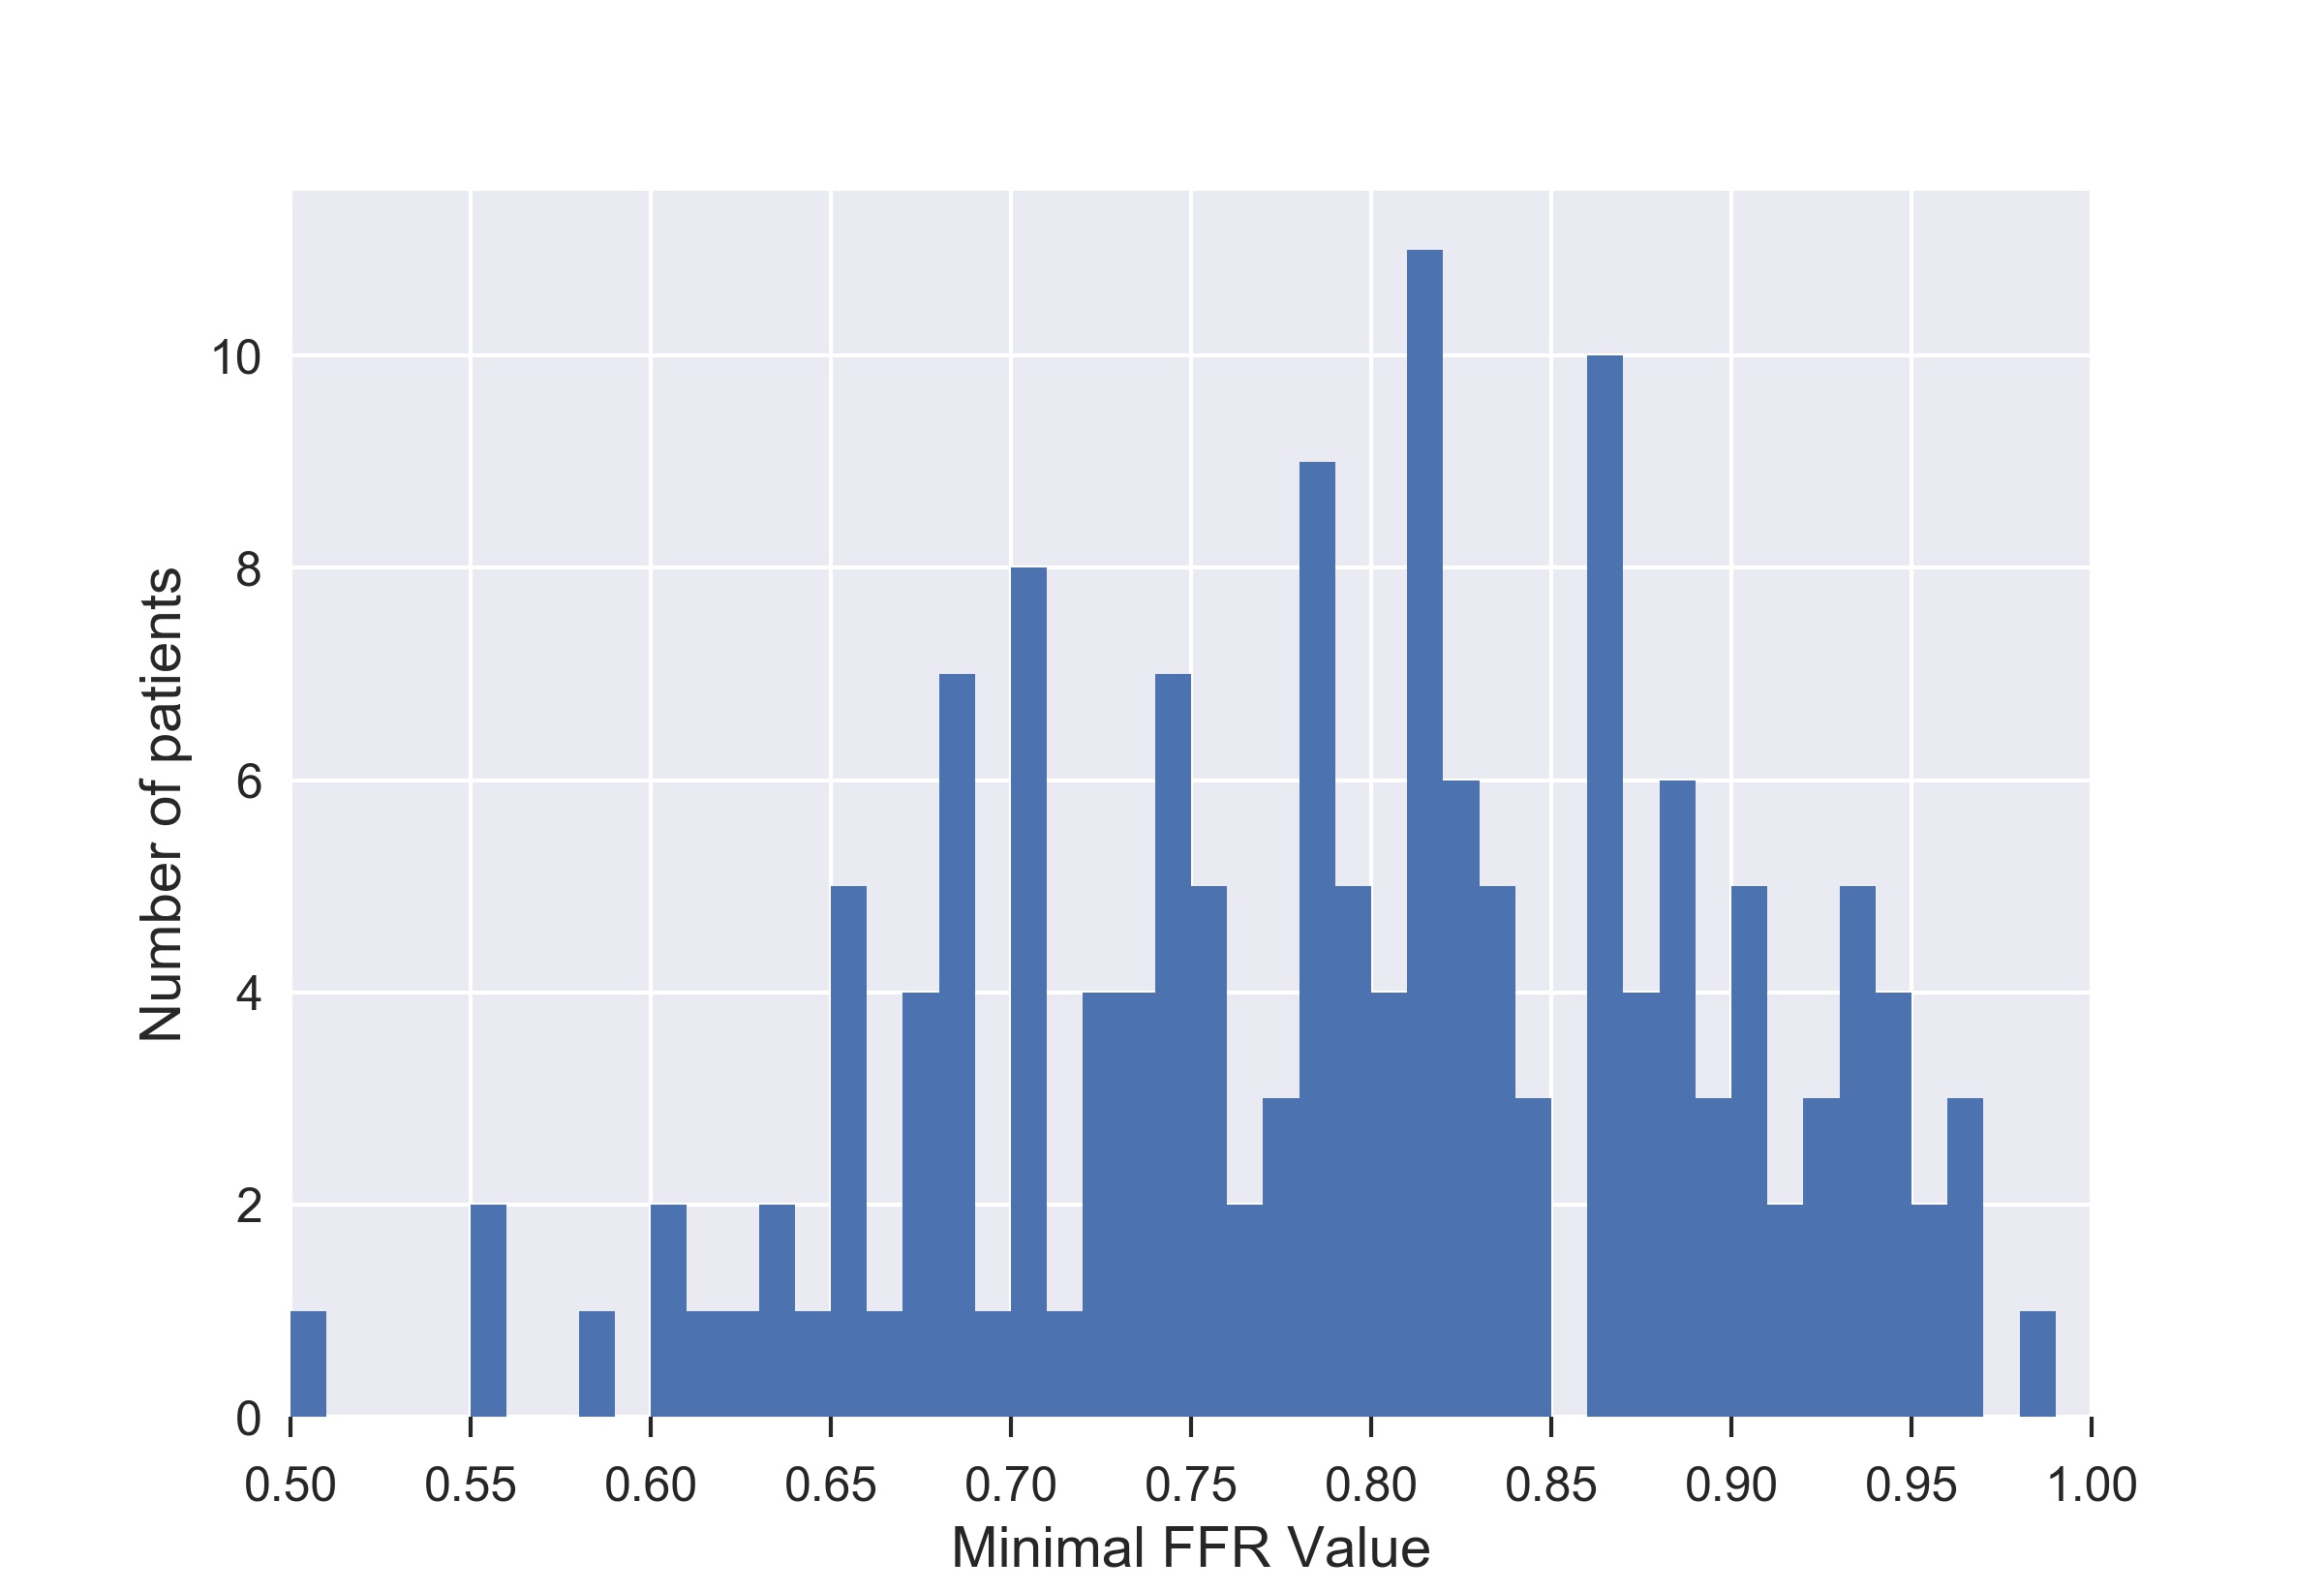
Out of the 166 patients, 156 patients underwent invasive FFR measurements () within 1 year after the acquisition of the CCTA scan (Median and interquartile range of time difference were 32.5 and 38.5 days, respectively). This cut-off value of 1 year was chosen because overall progression of coronary artery stenosis in patients with stable coronary artery disease is not expected [Balkin et al., 1993]. FFR was measured with a coronary pressure guidewire (Certus Pressure Wire, St. Jude Medical, St. Paul, Minnesota) at maximal hyperemia induced by intravenous adenosine, which was administered at a rate of 140 μg/kg per minute through a central vein. The FFR wire was placed as distally as possible in the target vessel and FFR was assessed by means of a manual pullback in the distal part of the target vessel (“standard FFR”). When multiple FFR measurements were available, or measurements for multiple stenoses were available, the minimum value was taken as the standard of reference for the patient. A histogram of the minimal invasively measured FFR values in the 156 patients is shown in Fig. 2.
2.3 Manual Annotation of the LV Myocardium
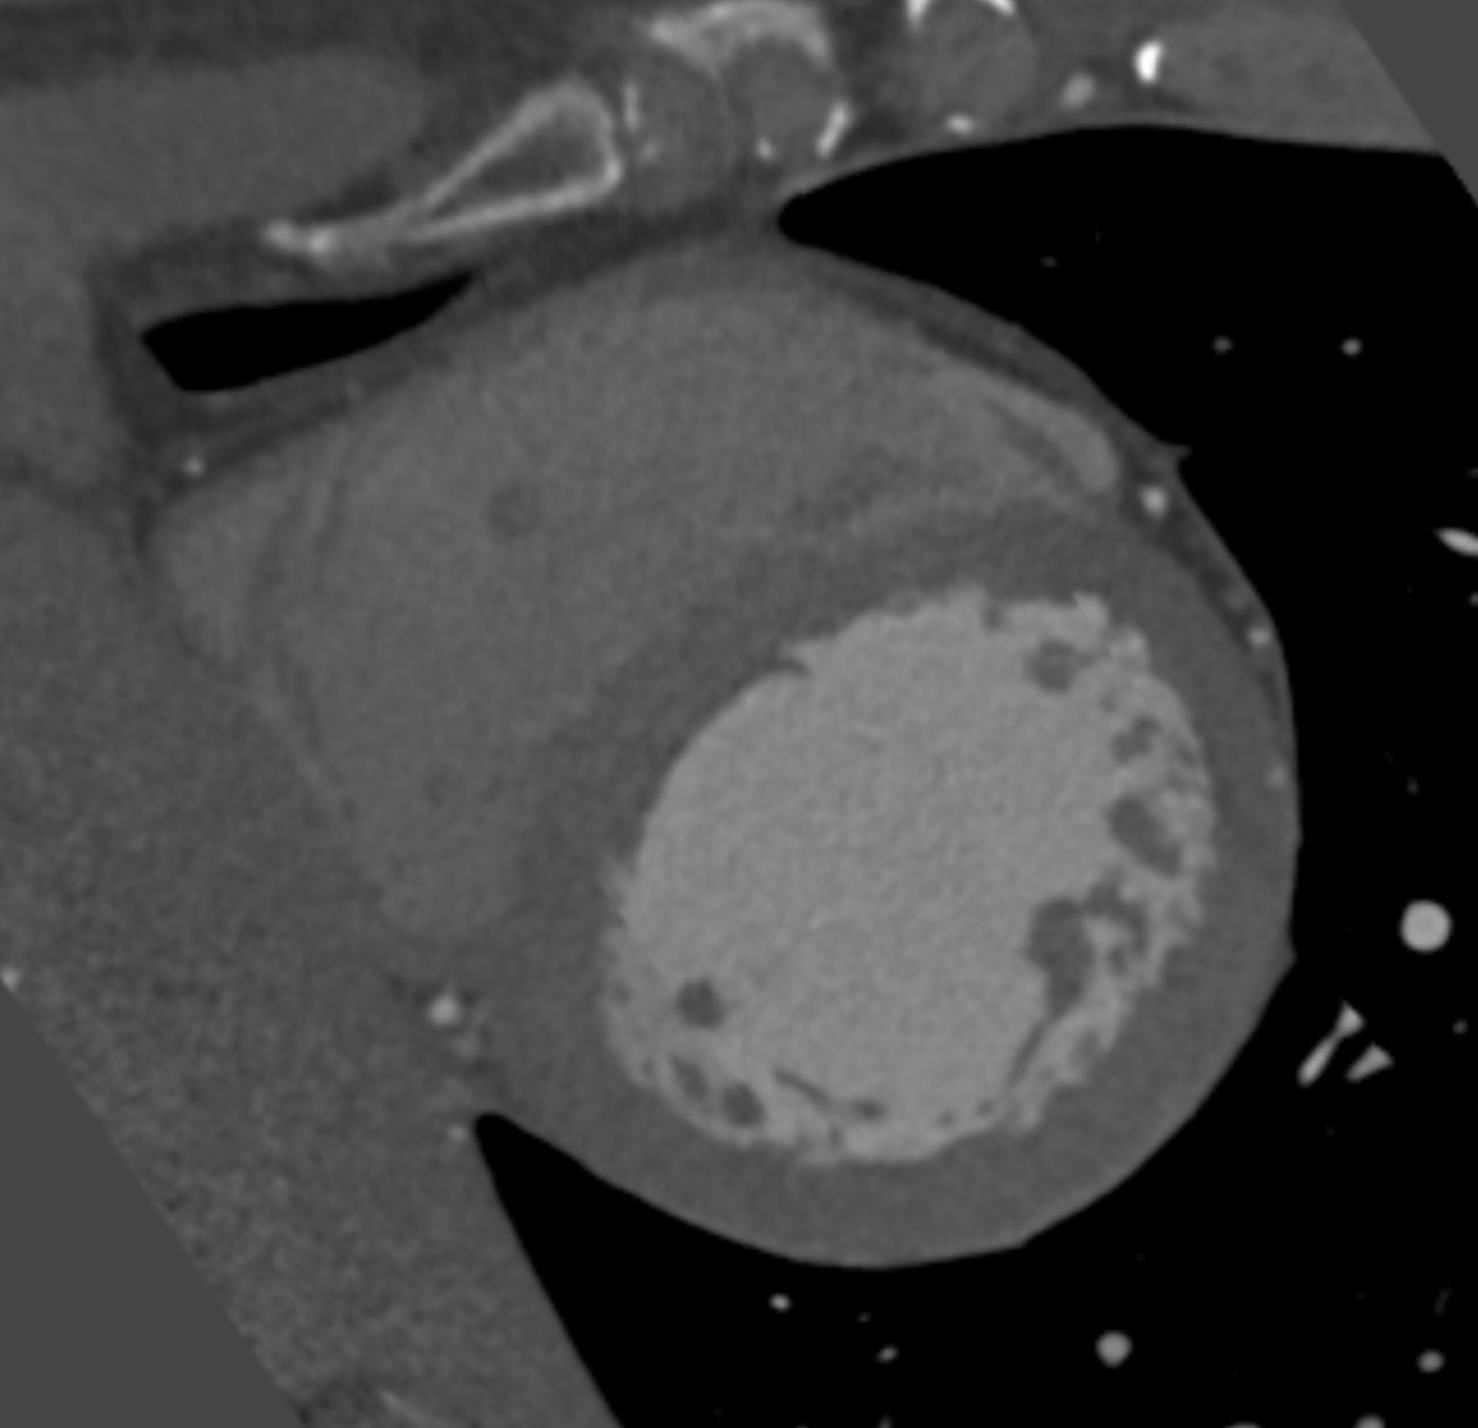
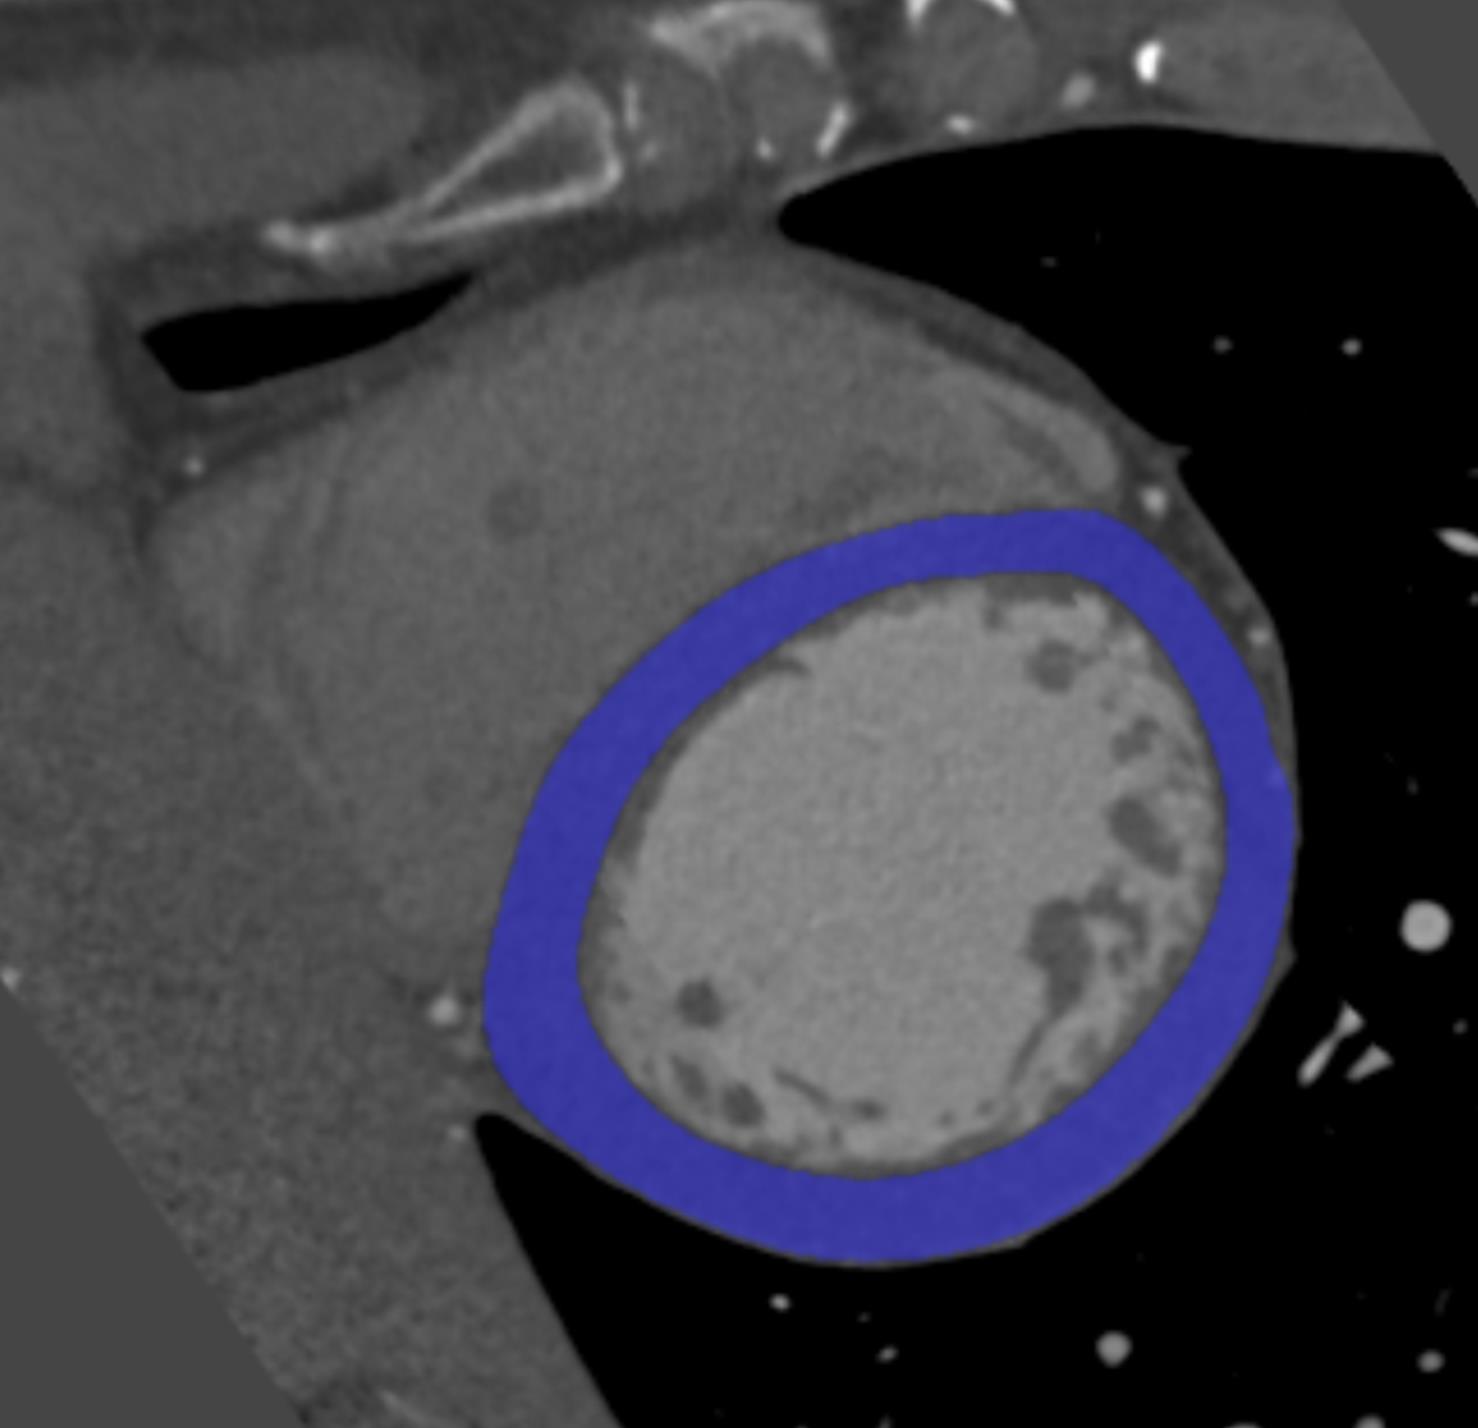
To train, validate and test the segmentation of LV myocardium, the myocardium was manually annotated in 40 randomly selected CCTA scans. Manual annotations were performed by a trained observer using custom-built software created with the MeVisLab111http://www.mevislab.de platform. Following clinical workflow, annotations were performed in the short axis view of the heart, while excluding myocardial fat, papillary muscles and the trabeculae carneae. Segmentation was performed by manually placing points along the endocardium and epicardium in every third image slice. From the defined points, closed contours for the endocardium and the epicardium were created by cubic spline interpolation. The contours were propagated to the adjacent slices where they were manually adjusted when needed by moving existing or placing new points. Reference LV myocardium contained all voxels enclosed by the manually annotated endocardial and epicardial contours. Fig. 3 illustrates a typical short axis view of the LV myocardium and the annotated manual reference.
3 Methods
To identify patients with functionally significant stenosis, the LV myocardium is first segmented using a multiscale CNN. Next, features are extracted from the segmented myocardium using a CAE, and these features are used to identify patients with functionally significant stenosis using an SVM classifier (Fig. 1).
3.1 Myocardium Segmentation
To date, several automatic methods for segmentation of the LV in CCTA have been proposed [Tavakoli and Amini, 2013]. They can be divided in boundary-based (e.g. Marie-Pierre [2006], Zheng et al. [2008], Xiong et al. [2015]) and voxel-based segmentations (e.g. Kirişli et al. [2010]). The advantage of boundary-based approaches is their ability to perform subvoxel analysis. However, we aim to detect ischemic regions in the myocardium that normally exceed small subvoxel volumes [Rossi et al., 2014]. Thus, we expect that voxel-based analysis offers sufficiently accurate segmentation for this task. Moreover, deep learning approaches, that perform voxel based analysis, have shown to outperform other methods in a number of segmentation tasks in medical images (e.g. Ronneberger et al. [2015], Moeskops et al. [2016], Havaei et al. [2017]), hence, we employ a CNN to automatically segment the LV myocardium. To combine the analysis of local texture with distal spatial information, multiscale CNN is used [de Brebisson and Montana, 2015, Moeskops et al., 2016, Kamnitsas et al., 2016, Havaei et al., 2017].
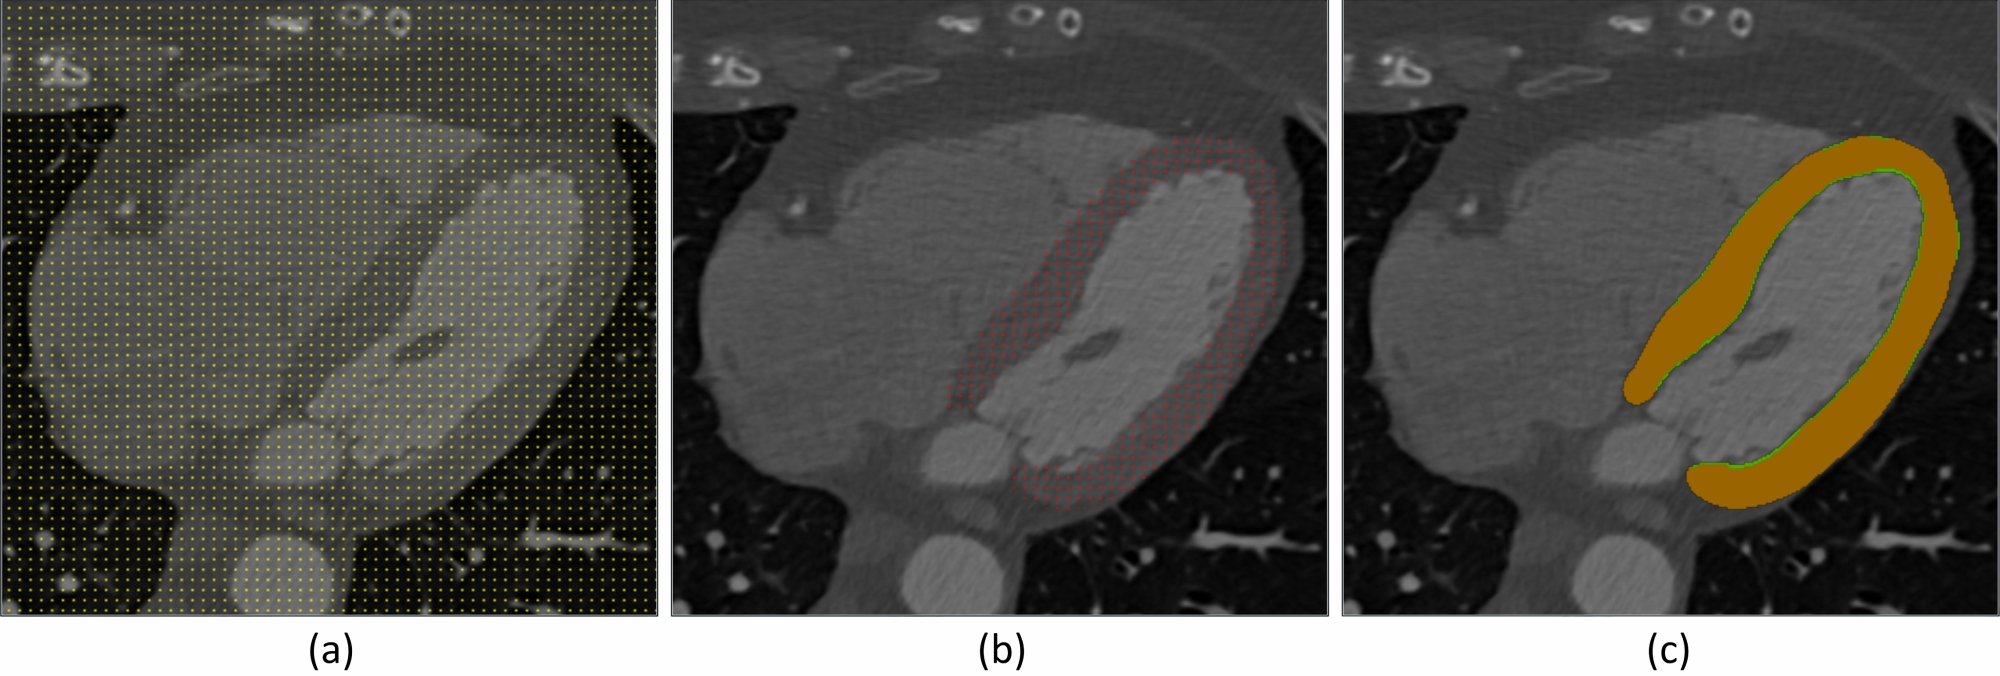
The segmentation is performed in two stages. First, the LV myocardium is localized, and second, the voxels in the region of interest are classified. In our preliminary work [Zreik et al., 2016], the LV myocardium was localized using a bounding box [de Vos et al., 2017] created by an independent CNN. In this work, localization and voxel classification are both performed using the same CNN, circumventing the need for an independent localization method. Therefore, to localize the LV myocardium, equidistantly spaced voxels in the whole image are classified as LV myocardium or as background. By applying 3D Gaussian smoothing to the obtained sparse classification result followed by thresholding of the smoothed probabilities, a rough segmentation of the LV myocardium is obtained. Thereafter, to precisely segment the myocardium, only the voxels on the surface of the rough segmentation are iteratively classified as LV myocardium or as background. Note that reclassification of the voxels inside the rough segmentation is not needed as the myocardium is a compact structure. The iterative voxel classifications is repeated until all surface voxels are classified as LV myocardium. Fig. 4 illustrates the segmentation process.
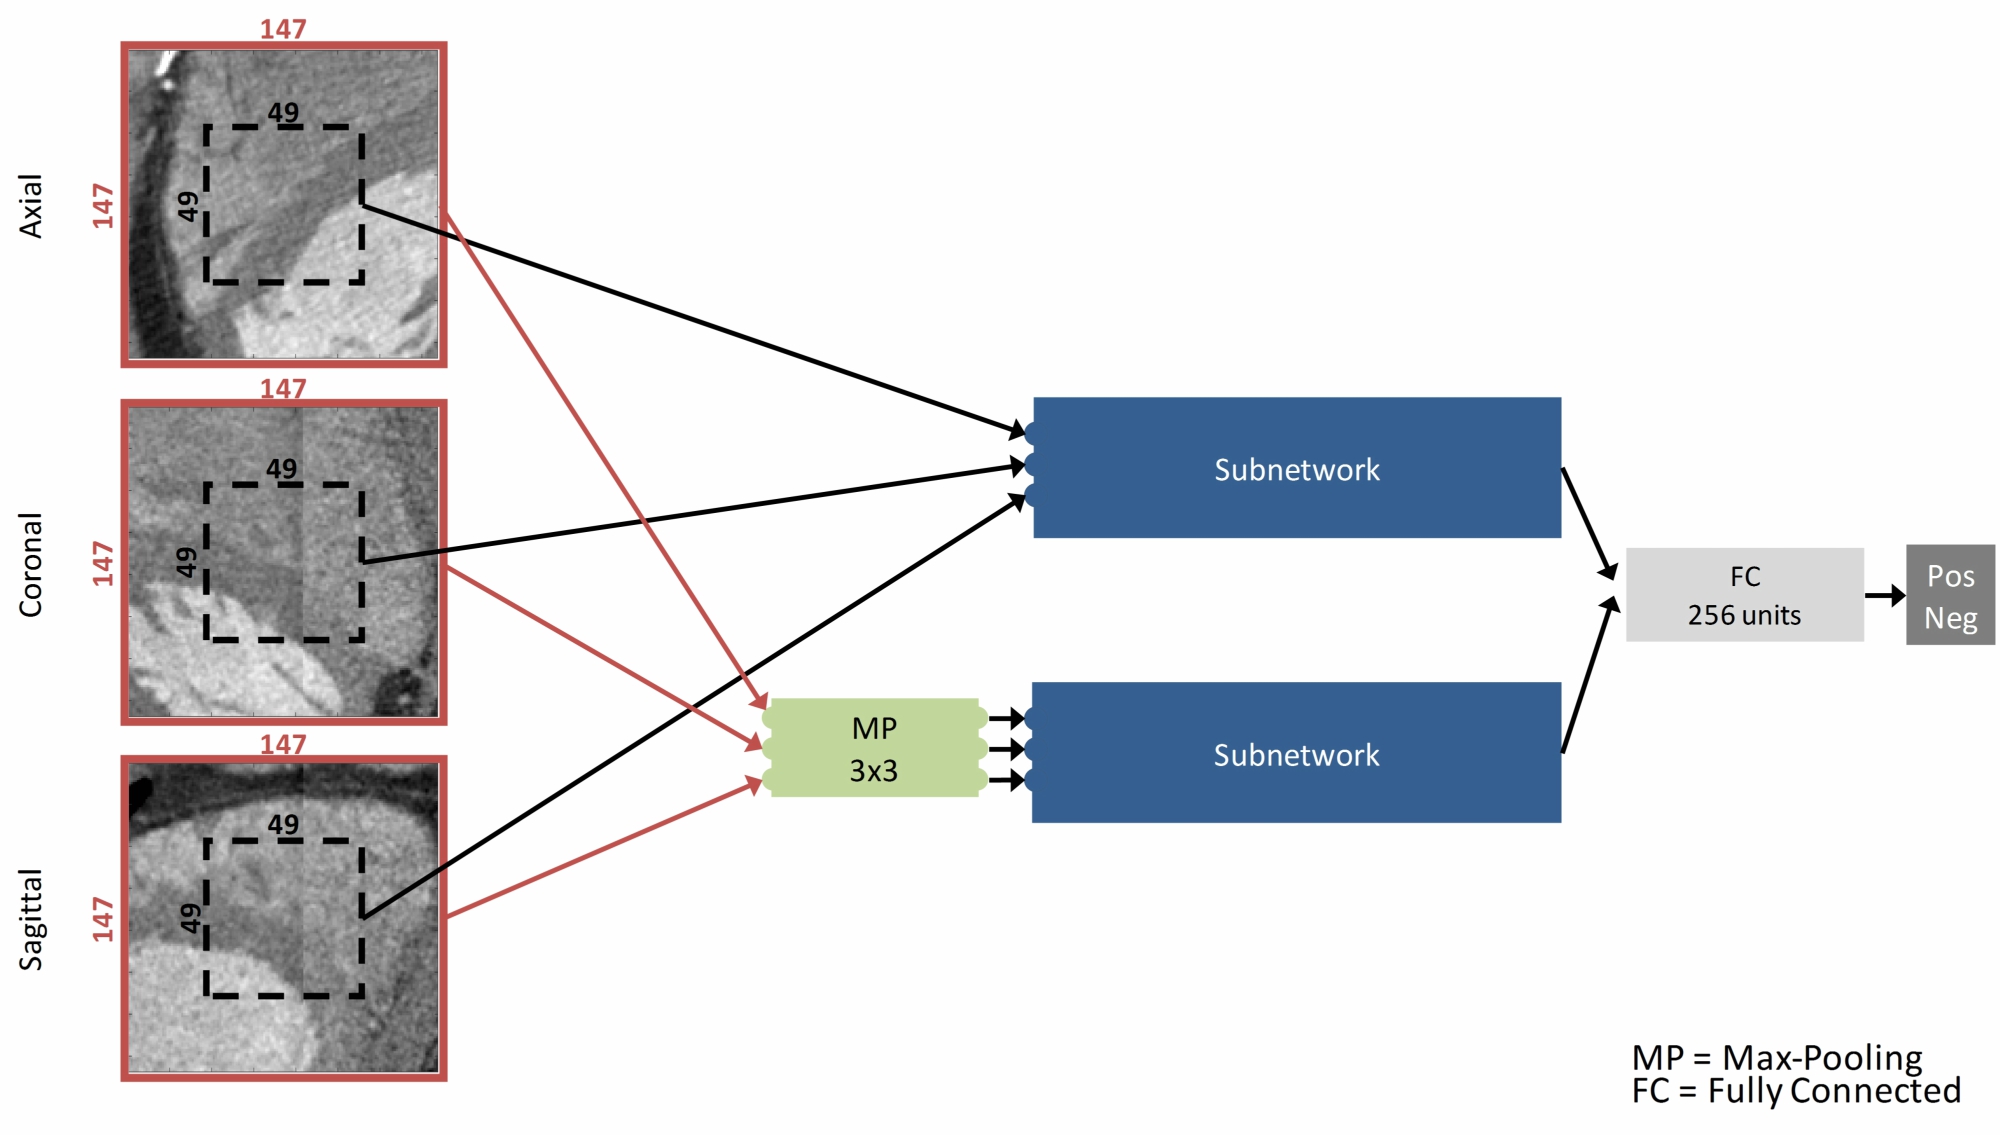
The CNN performs voxel classification using two sets of three orthogonal (2.5D) patches from axial, coronal and sagittal image slices with the target voxel in their centers (Fig. 5, (a)). The first set provides a small receptive field at high image resolution, and the second set provides a larger receptive field at lower image resolution. The multiscale approach enables the network to exploit both detailed local characteristics as well as contextual information. The first set consists of 3 patches of voxels and the second set of 3 patches of voxels. The latter set of patches is downsampled by an additional max-pooling layer resulting in patches of voxels, as well.
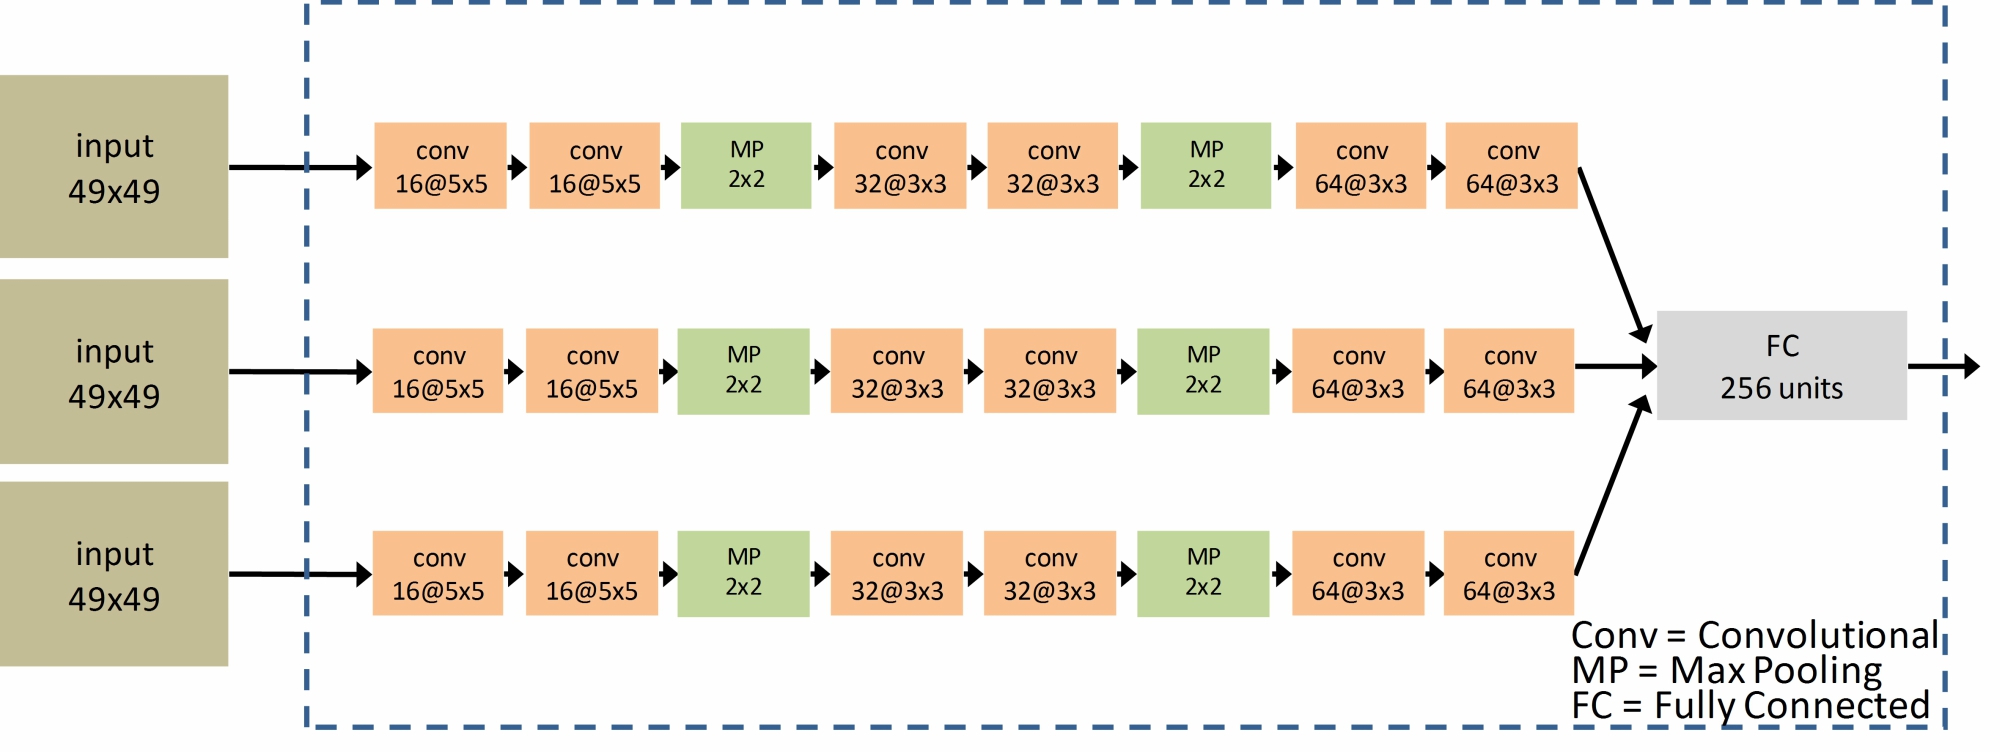
To analyze both sets of patches, the CNN consists of two identical subnetworks (Fig. 5, (a)). Both subnetworks are fused together in a fully connected layer, followed by a softmax layer with two units providing a classification label of the voxel at hand. Each subnetwork (Fig. 5, (b)) consists of three streams that are fused together in a fully connected layer. Parameters of each stream layer are listed in Table 1. In all fully connected layers, the number of units is set to 256. Batch normalization [Ioffe and Szegedy, 2015] is used after each convolutional layer to make the training process faster and less sensitive to the learning rates. Exponential linear units (ELUs) [Clevert et al., 2015] are used in all layers as activation functions.
3.2 Myocardial Characterization
Functionally significant coronary artery stenosis causes ischemia in the LV myocardium and thereby changes its texture characteristics in a rest CCTA image [Nikolaou et al., 2006, Osawa et al., 2016, Xiong et al., 2015, Han et al., 2017]. In a CCTA image acquired at rest, where pharmacological stimulation is not applied to reveal reversible perfusion defects (stress CCTA) [George et al., 2009], the texture changes are less pronounced than in stress CCTA and are mostly subtle [Han et al., 2017]. It would be extremely challenging to manually label myocardial voxels affected by ischemia. Moreover, presently, no consensus has been established regarding the appearance of these changes in rest CCTA [Spiro et al., 2013, Xiong et al., 2015, Han et al., 2017]. Consequently, learning approaches for segmenting ischemic lesions would be hardly feasible. Therefore, in this work, the complete LV myocardium is described, omitting the need for segmentation of such lesions. This is performed by features that are learned in an unsupervised manner: by using a CAE. The main purpose of a CAE, among the different unsupervised learning methods, is to extract general robust features from completely unlabeled data, while removing input redundancies and preserving essential aspects of the data in robust, compact and discriminative representations [Masci et al., 2011, Bengio et al., 2013, LeCun et al., 2015]. In our work, a CAE is applied to myocardial voxels and their characteristics are used to identify patients with functionally significant stenosis.
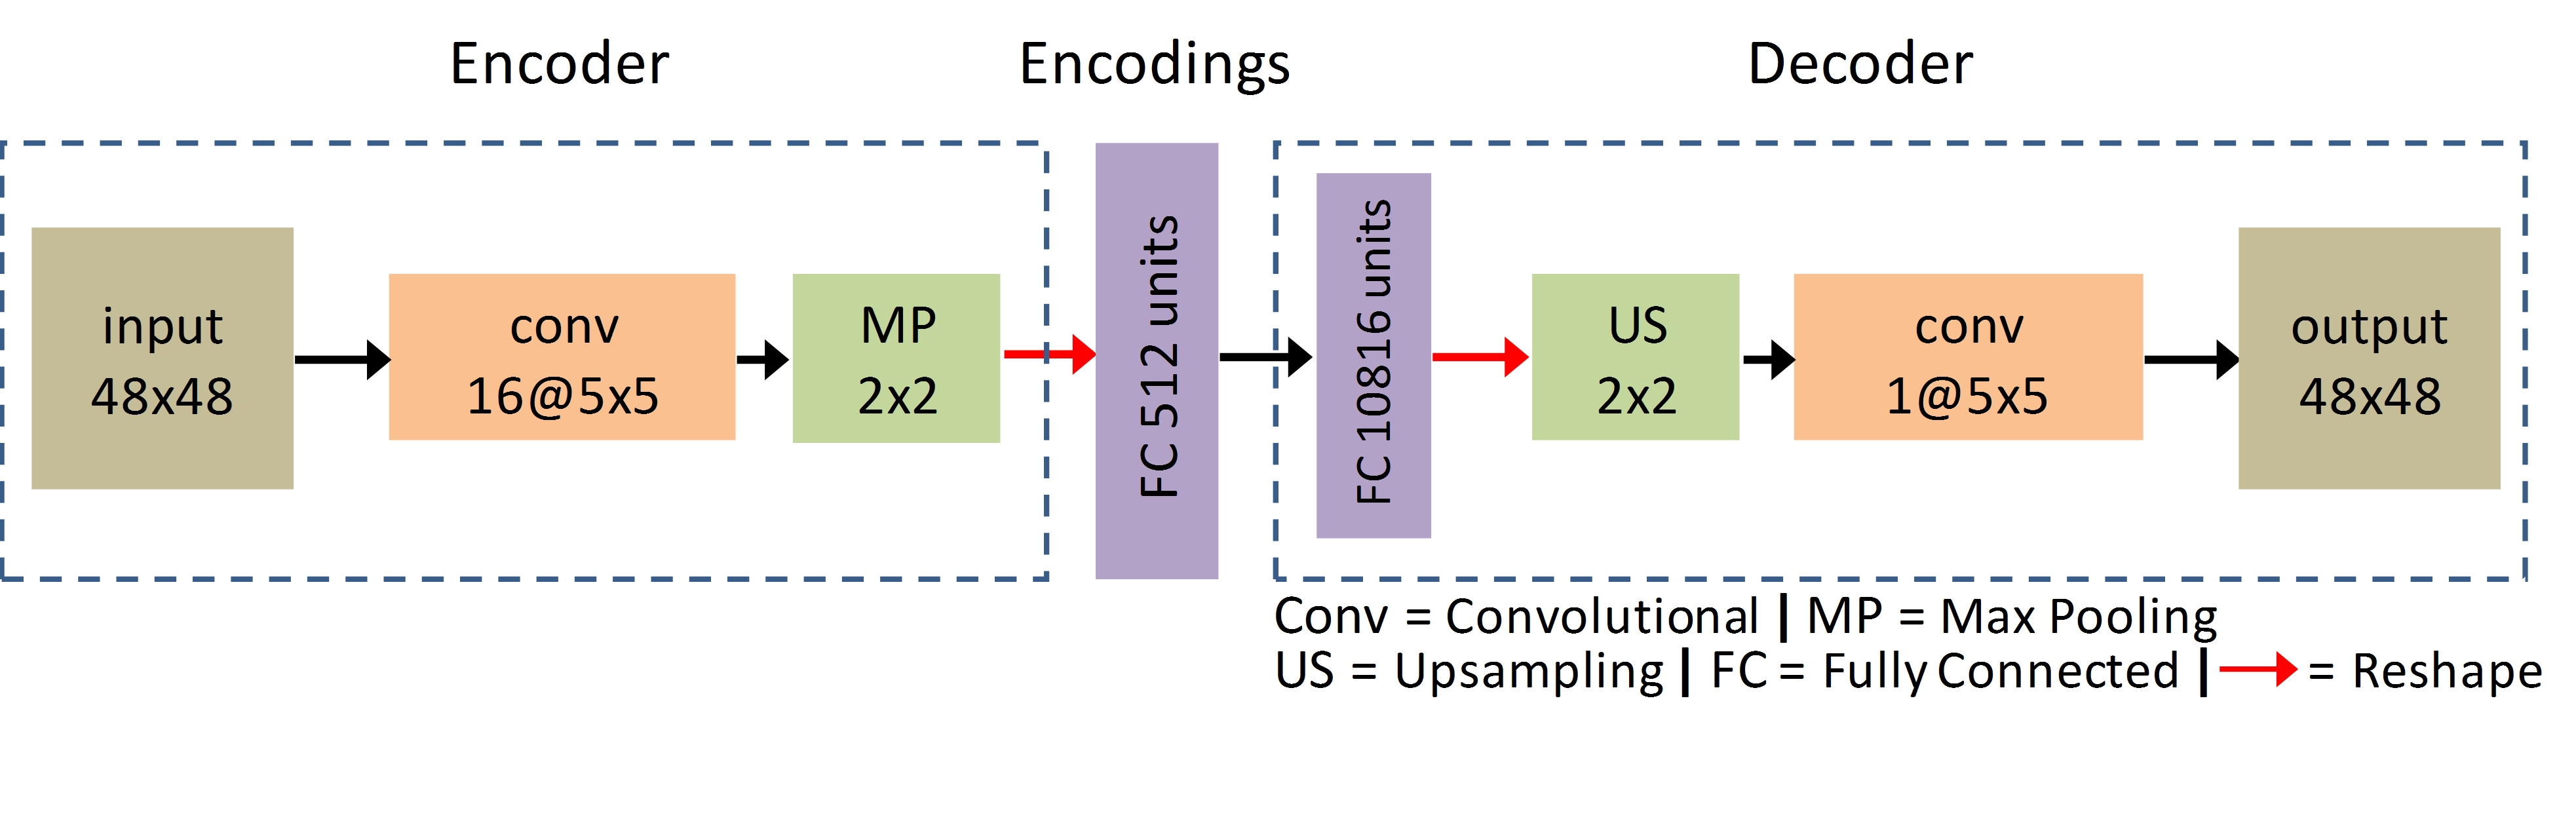
A typical CAE contains two major parts, an encoder and a decoder [Masci et al., 2011, Bengio et al., 2013]. The encoder compresses the data to a lower dimensional representation by convolutional operations and max-pooling. The decoder expands the compressed form to reconstruct the input data by deconvolutional operations and upsampling. The coupling between the encoder and the decoder, and minimizing the loss between the input and the output ensure that abstract features (encodings) generated from the input contain sufficient information to reconstruct it [Bengio et al., 2013]. The CAE architecture used in this work is shown in Fig. 6. The input of the CAE comprises of voxels axial patches around myocardial voxels. The CAE parameters are listed in Table 1. The output of the decoder is the reconstructed input patch. Batch normalization is used after each convolutional layer to make the training process faster and less sensitive to learning rates. ELUs are used as activation functions in all layers except the output layer, where nonlinearity is not applied. Once the CAE is trained, the decoder is removed and the fully connected layer becomes the output layer which is used to generate encodings for unseen patches.
|
Size | Activation |
|
Size | Activation | ||||
| Input Layer | - | Input Layer | - | ||||||
| Conv Layer | ELU | Conv Layer | ELU | ||||||
| Conv Layer | ELU | MP Layer | - | ||||||
| MP Layer | - |
|
512 | ELU | |||||
| Conv Layer | ELU | FC Layer | 10,816 | ELU | |||||
| Conv Layer | ELU | US Layer | - | ||||||
| MP Layer | - | Conv Layer | - | ||||||
| Conv Layer | ELU | Output Layer | - | ||||||
| Conv Layer | ELU |
3.3 Patient Classification
Patients with at least one significant coronary artery stenosis are identified based on the characteristics of the LV myocardium that are encoded by the CAE. The reference for the presence of functionally significant coronary artery stenosis is provided by the invasive FFR measurements.
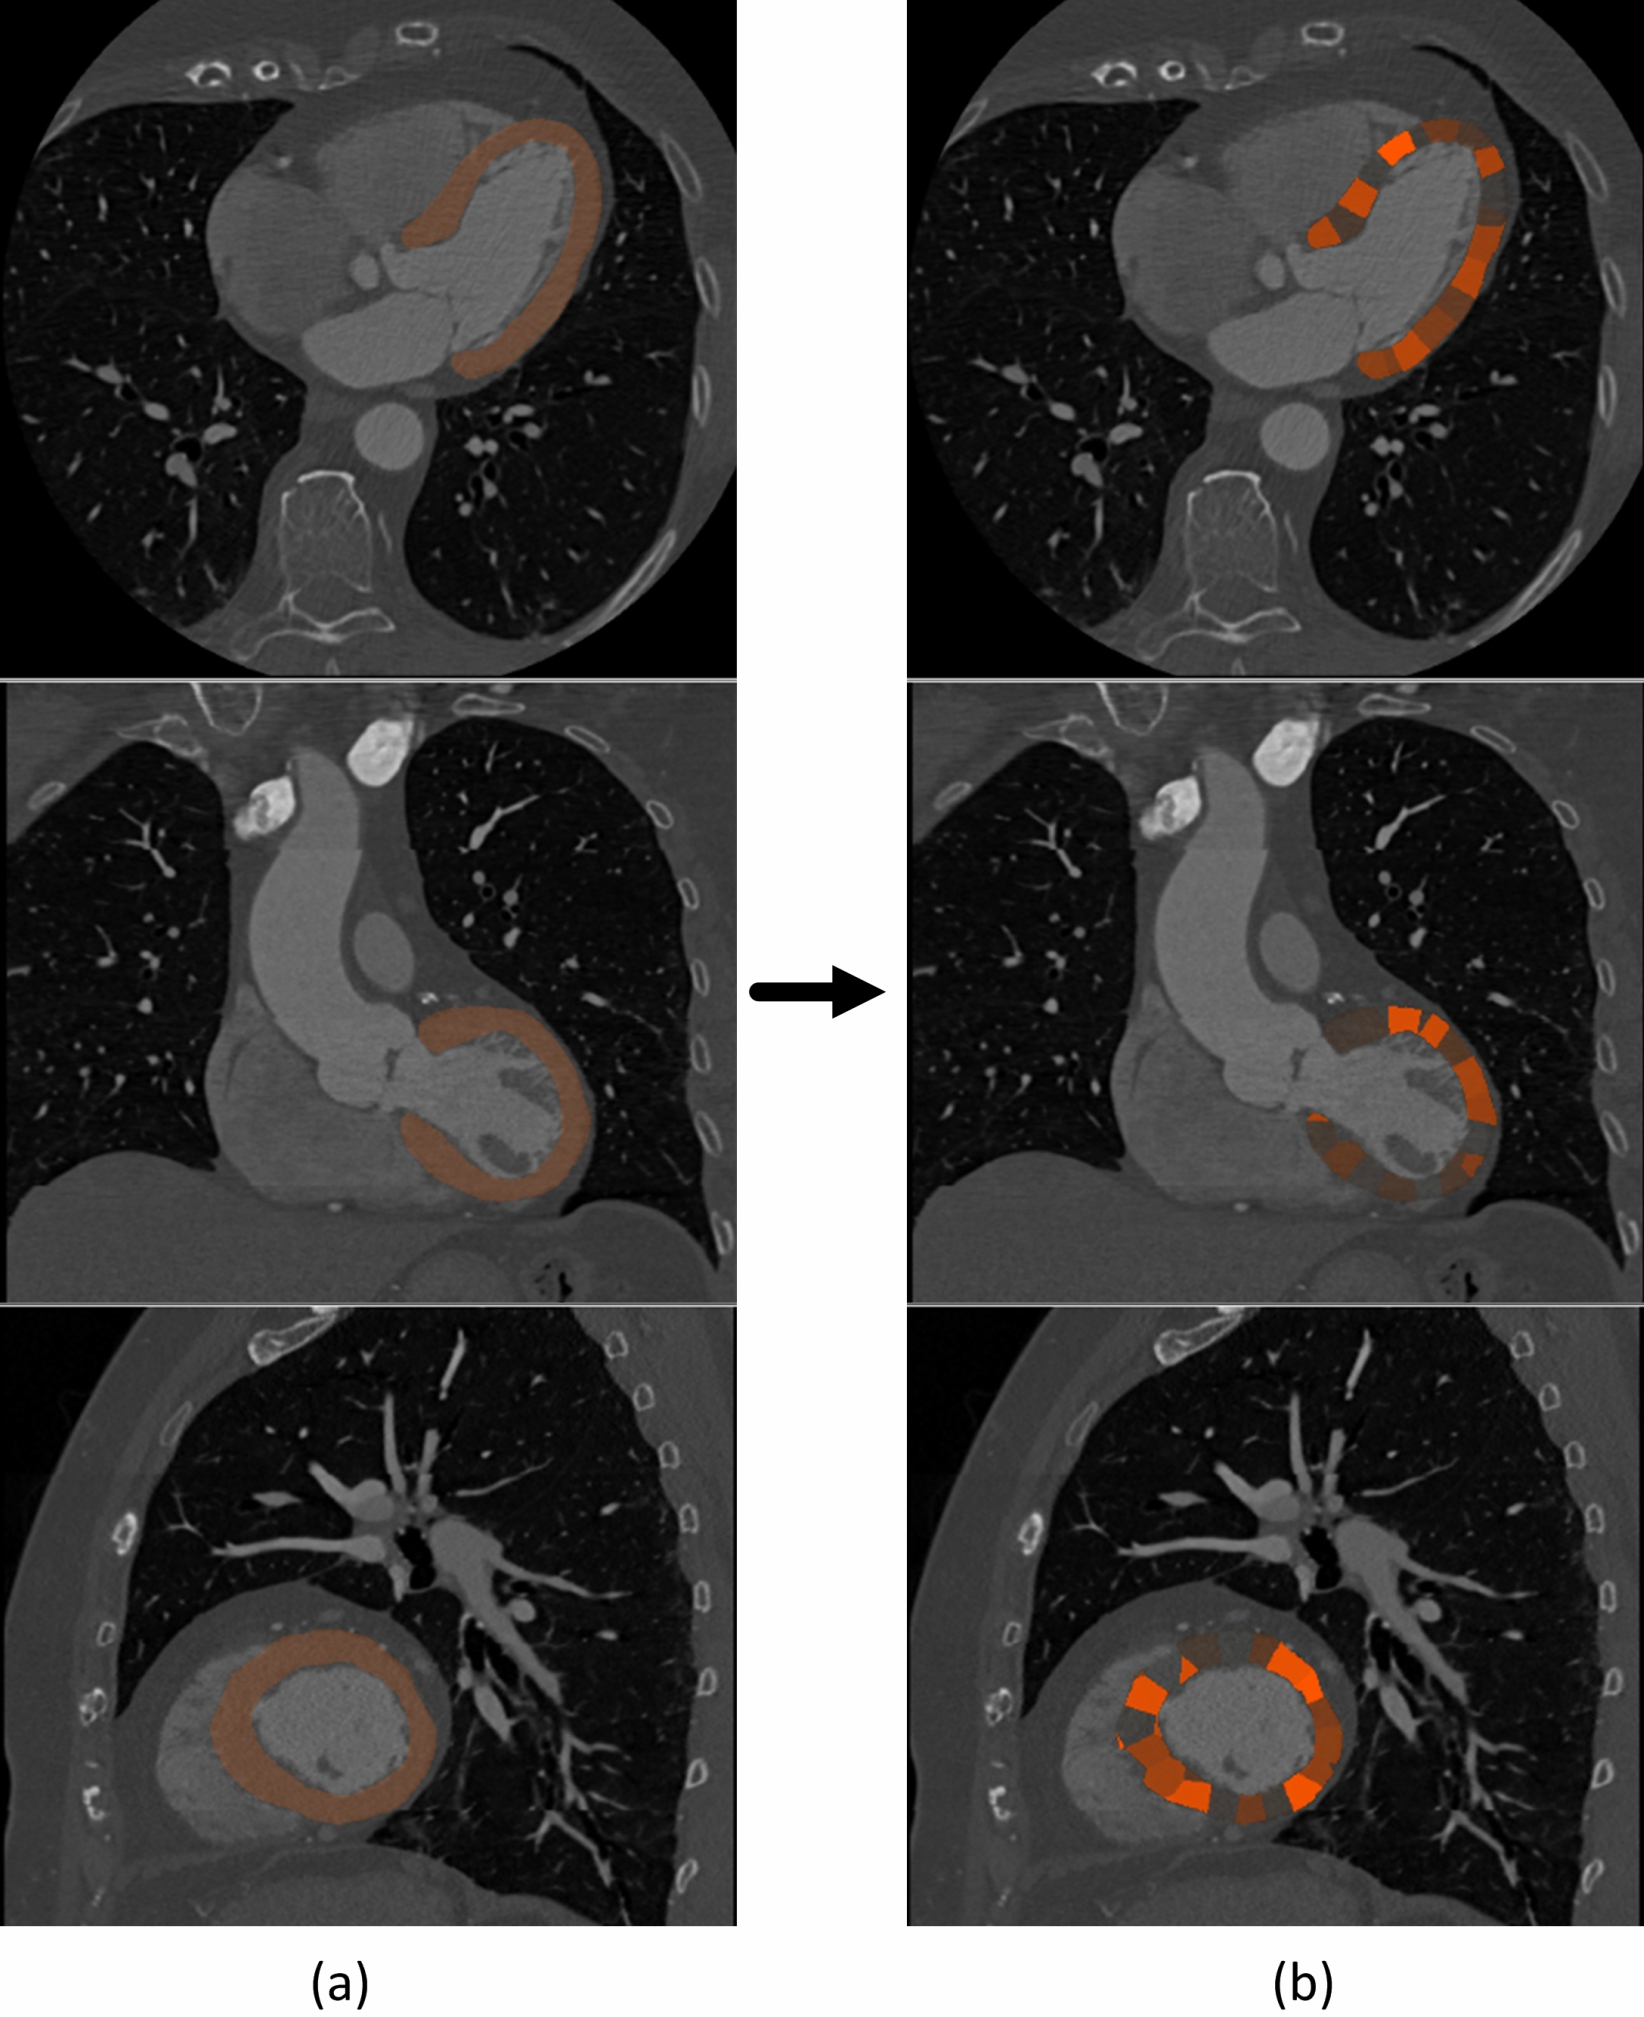
Since a functionally significant stenosis is expected to have a local impact on the myocardial blood perfusion [Mehra et al., 2011, Rossi et al., 2014], the LV myocardium is divided into 500 spatially connected clusters. Clustering is achieved using the fast K-means algorithm [Sculley, 2010], based on the spatial location of the myocardial voxels. A typical example of such a clustering is shown in Fig. 7.
Within a single cluster, a large variance in an encoding likely indicates an aspect of the cluster’s inhomogeneity, and thereby the presence of abnormal myocardial tissue. In preliminary experiments, a number of statistics of the encodings was evaluated. The best result was obtained using the standard deviation of each of the encodings over all voxels within a cluster. Inspired by the multi instance learning approach [Gärtner et al., 2002], we have described the whole LV myocardium, rather than its clusters. Therefore, for each encoding the maximum of all standard deviations over the clusters is determined. This results in a vector of features describing each patient.
Finally, based on the extracted and clustered features, patients are classified into those with a functionally significant coronary artery stenosis or those without it. As training an end-to-end deep learning system for patient classification is not feasible due to the small size of the available dataset, patient classification is performed using an SVM classifier with a radial basis function.
4 Evaluation
4.1 Myocardium Segmentation
Manual annotation of the LV myocardium is a time-consuming task. Therefore, automatic segmentation was evaluated quantitatively in a subset of test scans with manually defined reference and qualitatively in all test scans.
Quantitative evaluation was performed using the Dice coefficient, as an overlap measure between reference and automatically segmented volumes. In addition, the mean absolute surface distance (MAD) between the reference and automatically segmented LV boundaries was computed.
Qualitative evaluation was performed by an expert who visually inspected and graded the automatic segmentation using the quality grades as defined by Abadi et al. [2010].
4.2 Patient Classification
Classification of patients into those having functionally significant stenosis or those without it was evaluated using a receiver operating characteristic (ROC) curve.
5 Experiments and Results
5.1 Myocardium Segmentation
To train the multiscale CNN for LV myocardium segmentation, 20 manually annotated scans were randomly selected (training set) from the set of 40 scans with manual annotations. The remaining 20 scans were used as an independent test set and used for quantitative evaluation of the segmentation (see Section 4.1). All CNN hyperparameters and optimal thresholds were determined in preliminary experiments using the training set.
Two sets of triplanar patches were extracted around positive (LV myocardium) and negative (background) voxels with the voxel of interest in their centers (Fig. 5, (a)). Mini-batches of image patches, extracted from the training set and balanced with respect to class labels, were used for training the CNN. Given that many background voxels distant to the LV myocardium, such as those representing lungs or bones, do not resemble myocardium while some voxels proximal to it are almost indistinguishable from it, and the LV myocardium comprises only a small part of the image, training voxels were selected according to their distance to the LV myocardium. In particular, during training, background voxels in the vicinity of the myocardium ( voxels) were selected four times more often than those further away from it. These parameters were chosen empirically using the training set. The training process converged after 200 epochs, where each epoch consisted of 200 mini-batches, and each mini-batch consisted of 500 patches selected from the training data. A random dropout [Srivastava et al., 2014] of 50% was applied during training in each fully connected layer to prevent overfitting. Stochastic gradient descent with Nesterov momentum and learning rate was used to minimize the cross-entropy loss function [Nesterov et al., 2007].
During testing, to localize the LV myocardium, equidistantly spaced voxels were classified (every voxel) in the axial, coronal and sagittal image planes. The obtained classification result was smoothed using a 3D Gaussian filter with a kernel size of 5 voxels and thereafter thresholded at 0.5 to obtain an initial rough segmentation. The surface voxels of the initial rough segmentation were iteratively classified until the final segmentation was obtained.
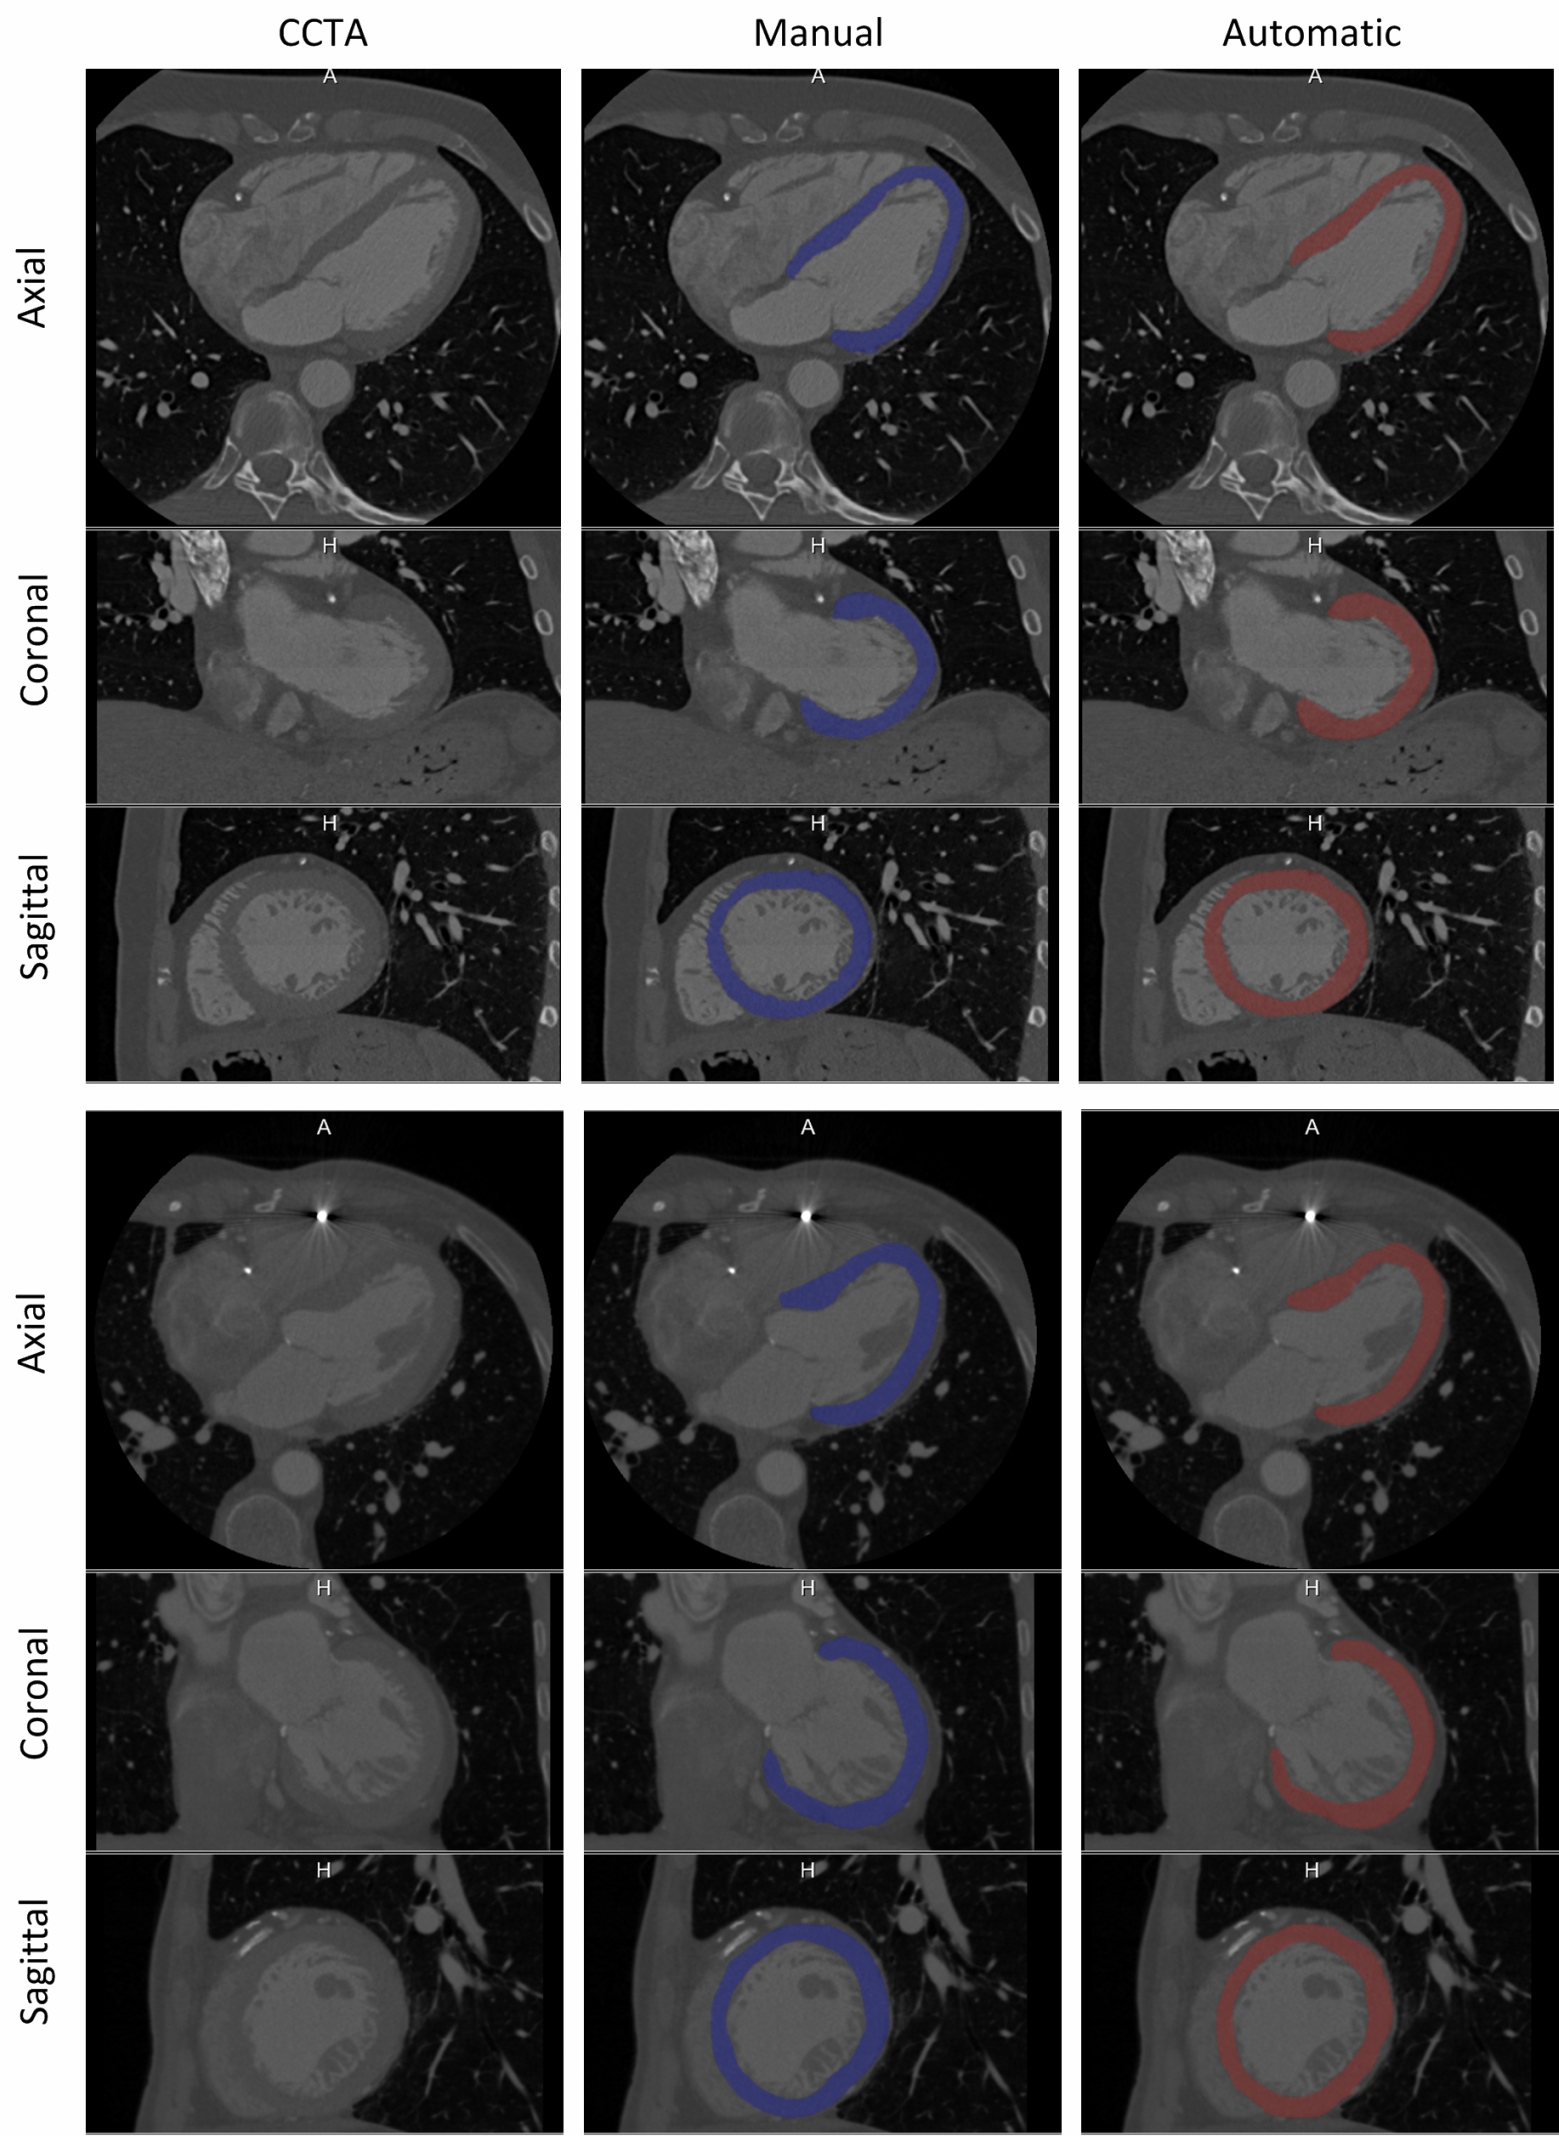
Fig. 8 illustrates segmentation results. Quantitative evaluation of the segmentation performed on the 20 test scans resulted in a Dice coefficient of and a MAD of mm. Qualitative evaluation of the segmentation was performed in all 146 test scans. Results are summarized in Table 2.
| Grade | Result (Scans/Total scans) |
| 1 - Very accurate | () |
| 2 - Accurate | () |
| 3 - Mostly accurate | () |
| 4 - Inaccurate | () |
| 5 - Segmentation failed | () |
5.2 Myocardial Characterization
The CAE was trained and validated using 20 training scans with the corresponding manual annotations of the LV myocardium. Axial patches of voxels around randomly selected voxels of the myocardium were extracted from these scans. of the extracted patches were randomly selected for training the CAE and the remaining for validating it. Training was performed over 750 epochs, each epoch consisted of 200 training and 20 validation mini-batches. Each mini-batch consisted of 500 patches, which were randomly selected from training and validation data. Stochastic gradient descent with Nesterov momentum and learning rate was used to minimize the loss function which was defined as mean squared error between the input patch and the reconstructed patch.
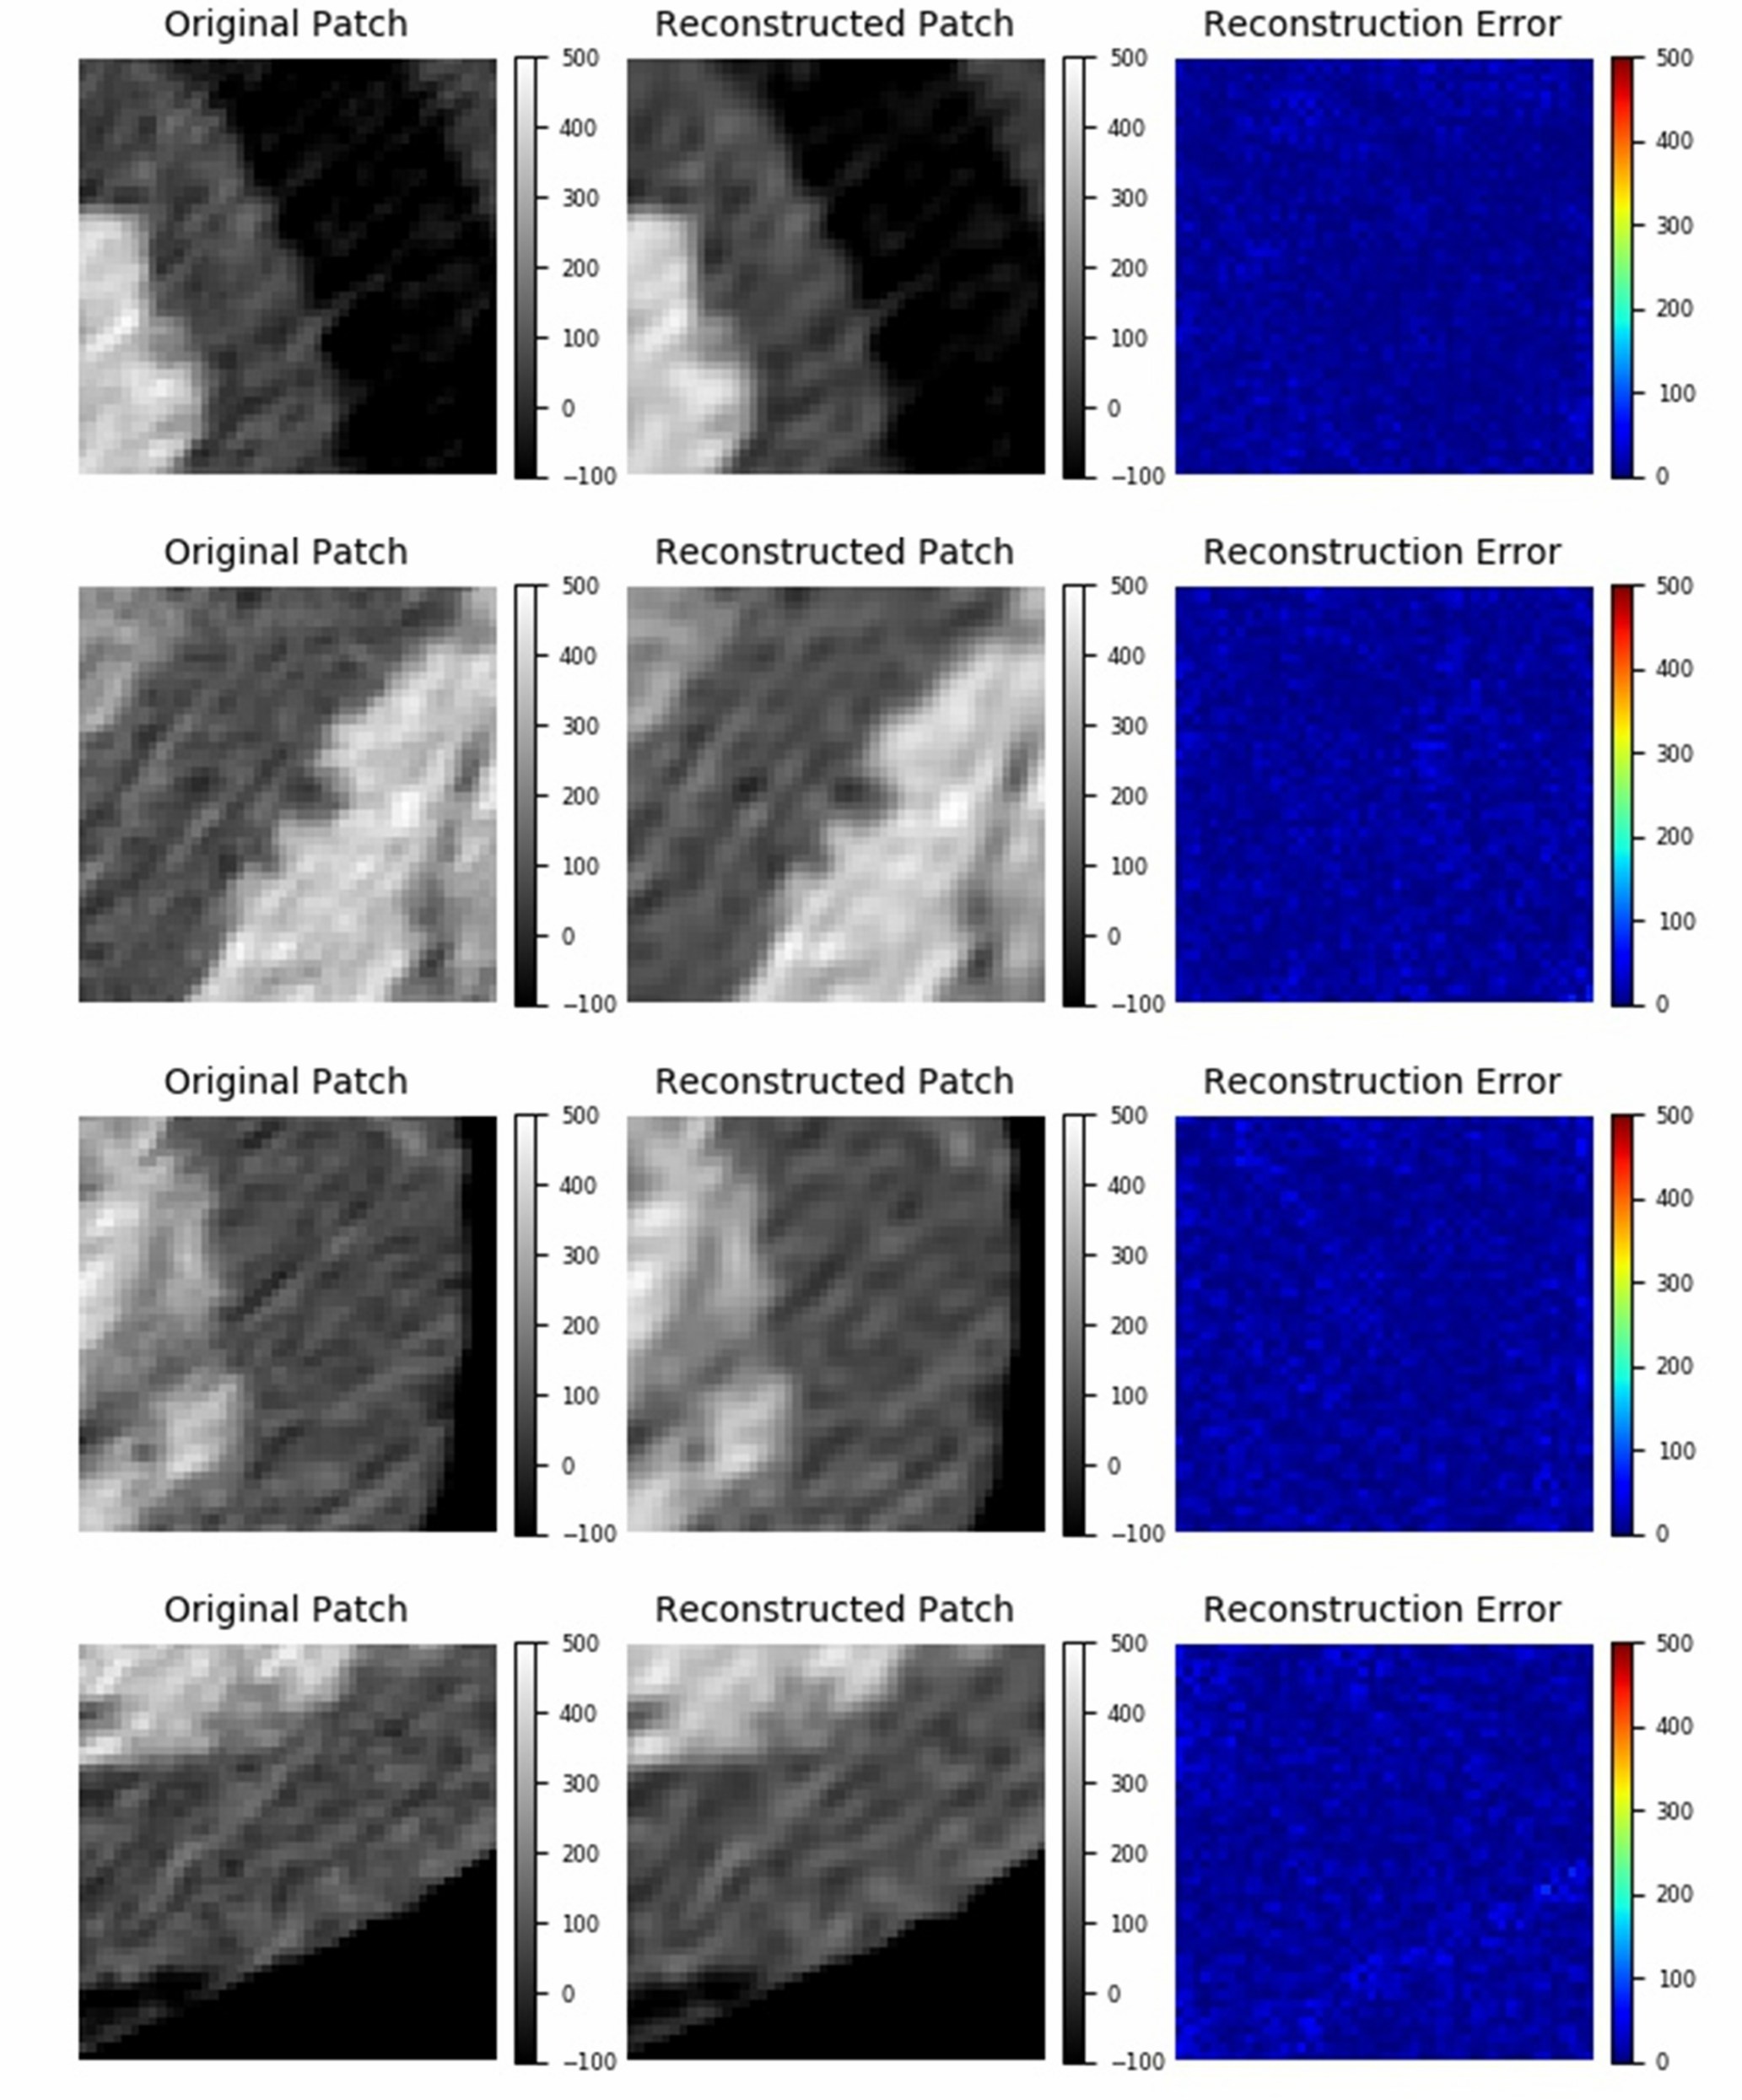
Fig. 9 illustrates pairs of input patches and the corresponding reconstructed patches and reconstruction errors, randomly selected from the LV myocardium in test scans.
5.3 Patient Classification
Since the aim of this study was to examine the feasibility of using only information derived from the LV myocardium to identify patients with significant coronary artery stenosis, only patients with accurate automatic segmentation that includes complete LV myocardium (grades 1, 2 or 3) were included in the analysis. Moreover, CCTA images which were used for training the LV myocardium segmentation or characterization were excluded from further analysis to completely separate training and test data. This resulted in a set of 126 patients out of the initial 166 patients set.
Since invasive FFR measurements provided a reference for classification of patients according to the presence or absence of functionally significant stenosis, a cut-off value on the FFR measurements had to be defined. In the literature, different FFR cut-off values, ranging from 0.72 to 0.8, have been used [Pijls et al., 1996, De Bruyne et al., 2001, Samady et al., 2006, De Bruyne and Sarma, 2008, Petraco et al., 2013]. In this study the cut-off value was set to 0.78. This value provided the best balance between positive and negative class, thus patients with a minimum FFR measurement below or equal to 0.78 were considered positive (64 patients), and those with a minimum FFR above 0.78 were considered negative (62 patients).
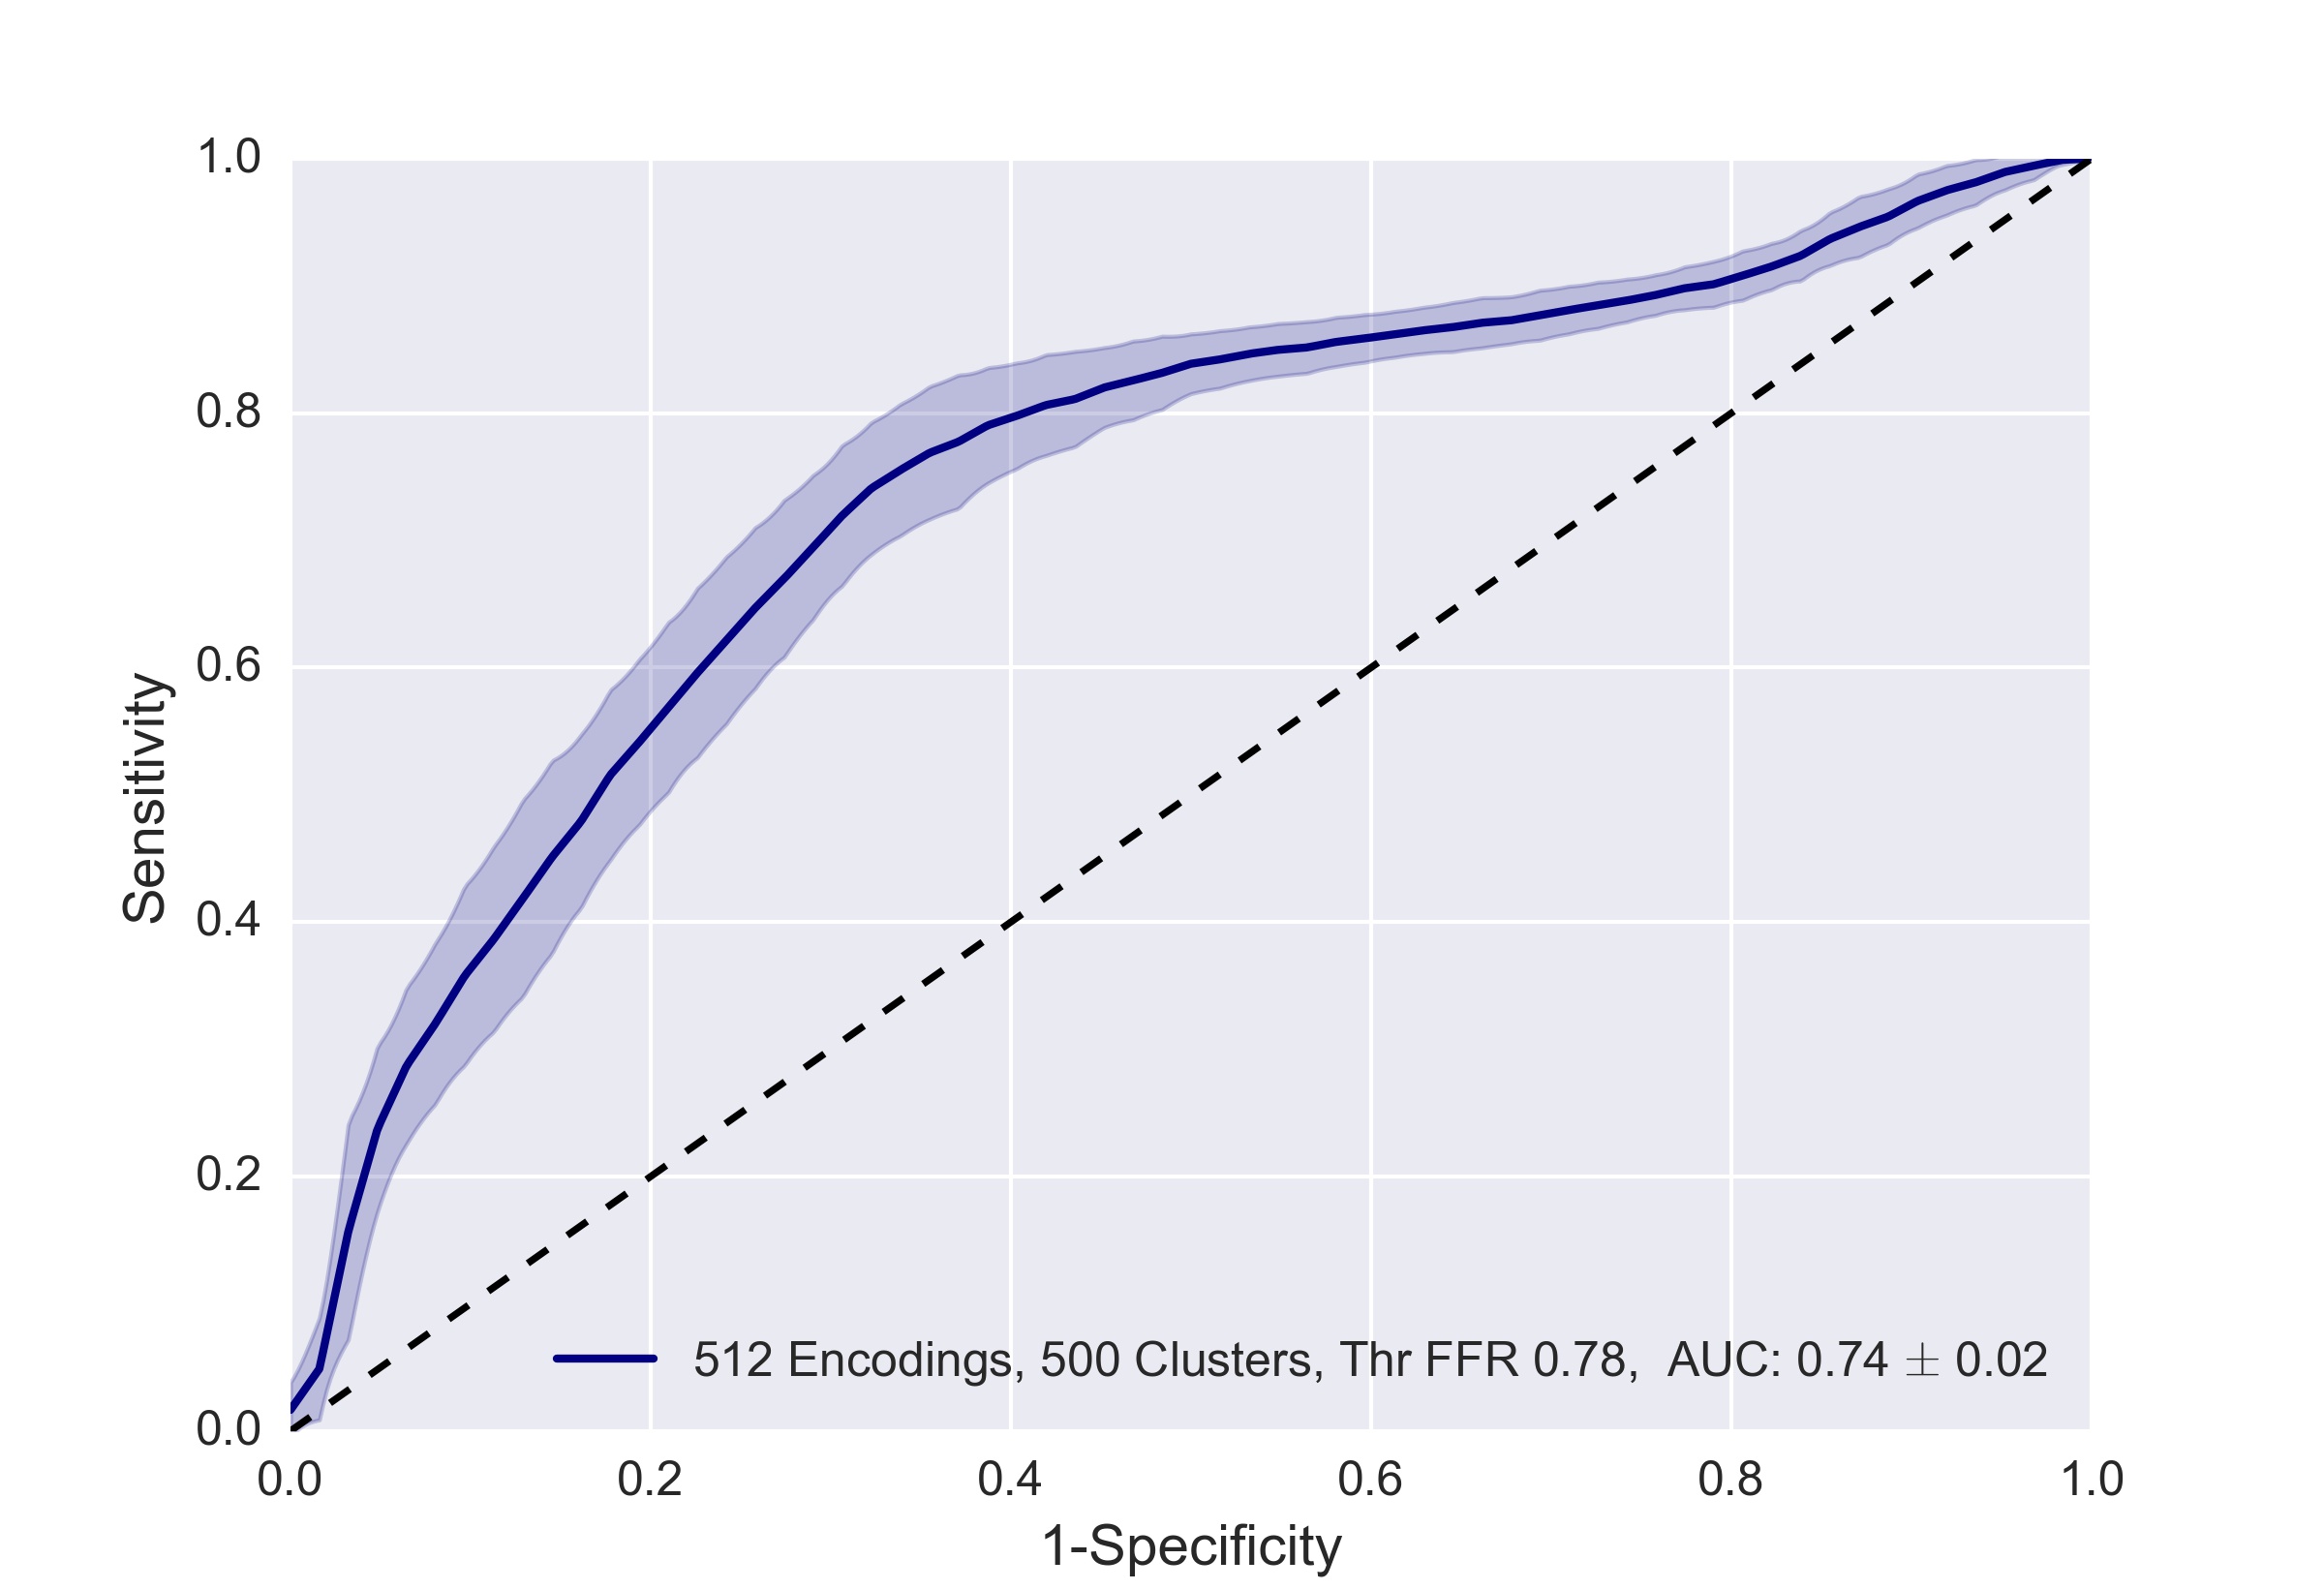
Classification was performed using characteristics of the segmented LV myocardium, where its voxels were encoded by 512 encodings and subsequently, features were extracted from its 500 clusters. Evaluation of patient classification was performed in 10-fold cross-validation experiments. To evaluate the robustness of the method, the cross-validation experiments were performed 50 times with re-randomized folds. Optimal SVM parameters (C and ) were selected in every experiment using a grid search on the training set only. The results are shown in Fig. 10. An average AUC of was achieved, while for the sensitivities set to 0.60, 0.70 and 0.80, corresponding specificities were 0.77, 0.71 and 0.59, respectively.
5.4 The Effect of Number of Clusters
To evaluate the effect of the number of used clusters on patient classification, additional experiments were performed where the LV myocardium was clustered into different number of clusters, namely 1, 10, 20, and 1000. In these experiments, the number of encodings was set to 512. The results are illustrated in Fig. 11, (a). The obtained AUC ranged from 0.62 to 0.74, while the highest AUC was obtained with 500 clusters.
5.5 The Effect of Number of Encodings
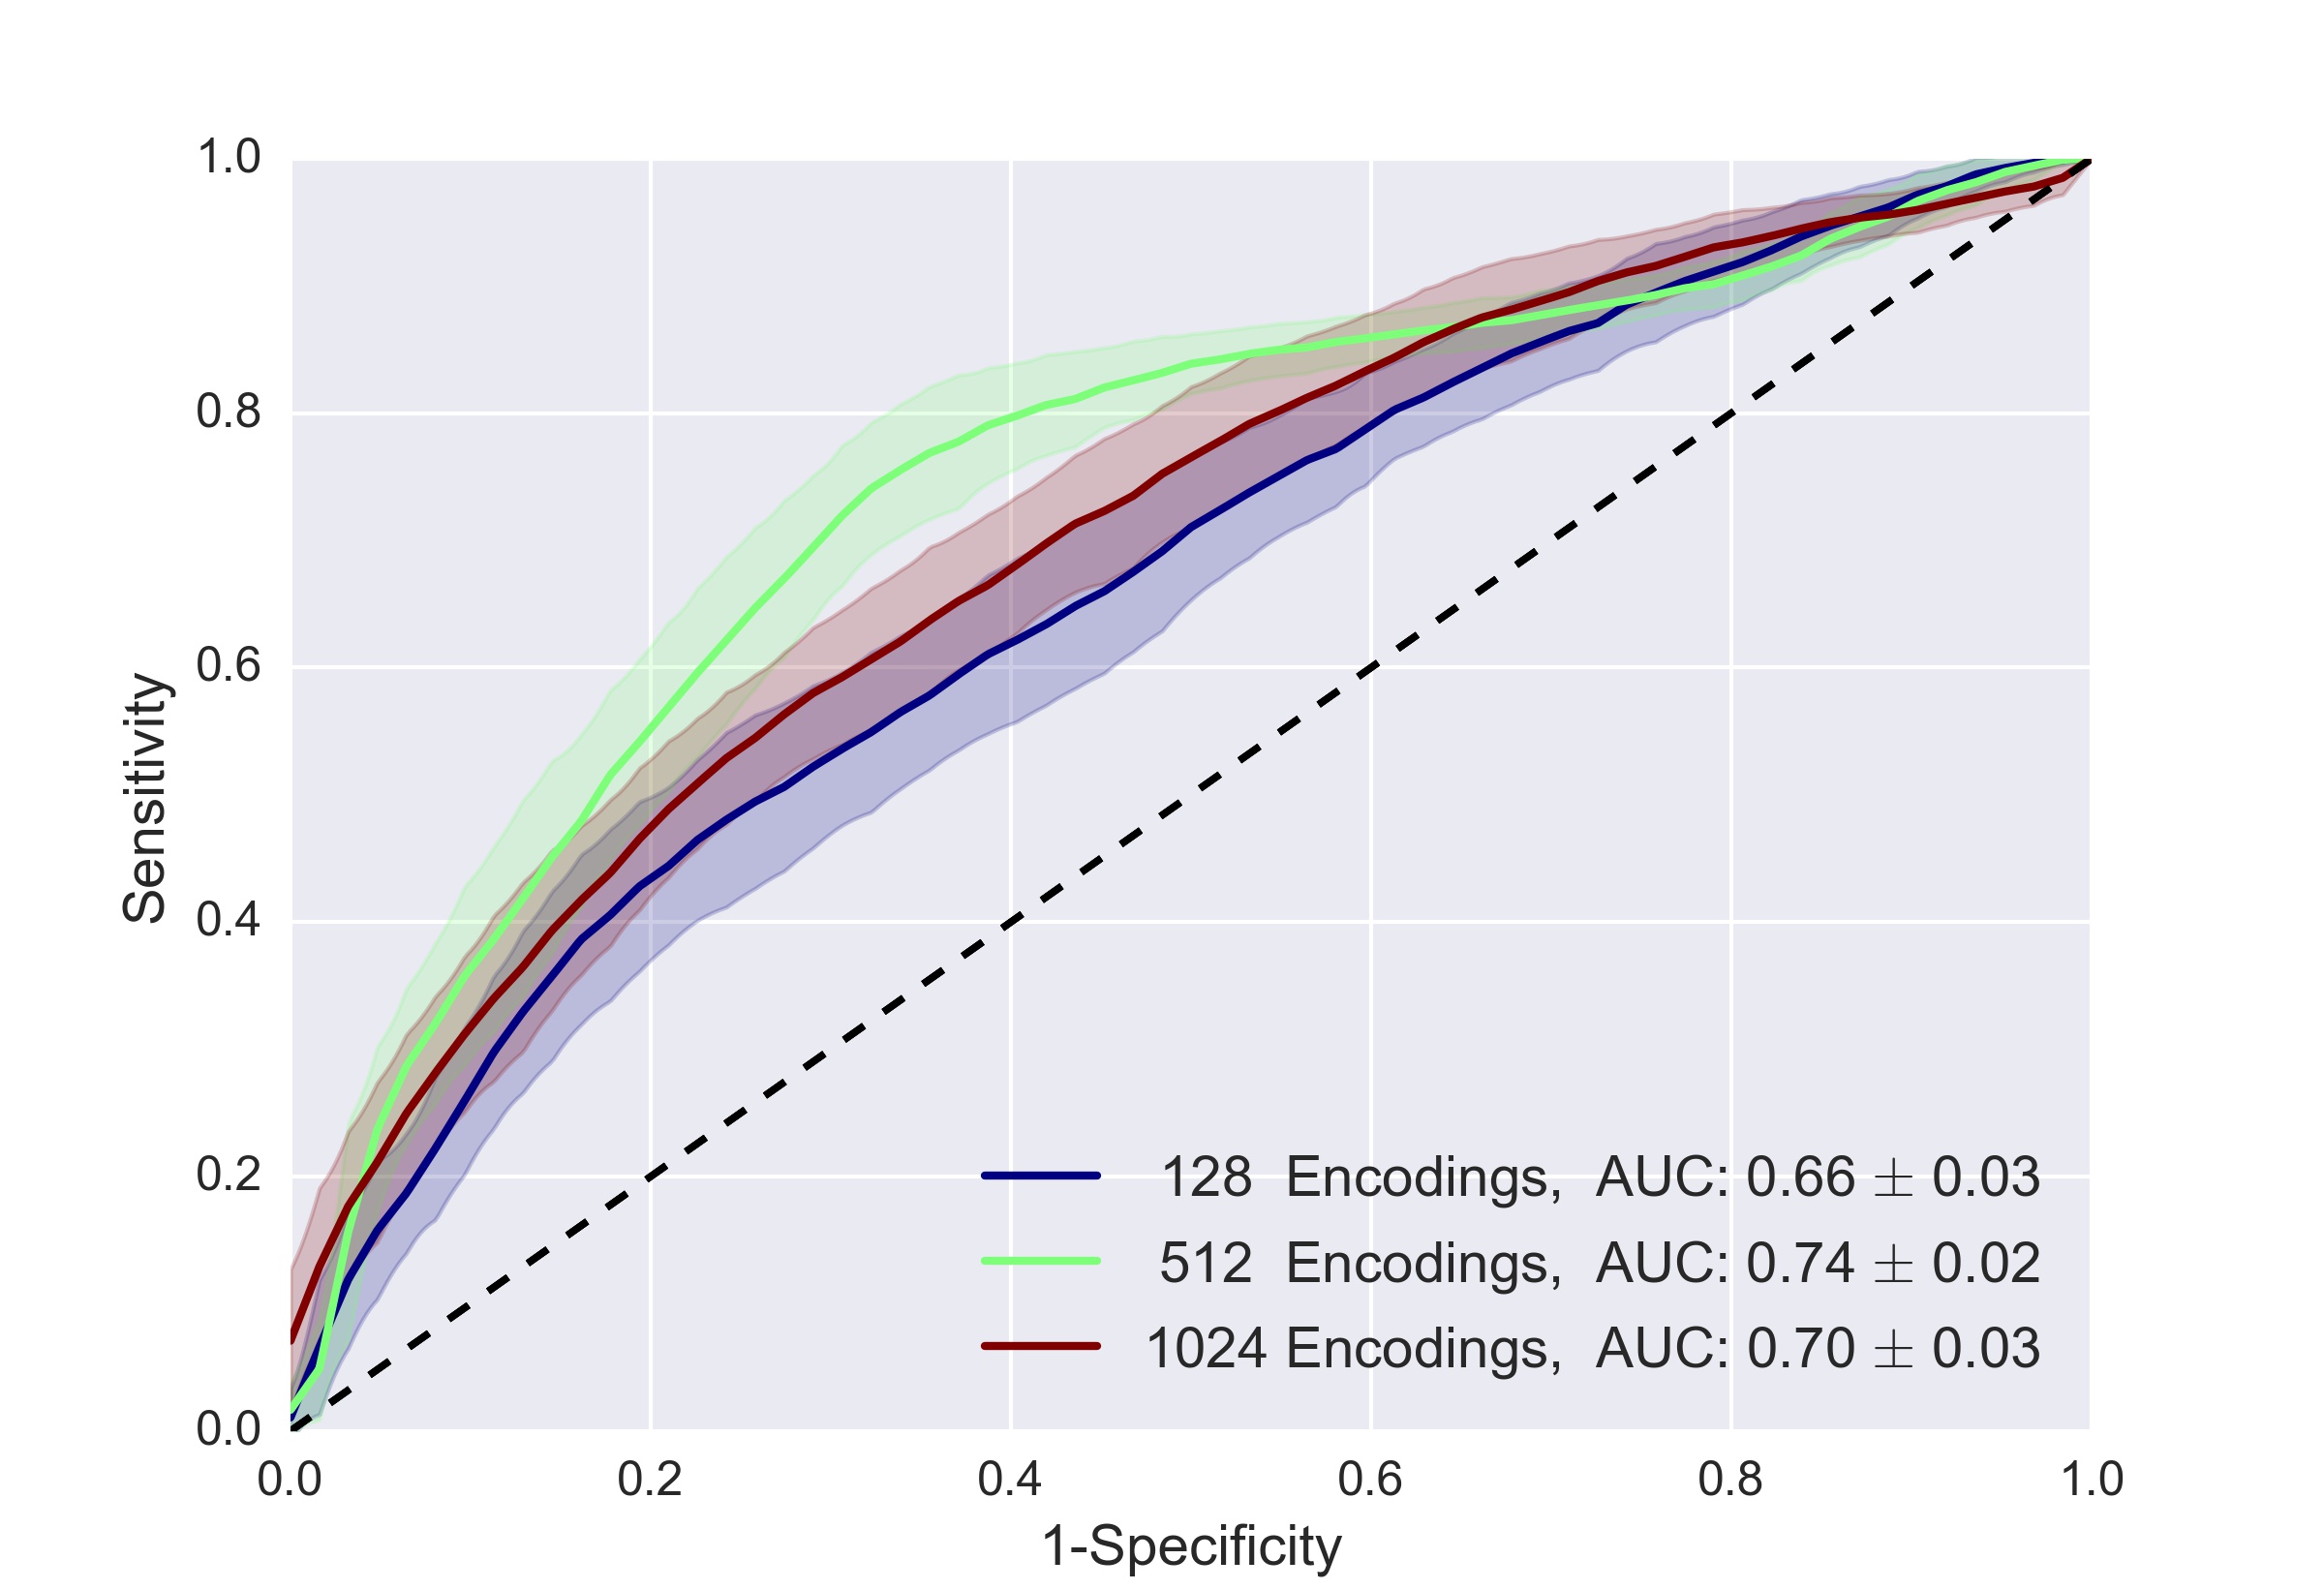
To evaluate the effect of the number of used encodings on patient classification, two additional experiments with different numbers of the encodings, namely 128 and 1024, were performed. For this purpose, two additional CAEs were trained and used to encode myocardial voxels. The architecture of these CAEs is identical to the one illustrated in Fig. 6, only the number of units in the fully connected layer (encodings layer) was changed to 128 or 1024, respectively. In both experiments, the number of clusters was set to 500. The results are illustrated in Fig. 11 (b). The obtained AUC ranged from 0.66 to 0.74, while the highest AUC was obtained with 512 encodings.

5.6 The Effect of Seed Initialization
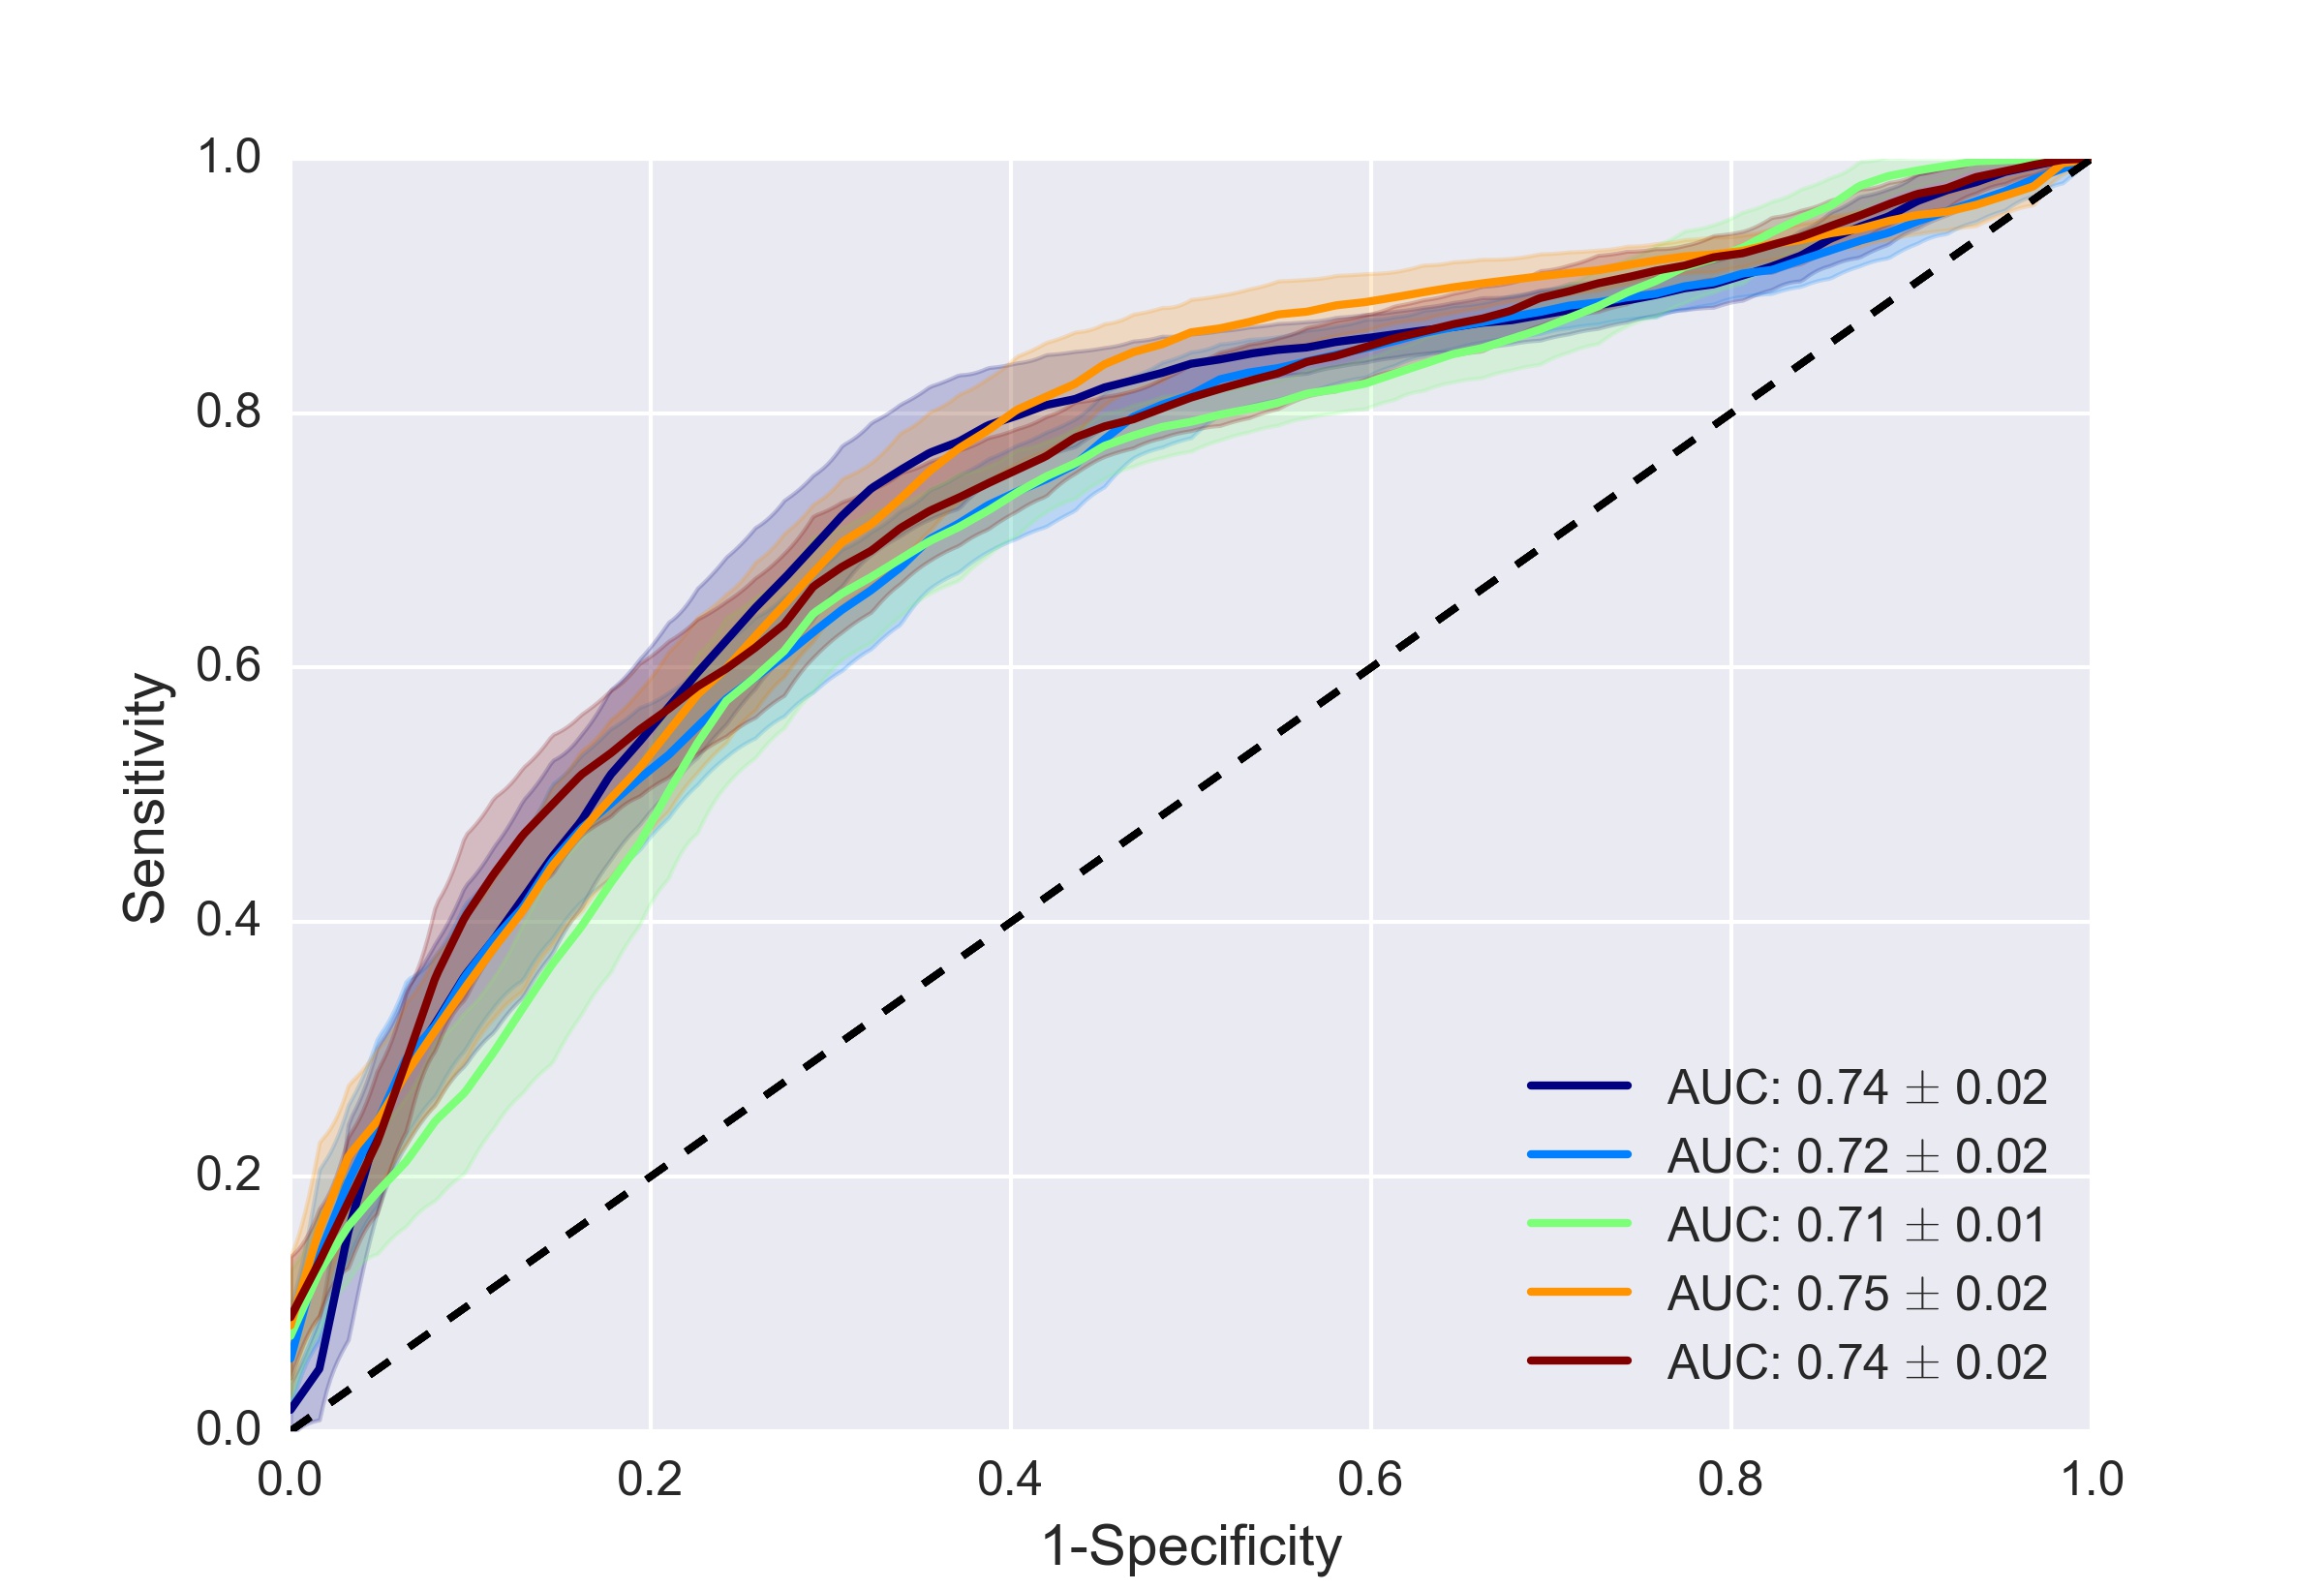
The clustering algorithm uses random initialization of the centers of the clusters (seeds) [Sculley, 2010]. This may potentially lead to different clusters and thereby different feature values which may lead to different patient classification. To evaluate the effect of the seed initialization, four additional experiments were performed using different random seed initializations. The number of clusters and encodings was not altered, and was set to 500 and 512, respectively. In these experiments, the obtained AUC ranged from 0.71 to 0.75. The results are shown in Fig. 11 (c).
5.7 The Effect of FFR Cut-off Values
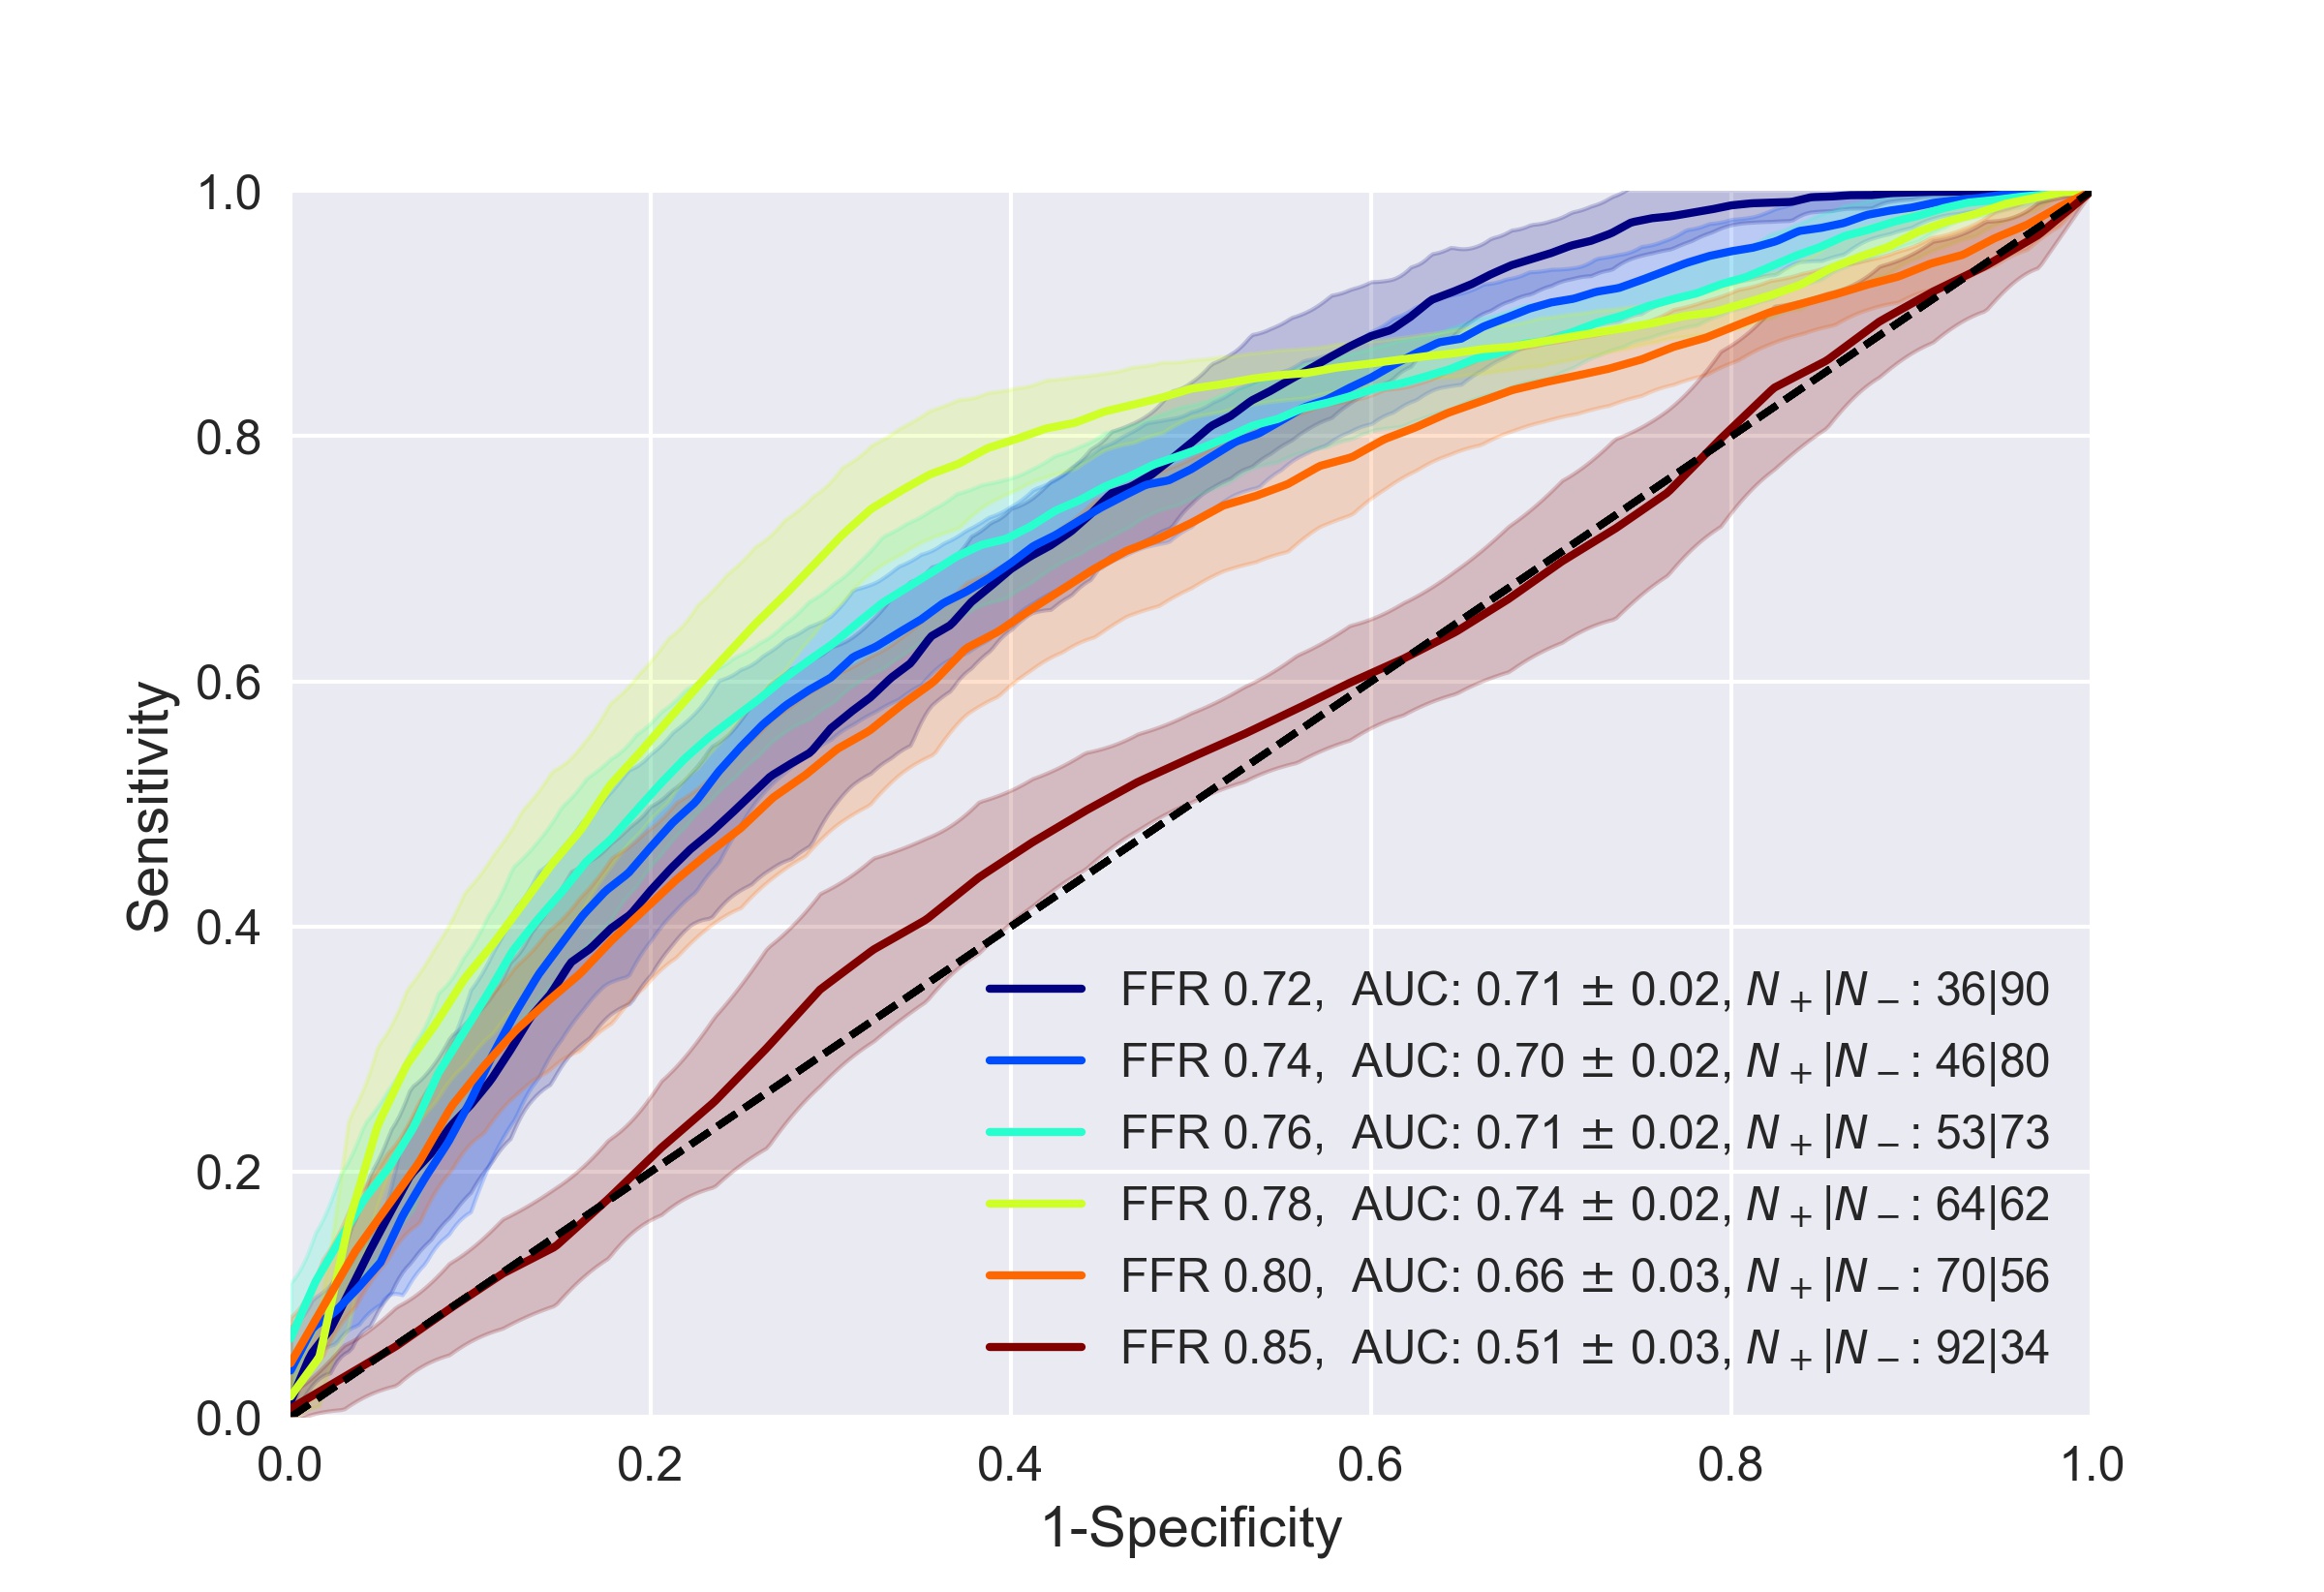
In the literature [Pijls et al., 1996, De Bruyne et al., 2001, Samady et al., 2006, De Bruyne and Sarma, 2008, Petraco et al., 2013], different cut-off values on the FFR have been used to separate patients with functionally significant stenosis from those without it. These values range from 0.72 to 0.8. Therefore, with fixed number of clusters and encodings (500 and 512, respectively), the performance of the classification using five additional FFR cut-off values, namely 0.72, 0.74, 0.76, 0.8 and 0.85, was investigated. The results are shown in Fig. 11 (d). The obtained AUC ranged from 0.51 when using the 0.85 cut-off value to 0.74 while using the 0.78 cut-off value on FFR.
5.8 The Effect of Segmentation Accuracy
An accurate LV myocardium segmentation is a prerequisite for accurate patient classification. To evaluate whether inaccuracies generated by our automatic myocardium segmentation have an impact of the patient classification, manual correction of the automatic segmentation results graded as 2 (mostly accurate) or 3 (inaccurate) (Table 2) has been performed. Thereafter, all subsequent analysis using the same set of patients (126) was repeated. The analysis has resulted in an AUC of vs. AUC previously achieved when relying on automatic segmentation. The results were not statistically significant ().
5.9 Comparison with Other Methods
To allow comparison of the results obtained by the proposed method with previously published work, Table 3 lists the results as reported in the original publications. Note that these methods were evaluated with different patients and scans, and by using different evaluation metrics. Hence, these results can be used only as indication of the differences in the performance.
| Per-patient | Per-vessel | ||||||
| Study | Patients | Vessels | Accuracy | AUC | Accuracy | AUC | |
| Blood flow | Min et al. [2012] | 252 | - | 0.71 | 0.81 | - | - |
| Nørgaard et al. [2014] | 254 | 484 | 0.81 | 0.90 | 0.86 | 0.93 | |
| Renker et al. [2014] | 53 | 67 | 0.86 | - | 0.85 | - | |
| Coenen et al. [2015] | 106 | 189 | - | - | 0.74 | - | |
| Myo. | Han et al. [2017] | 252 | 407 | 0.63 | - | 0.57 | - |
| Ours | 126 | - | 0.71 | 0.74 | - | - | |
The results indicate that the methods utilizing analysis of the blood flow tend to archive higher per-patient accuracy. The results also show that the proposed approach seems to outperform recently proposed method relying on the LV myocardium analysis proposed by Han et al. [2017], employing the method presented by Xiong et al. [2015]. Also, the achieved accuracy equal to the method performing analysis of the blood flow by Min et al. [2012].
6 Discussion and Conclusion
A method for identification of patients with functionally significant stenosis in the coronary arteries has been presented. Unlike previous methods that determine the functional significance of coronary artery stenosis relying on the analysis of the coronary artery tree in CCTA scans [Taylor et al., 2013, Steigner et al., 2010, Itu et al., 2012, Nickisch et al., 2015], this method analyzes the LV myocardium only. The algorithm first performs automatic segmentation of the LV myocardium. The segmented myocardium is subsequently encoded using a CAE, and the encoding statistics are used to classify patients into those with and without functionally significant coronary artery stenosis. The reference for the presence of functionally significant coronary artery stenosis was provided by invasively obtained FFR measurements that are currently considered the clinical standard.
Our experiments show that moderate performance with average accuracy, sensitivity and specificity of 0.71, 0.70 and 0.71, respectively and AUC for identifying patients with functionally significant stenosis could be achieved by only using features extracted from the LV myocardium. The results demonstrate that myocardial information, derived directly from a single CCTA at rest using a trained CAE, has reasonable predictive ability compared with invasive FFR measurements obtained during ICA. As shown in Table 3, the proposed method seems to outperform the results reported by Han et al. [2017]. Unlike Han et al. [2017], that performed patient classification based on engineered LV myocardium features, we have relied on convolutional auto-encoder to learn the discriminative encodings. As the characteristics of the LV myocardium in a rest CCTA affected by ischemic changes are not (well-)defined and presently there is no consensus regarding their appearance [Spiro et al., 2013, Xiong et al., 2015], it is likely that our unsupervised approach led to higher diagnostic accuracy than the designed features approach presented in Han et al. [2017]. The learned encodings were able to represent myocardium voxels accurately and densely, as was demonstrated visually by the small mean squared error between the input and the reconstructed examples (Fig. 9). Even though the encodings allowed extraction of features that were used for patient classification, they are hard to interpret precluding visualization of the location and appearance of ischemia. In spite of excellent performance of deep learning techniques demonstrated in many medical image analysis tasks, revealing their inner dynamics is beyond the scope of this work.
Segmentation of the LV myocardium is a prerequisite for patient classification. Any accurate automatic (e.g. Zheng et al. [2008], Kirişli et al. [2010], Xiong et al. [2015]) or manual segmentation could be employed. In this work, LV myocardium segmentation was performed automatically, and in a limited number of images the obtained quantitative evaluation demonstrated high segmentation performance. As patient classification depends on the LV segmentations, a qualitative evaluation of the automatic segmentation was performed on the complete set of CCTA images. Only the images with accurate automatic segmentations of the LV myocardium were analyzed further.
Nevertheless, automatic segmentation did not achieve satisfactory results in regions where the CCTA images lack contrast between the blood pool and the LV myocardium or between the right ventricle and the LV myocardium. Therefore, the affect of the accuracy of LV myocardium segmentation on patient classification was examined. The results shown in Section 5.8, indicate that small inaccuracies in the automatic segmentation do not significantly influence patient classification. However, to further improve the segmentation, future work could take shape priors or constrains into account to compensate for the lack of contrast in these regions. Moreover, fully convolutional networks [Long et al., 2015] like U-net [Ronneberger et al., 2015], which perform segmentation on an entire image rather than per voxel classification, could be employed to achieve more accurate LV myocardium segmentation. Additionally, in future work, it would be interesting to address the use of 3D analysis instead of 2.5D approach to leverage the volumetric information. However, given the current trade-off between size of the receptive field and hardware limitations, 2.5D approach was advantageous [Havaei et al., 2017].
The number of encodings provided by the CAE was also investigated (Fig. 11, (b)). Encoding the LV myocardium voxels with fewer encodings proved to have inferior performance . This is likely because of aggressive compression by the encoder, which could lead to underrepresentation of the input texture and morphology contained in the encodings, and therefore loosing valuable information. Increasing the number of encodings proved to be non-beneficial either, as in this case, the CAE possibly overfits the input patches due to its massive number of hyperparameters.
The myocardium was spatially clustered to preserve the local nature of ischemic changes in the myocardial texture. Size of the clusters, controlled by their number, is likely important for identification of patients with ischemia. Therefore, the number of defined clusters was investigated (Fig. 11, (a), Section 5.4). As expected, analyzing the myocardium as one cluster resulted in the worst classification performance. This is likely due to local impact of ischemia which is typically confined to the myocardial territory perfused by the stenotic coronary artery [Mehra et al., 2011, Rossi et al., 2014]. Thus, analyzing the myocardium globally (one cluster) masked local changes. Moreover, clustering the myocardium into small number of clusters (e.g. 17 like in the AHA 17-segment model or 10 as in Fig. 11, (a)) has not shown good performance, likely for the same reason. However, using too many clusters was not beneficial either, since the size of each cluster was likely too small to capture the inhomogeneity within that region.
Additional evaluation was performed using random but different seed initializations used for clustering the LV myocardium. The results (Fig. 11 (c)) show that the method is sensitive to initialization, where the average AUC for patient classification ranged from 0.71 to 0.75. These findings suggest that further research towards finding a more robust clustering approach needs to be conducted. For instance, dividing the LV myocardium into territories that enable relating them with the coronary arteries segments perfusing them could be beneficial, as has been proven in the visual assessment of myocardial perfusion defects [Cerci et al., 2012]. However, this would require automatic localization of several anatomical landmarks, like the mitral valve and the apex of the heart, which is beyond the scope of the current work. Moreover, clustering the LV myocardium into supervoxels, using e.g SLIC [Achanta et al., 2012], and taking into account the values of the myocardial voxels rather than their locations, might be beneficial.
In this work, simple statistics, namely standard deviation and maximum, were used to reduce the high dimensionality of the clustered voxels’ encodings. Future work could investigate alternative ways of compressing the local encodings, e.g. restricted Boltzmann machine or deep belief networks [Hinton and Salakhutdinov, 2006, Lee et al., 2009, Bengio et al., 2013]. These generative approaches, which belong to the undirected graphical models, could be employed to represent a group of voxel encodings by more compressed but yet descriptive representations. Moreover, the CAE network was restricted to the analysis of 2D patches to avoid overfitting, to keep the number of trainable hyperparameters low, and to limit computational costs. Nonetheless, encoding 3D sub-volumes of the LV myocardium could be beneficial because the myocardium is a 3D object and extracting features from its volumetric sub-regions could capture useful information that may have not been captured in the 2D encoding.
Several studies investigated the reproducibility and the variability of repeated FFR measurements [Ntalianis et al., 2010, Berry et al., 2013, Petraco et al., 2013, Johnson et al., 2014]. These studies reported different values (range to ) for the standard deviation of the differences in repeated FFR measurements. However, these studies all agree that when a measured FFR falls within the ”gray-zone”, a value between 0.75 and 0.80, a single fixed cut-off point on the FFR measurement cannot by itself determine the functional significance of a stenosis, and therefore a broad clinical judgment is needed. Within this gray-zone, the uncertainty of an FFR measurement is high. In this study, we also evaluated different cut-off points on FFR (Fig. 11 (d)). When a high value of 0.85 and a low value of 0.72 were used, the data set was unbalanced with respect to class labels. Namely, when a value of 0.85 was used for the FFR cut-off point, the dataset contained 92 positive and 34 negative samples, and when 0.72 was used, the dataset contained 36 positive and 90 negative samples (Fig. 11 (d)). While these two cases are almost symmetrical with respect to the positive and negative class sample ration, the method only performs poorly (AUC ) when using 0.85 as a cut-off value. This result was expected as this cut-off point is not hemodynamically or functionally relevant and is not used in clinical practice to identify functionally significant stenoses. These results show that patient classification is not biased towards the majority class in the dataset, but is sensitive to the functional significance of the stenoses.
Assessment of the coronary artery tree in CCTA scans has a high sensitivity in detecting the functional significance of a detected stenosis, but with limited specificity [Meijboom et al., 2008, Bamberg et al., 2011, Ko et al., 2012]. Therefore, to improve the specificity of CCTA and prevent patients from undergoing ICA unnecessarily, future work will investigate the incremental diagnostic value of integrating the presented method with the assessment of the coronary arteries and their characteristics in CCTA.
The proposed approach does not identify specific stenosis that is functionally significant but only determines whether a patient has a stenosis that is functionally significant. Future work may address this limitation. Given the moderate accuracy of our and the previous method [Han et al., 2017], future studies are needed to increase the accuracy of these approaches. For this purpose, a combination of computational fluid dynamics in the coronary arteries and image analysis of the LV myocardium could be considered. Finally, future work should evaluate this method using a larger set of scans from different vendors and hospitals.
To conclude, this study presented a novel algorithm for automatic classification of patients according to the presence of functionally significant stenosis in one or more coronary arteries, using only information extracted from the LV myocardium in a single rest CCTA scan. This could potentially reduce the number of patients that unnecessarily undergo invasive FFR measurements.
7 Acknowledgments
We would like to thank Samuel St-Jean for helping us out with LaTeX.
This study was financially supported by the project FSCAD, funded by the Netherlands Organization for Health Research and Development (ZonMw) in the framework of the research programme IMDI (Innovative Medical Devices Initiative); project 104003009. We gratefully acknowledge the support of NVIDIA Corporation with the donation of the Tesla K40 GPU used for this research.
References
- Abadi et al. [2010] Abadi, S., Roguin, A., Engel, A., Lessick, J., 2010. Feasibility of automatic assessment of four-chamber cardiac function with MDCT: Initial clinical application and validation. European Journal of Radiology 74, 175–181.
- Achanta et al. [2012] Achanta, R., Shaji, A., Smith, K., Lucchi, A., Fua, P., Susstrunk, S., 2012. SLIC superpixels compared to state-of-the-art superpixel methods. IEEE Transactions on Pattern Analysis and Machine Intelligence 34, 2274–2282.
- Balkin et al. [1993] Balkin, J., Zion, M.M., Rosenmann, D., Ilan, M., Klutstein, M., Abraham, A.S., 1993. Progression and regression of coronary artery disease in one year. The International Journal of Cardiac Imaging 9, 213–217.
- Bamberg et al. [2011] Bamberg, F., Becker, A., Schwarz, F., Marcus, R.P., Greif, M., von Ziegler, F., Blankstein, R., Hoffmann, U., Sommer, W.H., Hoffmann, V.S., et al., 2011. Detection of hemodynamically significant coronary artery stenosis: incremental diagnostic value of dynamic CT-based myocardial perfusion imaging. Radiology 260, 689–698.
- Bengio et al. [2013] Bengio, Y., Courville, A., Vincent, P., 2013. Representation learning: A review and new perspectives. IEEE Transactions on Pattern Analysis and Machine Intelligence 35, 1798–1828.
- Berry et al. [2013] Berry, C., van’t Veer, M., Witt, N., Kala, P., Bocek, O., Pyxaras, S.A., McClure, J.D., Fearon, W.F., Barbato, E., Tonino, P.A., et al., 2013. VERIFY (verification of instantaneous wave-free ratio and fractional flow reserve for the assessment of coronary artery stenosis severity in everyday practice): a multicenter study in consecutive patients. Journal of the American College of Cardiology 61, 1421–1427.
- de Brebisson and Montana [2015] de Brebisson, A., Montana, G., 2015. Deep neural networks for anatomical brain segmentation, in: Proceedings of the IEEE Conference on Computer Vision and Pattern Recognition Workshops, pp. 20–28.
- Budoff et al. [2008] Budoff, M.J., Dowe, D., Jollis, J.G., Gitter, M., Sutherland, J., Halamert, E., Scherer, M., Bellinger, R., Martin, A., Benton, R., et al., 2008. Diagnostic performance of 64-multidetector row coronary computed tomographic angiography for evaluation of coronary artery stenosis in individuals without known coronary artery disease: results from the prospective multicenter ACCURACY trial. Journal of the American College of Cardiology 52, 1724–1732.
- Cerci et al. [2012] Cerci, R.J., Arbab-Zadeh, A., George, R.T., Miller, J.M., Vavere, A.L., Mehra, V., Yoneyama, K., Texter, J., Foster, C., Guo, W., et al., 2012. Aligning coronary anatomy and myocardial perfusion territories an algorithm for the CORE320 multicenter study. Circulation: Cardiovascular Imaging 5, 587–595.
- Cerqueira et al. [2002] Cerqueira, M.D., Weissman, N.J., Dilsizian, V., Jacobs, A.K., Kaul, S., Laskey, W.K., Pennell, D.J., Rumberger, J.A., Ryan, T., Verani, M.S., 2002. Standardized myocardial segmentation and nomenclature for tomographic imaging of the heart: a statement for healthcare professionals from the cardiac imaging committee of the council on clinical cardiology of the american heart association. Circulation 105, 539–542.
- Clevert et al. [2015] Clevert, D.A., Unterthiner, T., Hochreiter, S., 2015. Fast and accurate deep network learning by exponential linear units (elus). arXiv preprint arXiv:1511.07289 .
- Coenen et al. [2015] Coenen, A., Lubbers, M.M., Kurata, A., Kono, A., Dedic, A., Chelu, R.G., Dijkshoorn, M.L., Gijsen, F.J., Ouhlous, M., van Geuns, R.J.M., et al., 2015. Fractional flow reserve computed from noninvasive ct angiography data: diagnostic performance of an on-site clinician-operated computational fluid dynamics algorithm. Radiology 274, 674–683.
- Cortes and Vapnik [1995] Cortes, C., Vapnik, V., 1995. Support-vector networks. Machine Learning 20, 273–297.
- De Bruyne et al. [2001] De Bruyne, B., Pijls, N.H., Bartunek, J., Kulecki, K., Bech, J.W., De Winter, H., Van Crombrugge, P., Heyndrickx, G.R., Wijns, W., 2001. Fractional flow reserve in patients with prior myocardial infarction. Circulation 104, 157–162.
- De Bruyne and Sarma [2008] De Bruyne, B., Sarma, J., 2008. Fractional flow reserve: a review. Heart 94, 949–959.
- Gärtner et al. [2002] Gärtner, T., Flach, P.A., Kowalczyk, A., Smola, A.J., 2002. Multi-instance kernels., in: ICML, pp. 179–186.
- George et al. [2009] George, R.T., Arbab-Zadeh, A., Miller, J.M., Kitagawa, K., Chang, H.J., Bluemke, D.A., Becker, L., Yousuf, O., Texter, J., Lardo, A.C., et al., 2009. Adenosine stress 64-and 256-row detector computed tomography angiography and perfusion imaging a pilot study evaluating the transmural extent of perfusion abnormalities to predict atherosclerosis causing myocardial ischemia. Circulation: Cardiovascular Imaging 2, 174–182.
- Han et al. [2017] Han, D., Lee, J.H., Rizvi, A., Gransar, H., Baskaran, L., Schulman-Marcus, J., ó Hartaigh, B., Lin, F.Y., Min, J.K., 2017. Incremental role of resting myocardial computed tomography perfusion for predicting physiologically significant coronary artery disease: A machine learning approach. Journal of Nuclear Cardiology , 1–11.
- Havaei et al. [2017] Havaei, M., Davy, A., Warde-Farley, D., Biard, A., Courville, A., Bengio, Y., Pal, C., Jodoin, P.M., Larochelle, H., 2017. Brain tumor segmentation with deep neural networks. Medical image analysis 35, 18–31.
- Hinton and Salakhutdinov [2006] Hinton, G.E., Salakhutdinov, R.R., 2006. Reducing the dimensionality of data with neural networks. Science 313, 504–507.
- Ioffe and Szegedy [2015] Ioffe, S., Szegedy, C., 2015. Batch normalization: Accelerating deep network training by reducing internal covariate shift, in: Proceedings of The 32nd International Conference on Machine Learning, pp. 448–456.
- Itu et al. [2012] Itu, L., Sharma, P., Mihalef, V., Kamen, A., Suciu, C., Lomaniciu, D., 2012. A patient-specific reduced-order model for coronary circulation, in: Biomedical Imaging (ISBI), 2012 9th IEEE International Symposium on, IEEE. pp. 832–835.
- Johnson et al. [2014] Johnson, N.P., Pijls, N.H., De Bruyne, B., Bech, G.J.W., Kirkeeide, R.L., Gould, K.L., 2014. A black and white response to the “gray zone” for fractional flow reserve measurements. JACC: Cardiovascular Interventions 7, 227–228.
- Kamnitsas et al. [2016] Kamnitsas, K., Ledig, C., Newcombe, V.F., Simpson, J.P., Kane, A.D., Menon, D.K., Rueckert, D., Glocker, B., 2016. Efficient multi-scale 3d cnn with fully connected crf for accurate brain lesion segmentation. Medical image analysis 36, 61–78.
- Kirişli et al. [2010] Kirişli, H., Schaap, M., Klein, S., Papadopoulou, S., Bonardi, M., Chen, C.H., Weustink, A., Mollet, N., Vonken, E., van der Geest, R., et al., 2010. Evaluation of a multi-atlas based method for segmentation of cardiac CTA data: a large-scale, multicenter, and multivendor study. Medical Physics 37, 6279–6291.
- Ko et al. [2012] Ko, B.S., Cameron, J.D., Leung, M., Meredith, I.T., Leong, D.P., Antonis, P.R., Crossett, M., Troupis, J., Harper, R., Malaiapan, Y., et al., 2012. Combined CT coronary angiography and stress myocardial perfusion imaging for hemodynamically significant stenoses in patients with suspected coronary artery disease: a comparison with fractional flow reserve. JACC: Cardiovascular Imaging 5, 1097–1111.
- Koo [2014] Koo, B.K., 2014. The present and future of fractional flow reserve. Circulation Journal 78, 1048–1054.
- LeCun et al. [2015] LeCun, Y., Bengio, Y., Hinton, G., 2015. Deep learning. Nature 521, 436–444.
- Lee et al. [2009] Lee, H., Grosse, R., Ranganath, R., Ng, A.Y., 2009. Convolutional deep belief networks for scalable unsupervised learning of hierarchical representations, in: Proceedings of the 26th Annual International Conference on Machine Learning, pp. 609–616.
- Litjens et al. [2017] Litjens, G., Kooi, T., Bejnordi, B.E., Setio, A.A.A., Ciompi, F., Ghafoorian, M., van der Laak, J.A., van Ginneken, B., Sánchez, C.I., 2017. A survey on deep learning in medical image analysis. Medical Image Analysis 42, 60 – 88. URL: http://www.sciencedirect.com/science/article/pii/S1361841517301135, doi:https://doi.org/10.1016/j.media.2017.07.005.
- Long et al. [2015] Long, J., Shelhamer, E., Darrell, T., 2015. Fully convolutional networks for semantic segmentation, in: Proceedings of the IEEE Conference on Computer Vision and Pattern Recognition, pp. 3431–3440.
- Marie-Pierre [2006] Marie-Pierre, J., 2006. Automatic segmentation of the left ventricle in cardiac MR and CT images. International Journal of Computer Vision 70, 151–163.
- Masci et al. [2011] Masci, J., Meier, U., Cireşan, D., Schmidhuber, J., 2011. Stacked convolutional auto-encoders for hierarchical feature extraction, in: Artificial Neural Networks and Machine Learning–ICANN 2011. Springer, pp. 52–59.
- Mehra et al. [2011] Mehra, V.C., Valdiviezo, C., Arbab-Zadeh, A., Ko, B.S., Seneviratne, S.K., Cerci, R., Lima, J.A., George, R.T., 2011. A stepwise approach to the visual interpretation of CT-based myocardial perfusion. Journal of Cardiovascular Computed Tomography 5, 357–369.
- Meijboom et al. [2008] Meijboom, W.B., Van Mieghem, C.A., van Pelt, N., Weustink, A., Pugliese, F., Mollet, N.R., Boersma, E., Regar, E., van Geuns, R.J., de Jaegere, P.J., et al., 2008. Comprehensive assessment of coronary artery stenoses: computed tomography coronary angiography versus conventional coronary angiography and correlation with fractional flow reserve in patients with stable angina. Journal of the American College of Cardiology 52, 636–643.
- Min et al. [2012] Min, J.K., Leipsic, J., Pencina, M.J., Berman, D.S., Koo, B.K., van Mieghem, C., Erglis, A., Lin, F.Y., Dunning, A.M., Apruzzese, P., et al., 2012. Diagnostic accuracy of fractional flow reserve from anatomic ct angiography. Jama 308, 1237–1245.
- Moeskops et al. [2016] Moeskops, P., Viergever, M.A., Mendrik, A.M., de Vries, L.S., Benders, M.J., Išgum, I., 2016. Automatic segmentation of MR brain images with a convolutional neural network. IEEE Transactions on Medical Imaging 35, 1252–1261.
- Mozaffarian et al. [2016] Mozaffarian, D., Benjamin, E.J., Go, A.S., Arnett, D.K., Blaha, M.J., Cushman, M., Das, S.R., de Ferranti, S., Després, J.P., Fullerton, H.J., et al., 2016. Heart disease and stroke statistics - 2016 update. Circulation 133, e38–e360.
- Nesterov et al. [2007] Nesterov, Y., et al., 2007. Gradient methods for minimizing composite objective function. Technical Report. UCL.
- Nickisch et al. [2015] Nickisch, H., Lamash, Y., Prevrhal, S., Freiman, M., Vembar, M., Goshen, L., Schmitt, H., 2015. Learning patient-specific lumped models for interactive coronary blood flow simulations, in: International Conference on Medical Image Computing and Computer-Assisted Intervention, Springer. pp. 433–441.
- Nikolaou et al. [2006] Nikolaou, K., Knez, A., Rist, C., Wintersperger, B.J., Leber, A., Johnson, T., Reiser, M.F., Becker, C.R., 2006. Accuracy of 64-mdct in the diagnosis of ischemic heart disease. American Journal of Roentgenology 187, 111–117.
- Nørgaard et al. [2014] Nørgaard, B.L., Leipsic, J., Gaur, S., Seneviratne, S., Ko, B.S., Ito, H., Jensen, J.M., Mauri, L., De Bruyne, B., Bezerra, H., et al., 2014. Diagnostic performance of noninvasive fractional flow reserve derived from coronary computed tomography angiography in suspected coronary artery disease: the nxt trial (analysis of coronary blood flow using ct angiography: Next steps). Journal of the American College of Cardiology 63, 1145–1155.
- Ntalianis et al. [2010] Ntalianis, A., Sels, J.W., Davidavicius, G., Tanaka, N., Muller, O., Trana, C., Barbato, E., Hamilos, M., Mangiacapra, F., Heyndrickx, G.R., et al., 2010. Fractional flow reserve for the assessment of nonculprit coronary artery stenoses in patients with acute myocardial infarction. JACC: Cardiovascular Interventions 3, 1274–1281.
- van Nunen et al. [2015] van Nunen, L.X., Zimmermann, F.M., Tonino, P.A., Barbato, E., Baumbach, A., Engstrøm, T., Klauss, V., MacCarthy, P.A., Manoharan, G., Oldroyd, K.G., et al., 2015. Fractional flow reserve versus angiography for guidance of PCI in patients with multivessel coronary artery disease (FAME): 5-year follow-up of a randomised controlled trial. The Lancet 386, 1853–1860.
- Osawa et al. [2016] Osawa, K., Miyoshi, T., Miki, T., Koyama, Y., Sato, S., Kanazawa, S., Ito, H., 2016. Diagnostic performance of first-pass myocardial perfusion imaging without stress with computed tomography (ct) compared with coronary ct angiography alone, with fractional flow reserve as the reference standard. PloS one 11, e0149170.
- Petraco et al. [2013] Petraco, R., Sen, S., Nijjer, S., Echavarria-Pinto, M., Escaned, J., Francis, D.P., Davies, J.E., 2013. Fractional flow reserve–guided revascularization: practical implications of a diagnostic gray zone and measurement variability on clinical decisions. JACC: Cardiovascular Interventions 6, 222–225.
- Pijls et al. [1996] Pijls, N.H., de Bruyne, B., Peels, K., van der Voort, P.H., Bonnier, H.J., Bartunek, J., Koolen, J.J., 1996. Measurement of fractional flow reserve to assess the functional severity of coronary-artery stenoses. New England Journal of Medicine 334, 1703–1708.
- Pijls et al. [2010] Pijls, N.H., Fearon, W.F., Tonino, P.A., Siebert, U., Ikeno, F., Bornschein, B., van’t Veer, M., Klauss, V., Manoharan, G., Engstrøm, T., et al., 2010. Fractional flow reserve versus angiography for guiding percutaneous coronary intervention in patients with multivessel coronary artery disease: 2-year follow-up of the FAME (fractional flow reserve versus angiography for multivessel evaluation) study. Journal of the American College of Cardiology 56, 177–184.
- Pijls et al. [2013] Pijls, N.H., Tanaka, N., Fearon, W.F., 2013. Functional assessment of coronary stenoses: can we live without it? European Heart Journal 34, 1335–1344.
- Renker et al. [2014] Renker, M., Schoepf, U.J., Wang, R., Meinel, F.G., Rier, J.D., Bayer, R.R., Möllmann, H., Hamm, C.W., Steinberg, D.H., Baumann, S., 2014. Comparison of diagnostic value of a novel noninvasive coronary computed tomography angiography method versus standard coronary angiography for assessing fractional flow reserve. The American journal of cardiology 114, 1303–1308.
- Ronneberger et al. [2015] Ronneberger, O., Fischer, P., Brox, T., 2015. U-net: Convolutional networks for biomedical image segmentation, in: Medical Image Computing and Computer-Assisted Intervention–MICCAI 2015. Springer, pp. 234–241.
- Rossi et al. [2014] Rossi, A., Merkus, D., Klotz, E., Mollet, N., de Feyter, P.J., Krestin, G.P., 2014. Stress myocardial perfusion: imaging with multidetector CT. Radiology 270, 25–46.
- Samady et al. [2006] Samady, H., Lepper, W., Powers, E.R., Wei, K., Ragosta, M., Bishop, G.G., Sarembock, I.J., Gimple, L., Watson, D.D., Beller, G.A., et al., 2006. Fractional flow reserve of infarct-related arteries identifies reversible defects on noninvasive myocardial perfusion imaging early after myocardial infarction. Journal of the American College of Cardiology 47, 2187–2193.
- Schaap et al. [2009] Schaap, M., Metz, C.T., van Walsum, T., van der Giessen, A.G., Weustink, A.C., Mollet, N.R., Bauer, C., Bogunović, H., Castro, C., Deng, X., et al., 2009. Standardized evaluation methodology and reference database for evaluating coronary artery centerline extraction algorithms. Medical Image Analysis 13, 701–714.
- Sculley [2010] Sculley, D., 2010. Web-scale k-means clustering, in: Proceedings of the 19th international conference on World wide web, pp. 1177–1178.
- Shen et al. [2017] Shen, D., Wu, G., Suk, H.I., 2017. Deep learning in medical image analysis. Annual Review of Biomedical Engineering .
- Spiro et al. [2013] Spiro, A.J., Haramati, L.B., Jain, V.R., Godelman, A., Travin, M.I., Levsky, J.M., 2013. Resting cardiac 64-mdct does not reliably detect myocardial ischemia identified by radionuclide imaging. American Journal of Roentgenology 200, 337–342.
- Srivastava et al. [2014] Srivastava, N., Hinton, G., Krizhevsky, A., Sutskever, I., Salakhutdinov, R., 2014. Dropout: A simple way to prevent neural networks from overfitting. The Journal of Machine Learning Research 15, 1929–1958.
- Steigner et al. [2010] Steigner, M.L., Mitsouras, D., Whitmore, A.G., Otero, H.J., Wang, C., Buckley, O., Levit, N.A., Hussain, A.Z., Cai, T., Mather, R.T., et al., 2010. Iodinated contrast opacification gradients in normal coronary arteries imaged with prospectively ECG-Gated single heart beat 320-detector row computed tomography. Circulation: Cardiovascular Imaging 3, 179–186.
- Tavakoli and Amini [2013] Tavakoli, V., Amini, A.A., 2013. A survey of shaped-based registration and segmentation techniques for cardiac images. Computer Vision and Image Understanding 117, 966–989.
- Taylor et al. [2013] Taylor, C.A., Fonte, T.A., Min, J.K., 2013. Computational fluid dynamics applied to cardiac computed tomography for noninvasive quantification of fractional flow reserve: Scientific basis. Journal of the American College of Cardiology 61, 2233 – 2241.
- Tonino et al. [2009] Tonino, P.A., De Bruyne, B., Pijls, N.H., Siebert, U., Ikeno, F., vant Veer, M., Klauss, V., Manoharan, G., Engstrøm, T., Oldroyd, K.G., et al., 2009. Fractional flow reserve versus angiography for guiding percutaneous coronary intervention. New England Journal of Medicine 360, 213–224.
- de Vos et al. [2017] de Vos, B., Wolterink, J., de Jong, P., Leiner, T., Viergever, M., Išgum, I., 2017. ConvNet-Based localization of anatomical structures in 3D medical images. IEEE Transactions on Medical Imaging doi:10.1109/TMI.2017.2673121. In print.
- Xiong et al. [2015] Xiong, G., Kola, D., Heo, R., Elmore, K., Cho, I., Min, J.K., 2015. Myocardial perfusion analysis in cardiac computed tomography angiographic images at rest. Medical Image Analysis 24, 77–89.
- Zheng et al. [2008] Zheng, Y., Barbu, A., Georgescu, B., Scheuering, M., Comaniciu, D., 2008. Four-chamber heart modeling and automatic segmentation for 3-D cardiac CT volumes using marginal space learning and steerable features. IEEE Transactions on Medical Imaging 27, 1668–1681.
- Zhou et al. [2017] Zhou, S.K., Greenspan, H., Shen, D., 2017. Deep Learning for Medical Image Analysis. Academic Press.
- Zreik et al. [2016] Zreik, M., Leiner, T., de Vos, B.D., van Hamersvelt, R.W., Viergever, M.A., Išgum, I., 2016. Automatic segmentation of the left ventricle in cardiac CT angiography using convolutional neural networks, in: 2016 IEEE 13th International Symposium on Biomedical Imaging (ISBI), pp. 40–43.