,
Overstretching of B-DNA with various pulling protocols: Appearance of structural polymorphism and S-DNA
Abstract
We report a structural polymorphism of the S-DNA when a canonical B-DNA is stretched under different pulling protocols and provide a fundamental molecular understanding of the DNA stretching mechanism. Extensive all atom molecular dynamics simulations reveal a clear formation of S-DNA when the B-DNA is stretched along the directions of the opposite strands (OS) and is characterized by the changes in the number of H-bonds, entropy and free energy. Stretching along directions of the opposite strands (OS) leads to force induced melting form of the DNA. Interestingly, stretching along the opposite ends of the same strand (SS) leads to a coexistence of both the S- and melted M-DNA structures. We also do the structural characterization of the S-DNA by calculating various helical parameters. We find that S-DNA has a twist of degrees which corresponds to helical repeat length of base pairs in close agreement with the previous experimental results. Moreover, we find that the free energy barrier between the canonical and overstretched states of DNA is higher for the same termini (SE) pulling protocol in comparison to all other protocols considered in this work. Overall, our observations not only reconcile with the available experimental results qualitatively but also enhance the understanding of different overstretched DNA structures.
I Introduction
Double stranded DNA, a semi-flexible molecule bustamante94 ; marko95 ; bustamante97 can be found in different conformational forms alberts08 both in in vitro and in vivo environment. Presence of external force changes its structure and allows to assess the eventual polymorphism exhibited through various conformations with a change in the known helical parametersdehez17 ; dans12 . Within the context of the present work we use ‘polymorphism’ to broadly refer to the fact that for a given DNA sequence different pulling protocols give rise to different DNA structures. Single molecule pulling experiments (SMPE) smith92 ; bustamante96 ; caron96 ; nagy08 ; williams10 and simulation studies lavery96 ; caron96 ; kosikov99 ; harris05 ; piana05 ; lohikoski05 ; piana07 ; roe09 ; maiti09 ; harris10 ; kubar11 revealed that the canonical form of double stranded DNA (B-DNA) stretches almost twice its original contour length when subjected to stretching forces. Experimental studies smith92 ; bustamante96 ; caron96 ; block97 ; prentiss03 ; prentiss08 ; prentiss09 ; perkins12 ; yan12 report an overstretched transition of B-DNA when pulled with force ranging between pN, and the double strands separate at sufficiently high forces rief99 . A characteristic plateau has been observed in the force-extension curve of dsDNA that signifies a highly cooperative transition from B-DNA to an overstretched conformation caron96 . The study of the overstretching transition of DNA is essential to understand the DNA elasticity and the interactions of stretched DNA and small molecules.
Two different physical pictures has been emerged to explain the overstretching transition of DNA. Some experiments bustamante96 ; caron96 ; niklas12 ; karplus14 ; bolonick96 suggest that the dsDNA adopts a new elongated double stranded structure (called as S-DNA) in the overstretching regime. The stretching curve of such overstretching transition continues to very high forces in comparison to the overstretching force plateau. It has been proposed that in S-DNA base stacking is disrupted but base pairing remains preserved. In the absence of a full microscopic picture of S-DNA structure and its characteristics, the experimental data is often fit to some free parameters to interpret the existence of S-DNA cocco04 ; storm03 . In another picture a force induced melting (FIM) of DNA is proposed on the basis of thermodynamic measurements bloomfield101 ; peterman09 . Force induced melting occurs mostly in low GC content regions and only in DNA ends or nicks. Whether it is the emergence of S-DNA or the melted DNA in the overstretching regime, in both the cases the nature of resulting DNA structure is understood to depend on the rate of pulling gaub08 , direction of applied force lavery96 , salt concentration, DNA sequence and temperature yan10 . The structure of the overstretched state of the DNA is not yet fully resolved and is under intense debate bustamante96 ; caron96 ; cocco04 ; storm03 ; harris05 ; bloomfield101 ; leger99 ; bloomfield201 ; peterman09 ; mishra15 over the last two decades. Thus it is still an open question whether the overstretching transition leads to FIM or gives rise to S-DNA. Various experimental results and theoretical models exist to support both the physical pictures of the overstretched states. In the context of overstretched transition of DNA, Chaurasiya et al. williams10 in their review article report that FIM of DNA as the only valid picture instead of S-DNA picture because it requires extra fitting parameters and fails to show testable results. This view has been strongly criticized by Krichevsky krichevsky10 and Whitelam stephen10 . In their comments they provided supportive arguments in favor of S-DNA and exhibit some weakness of force induced melting picture. As a result McCauley et al. micah10 in their ‘reply to comment’ added both the model pictures associated with the overstretching transition of DNA without a concrete conclusion.
The H-bonded base-pairs in B-DNA prefer tilted orientation with respect to the backbone which prompted Lavery and Lebrun lavery96 to propose that the nature of overstretched structure depends on pulling scheme. Explicitly, the stretching along directions of the opposite strands (OS) is expected to increase the base-pair tilt compared to the stretching along the directions of the opposite strands (OS) direction (see Fig. 1 for a schematic). Consistent with the above arguments, Albrecht et al. gaub08 reported that the dsDNA is more stable when stretched with pulling protocol OS compared to that employed OS protocol. However, such differences are seen to be marginal when the rate of pulling force is low. Using constant force SMPE on -phage DNA, Danilowicz et al. prentiss09 reported that DNA becomes more stable with OS pulling than with OS pulling and further pointed out the differences between structures obtained from two different pulling protocols. They observed a narrow backbone spacing and rotated bases for the OS overstretched structure. Further, they found that the force induced separation of the DNA into single strands occur at higher forces for OS pulling than for OS pulling. Depending on the temperature and salt concentration, two types of overstretching transitions have been identified yan10 . Such transitions in the overstretching regime are characterized by hysteretic and non-hysteretic behavior in the stress-strain curves. In hysteretic double helix reorganization, slow peeling of one strand from its complementary strand occurs, and in non-hysteretic situation, the DNA adopts an elongated double-stranded form yan10 . Thermodynamic variables associated with these transitions were found to be different yan12 . For topologically closed but rotationally unconstrained DNA, Paik and Perkins perkins12 showed that the DNA exhibits overstretching transition at pN with no hysteresis. They further observed that degree of hysteresis in overstretching transition depends on the number of nicks present in the DNA. However, appearance of ss-DNA in overstretching does not necessarily originate from the free ends or nicks rather peeling is the basic cause for hysteresis in the force-strain curve. In another study, Zhang et al. yan14 reported interconversion between three overstretched states (S-DNA, DNA bubble, and peeled ssDNA) in the presence of monovalent salt at constant force.
A very few MD studies on the DNA overstretching have been reported in literature kosikov99 ; piana05 ; lohikoski05 ; roe09 ; harris10 ; kubar11 ; maitis11 ; maitij15 ; maiti16 , which predicted a ladder like structure in the overstretching regime. For instance, Balaeff et al. beratan11 observed a B-to-zip DNA transition instead of B-to-S DNA transition using steered molecular dynamics simulations. They proposed that S-DNA could be an intermediate state during this transition. Coarse-grained DNA models cieplak09 ; onufriev13 ; swigon12 ; kaxiras12 ; louis13 have also been used to understand several mechanisms related to the stretching behavior of DNA. For example, Romano et. al. louis13 using ox-DNA reported a detailed study of the overstretching transition of dsDNA and showed temperature dependence of overstretching force in good agreement with the available experimental results. However, in their study they did not find any evidence of the S-DNA. Although a qualitative understanding of different overstretching structures is apparent, a clear molecular level evidence and characterization of the S-DNA structure is still not available. Motivated by the above discussed lacunas, we seek to address several important questions regarding the emergence of S-DNA during DNA stretching in this article: (i) Does S-DNA adopt a helical or ladder-like structure? (ii) How does the helical parameters of S-DNA compare to the B-DNA? (iii) Whether the structure attributed to be the S-DNA bear intact base-pairs or internally melted? (iv) How does the potential of mean force (PMF) varies for various overstretching structures? (v) What is the melting force of different overstretched forms? (vi) How do the entropy and enthalpy change during the overstretching transition of DNA? etc. Using fully atomistic MD simulations we provide a comparative study that helps in characterizing the structural changes that occur during the pulling of B-DNA.
II Methods
We employ both non-equilibrium and equilibrium simulations as described in the following: (i) Non-equilibrium simulations: We used AMBER suite of programs ucsf with the AMBER parm99 force field wang00 along with the parmbsc0 corrections perez07 (together, referred to as ff10) to describe inter and intra-molecular interactions involving DNA hornak06 , the TIP3P model klein83 for water and Joung-Cheatham parameter for ions joung . The starting structures for the ds-DNA with the sequences of base-pairs d(CGCGAATTCGCG) and base-pairs d(CGTTGGTGCGGATATCTCGGTAGTGGGATA) were built using the nucgen module pearlman95 of the AMBER suite of programs. Using the LEaP module in AMBER, the ds-DNA structure was solvated with a water box. The box dimensions were chosen sufficiently large enough to ensure a minimum of Å solvation shell around the DNA in all the three directions in fully stretched form. We used periodic boundary conditions in all three directions during the simulation. To perform non-equilibrium simulations in the framework of constant-force ensemble, we modified the SANDER program pearlman95 to include the external stretching force maiti09 . The external force was applied on the O and O atoms of the two opposite ends of the DNA as schematically described in Fig. 1. Starting from pN, the external force was increased linearly with simulation time at a stretching rate of pN fs-1. During the simulation, bond lengths involving bonds to hydrogen atoms were constrained using SHAKE algorithm ryckaert77 . All the structures of DNA were visually inspected using VMD schulten96 . (ii) Equilibrium simulations: Umbrella sampling (US) simulations torrie77 were performed using PMEMD module of AMBER case14 with the ff force field hornak06 . The PMF was calculated by restraining the force centers with a harmonic potential, , where is the spring constant, and are the instantaneous and equilibrium distance between the force centers, respectively. The values of and separation between successive windows used in the PMF calculations are kcal/mol-Å2 and Å, respectively. The reaction coordinate was chosen as the distance, between force centers at the DNA termini. The choice of the force constant and the sampling window size was motivated by our previous US simulation studies maitim13 , which showed good convergence. The sampling of 1-D reaction coordinate was varied with a separation of Å to capture the entire unstretched canonical form to fully stretched conformation of DNA, ranging from Å to Å and Å to Å for OS and OS stretching, respectively. In each window ns NPT (constant number, constant pressure, and constant temperature, respectively) and ns NVT (constant number, constant volume, and constant temperature, respectively) production runs were performed frenkel02 . We used the equilibrated structure of the previous distance window as the starting structure for the subsequent window. Finally, weighted histogram analysis method kollman92 ; grossfield was used to calculate the unbiased PMF by subtracting the contribution of the biased harmonic potential. We have further verified (see SI: section I) that ns long trajectory gives sufficiently converged PMF (see figure S9 in SI). To check the convergence of PMF, we also continued our production runs up to ns in each distance window for OS and OS cases (see Fig. S10). All the helical parameters such as the rise, roll, shift, slide, tilt, and twist of the DNA were calculated using the Curves+ suite of programs lavery09 . The remainder of the paper is organized as follows: In the section III we discuss the various results obtained from our non-equilibrium and equilibrium pulling simulation. Section III A discusses the behavior of force-strain curves, section III B describes the effect of force on hydrogen bonds and emergence of S-DNA, section III C introduces the segmental analysis of H-bonds, section III D provides thermodynamics of different over- stretched states associated with various pulling scheme and finally section III E includes the effects of DNA length of S-DNA emergence. We note that the sections III A-C and III E discuss the results obtained from the non-equilibrium simulations and section III D introduces the results obtained from the equilibrium simulations.
III Results and Discussion
III.1 Force-strain curves
We apply external force on and terminal atoms of the two strands of the B-DNA in four different ways as schematically illustrated in Fig. 1. The strain is defined as the ratio of the instantaneous change in DNA length (taken as the average end-to-end - length of two strands) to its initial contour length garai15 . The force versus strain curves obtained from non-equilibrium pulling simulations are displayed in Fig. 1(e). Force-strain behavior is widely used to understand the DNA structure and dynamics. For all the present cases, we observe plateau and overstretching regimes, consistent with typical force-strain features reported previously bustamante96 ; prentiss09 ; maiti09 . However, we note that the length of the -DNA considered in experiments span few kilo base-pairs and the rate of pulling is slow compared to our atomistic simulations. This leads to the differences observed in force-extension behavior at a quantitative level. We find that at extremely low forces, the structural changes of the B-DNA are entropy driven, which can well be described by the inextensible worm-like chain model bustamante97 ; marko95 ; bustamante94 . In this regime, the extension of ds-DNA beyond its initial contour length is negligible. Further pulling leads to a plateau region where the DNA is observed to stretch about 1.6-1.7 times its initial contour length with a small increase in applied force. Interestingly, such plateau region was not observed in earlier experimental studies for short ( bp) DNA pulling strunz99 ; pope01 . We further observe that the plateau width varies depending on the pulling scheme. At large forces, the base-pair to base-pair stacking potential can no longer stabilize the B-form configuration of ds-DNA resulting in a structural transition from the canonical B-form to a new overstretched conformation. At such large forces, the traditional WLC model is inadequate to understand the force-extension behavior bustamante97 ; marko95 ; bustamante94 .

III.2 Hydrogen bond breaking and emergence of S-DNA
We further examined the number of intact H-bonds (HBs) which is considered to be a fundamental parameter in characterizing various forms of DNA conformations. Explicitly, it is known that the interaction potential emanating from the formation of HBs between base-pairs stabilizes the canonical B-DNA structure, and consequently the breaking of HBs gives rise to a melted DNA ferrira15 . Thus, the number of HBs is an important quantity in monitoring conformational changes that occur during the pulling of B-DNA. We define fraction of HB at a given force as the ratio of intact HBs to the maximum possible HBs in the B-DNA. In our calculation, a hydrogen bond is defined to be formed between the donor, D and the acceptor, A provided that the distance between D-A is less than the cutoff distance Å and the angle D-H-A is greater than . Fig. 1(f) displays as a function of the external force for different pulling protocols. Strikingly, we find that depends strongly on pulling protocol employed. Interestingly, we observe that while almost of the H-bonds are broken with OS pulling protocol in the fully stretched conformations, almost H-bonds remain intact with OS pulling scheme. Similarly, while almost all H-bonds are broken with SE pulling, only less than half H-bonds are broken with SS scheme.
Structural snapshots of the stretched DNA obtained from different pulling protocols are displayed in Fig. 2 to visually aid in understanding the degree of H-bond breaking at a qualitative level. From the snapshots and broken H-bonds, it is apparent that dsDNA completely melts under the application of external force via OS scheme (see Fig. 2(a)). More interestingly, S-DNA bearing most of the intact H-bonds is seen to emerge in the overstretched regime when the canonical DNA is subjected to OS pulling protocol (see Fig. 2(b)). However, with further increase in applied force, the S-DNA eventually transforms into melted DNA as expected. This also indicate that the force required to obtain melted DNA is large when OS protocol is employed compared to the OS pulling protocol. Interestingly, the snapshots shown in Fig. 2(c) and H-bonds presented in Fig. 1(f) suggest a coexistence of S-DNA and melted DNA with SS pulling protocol. On the other hand, similar to the results obtained with OS scheme, a complete melted DNA is obtained with SE pulling protocol (see Fig. 2(d)).
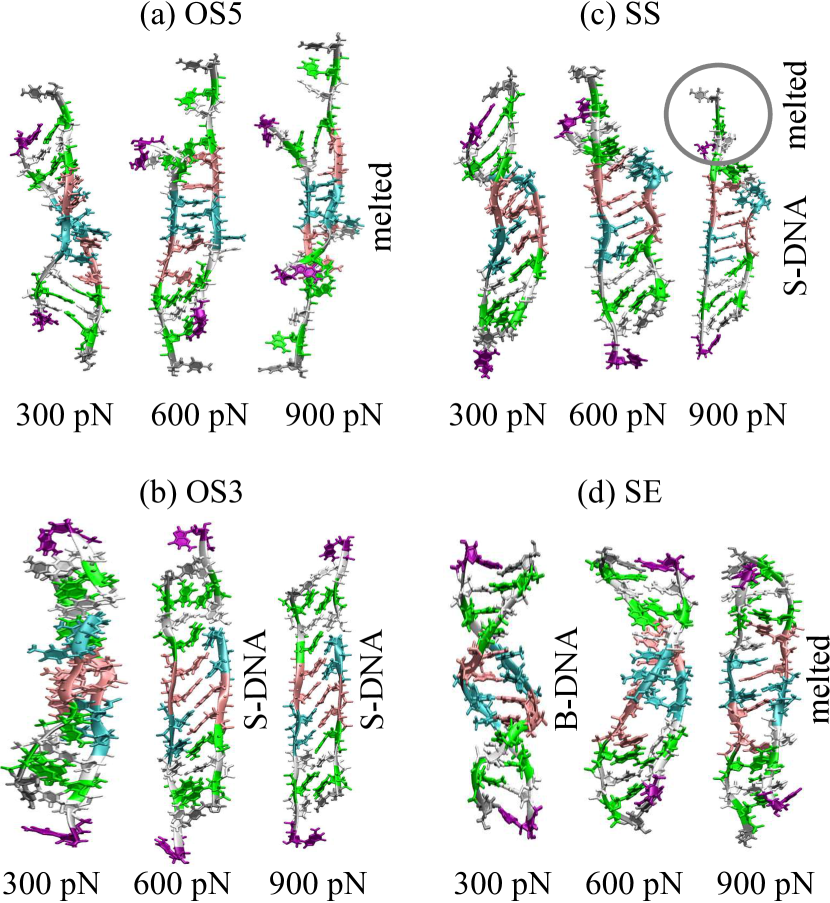
Overall, the above results suggest that when the DNA is pulled through OS, only about of HBs are cleaved and consequently a clear B-to-S structural transition emerges.
III.3 Nature of H-bond breaking
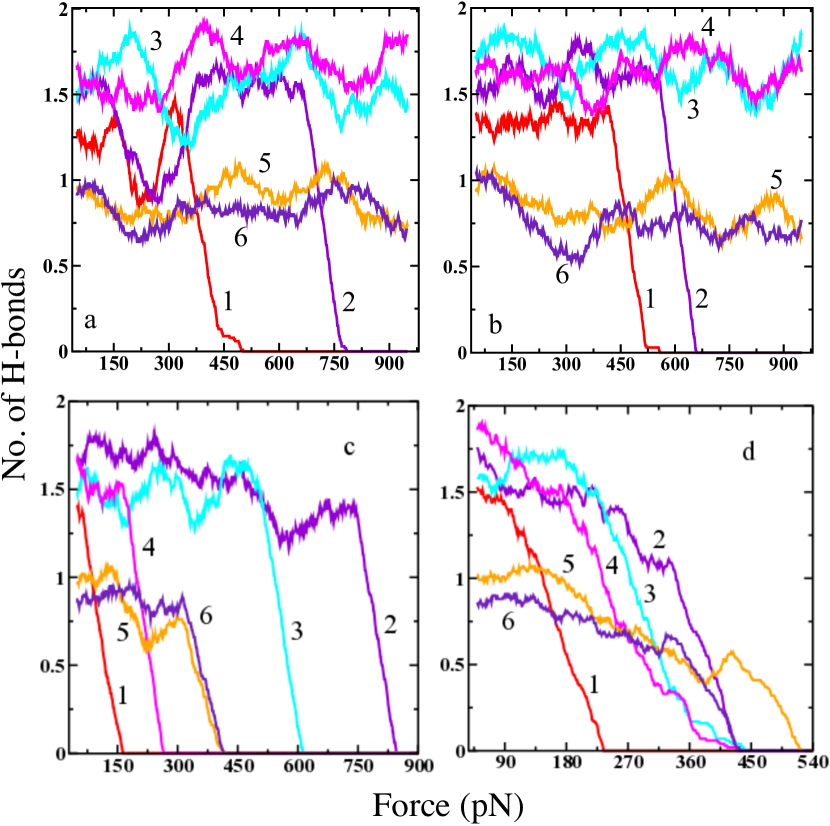
Now we ask the following questions: which HBs in the DNA are most vulnerable under the application of force? Are the H-bond breaking events deterministic or stochastic? Towards the above objectives, we repeat the non-equilibrium stretching simulations with different initial conditions and calculate the number of H-bonds between the individual base-pairs starting from the terminal end as a function of applied force. The results for two independent OS pulling simulations are shown in Fig. 3(a-b). In both the cases, H-bonds at the terminal base-pair (G-C) is seen to break before any other H-bonds are affected. The results presented in Figs. 3(a-b) indicate that the breaking of H-bonds occur in the vicinity of terminus (labeled as position in Figs. 3(a-b)), where stronger G-C base-pairing is located, despite the presence of weaker A-T segments in the neighbor regime. More interestingly, the H-bonds far from the force center are seen to be intact including the AT rich segments, even at higher destabilizing forces. The above result is arguably a consequence of the cooperative nature of DNA stretching. Further, these results suggest a weakening of terminus regime under the influence of applied force, which is also consistent with the reports of Ferreira et al. ferrira15 . Additionally, segmental analysis of H-bonds with different pulling rates are presented in Figure S1. Similar results are observed with different pulling rates and initial configuration revealing the deterministic nature of H-bond breaking at the terminus and rationalizing the above arguments. Overall, the results presented in Figs. 1 and 3(a-b) along with the snapshots shown in Fig. 2(b) conclusively demonstrates the emergence of S-DNA when a canonical B-DNA is subjected to stretching via OS protocol.
We similarly repeat the non-equilibrium stretching simulation for OS with a different initial condition and calculate the number of HBs between the individual base-pairs starting from the terminal end as a function of applied force (see Fig. 3(c-d)). In accordance with the OS pulling case, the H-bonds at the terminal base-pair (G-C) are seen to break first while the subsequent cleaving events are completely stochastic. Specifically, in one initial condition, the terminal H-bonds break first followed by th (G-C), th (A-T) and th (A-T) respectively while in the other case the respective breaking events sequence is st (G-C), th (G-C), th (A-T) and nd (G-C). Initially, when all H-bonds in DNA are intact in the stable form, the propagation of applied force along the DNA backbone follow a specific manner. As the H-bond are cleaved, the corresponding free bases attain more degrees of freedom and subsequently the DNA becomes more destabilized. Eventually, the force profile along the backbone is more randomly distributed leading to uncorrelated cleaving events.
III.4 Insights from equilibrium simulations
So far we have discussed the appearance of DNA structural polymorphs and emergence of S-DNA using non-equilibrium stretching simulations. To gain further insights into the stretching phenomena, we perform additional simulations by introducing an Harmonic potential to held the DNA end-to-end length at a desired value so as to mimic DNA stretching in an equilibrium manner. The equilibrium simulations are also expected to eliminate the artifacts introduced by the faster pulling rate, low sampling of overstretched states and therefore can be used to rationalize the observations made using the non-equilibrium simulations.
To characterize the structure of S-DNA to full extent, we considered the Harmonic restraining potential between the OS oxygen atoms, for which the emergence of S-DNA is predicted by non-equilibrium simulations. Various inter base-pair helical parameters of DNA at different equilibrium end-to-end lengths of the Harmonic potential are displayed in Fig. 4 for OS pulling case. We find that the rise, slide and tilt increases with equilibrium OS length with respect to its canonical B-DNA (see the reference line) lavery09 . Interestingly, the twist is seen to decrease with respect to its canonical B-DNA and saturates to a value of degrees. This corresponds to a helical repeat of bp, which agrees very well with the previous experimental results of bp leger99 . The other helical parameters are shown in Fig. S2 and in Fig. S3. Our study further shows that stretch, stagger, and propel increase and shear, and opening decrease in comparison to the canonical B-DNA values. Similarly, comparison to inter base-pair parameters of S-DNA indicates that rise, and roll increase and shift, and twist decrease.

We further calculated the potential of the mean force (PMF) by accumulating the histograms of end-to-end distances for different end-to-end oxygen atom references. The PMF can further provide information on the dynamics of DNA folding/unfolding phenomena. In Fig. 5(a), we present results of PMF for various pulling scenarios obtained using the Umbrella sampling (US) framework. We find that the PMF is higher for SE pulling in comparison to all other cases of pulling. Interestingly, for OS pulling case, the PMF is little higher than the OS pulling case at the stretching distances where we have observed S-DNA. We also find appearance of step like features at larger stretching distances ( Å and above). A closer look at the DNA structure reveals that above Å stretch length, DNA retains its B-DNA feature before it adopts the S-DNA structure. A structural change causes such drop in force which also leads to a step like shape in PMF for OS above Å (see Fig. S11). To understand the contribution of entropy (and equivalently the enthalpy) to free energy, we employed two-phase thermodynamic (2PT) method developed by Lin et al. goddard03 ; goddard10 ; goddard11 and calculate the entropy of DNA during overstretching processes. Fig. 5(b) depicts the change in total entropy of DNA at various equilibrium distances for different pulling protocols. For OS case we find DNA becomes relaxed around Å which invokes a sharp increase in entropy but for other cases the DNA stiffens initially and then becomes relatively more flexible. This is reflected in the trend of change of with respect to distance (initially it decreases and then increases). We further notice that for B-to-S transition (OS pulling case), a negative change in entropy occurs consistent with the recent experimental study by Zhang et al zhang13 . Interestingly, for OS case, we observe a positive change in entropy.

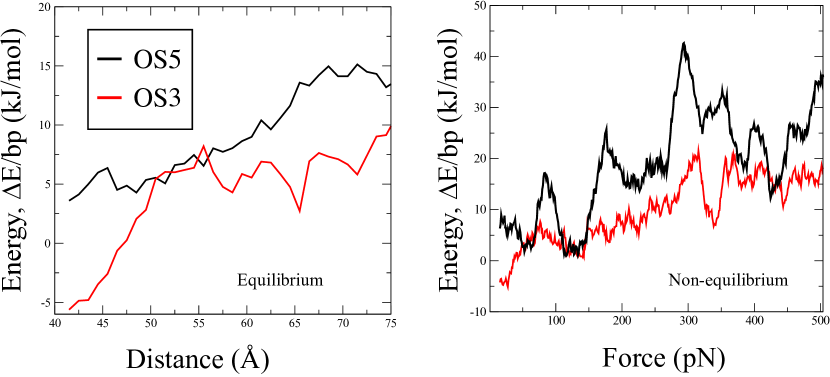
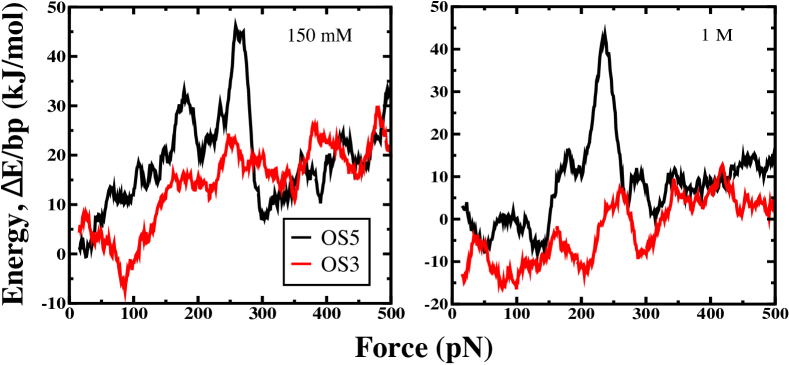
We also extract force-distance curve from our equilibrium simulations for different pulling protocols and display in Fig. S4 (a). We observe irregular variations in force-distance curve displaying local maxima at different equilibrium distances. The peaks of local maxima indicate a force required for breaking different base-pairs of the dsDNA in different pulling protocols. We also observe that force required to break the dsDNA in OS pulling is more compared to OS pulling, consistent with the results obtained from non-equilibrium simulations. However, large force is required to melt DNA through SE pulling process. Our US simulations indicate that the DNA melts (defined as a conformation with of the H-bonds are broken, see Fig. S4 (b)) at different stretching forces when pulled with different pulling protocols. More quantitatively, we observe that the melting forces are pN, pN, pN, and pN when pulled with OS, OS, SS and SE protocols, respectively. The above results are very similar to those reported by Danilowicz et al. prentiss09 from the SMPE studies. Our results also support the hypothesis made by Lebrun and Lavery lavery96 . Additionally, the structural snapshots for OS and OS cases taken from our equilibrium simulations (see Fig. S5, Fig. S12, Fig. S6 and Fig. S13) also qualitatively agree with the structures obtained from non-equilibrium pulling simulations for the respective cases. We further calculate the changes in the potential energy of the DNA during pulling processes with respect to the un-stretched DNA. Large contributions come from van der Waals, angle and bond interactions (see Fig. S7). Using our equilibrium simulation data we show the change of the potential energy as a function of distance for two different pulling protocols and is displayed in Fig. 6. Total potential energy change depends on the direction of pulling. We observe in the beginning of pulling a negative change in the total potential energy along OS pulling direction and a positive change along OS pulling direction. This observation originates from the tilt orientation of the base-pairs of the B-DNA. In the beginning of pulling for OS case tilt orientation of base-pairs decreases, which causes a decrease in energy and yields a negative enthalpy change (). Whereas for OS pulling case tilt orientation increases which causes a positive enthalpy change. Our equilibrium study is consistent with the non-equilibrium study (see Fig. 6). We also observe that increases further and further as the DNA is stretched. It clearly indicates the destabilization of the helical structure of the DNA. We find that OS pulling leads to lower potential energy than OS direction. In the intermediate distances we further observe a plateau in (see equilibrium case of Fig. 6) for OS pulling case. This indicate a new conformation of DNA (S-DNA) that remains stable for some time during the OS pulling process. We next observe a decrease in the change of the electrostatic energy and an increase in van der Waals energy with distances (see Fig. S6). In the overstretched structures the negatively charged phosphates stay far apart from each other, which minimizes their mutual repulsion. In the intermediate distances for OS pulling case, a stacking structure of dsDNA is observed, which indicates a stable short range interactions. In this situation the backbone strands come closer and opposite charges and group dipoles find a favorable arrangements. We further observe that energy changes due to angle (say ) first decreases and then increases for OS and OS pulling case. A significant increase in is found for OS pulling case. Energy change due to bond for OS pulling case is larger than that for the OS pulling case. We observe an opposite behavior in the change of the dihedral energy (say ) for OS and OS pulling cases. Interestingly, for OS increases initially and then decreases with the distances. Overall, the increasing nature of total potential energy change indicates the destabilization of helical structure of DNA with stretching. Our results for agrees well with the earlier studies by Zhang et al. zhang13 . Additionally, we perform the non-equilibrium pulling simulations for OS and OS pulling in mM and M salt concentrations and calculate the as a function of applied force (see Fig. 7). We observe that the qualitative behavior of the change in with the applied force remains same as it is found for no salt concentration.
III.5 Effects of DNA length on the emergence of S-DNA
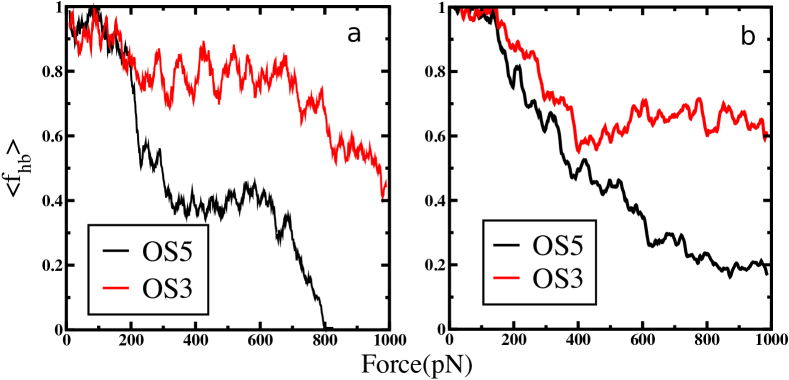
We note that the results presented so far correspond to a DNA of base-pairs length under single pulling rate. To check the veracity of the results discussed in this article, we considered stretching of a longer DNA of base-pairs. The corresponding results are displayed in Figs. 8 - 9, which conclusively support the original key observations. In a nutshell, the main conclusions drawn from a single pulling rate are seen to remain intact irrespective of the pulling rates and DNA length. Explicitly, Fig. 8 depicts the effect of pulling protocol on force-extension behavior as well as H-bond breaking is qualitatively insensitive to DNA length, and Fig. 9 shows the qualitative features of H-bond breaking under different pulling protocols and consequent emergence of S-DNA (see Fig. S14) with OS scheme (and melted-DNA with OS scheme) is independent of DNA length. It is worth mentioning that apart from the bp and bp length studied here, we have also looked at the force extension behavior for bp long dsDNA in our recent work maitib16 . All these simulations prompted us to comment that the force-extension and H-bond breaking behavior is qualitatively insensitive to DNA length. However, different DNA sequence (more GC contents for example) may affect the H-bond breaking quantitatively .

Overall, our equilibrium and non-equilibrium simulations clearly indicate the existence of a complete S-DNA structure when pulled with OS protocol and a coexistence of both the S-DNA and B-DNA structures when pulled with SS protocol. Using different pulling protocols we also plot (see Fig. S8) force-extension as well as the as a function of force for three independent runs at moderate pulling rate, which demonstrates qualitatively similar behavior. The molecular level insights using extensive atomistic simulations reported here shed light on the mechanisms underlying the DNA overstretching transition.
IV Conclusions
In this article, we investigated the effect of stretching force on B-DNA when pulled with different protocols using fully atomistic MD simulations. We provided structural snapshots at the atomistic level adopted by B-DNA under the influence of external force with various schemes providing further insight into the structural aspects. A plateau region of variable widths can also be seen in typical force extension plots for such short DNA pulling. Our simulations suggest that it is possible to obtain a clear B-to-S structural transition when the B-DNA is pulled along OS and SS direction. We observed that the OS pulling leads to the emergence of S-DNA whereas the OS pulling does not give rise to such S-DNA conformation. The possible origin of obtaining S-DNA in OS3 pulling is due to the tilt orientation of the bases with respect to the DNA backbone. OS5 pulling favors the base pair tilt compared to the OS3 pulling. This is consistent with the proposal made by Lebrun and Lavery lavery96 . From our study, we also realized that the emergence of S-DNA is a more sensitive function of the pulling protocol and the orientation of the base-pairs with respect to the backbone rather than the nature of complementarity of base sequences. Our study further indicates that more than % hydrogen bonds of the DNA break at higher forces for OS3 pulling in comparison to the OS5 pulling. This observation is similar to that observed earlier in two independent experimental studies prentiss09 ; gaub08 . Our results also showed that SS pulling results in a coexistence of S-DNA and melted DNA structure whereas same end pulling does not show such conformation. This behavior is different from the earlier observation by Balaeff et al. beratan11 . This may be due to the choice of different DNA sequence and pulling protocols. We also compared some of our present results (data not shown) with parm99 force field and found consistent behavior. It will be interesting to see how the present overstretching behavior compares when simulated using a more refined force field parmbsc1 ivani16 . Further insights into the stretching phenomena and the mechanisms of S-DNA emergence are provided by calculating the PMF, entropy and enthalpy using different simulations setup. We observed a negative change in entropy for B-to-S transition, consistent with the experimental observation zhang13 . The structural characteristics of S-DNA are investigated in terms of various inter and intra base-pair helical parameters and compared with the standard B-DNA structure. The simulation results are in good agreement with available experimental results prentiss09 ; yan12 ; gaub08 ; yan10 ; yan14 . These results may provide more information on active biological processes involving DNA extension and help in understanding the mechanical properties of DNA in a previously unexplored domain. In principle, our new findings and predictions can be tested by carrying out in vitro single molecule experiments. Overall, our study provides a detailed understanding of the mechanisms underlying S-DNA emergence and structural transitions of dsDNA with different force attachments.
V Supplementary Material
See supplementary material for figures from S1 to S14. These depict various average inter base pair and intra base pair parameters of S-DNA with a comparison to B-DNA at different equilibrium end-to-end lengths; variation of force-distance and fraction of H-bonds with distance from equilibrium simulation data; few snapshots of the DNA from equilibrium simulations for OS, OS pulling; change of potential energy components for OS, OS equilibrium simulation; force extension behavior and fraction of hydrogen bond as a function of applied force for various pulling protocols for three independent runs at a moderate pulling rate; discussion on convergence of PMF calculations; and finally, few snapshots from non-equilibrium simulation data for bp DNA.
Acknowledgements.
We greatly acknowledge the financial support received from the DAE, India.References
- (1) C. Bustamante, J. F. Marko, E. D. Siggia, and S. Smith, Science 265, 1599 (1994).
- (2) J. F. Marko, and E. D. Siggia, Macromolecules 28, 8759 (1995).
- (3) C. G. Baumann, S. B. Smith, V. A. Bloomfield, and C. Bustamante, Proc. Natl. Acad. Sci. (U. S. A.) 94 (12), 6185 (1997).
- (4) B. Alberts et al., Molecular biology of the cell. 5th ed.; (Garland Science, New York, 2008).
- (5) F. Dehez, H. Gattuso, E. Bignon, C. Morell, E. Dumont and A. Monari, Nucleic Acids Research 45, 3654, 2017.
- (6) P. D. Dans, A. P ’erez, I. Faustino, R. Lavery and M. Orozco, Nucleic Acids Research 40, 10668 (2012).
- (7) S. B. Smith, L. Finzi, and C. Bustamante, Science 258(5085), 1122 (1992) .
- (8) S. B. Smith, Y. Cui, and C. Bustamante, Science 271 (5250), 795 (1996).
- (9) P. Cluzel, A. Lebrun, C. Heller, R. Lavery, J.-L. Viovy, D. Chatenay, and F. Caron, Science 271 (5250), 792 (1996).
- (10) Keir C. Neuman and A. Nagy, Nature Methods 5, 491 (2008).
- (11) K. R. Chaurasiya, T. Paramanathan, M. J. McCauley and M. C. Williams, Physics of Life Reviews 7, 299 (2010).
- (12) A. Lebrun, and R. Lavery, Nucleic Acids Res. 24 (12), 2260 (1996).
- (13) K. M. Kosikov, A. A. Gorin, V. B. Zhurkin, and W. K. Olson, J.Mol.Biol. 289, 1301 (1999).
- (14) S. A. Harris, Z. A. Sands, and C. A. Laughton, Biophys. J. 88, 1684 (2005).
- (15) S. Piana, Nucleic Acids Res. 33, 7029 (2005).
- (16) R. Lohikoski, J. Timonen, and A. Laaksonen, Chem. Phys. Lett 407, 23 (2005).
- (17) S. Piana, J. Phys. Chem. A 111, 12349 (2007).
- (18) D. R. Roe, and A. M. Chaka, J. Phys. Chem. B 113, 15364 (2009).
- (19) M. Santosh, and P. K. Maiti, J. Phys. Condens. Matter 21 (3), 034113 (2009).
- (20) J. Řezáč, P. Hobza, and S. A. Harris, Biophys. J. 98, 101 (2010).
- (21) M. Wolter, M. Elstner, and T. Kubar, J. Phys. Chem. A 115, 11238 (2011).
- (22) M. D. Wang, H. Yin, R. Landick, J. Gelles, and S. M. Block, Biophys. J. 72 (March), 1335 (1997).
- (23) C. Danilowicz, V. W. Coljee, C. Bouzigues, D. K. Lubensky, D. R. Nelson, and M. Prentiss, Proc. Natl. Acad. Sci. (U. S. A.) 100, 1694 (2003).
- (24) K. Hatch, C. Danilowicz, V. Coljee, and M. Prentiss, Phys. Rev. E 78, 011920 (2008).
- (25) C. Danilowicz, C. Limouse, K. Hatch, A. Conover, V. W. Coljee, N. Kleckner, and M. Prentiss, Proc. Natl. Acad. Sci. (U.S.A.) 106 (32), 13196 (2009).
- (26) D. H. Paik and T. T. Perkins, J. Am. Chem. Soc. 133, 3219 (2011).
- (27) X. Zhang, H. Chen, H. Fu, P. S. Doyle, and J. Yan, Proc. Natl. Acad. Sci. (U.S.A.) 109 (21), 8103 (2012).
- (28) M. Rief, H. Clausen-Schaumann, and H. E. Gaub, Nat. Struct. Biol. 6 (4), 346 (1999).
- (29) N. Bosaeus, Afaf H. El-Sagheer, T. Brown, S. B. Smith, Björn Åkerman, C. Bustamante, and B. Nordén, Proc. Natl. Acad. Sci. (U. S. A.) 109, 15179 (2012).
- (30) M. Karplus, and R. Lavery, Isr. J. Chem. 54, 1042 (2014).
- (31) M. W. Konrad, J. I. Bolonick, J. Am. Chem. Soc. 118, 10989 (1996).
- (32) S. Cocco, J. Yan, J-F. Leger, D. Chatenay, and J. F. Marko, Phys. Rev. E, 70, 011910 (2004).
- (33) C. Storm, and P. C. Nelson, Phys. Rev. E, 67, 051906 (2003).
- (34) I. Rouzina, and V. A. Bloomfield, Biophys. J. 80 (2), 882 (2001).
- (35) J. van Mameren, P. Gross, G. Farge, P. Hooijman, M. Modesti, M. Falkenberg, G. J. L. Wuite, and E. J. G. Peterman, Proc. Natl. Acad. Sci. (U. S. A.) 106 (43), 18231 (2009).
- (36) C. H. Albrecht, G. Neuert, R. A. Lugmaier, and H. E. Gaub, Biophys. J. 94 (June), 4766 (2008).
- (37) H. Fu, H. Chen, J. F. Marko, and J. Yan, Nucleic Acids Res. 38 (16), 5594 (2010).
- (38) J. F. Léger, G. Romano, A. Sarkar, J. Robert, L. Bourdieu, D. Chatenay, and J. F. Marko, Phys. Rev. Lett. 83 (5), 1066 (1999).
- (39) M. C. Williams, J. R. Wenner, I. Rouzina, and V. A. Bloomfield, Biophys. J. 80 (4), 1932 (2001).
- (40) R. K. Mishra, T. Modi, D. Giri, and S. Kumar, J. Chem. Phys. 142, 174910 (2015).
- (41) O. Krichevsky, Physics of Life Reviews 7, 350 (2010).
- (42) S. Whitelam, Physics of Life Reviews 7, 348 (2010).
- (43) Micah J. McCauley et al., Physics of Life Reviews 7, 358 (2010).
- (44) X. Zhang, Y. Qu, H. Chen, I. Rouzina, S. Zhang, P. S. Doyle, and J. Yan, J. Am. Chem. Soc. 136 (45), 16073 (2014).
- (45) S. Mogurampelly, and P. K. Maiti, Biophys. J. 101(6), 1393 (2011).
- (46) H. Joshi, A. Dwaraknath, and P. K. Maiti, Physical Chemistry Chemical Physics 17 (2), 1424 (2015).
- (47) H. Joshi, et al., ACS nano 10 (8), 7780 (2016).
- (48) A. Balaeff, S. L. Craig, and D. N. Beratan, J. Phys. Chem.A 115, 9377 (2011).
- (49) S. Niewieczerzał and M. Cieplak, J. Phys.: Condens. Matter 21, 474221 (2009).
- (50) A. V. Savin, M. A. Mazo, I. P. Kikot, and A. V. Onufriev, Proc. Natl. Acad. Sci. USA 110 (2013).
- (51) A. Kocsis and D. Swigon, Int. J. Non-Linear Mech. 47, 639 (2012).
- (52) C. W. Hsu, M. Fyta, G. Lakatos, S. Melchionna, and E. Kaxiras, J. Chem. Phys. 137, 105102 (2012).
- (53) F. Romano, D. Chakraborty, J. P. K. Doye, T. E. Ouldridge and A. A. Louis, J. Chem. Phys. 138, 085101 (2013).
- (54) D. A. Case, et al., University of California, San Fransisco (2008).
- (55) J. Wang, P. Cieplak, and P. A. Kollman, J. Comput. Chem., 21 (12), 1049 (2000).
- (56) A. Pérez, et al., Biophys. J. 92, 3817 (2007).
- (57) V. Hornak, et al., Proteins 65(3), 712 (2006).
- (58) W. L. Jorgensen, J. Chandrasekhar, J. D. Madura, R. W. Impey, and M. L. J. Klein, Chem. Phys. 79 (2), 926 (1983).
- (59) I. S. Joung, and T. E. Cheatham III, J. Phys. Chem. B 112 (30), 9020 (2008).
- (60) D. A. Pearlman et al., Comput. Phys. Commun. 91, 1 (1995).
- (61) J. P. Ryckaert, G. Ciccotti, and H. J. C. Berendsen, Journal of Computational Physics 23, 327 (1977).
- (62) W. Humphrey, A. Dalke, and K. Schulten, J. Mol. Graph., 14, 33 (1996).
- (63) G. M. Torrie and J. P. Valleau, J. Comp. Phys. 23, 187 (1977).
- (64) D. A. Case, et al., University of California, San Fransisco (2014).
- (65) S. Mogurampelly, and P. K. Maiti. J. Chem. Phys. 138(3), 034901 (2013).
- (66) D. Frenkel and B. Smit, Understanding Molecular Simulations (Academic Press: San Diego, 2002).
- (67) S. Kumar, J. M. Rosenberg, D. Bouzida, R. H. Swendsen, and P. A. Kollman, J. Comput. Chem. 13 (8), 1011 (1992).
- (68) A. Grossfield, WHAM: the wighted histogram analysis method; version 2.
- (69) R. Lavery, M. Moakher, J. H. Maddocks, D. Petkeviciute, and K. Zakrzewska, Nucleic Acids Res., 37, 5917 (2009).
- (70) A. Garai, S. Saurabh, Y. Lansac, and P. K. Maiti, J. Phys. Chem. B 119 (34), 11146 (2015).
- (71) T. Strunz, K. Oroszlan, R. Schäfer, and H. Güntherodt, Proc. Natl. Acad. Sci. (U.S.A.) 96, 11277 (1999).
- (72) L. H. Pope, M. C. Davies, C. A. Laughton, C. J. Roberts, S. J. B. Tendler, and P. M. Williams, Eur. Biophys. J. 30, 53 (2001).
- (73) I. Ferreira, T. D. Amarante, and G. Weber, G. J. Chem. Phys. 143, 175101 (2015).
- (74) S.T. Lin, M. Blanco and William A. Goddard, J. Chem. Phys., 119, 11792 (2003).
- (75) S.T. Lin, P.K. Maiti and W.A. Goddard, J. Phys. Chem. B, 114, 8191 (2010).
- (76) T.A. Pascal, S.T. Lin and W.A. Goddard, Phys. Chem. Chem. Phys., 13, 169 (2011).
- (77) X. Zhang, H. Chen, S. Le, I. Rouzina, P. S. Doyle, and J. Yan, Proc. Natl. Acad. Sci. (U.S.A.), 110, 3865 (2013).
- (78) S. Bag, et al., Nanoscale 8 (35), 16044 (2016).
- (79) I. Ivani, et al., Nat Methods, 13(1), 55 (2016).