Super-Flaring Active Region 12673 Has One of the Fastest Magnetic Flux Emergence Ever Observed
keywords:
Sun: magnetic fields — Sun: photosphere — Sun: sunspotsXudong Sun
1
In September 2017, solar active region (AR) 12673 evolved from a decaying sunspot to the most actively flaring region of Cycle 24. It produced 4 flares above GOES X1 class and 8 flares above M3 class. The total flare index surpasses that of the great AR 12192 despite having only 30% the sunspot size (Sun et al.(2015)Sun, Bobra, Hoeksema, Liu, Li, Shen, Couvidat, Norton, & Fisher). Its X-9.3 (SOL2017-09-06T11:53) flare is the most intense one since 2005.
The flaring activity is related to the emergence of significant new magnetic flux. Figure 1(a) shows a radial field map from the Helioseismic and Magnetic Imager (HMI; Schou et al.(2012)Schou, Scherrer, Bush, Wachter, Couvidat, Rabello-Soares, Bogart, Hoeksema, Liu, Duvall, Akin, Allard, Miles, Rairden, Shine, Tarbell, Title, Wolfson, Elmore, Norton, & Tomczyk). The emergence started southeast of an old sunspot (remnant from AR 12665 and 12670). Multiple pairs of bipoles subsequently emerged on the eastern periphery of the old sunspot with very different orientations. Persistent flux emergence, apparent coalescence, cancellation, and shearing led to a complex sunspot group, featuring a quadrupolar configuration and a reversed sigmoidal main polarity inversion line. A detailed account of the morphological evolution is available in Yang et al.(2017)Yang, Zhang, Zhu, & Song.
Using HMI vector magnetograms (Hoeksema et al.(2014)Hoeksema, Liu, Hayashi, Sun, Schou, Couvidat, Norton, Bobra, Centeno, Leka, Barnes, & Turmon) from September 2nd to 7th, we calculated111We use pixels where the field strength is above . The uncertainty of shows the standard deviation within a 96-min averaging window. The formal uncertainty from spectral inversion is small. We calculate using linear regression on bootstrapped samples of , and show the median and confidence interval. the unsigned flux () and the flux emergence rate (). We find222Data quality deteriorates after September 7th when the AR is more than 45∘ away from the disk center. We take at 2017-09-07T00:00 as the maximum flux, , and the mean before 2017-09-02T12:00 as the background flux . Following Leka et al.(2013)Leka, Barnes, Birch, Gonzalez-Hernandez, Dunn, Javornik, & Braun, we define 2017-09-03T11:00 as the start of emergence when ). that has a tenfold increase over the 5-day period to reach , and the average is . We additionally calculated in 6-hr chunks. The “instantaneous” flux emergence rate peaked around September 3rd 21:00 with an extraordinary value of . This occurred early during the evolution, when the flux is only 36% of the maximum.
The flux emergence rate of AR 12673 is greater than any values reported in the literature of which we are aware. Figure 1(b) summarizes the mean signed flux emergence rate and peak signed flux from a collection of observations and simulations (Norton et al.(2017)Norton, Jones, Linton, & Leake). AR 12763 largely follows the established trend, but the extreme values on its evolutionary track are rivaled only by the fastest flux emergence model and AR 12192, which has 3.6 times the flux333We perform the same calculation for AR 12192 between 2014 October 22nd and 27th. The dataset is affected by systematic artifacts that correlate with daily spacecraft velocity variations (Sun et al.(2015)Sun, Bobra, Hoeksema, Liu, Li, Shen, Couvidat, Norton, & Fisher), so the instantaneous is less certain. The maximum , mean , and maximum instantaneous are , , and , respectively..
Our preliminary analysis suggests that AR 12673 boasts some of the highest non-potential magnetic field proxies of all ARs in Cycle 24 (X. Sun, in preparation), many of which have been used to predict flares and coronal mass ejections (e.g., Bobra & Couvidat(2015)). Because major eruptions tend to occur within a day or so following significant flux emergence (Schrijver(2009)), the emergence rate should be reconsidered as a parameter in flare prediction, as initially studied by Leka & Barnes(2003). AR 12673 will likely teach us more about the relations between fast flux emergence, strong non-potential field, and flaring activities.
Acknowledgements.
SDO data are courtesy of NASA and the SDO/HMI science team.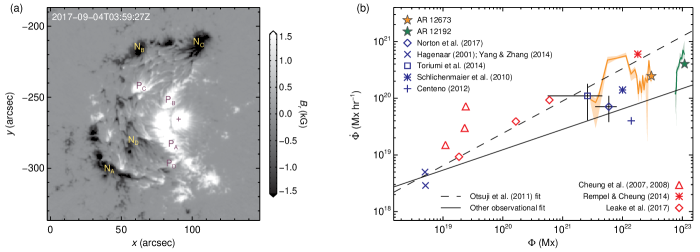
References
- [Bobra & Couvidat(2015)] Bobra, M. G., & Couvidat, S. 2015, ApJ, 798, 135
- [Hoeksema et al.(2014)Hoeksema, Liu, Hayashi, Sun, Schou, Couvidat, Norton, Bobra, Centeno, Leka, Barnes, & Turmon] Hoeksema, J. T., Liu, Y., Hayashi, K., et al. 2014, Sol. Phys., 289, 3483
- [Leka & Barnes(2003)] Leka, K. D., & Barnes, G. 2003, ApJ, 595, 1296
- [Leka et al.(2013)Leka, Barnes, Birch, Gonzalez-Hernandez, Dunn, Javornik, & Braun] Leka, K. D., Barnes, G., Birch, A. C., et al. 2013, ApJ, 762, 130
- [Norton et al.(2017)Norton, Jones, Linton, & Leake] Norton, A. A., Jones, E. H., Linton, M. G., & Leake, J. E. 2017, ApJ, 842, 3
- [Schou et al.(2012)Schou, Scherrer, Bush, Wachter, Couvidat, Rabello-Soares, Bogart, Hoeksema, Liu, Duvall, Akin, Allard, Miles, Rairden, Shine, Tarbell, Title, Wolfson, Elmore, Norton, & Tomczyk] Schou, J., Scherrer, P. H., Bush, R. I., et al. 2012, Sol. Phys., 275, 229
- [Schrijver(2009)] Schrijver, C. J. 2009, Advances in Space Research, 43, 739
- [Sun et al.(2015)Sun, Bobra, Hoeksema, Liu, Li, Shen, Couvidat, Norton, & Fisher] Sun, X., Bobra, M. G., Hoeksema, J. T., et al. 2015, ApJ, 804, L28
- [Yang et al.(2017)Yang, Zhang, Zhu, & Song] Yang, S., Zhang, J., Zhu, X., & Song, Q. 2017, ApJ, 849, L21