Filamentous phages as building blocks for reconfigurable and hierarchical self-assembly
Abstract
Filamentous bacteriophages such as fd-like viruses are monodisperse rod-like colloids that have well defined properties: diameter, length, rigidity, charge and chirality. Engineering those viruses leads to a library of colloidal rods which can be used as building blocks for reconfigurable and hierarchical self-assembly. Their condensation in aqueous solution with additive polymers which act as depletants to induce attraction between the rods leads to a myriad of fluid-like micronic structures ranging from isotropic/nematic droplets, colloid membranes, achiral membrane seeds, twisted ribbons, -wall, pores, colloidal skyrmions, Möbius anchors, scallop membranes to membrane rafts. Those structures and the way they shape shift not only shed light on the role of entropy, chiral frustration and topology in soft matter but it also mimics many structures encountered in different fields of science. On one hand, filamentous phages being an experimental realization of colloidal hard rods, their condensation mediated by depletion interactions constitutes a blueprint for self-assembly of rod-like particles and provides fundamental foundation for bio- or material oriented applications. On the other hand, the chiral properties of the viruses restrict the generalities of some results but vastly broaden the self-assembly possibilities.
pacs:
64.75.Yz,82.70.Dd, 61.30.Eb, 61.30.JfI Introduction
Self-assembly is the phenomenon in which a collection of particles spontaneously arranges into mesoscopic structures Whitesides and Grzybowski (2002); Philp and Stoddart (1996); Rogers et al. (2016); Frenkel (2015); Cademartiri and Bishop (2015). The complexity of the mesoscopic structure is encoded is the building blocks and the physics that drive its condensation. Although the fundamental and driving questions in self-assembly have persisted from the birth of the field up to the present – Can the global behavior of a system be engineered using local rules set by the building blocks properties? How do local rules interlace with physics principles and determine global behavior? – the complexity has drastically increased over the years.
Complexity is in part driven by the properties of the building blocks. In this respect colloidal building blocks have a peculiar flavor. Contrary to polymers, copolymers, surfactants or molecular liquid crystals Majewski and Yager (2016); Drummond and Fong (1999), colloids can be considered as giant atoms Poon (2004); Xia et al. (2000) where the solvent mediate the interactions. Consequences are many fold. First, it is a convenient experimental system. Since colloids can be quite big, both the shape and the structure of the condensate can be visualized at the colloidal level under a microscope. Second colloids and their condensates may be manipulated using microfluidics and external fields such as optical traps. Third, due to their large size, the colloids dynamics is also quite slow which permits to probe local kinetics and mechanisms leading to their condensation and their restructuration. Finally colloids come with a large toolbox that permits to engineer their shape and interactions. The last decades have seen an explosion of strategies to obtain synthetic and biological colloids. Colloidal may come in various shapes from spheres to anisotropic geometries Glotzer (2004); Glotzer and Solomon (2007) such as colloidal polyhedras Kraft et al. (2009); Manoharan et al. (2003), tetrapods Milliron et al. (2004), dumbbells Johnson et al. (2005) and triangles Malikova et al. (2002) or cubes Laine et al. (1998); Rycenga et al. (2008). Classical techniques to tailor isotropic interactions include tuning the Van der Waals attraction via the Hamaker constant, grafting polymers to the colloid surface for entropic repulsion, screening the surface charge with salt, the use of polymers to induce depletion interactions Israelachvili (2011), etc. …Anisotropic interactions are common in proteins Gogelein et al. (2008) and may be induced just by the shape of the colloid van Anders et al. (2014) or by functionalizing the particle surface Bianchi et al. (2011) with lock and key groups, such as topological patches, DNA oligonucleotides Alivisatos et al. (1996); Mirkin et al. (1996); Milam et al. (2003); Park et al. (2008), protein-based cross-linkers like biotin–avidin or antibody–antigen binding pairs Hiddessen et al. (2000), and metallic patches Zhang et al. (2005). Depending on the strength and topology of the patchy interactions, the bounding of two colloids may lead to super colloids with internal degree of freedoms such articulated bonds for instance obtained in ’lock and key’ colloids (Sacanna et al., 2010) or by grafting DNA onto liquid interfaces of emulsions Feng et al. (2013). Anisotropic interactions may also come from the solvent. Small water droplets dispersed in a nematic liquid crystal exhibit short-range repulsion and a long-range dipolar attraction which lead to the formation of anisotropic water droplets chainlike structures Poulin et al. (1997). Interactions that can be triggered externally are essential knobs to study reconfigurable self-assembly and sequential or layer-by-layer self-assembly. They allow to navigate in the phase diagram of colloidal dispersions in a continuous way, providing reversible pathway to induce transition between different structures. Divers strategies are adopted to build interactions that respond to temperature (DNA coated colloids Geerts and Eiser (2010); Dreyfus et al. (2009), proteins Gibaud et al. (2011)), magnetic fields Löwen (2001); Lin et al. (2001); Puntes et al. (2001), or electric fields Leunissen et al. (2009); Liu et al. (2014).
Complexity also comes from the interplay between thermodynamics and kinetics. Self-assembly is a stochastic process and the thermal energy plays a particular role. It enables the particles to diffuse and probe the energy landscape of the dispersion. In principle, according to thermodynamics, the preferred self-assembled structures are the ones that minimize the free energy of the dispersion. However the actual structures obtained may depend on non-equilibrium effects, local fields, kinetic traps, and pathway-dependent ordering. Hard spheres crystallization is a simple case of self assembly directed by entropy that can be hindered by kinetic effect, namely the glass transition Pusey and Van Megen (1986). Assembly strategies have complexified in recent years. In directed assembly, external fields are used as template to order the colloids Grzelczak et al. (2010); Huang et al. (2001); Liu et al. (2014). In template-assisted self assembly, a substrate is used to order colloids Xia et al. (2003); Chan et al. (2004). In reconfigurable self-assembly, tunable interactions permits transition from one state to another Saunders et al. (2009); Gibaud et al. (2012a). In programmable self-assembly, information is added to the colloids to direct their organization Wan et al. (2016); Park et al. (2008); Nagpal (2002); Wan et al. (2016); Salgado-Blanco and Mendoza (2015); Tanaka et al. (2006). Sequential self-assembly is based on colloids with selective interactions and their sequential activation to form material through multistep kinetics Kotov et al. (1995); Di Michele et al. (2013). Those strategies may lead to simple structures like homogeneous crystals or to hierarchical assembly where the building blocks organization takes place over distinct multiple levels leading to material structuration at length scales much larger than the building blocks Lopes and Jaeger (2001); He et al. (2008); Elemans et al. (2003); Aggeli et al. (2001); Gibaud et al. (2012a, b); Nyström et al. (2017).
In this review paper, we first focus on filamentous phages – fd-like viruses, as model colloidal rods, section II. We then show that in presence of depletants their condensation leads to a myriad of self-assembled structures, section III. Finally we discuss a road map using an isotropic aqueous suspensions of filamentous phages and depletion to rationalize the phages hierarchical and reconfigurable self-assembly upon variations of attraction via the depletion interaction, chirality and rods composition, section IV.
II Filamentous phages as versatile building blocks for self assembly
A bacteriophage or phage is a virus that infects and replicates within a bacterium. They were discovered by Twort Twort (1915) and d’Hérelle d’Herelle (1917) in the early 20th century. Bacteriophages are among the most common and diverse entities in the biosphere Mc Grath and van Sinderen (2007) and are widely distributed in locations populated by bacterial hosts, such as soil or the intestines of animals or sea water. In the latest, up to 108 virions per milliliter were found in microbial mats at the water surface,Wommack and Colwell (2000). The impact of phage research in biology is huge: from novel biochemical mechanisms for replication, maintenance and expression of the genetic material and new insights into origins of infectious disease to their use as therapeutic agents Sulakvelidze et al. (2001). Here, we focus on fd-like phages and their use as building block for self-assembly, Dogic (2016).
II.1 Synthesis
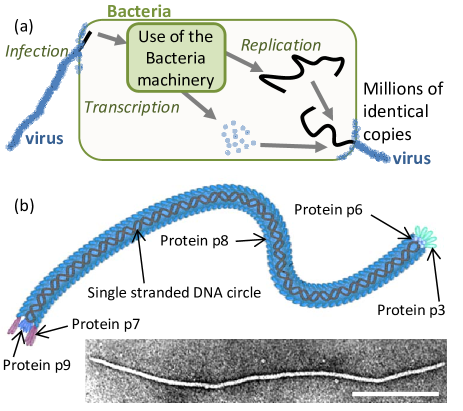
The fd-wt virus was originally isolated from sewage Marvin (1963). fd-wt (16.4x10⁶ g/mol) are identical to one another and composed of a single strand DNA surrounded by a protein layer of about 2700 identical protein p8 subunits. The protein p8 has a molecular mass of 5240 g/mol and accounts for about 99% of the total protein mass. The rest of the protein mass belongs to the minor coat proteins which are located at the tips of virus Day et al. (1988). At one end of the filament, there are five copies of the protein p9 and p7. At the other end of the phage, there are five copies of p3 and p6. p3 proteins are the first to interact with the E. coli host during infection. p3 is also the last point of contact with the host as a new phage bud from the bacterium, Fig. 1.
Bacteriophage viruses were named based on their observed ability to lyse bacterial cells (in greek, ‘bacteria eaters’). However not all phages lyse bacteria. In particular, fd-wt use a lysogenic cycle. Lysogeny is characterized by the integration of the bacteriophage nucleic acids into the host bacterium’s genome or formations of a circular replicon in the bacterial cytoplasm. In this condition, the bacterium continues to live and reproduces normally. The genetic material of the bacteriophage is transmitted to daughter cells at each subsequent cell division. Once infected the cell and its descendants are thus turn into a virus manufacture.
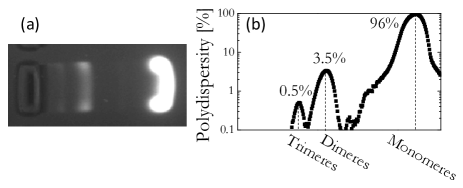
fd-wt are grown using standard biological techniques Sambrook et al. (1989); Unwin et al. (2015). In short, an overnight starter culture taken from a single colony of the bacteria ER2738 is incubated for 12h at 37∘C and shacked at 250 rpm in 5 mL of sterile 2xYT (yeast extract tryptone) growth medium. 200 L from the resulting overnight E. coli culture is then grown in 5 mL of a fresh growth medium until it reaches an optical density 0.5 at 600 nm measured with a UV-Vis spectrophotometer. The sample is then inoculated with 10 L fd-phage stock at approximately 1 mg/mL. The suspension is incubated and shacked 30 minutes then transferred to a 250 mL conical flask with 30 mL of broth media for 2 hours and finally transferred in a 2 L flask with 500 mL of growth media and grown until 1. From the 500 mL growth cycle, E. coli cells and debris are removed by centrifuging the cultures twice at 8300g for 15 minutes, harvesting the supernatant each time. A precipitant solution is added (146.1 g/L NaCl and 200 g/L Polyethylene glycol (PEG) of average molar mass 8000 g/mol) in a ratio of 3 parts precipitant to 10 parts supernatant. After refrigeration for at least an hour, the supernatant is centrifuged as before, and the clear supernatant is removed, leaving the precipitated pellet of viruses. Viral pellets are resuspended in 10 mL of sterile phosphate buffered saline (PBS) solution. Ultracentrifuge (1h at 90000 rpm) is then used to exchange the buffer and concentrate the viruses. The virus concentration is determined using absorption spectroscopy. The optical density of fd-wt at 269 nm for 1 mg/ml solution in a 1 cm cuvette is 3.84 Baus et al. (2012). This procedure yields a virus stock solution with some multimers, such as dimers that have a contour length that is twice that of fd-wt, Fig. 2. To select the monomers, the stock solution is fractionated. Samples are concentrated to reach the isotropic-nematic phase coexistence so that 20% of the sample is nematic and the rest is isotropic. Longer rods preferentially dissolve in the nematic phase Lekkerkerker et al. (1984). The isotropic fractions is isolated and used as a stock of monodisperse viruses. Such a preparation with 500 mL of growth media yields approximately 200 mg of viruses. For the self-assembly experiments, the viruses are dispersed in a buffer that contains 100 mM/mL NaCl and 20 mM/mL Tris at pH = 8.05.
For the study presented in the review, in addition to fd-wt, the filamentous phages fd-y21m and m13KO7 are also used. Their synthesis follow the same protocol as for fd-wt and their unique properties are details in Tab. LABEL:tab:fd
| fd-wt | fd-y21m | M13KO7 | |
| (nm) | 6.6 | 6.6 | 6.6 |
| (m) | 0.88 | 0.88 | 1.2 |
| (m) | 2.8 | 9.9 | 2.8 |
| (/nm) | 10 | 10 | 7 |
| Chirality | right | left | right |
II.2 A model system?
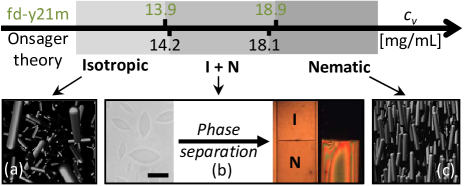
There are unique advantages of this particular system. First, fd-wt are monodisperse. This eliminates complications related to the polydispersity of rods and facilitates direct quantitative comparison with theory. Second, fd-wt have a diameter of 6.6 nm for a contour length of 880 nm Newman et al. (1977); Bhattacharjee et al. (1992) conferring them a large aspect ratio, 130 which is similar to the one of spaghetti (150). Finally viruses are quite rigid: fd-wt has a persistence length of 2.8 m and the mutant fd-y21m has an even greater persistence length, 9.9 m Barry et al. (2009a). Therefore, viruses, and fd-y21m in particular, can be consider as a model liquid crystal system in the framework defined by Onsager. At low concentrations, colloidal rods form an isotropic phase with no direction or orientation order. However as the concentration is increased, the isotropic dispersion becomes metastable or unstable: orientation fluctuations drive concentration gradients which lead to phase separation into a isotropic state in coexistence with a nematic state where the rods have no positional order but tend to point in the same direction which define the nematic director. During this transition, transient nematic droplets or tactoids nucleate in an isotropic background and coalesce to minimize the interface between the isotropic and the nematic phases. This leads to the thermodynamically stable state: two homogeneous phases, the isotropic and nematic phase separated by a single interface, Fig. 3. Onsager has established that this transition is purely entropic in nature Onsager (1949); Frenkel (1994). The entropy loss due to the orientation ordering in the nematic phase is over compensated by the increase in translational entropy: the free volume for any one rod increases as the rods align. Moreover, he established that the transition volume fractions for rigid rods with an aspect ratio larger than 75 and repulsive interactions are: = 3.289 for the isotropic phase and = 4.192 for nematic phase Onsager (1949). is the diameter of the rod and its contour length. For rods with the aspect ratio of fd-y21m, the transition concentrations are 14.2 and 18.1 mg/mL. These predictions are remarkably close to the experimental results Barry et al. (2009a), Fig. 3.
II.3 A versatile library of colloid rods
A challenge associated with hierarchical assembly is to control the final macroscopic assemblage by specific modification of relevant microscopic parameters. Thanks to nature diversity, genetic engineering and bio-chemistry, on top of having properties that remains yet unmatched by chemical synthesis, it is possible create a large library of monodisperse fd-like particles with slight variations in their physical properties, like their contour length, diameter, rigidity or interactions Dogic (2016); Dogic et al. (2014).
II.3.1 Chirality
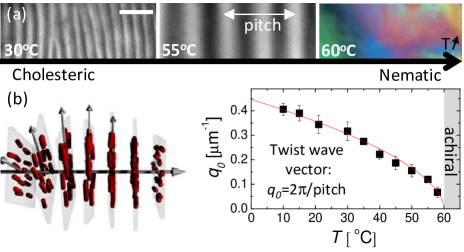
fd-wt is chiral an left-handed: in close contact with one another fd-wt tend to twist preferentially clock wise. Therefore fd-wt, at room temperature, form cholesteric phase instead of a nematic Dogic and Fraden (2000); Gibaud et al. (2012a), Fig. 4. The cholestiric phase shows nematic ordering but its director rotates throughout the sample. The axis of this rotation is normal to the director and the distance over which the director rotates by 360∘ is called the cholesteric pitch. Moreover, fd-wt chirality is temperature sensitive. Chirality decrease with temperature and eventually vanish at ∘C, Fig. 4. Understanding the virus chirality and its temperature dependence and its propagation at the macroscopic length scale remains a challenge Dogic and Fraden (2006); Grelet and Fraden (2003); Tombolato et al. (2006); Dussi et al. (2015); Day et al. (1988). Day and Meyer proposed that the cholesteric twist derivates from a ‘cork screw’ shape of the virus due the interplay between its major coat proteins and its DNA backbone Day et al. (1988).
II.3.2 DNA backbone
The contour length of phage virus scales linearly with its genome size. The virus length impact the dynamics of the virus. Maguire et al. have shown that rotational diffusion coefficient of rods in the isotropic phase scale linearly with the length Maguire et al. (1980). The virus length also affect the phase diagram. It shifts the location of the isotropic-nematic phase transition toward higher volume fractions and it stabilizes the smectic phase Dogic and Fraden (2001); Purdy and Fraden (2004, 2007). So far physicists have used viruses which length range from 0.4 to 1.2 m. However, using molecular cloning techniques it is possible to engineer viruses that are as short as 50 nm and as long as 8000 nm Herrmann et al. (1980); Specthrie et al. (1992); Marchi et al. (2014); Brown et al. (2015); Sattar et al. (2015).
II.3.3 Major coat proteins
The major coat proteins confer to fd-wt a net linear charge density of 10 /nm at pH=8.05 Zimmerman et al. (1986); Purdy and Fraden (2004). It is possible to label the major coat proteins with chemical compounds. This is very convenient to make the virus fluorescent and track their individual dynamics within an assemblage. Coating such as PEG Grelet and Rana (2016), SiO2, TiO2, Pouget and Grelet (2013), PNIPAM Zhang et al. (2009), DNA Ruff et al. (2016), gold Montalvan-Sorrosa et al. (2014), carbon nanofiber Szot-Karpinska et al. (2016) or fluorescent dyes Zhang and Grelet (2013) obviously increases the diameter of the virus but may also drastically change the interactions between the viruses and therefore the way they self-assemble.
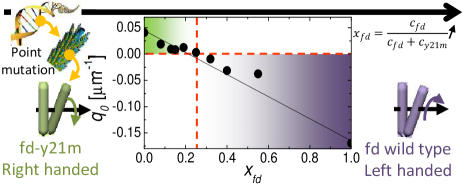
Genetic mutation represents another way to act on the major coat proteins Abramov et al. (2017). For example, structural biologists have genetically engineer fd-wt into fd-y21m, a mutant virus in which the 21st amino acid out of the 50 composing the major coat protein is changed from tyrosine to methionine Marvin et al. (1994). fd-y21m is not only stiffer as mention above, but it also makes left-handed cholesteric state as opposed to fd- wt which form right handed cholesteric state Barry et al. (2009a) and contrary fd-wt, fd-y21m chirality is temperature independent Gibaud et al. (2012a). By mixing fd-wt and fd-y21m at a controlled ratio , it is possible to design cholesteric phases with the desired the pitch and chirality, Fig. 5. The phase space of all possible mutations of the major coat protein is huge. It could be investigated using phage display technology Rowitch et al. (1988) to better understand the impact of the coat protein structure on the coarse-grained properties of the filament Hunter et al. (1987).
II.3.4 Cap proteins
Another attractive feature of filamentous bacteriophages is the presence of cap proteins which are distinct from the major coat proteins, thus enabling selective labeling of the virus end and in particular normal anchoring of the phage, i.e. attaching virus perpendicular to a surface. On one hand this feature is used to create new materials. For instance using phage display, filamentous phages were organized into smectic layers that are intercalated with layers of end-bound inorganic nanoparticles Whaley et al. (2000); Lee et al. (2002). On the other hand this feature is also used to design new particles such as star colloids where filamentous phages were pinned to the colloid surface Huang et al. (2009) or filamentous ring-like structures by labeling the two ends of the virus with distinct labels that stick to each other Nam et al. (2004). This last example paves the road toward specific and sequential self-assembly.
III Condensation of colloidal rods
III.1 Colloidal rod and depletion
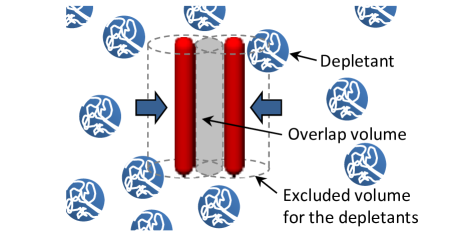
The depletion interaction is an effective attraction that arises between large colloidal particles that are suspended in a dilute solution of depletants. Except for excluded volume effects, the depletant and the colloids are not interacting and are considered as hard spheres. Usually the depletant is a polymers much smaller than the colloid. In this configuration, there is a region which surrounds each colloid which is unavailable for the centers of mass of the depletants. Therefore, as two colloids approach each other, the excluded volumes overlap and additional free volume becomes available to the polymers, thus increasing the overall entropy of the mixture Asakura and Oosawa (1954). This results in an effective attractive (depletion) potential between the colloids, whose strength and range can be increased by increasing the polymer concentration and size, respectively Asakura and Oosawa (1954).
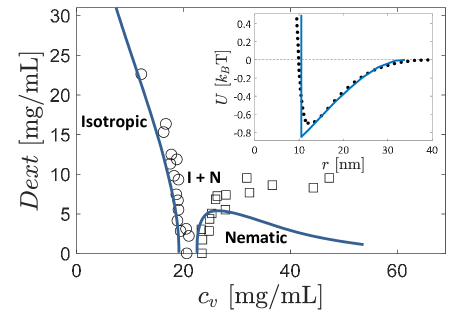
The depletion principle can be transposed to mixtures of viruses and polymer depletants. This has been tested under relatively high salt content so that hard-core repulsive interactions dominate and using different polymers like Dextran or Polyethylene glycol which size is always smaller than the rod length but can be greater than its diameter Dogic et al. (2004); Yang et al. (2012). Contrary to colloids/polymer mixtures, the depletion interaction becomes anisotropic with rod-like colloids. It tends to align the viruses Matsuyama and Kato (2001) so that the overlap volume is maximized Fig. 6. The obvious consequence in the introduction of polymers in suspensions of phages is that it tends to shift the isotropic boundary to lower volume fractions. Due to the level rule, the nematic state is consequently shifted to higher volume fractions. Using fd-wt and dextran mixtures this behavior is quantitatively confirmed and modeled Dogic et al. (2004), Fig. 7. Depletion is an ideal tool to promote entropic condensation.
III.1.1 Nematic droplets
Nematic droplets rather than being spherical display a spindle shape Ichinose et al. (2004); Davidson (2010); Kaznacheev et al. (2002). This shape is due to the interplay between the interfacial tension and the splay and bend elastic constants of the inner nematic phase Onsager (1949). Tuning the morphology and order within the droplets represent a corner stone for applications such as light modulators or more generally as photonic materials Tortora and Lavrentovich (2011); Jeong et al. (2014); Bunning et al. (2000); Joannopoulos et al. (2011).
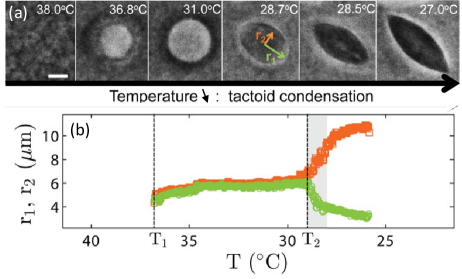
Most paths which lead to tactoids formation are kinetically driven. For example, Lettinga et al. prepared samples in the I-N coexistence region and used shear to dissolve the tactoids and then study their condensation. To circumvent kinetics issues, Modlińska et al. engineered a colloidal system where one can continuously tune the attraction between the rods to condensate tactoids in a reversible and quasi static way starting from an equilibrium isotropic state Modlińska et al. (2015). They replaced the depletants Dextran by thermo–sensitive and non-adsorbing poly(N-isopropylacrylamide) (pnipam) microgel particles Still et al. (2013). The effective attraction between the rods is then controlled externally by temperature. As temperature decreases, the microgel particle swell which increases both the range and the depth of the attraction Modlińska et al. (2015). Navigating the phase diagram in a continuous way, Modlińska et al. showed that tactoids formation is preceded by the nucleation and growth of dense isotropic spherical droplets within the isotropic background, Fig. 8. This scenario is analogous to the enhanced protein crystallization slot located above the liquid-liquid phase separation suggested by ten Wolde and Frenkel ten Wolde and Frenkel (1997). Just as the critical density fluctuations and in particular fluctuations of high densities behave as a micro reactor to lower the energy barrier for crystal nucleation, the dense isotropic droplets layout the ideal nucleation spot for the nematic phase.
III.1.2 Colloidal membranes
Fig. 7 shows that depletion interactions promote rods condensation but it does not reveal any new phases compared to the case without depletant. Barry and Dogic extended this phase diagram to higher dextran concentrations ( 500 000 g/mol) Barry and Dogic (2010) and showed that, starting from an isotropic rods suspension at 1 to 10 mg/mL, it is possible to assemble a new phase: 2D colloidal membranes composed of a one-rod length thick mono-layer of aligned rods. The membrane diameter is not controlled and varies from a few microns to hundreds of microns, Fig. 9. On a coarse grain level the self-assembled fluid-like and equilibrium monolayers have the same symmetry as lipid bilayers and one can develop many analogies. First, like lipid bilayers, the instantaneous and average projected colloidal membrane area are proportional, where the compressibility is /m2) Barry and Dogic (2010); Nagle and Scott (1978); Needham and Nunn (1990); Evans and Rawicz (1990); Evans and Needham (1987). For comparison, the compressibility of lipid membrane is 2 to 3 orders of magnitude higher m2Rawicz et al. (2000). Second, the colloidal membranes viewed in edge-on configurations, exhibit thermal undulations. The Fourier analysis of these fluctuations can be model using the elastic free energy written down by Helfrich, originally developed for lipid bilayers Helfrich (1978). Finally, the stability of colloidal membranes is similarly related to the way lipid bilayers interact Goetz et al. (1999); Israelachvili and Wennerstrom (1996); Lipowsky and Grotehans (1993). Indeed, From 45 to 53 mg/mL, colloidal membrane remain isolated from each other: as two membranes approach each other in suspension, protrusion fluctuations lead to an effective repulsive interaction and promote the stability of isolated membranes. At higher dextran concentrations, the depletion interaction becomes sufficiently large to overcome this effective repulsion and colloidal membranes stack on top of each other Barry and Dogic (2010).
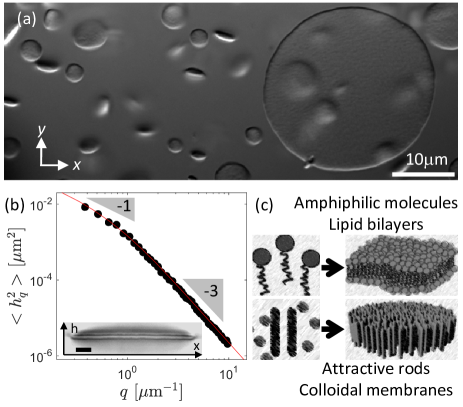
However, from a microscopic perspective the forces driving the assembly of colloidal membranes and lipid bilayers are very distinct. Colloidal membranes are assembled from micron length hydrophilic rod-like molecules, whereas lipid bilayers are assembled from nanometer amphiphilic lipids. This leads to orders of magnitude difference in their compressibility, lateral bending modulus or lateral tension.Those orders of magnitude differences can in a first approximation be attributed to the size differences of the building blocks. Indeed, the distance between the constituent particles in the colloidal membrane is nm and nm is lipid bilayer; assuming that Evans (1974), we roughly recover the ratio between the compressibility of colloidal membranes and lipid bilayer. The same holds for the lateral bending modulus which scales as Bermúdez et al. (2004). Colloidal membranes being robust assemblages stable over a wide range of parameters Yang et al. (2012), they represent a unique opportunity to investigate membrane biophysics from an entirely new perspective on length scales where it is possible to visualize and follow under light microscope the constituent building blocks, the membrane dynamics or reconfigurable processes.
We first discuss the edge properties of colloidal membranes which are described at a macroscopic level by the interfacial tension Marchand et al. (2011). For 2D colloidal membranes, is 1D and is the equivalent of surface tension for 3D objects like emulsion for instance. This a thermodynamic quantity that results from the greater affinity of the colloidal membrane particles to each other than to the particle isolated in the solvent. The net effect is an inward force at the membrane circumference that causes the edge to behave elastically. The control of interfacial tension is manifold. It justifies that colloidal membranes adopt a circular shape. Its control, in analogy with micro-emulsion, could lead to fine tune the size of colloidal membranes.
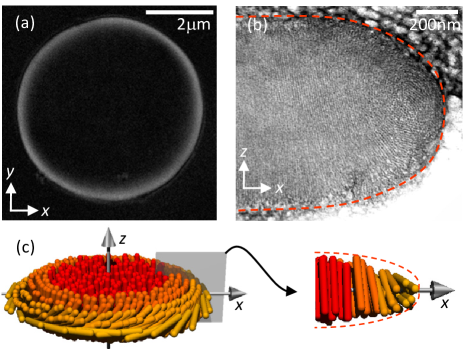
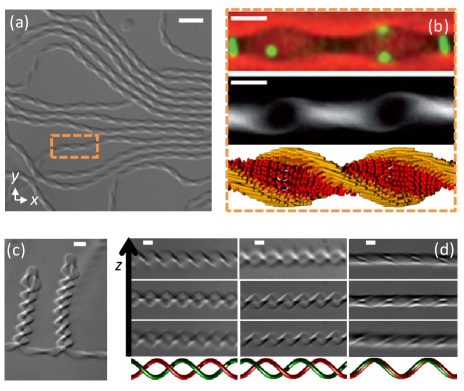
The edge structure of achiral colloidal membrane is determined using three complementary imaging techniques, namely two-dimensional (2D) and three-dimensional (3D) polarization microscopy and electron microscopy Gibaud et al. (2012a), Fig. 10. 2D-LC-PolScope Oldenbourg and Mei (1995) of a membrane lying normal to the -axis of the microscope produces images in which the intensity of a pixel represents the local retardance and indicates the local tilt of the rods with respect to the -axis. Rods in the bulk of a membrane are aligned along the -axis, and it follows that 2D LC-PolScope images appear black in that region. By contrast, the bright, birefringent ring along the membrane’s periphery reveals local tilting of the rods at the edge. The 3D reconstruction of the membrane structure using electron tomography Mastronarde (2005); Kremer et al. (1996), shows that the virus tilt by 90∘, from being normal to the membrane surface in the bulk to tangential to the edge along the membrane periphery. This behavior is corroborated by 3D-LC-PolScope Oldenbourg (2008). This twist goes with a hemi-toroidal curved edge. The twisted edge makes the membrane a chiral object. For achiral viruses dispersions, the spontaneous twist at the edges is equally likely to be clockwise or anticlockwise Gibaud et al. (2012a). For chiral virus suspensions, the edge adopts the chirality of the virus. By comparison with an untilted edge, a curved edge structure lowers the area of the rod-polymer interface, thus reducing interfacial tension, at the cost of increasing the elastic energy due to a twist distortion.
III.2 Colloidal membranes and chirality
III.2.1 Tuning the edge chirality
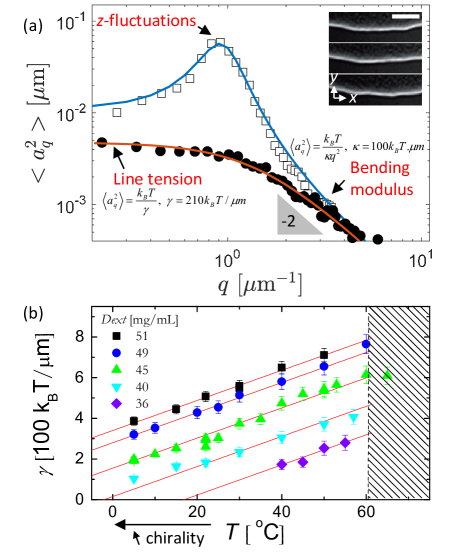
A classical way to measure the interfacial tension consists in analyzing the membrane’s edge thermal fluctuations in the Fourier space Fradin et al. (2000); Safran (1994); Aarts et al. (2004). A typical fluctuation spectrum for an achiral edge is shown in Fig. 11. In the thermodynamic limit which corresponds to small wave vectors, , the mean square Fourier amplitudes of the edge fluctuations, , is -independent, and yields the effective line tension, Fradin et al. (2000). In the large- limit, fluctuations scale as and yield the bending rigidity of the interface, . In the range of temperatures and dextran concentrations explored, for fd-wt colloidal membranes, 100 while varies from 100 to 800
Next we evidence the role of chirality on . The self-assembly of colloidal membranes is driven by entropy alone and therefore athermal as apposed to the fd-wt chiral interaction which depends solely on temperature. We thus have a unique system where it is possible to decorelate the effect of attraction (dextran concentration) from chirality (temperature): = , where is the bare line tension of a membrane edge composed of achiral rods and is the chiral contribution to the line tension Gibaud et al. (2012a). In Fig. 11, we observe that the effect of chirality drastically modifies the fluctuation spectrum of the edge of a colloidal membrane, as expected from the edge structure. First, is shifted upward at low which indicates that the line tension decreases with chirality as hypothesize. This is further demonstrated using dextran series which show that decreases with the same slope as temperature decreases confirming that the two contributions to are uncorrelated. Second, a peak appears at intermediate . This peak is attributed to out of plane fluctuations. Indeed the effect of chirality at the edge of colloidal membranes is twofold. 2-D layered geometry cannot support twist and chirality is consequently expelled to the edges in a manner analogous to the expulsion of a magnetic field from superconductors de Gennes (1972); Renn and Lubensky (1988). Moreover, to palliate the 2D frustration Kamien and Selinger (2001); Renn and Lubensky (1988); Hough et al. (2009a), chirality forces the edge fluctuations to escape in the -direction Helfrich and Prost (1988) which vouch for the existence of a positive Gaussian curvature, Jia et al. (2016).
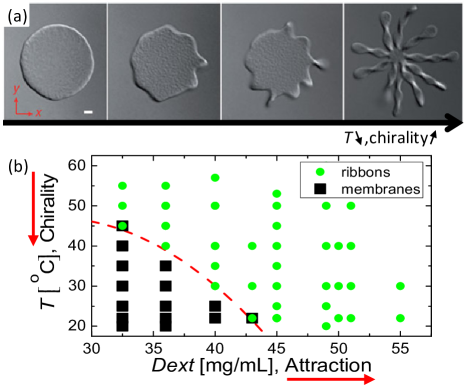
III.2.2 Twisted ribbons
The chiral control of line tension raises the possibility that at sufficiently low temperatures the chiral contribution to interfacial energy could dominate the bare line tension, lowering the energetic cost of creating edges and leading to the control of the size of the membrane or to spontaneous edge formation. With decreasing temperature, membranes remain polydisperse in size. However the membrane edge eventually becomes unstable, resulting in a remarkable polymorphic transition, Fig. 12. Twisted ribbons grow along the entire periphery of the disk from the out of plane fluctuations of the membrane edge, generating a starfish-shaped membrane. This polymorphic transition is reversible and twisted ribbons form equilibrium structures at high chirality and low dextran concentrations. Twisted ribbons are a beautiful example of hierarchical assembly, Fig. 13. It consists in a twisted monolayer of aligned rods which form a helicoidal structure perpendicular to the rod twist. As observed by Efrati and Irvine, such object is simultaneously right and left handed Efrati and Irvine (2014). The rod twist at the edge is left handed while on larger length scales the helicoidal structure of the ribbon is right handed. As such it differs from other twisted ribbons observed in the literature Zastavker et al. (1999); Matsumoto et al. (2009); Marini et al. (2002); Zhang et al. (2002); Srivastava et al. (2010); Lashuel et al. (2000). The twisted ribbons can be seen on a coarse grain level as polymers with a persistence length of the order of the pitch of the helicoidal structure and may form a zoology of structures ranging from branched polymer, to loop polymer or entangled phone cord like structures reminiscent of DNA doubled helix Gibaud et al. (2012a). Twisted ribbons stability with respect to colloidal membranes is attributed to two factors. First chirality is frustrated in colloidal membranes as viruses in the bulk cannot twist due to their virus neighbors whereas in twisted ribbons all the viruses twist and chirality may naturally be expressed. Second, twisted ribbons are edge objects with low interfacial energy compared to the membranes. Given the 3D structure of the ribbons, Gaussian curvature may also be an important parameter that justify the twisted ribbon stability Jia et al. (2016).
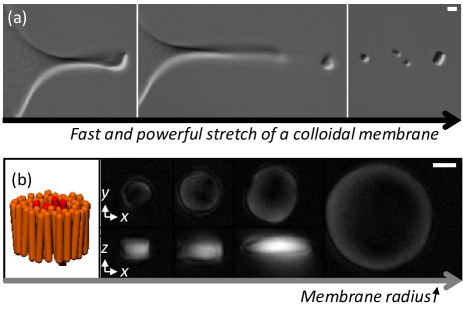
It is possible to use laser tweezers to manipulate the self assembled structures. For instance in Fig. 14, the two opposite sides of a colloidal membrane are trapped with a dual-beam optical trap. The viruses align with the electric field of the laser and the membrane turn sideway. Using a static trap and providing an extensional displacement with the other optical trap, the membrane is stretched, causing the transition to a twisted ribbon. This mechanically induced disk-to-ribbon transition is reversible; on removal of the optical trap, the highly elastic ribbon relaxes back into its original shape. This experiment pave the way to study mechanical properties of self-assembled objects Zakhary (2014).
III.3 Colloidal membranes and chiral coalescence
Driven by the balance between interfacial tension and bulk energy, a pair of liquid droplets, when sufficiently close to one another, may coalesce to form a single daughter droplet. The coalescence process is complex and involve the rupture and the fusion of the droplets surfaces associated with energy barrier and local rearrangements Aarts et al. (2005); Aarts and Lekkerkerker (2008); Paulsen et al. (2012, 2011); Sundararaj et al. (1995); Loudet et al. (2000); Chernomordik and Kozlov (2008); Haluska et al. (2006); Jahn and Südhof (1999). In most cases, it is an ‘all-or-none’ process; once initiated, the reaction proceeds to completion. However, there is also the possibility of incomplete coalescence. For example, vesicles coalesce into hemi-fused state Shillcock and Lipowsky (2005) and nanotubes into a defect-ridden structureTerrones et al. (2000). Taking advantage of the chiral edge, colloidal membranes coalescence enlight the role of geometrical frustrations Goodby et al. (1994) in the self-assembly of new structures Zakhary et al. (2014); Gibaud et al. (2017).
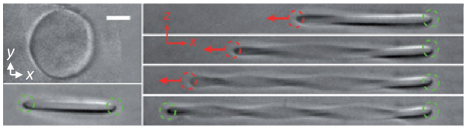
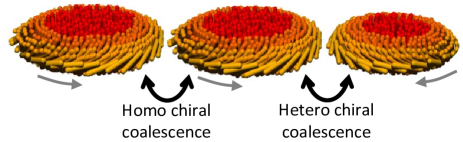
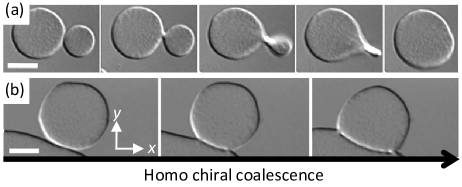
The edge chirality of colloidal membranes can be controlled in various ways. First, if the colloidal membrane is small enough, a diameter smaller than the virus length, the viruses stand straight at the edge and those membrane seeds are achiral, Fig. 15. Second, for larger membranes the edge adopt the chirality of the virus. Third, it is possible to compose achiral virus suspensions, for instance using fd-wt at 60∘C or mixtures of fd-wt and fd-y21m at 0.26, Fig. 4-5, and in this case, the symmetry being broken, colloidal membranes self assemble either with left- or right-handed edge. For chiral membranes, we can divide the coalescence in two families: homo and hetero chiral coalescence, Fig. 16. In homo chiral coalescence two coplanar membranes have the same chirality. The rods at the coalescence point are tilted in opposite directions, trapping 180∘ of twist between the two membrane. In hetero chiral coalescence both coplanar membranes have the opposite chirality and viruses at the edge need only to straiten in the -direction at the coalescence point.
III.3.1 Homo chiral coalescence – -walls, pores, Möbius anchors and colloidal skyrmions
Homo chiral coalescence Zakhary (2014) is at the center of chiral topological frustration. In Fig. 17, the coalescence between two homo chiral membrane may result in a defect-free daughter membrane. Similar to liquid droplets, the thermal fluctuations are sufficient to form a bridge between the two membranes. In this one rod-length-wide bridge, the rods twist by 180∘ to match the orientations of the joining edges. The twisted bridge induces a torque which enable the two membranes to rotate along the axis formed by the bridge and expel the trapped twist. As the membranes twist around each other, the connecting bridge expands in width, eventually leading to a circularly shaped defect-free daughter membrane. In an other pathway, coalescence is initiated by the formation of two twisted anchors, which bind the membranes together and initiate the nucleation of a continuous 1D line defect. This line defect, named a -wall, quickly grows to its equilibrium size, pushing the two anchor apart. Once the -wall is fully formed, it remains indefinitely. -walls are stable with respect to two free membrane edges: the measurements of -wall interfacial tension and the membrane edge interfacial tension shows that .
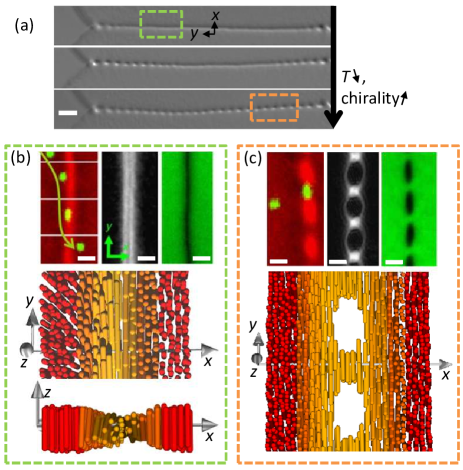
However, in fd-wt systems where chirality can be controlled with temperature, -wall can be continuously brought to regimes with high chiral interactions at low temperatures. In this case, and -walls become metastable with respect to isolated membranes. In high chiral regimes, we do not observe the spontaneous dissociation of a -wall into two defect-free membranes. We instead observe the opening of pores in the -walls, Fig. 18. Those pores may form an alternating bridge-pore arrays (ABPA) structure which can be closed back into a -wall by increasing the temperature. This behavior remains to be understood but seems reasonable, as pores create a large amount of edge interfaces which are favored at high chirality. More importantly, it empirically proves that with the proper ingredient it possible to actuate pores upon external signaling in self-assembled membranes. Pore actuation is of primal importance through out the cell life cycle Suntharalingam and Wente (2003); Tran and Wente (2006).
Finally we discuss two structures related to -walls: Möbius anchors and colloidal skyrmions. Both those structures rely on a robust on-demand method for imprinting defects into colloidal membranes with arbitrary spatial precision. Taking inspiration from recent work with thermotropic liquid crystals Ackerman et al. (2012); Honglawan et al. (2013); Yoon et al. (2007), we also use an optical trap.
A simple Möbius strip is a one-sided continuous surface, formed by twisting a long narrow rectangular strip of material through 180∘ and joining its ends. Such a structure can be made in liquid-crystal by knotting of microscopic topological defect lines with optical tweezers about colloids Tkalec et al. (2011). The Möbius strip we observe in colloidal membrane are Möbius anchors Zakhary et al. (2014). The Möbius anchor is associated with the way -walls are anchored to the membrane edge, Fig. 19 and is mandatory for the -wall to remain stable. For instance, it is possible with optical tweezers to imprint -wall on a colloidal membrane. However, if the optical trap is released before the -wall is anchored, the defect retracts. Based on 2D-LC-Polscope micrographs, it seems that the viruses follow a simple Möbius strip which tight the -wall to both edges of the daughter membranes, Fig. 19. At this point this anchoring structure is only a guess. This hypothesis is however supported by the fact that it is necessary to produce a the back and forth motion with the optical trap to create the anchor which is reminiscent of the pathway depicted in soap film to create Möbius loop Goldstein et al. (2010).
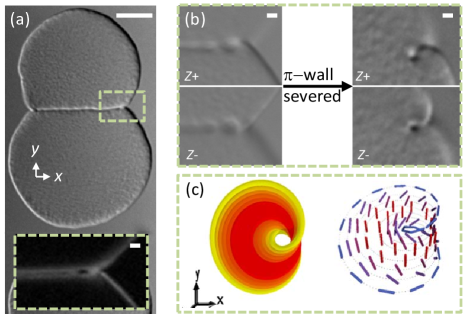
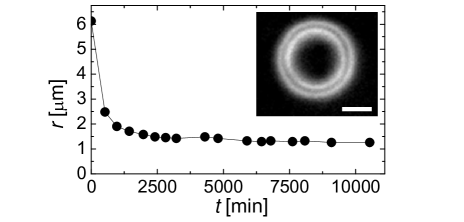
Colloidal skyrmions Zakhary et al. (2014) are obtained using optical tweezers to cleave a -wall in two places, and then quickly joining the two ends to form a closed ring embedded within the membrane, Fig. 20. The colloidal skyrmion shrinks to an equilibrium diameter of about 1 m. Note that for a similar size, an isolated colloidal membrane displays an untwist edge, Fig. 15. The colloidal skyrmions share properties with skyrmion excitations encountered in hard condensed matter physics Fukuda and Žumer (2011); Mühlbauer et al. (2009); Brey et al. (1995); Tonomura et al. (2012); Ravnik et al. (2011). It is topologically protected Skyrme (1962); Nagaosa and Tokura (2013): it has a positive energy compared with the background field but the -wall forming the skyrmion cannot be untrapped unless the -wall is severed. Moreover, it is a 2D structure characterized by a vorticity and a phase helicity which sign depends on the chirality of the -wall. As such, it is very similar to singled out skyrmions from the hexagonal SkX state on MnSi Mühlbauer et al. (2009) and Fe1-xCoxSi Grigoriev et al. (2007, 2009); Yu et al. (2010) and seems to be the closest realization of a theoretical nematic skyrmions restricted to straight infinite lines in unbounded ideal materials Bogdanov et al. (2003). It however differs from other liquid crystal skyrmions such as double twist cylinders “baby-skyrmions” Ackerman et al. (2014); Smalyukh et al. (2010), skyrmions in cholesteric blue phases subjected to strong external fields Hornreich and Shtrikman (1989); Heppke et al. (1989).
Understanding the principles that support or prevent membrane coarsening and defects formation such as -wall is essential to grow large defect free membranes and consider applications. As chirality is at the center of -walls, it suggests that producing achiral colloidal membranes would lead to defect-free coalescence and uniform monolayers.
III.3.2 Hetero chiral coalescence – scalloped membranes and gaussian curvature
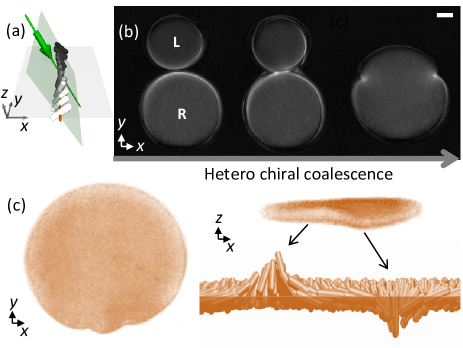
To study hetero chiral coalescence Gibaud et al. (2017), colloidal membranes composed of homogeneous mixtures of fd-wt and fd-y21m are used. For 0.04 0.45, in the early stages of the sample maturation, we observe colloidal membranes of either edge handedness, indicating spontaneously broken achiral symmetry. Over time, the intermediate-sized membranes with mixed edge twist continue to coalesce. Both homo and hetero chiral coalescence is observed. In both cases coalesced membranes display an homogeneous mixing of fd-wt and fd-y21m. In hetero chiral coalescence, as the two proximal edges of a pair of coplanar membranes merge, the twist of the edge-bound rods is expelled by aligning the constituent rods with the membrane normal. Hetero chiral coalescence leads to scalloped membranes. As compared to homo chiral coalescence, scalloped membranes form easily. Moreover, they are defect free in their bulk and may reach millimeter diameter. The hallmark of scalloped membranes is located on its edge. It displays two outward protrusions which separate a left from a right handed edge, Fig. 21. Using confocal microscopy, it is observed that the two protrusions escape in the -direction in opposite directions. This 3D point-like singularity on the vertical axis vouch for the presence of Gaussian curvature associated with its Gaussian elastic modulus .
The distance between two adjacent edge protrusion greatly depends on , Fig. 22. Close to the achiral limit, at 0.26, adjacent protrusions freely move along the edge and the dynamics of is diffusive. On the contrary, close to the boundary of the stability region of scalloped membranes at 0.04 or 0.45, adjacent protrusions pair and remain bound to each other at a well-defined distance . To measure the entire binding potential, active experiments are performed: one defect is moved by using an optical trap, while simultaneously measuring the force exerted on the adjacent defect. For this purpose, 1.5 m diameter colloidal beads are embedded into two adjoining cusp defects. The force is negative below , and positive above . is the stable equilibrium position. The force steeply increases for small separations and saturates at large separations, indicating that a pair of defect is permanently bound, Fig. 22.
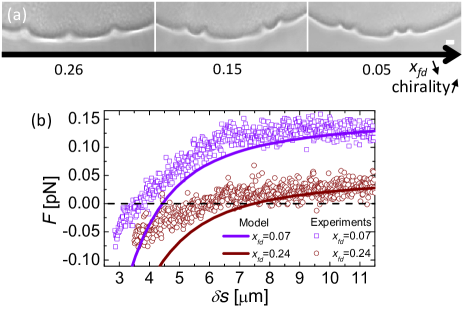
These observations can be mainly explained by the chirality of the edges. For instance, at 0.07 the system is mostly composed of fd-y21m and right handed chirality is favored. Therefore right-handed edge have a lower energy than left handed edges. This leads, in scalloped membranes, to a finite difference in line tension between the left-handed and right-handed outward protrusions. The edge free energy is minimized by reducing the length of the outward protrusions with the unfavored twist and the amplitude of accounts for the strength of the long range attraction between two adjacent protrusion. Approaching the two protrusion close together has two consequences. It tends to over bend the edge separating the two adjacent protrusion and to flatten the protrusion in the -direction. This works again the bending rigidity of the edge and against a negative Gaussian curvature , which lowers the free energy of elastic deformations if the Gaussian modulus is positive and sufficiently large, 200 Tu and Pelcovits (2013a); Kaplan et al. (2013); Gibaud et al. (2017).
This results display a striking difference with conventional bilayers which have a negative Gaussian modulus: saddle-shaped deformations increase the membrane energy Hu et al. (2012); Siegel and Kozlov (2004); Semrau et al. (2008); Baumgart et al. (2005). Moreover, scalloped membranes and the transition from membrane to twisted ribbons demonstrate that simple uniform elastic sheets lacking in-plane rigidity can spontaneously assume complex 3D folding patterns as opposed to thin elastic sheets with in-plane elasticity Cerda and Mahadevan (2003); Leocmach et al. (2015); King et al. (2012); Pocivavsek et al. (2008) which require in-plane heterogeneities or an external force to be fold or wrinkled. Finally achiral symmetry breaking has been observed in diverse soft systems with orientational order, ranging from lipid monolayers and nematic tactoids to confined chromonic liquid crystals Tortora and Lavrentovich (2011); Jeong et al. (2014); Link et al. (1997); Jeong et al. (2015); Hough et al. (2009b). In particular the measured structure and interactions of the cusp-like defects in colloidal membranes resemble studies of point defects moving along a liquid crystalline dislocation line in the presence of chiral additives Żywociński et al. (2005). The main difference is that in the colloidal membranes the achiral symmetry breaking leads to out-of-plane 3D membrane distortions that couples liquid crystal physics to membrane deformations. This is not possible for inherently confined liquid crystalline films.
III.4 Asymmetric mixtures of colloidal rods
III.4.1 Phase separation in colloidal membranes
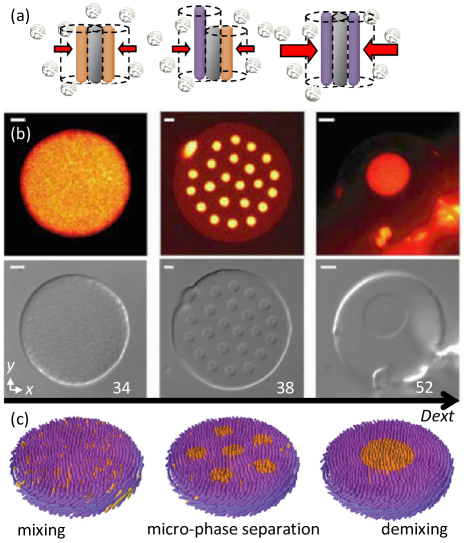
Phase separation can be triggered by asymmetric forces between the colloids. This force configuration can be achieve by mixing depletant with viruses of different lengths: fd-y21m virus (880 nm long) and M13KO7 virus (1200 nm long). The strength of the depletion force is proportional the overlap of the excluded volume. In fig. 23, two short rods and a short rod and long rod share the identical overlap of the excluded volume while two long rods have a large overlap of the excluded volume and therefore display greater attraction.
Colloidal membranes containing both fd-y21m (right handed) and M13Ko7 (left handed) are assembled by adding a depletant to a dilute isotropic mixture of fd-y21m and M13KO7, Sharma et al. (2014). After reaching a large enough size, membranes sediment to the bottom of the sample chambers; the constituent rods pointed in the direction, Fig. 23. At low depletant concentrations, thermal energy is sufficient to overcome the attraction between the rods of different sizes and the rods remain homogeneously mixed in the membrane. At high depletant concentrations the rod within the membrane separate into two phases: an enriched M13KO7 phase surround by an enriched fd-y21m phase. Both phases conserve the symmetry of the colloidal membrane. At intermediate concentrations, micro-phase separation is observed: colloidal rafts, highly monodisperse micrometre-sized 2D droplets enriched in fd-y21m, float in the background of M13KO7.
III.4.2 Membrane rafts
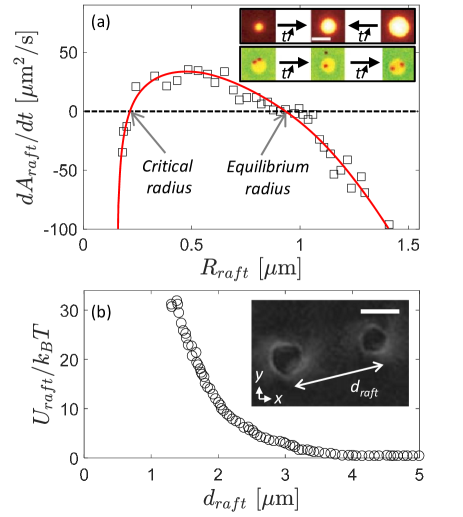
Colloidal rafts Sharma et al. (2014) do not coarsen with time, suggesting that they are equilibrium structures, Fig. 24. Particle tracking experiments show that the rods diffuse in and out of these rafts, allowing for equilibration to a preferred size. Using optical tweezers to create a raft population with heterogeneous radii, the raft growth rate is measured. Below a critical radius the rafts melt and above the rafts converge toward an equilibrium radius of 1 m.
Colloidal rafts seem similar to equilibrium clusters found in protein and colloidal dispersions Stradner et al. (2004); Segre et al. (2001); Groenewold and Kegel (2001). The stability of equilibrium clusters is attributed to the mixed potential of the particles forming the cluster. This mixed potential is composed of a short range attraction and a long range repulsion. For the colloidal rods, the attraction is due to the depletion interaction. Contrary to equilibrium cluster particles, the electrostatic interactions of the colloidal rods are fully screened and the long range repulsion is attributed to virus chirality. Two raft are indeed in a homo chiral coalescence configuration which is not propitious for merging in 2D. The raft edge twist is further transmitted by the twisted structure of the background membrane which mediates a long range elastic repulsion between rafts. This interaction is measured quantitatively by bringing two rafts close together with optical traps and tracking their trajectories upon release of the traps Sharma et al. (2014). This chiral repulsion stabilizes small rafts against an interfacial line tension that would otherwise promote coarsening to a single raft domain and establishes a preferred depletant-concentration–dependent raft size Kang and Lubensky (2017).
Those results fuel the ongoing discussion on the lipid raft which structure, properties and function constitute ongoing research Lingwood and Simons (2010); Simons and Vaz (2004); Hancock (2006); Klemm et al. (2009). These membrane raft structures have evolved from controversial detergent-resistant entities to dynamic, nanometer-sized membrane domains formed by sterols, sphingolipids, saturated glycerophospholipids, and proteins Dietrich et al. (2001); Veatch and Keller (2002); Baumgart et al. (2003); Simons and Vaz (2004); Hancock (2006). Provided that the analogy between colloidal raft and lipid raft hold, it seems that short range attraction and chirality are the essential ingredient. A systematic study of the role a chirality in colloidal rafts with respect to the chiral molecule present in lipid raft remains to be done for a more refined analogy.
IV Conclusion and perspectives
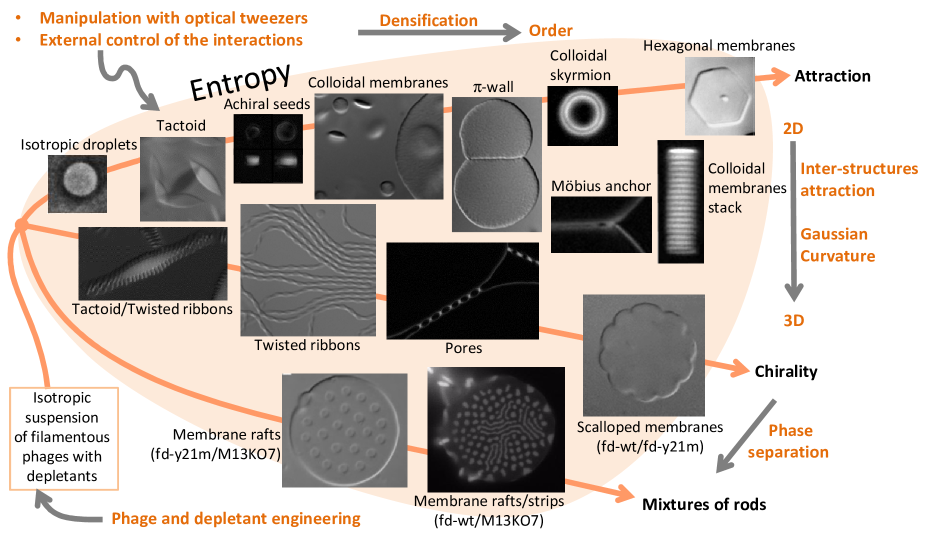
Filamentous phage such as fd-like viruses are rod-like colloids that have well defined properties such as their diameter, length, rigidity, charge and chirality. Engineering those virus leads to a library of rods with slightly different properties which can be used as building blocks for self assembly, section II. Their condensation in aqueous solution with additive depletants produces a myriad of structures ranging from isotropic/nematic droplets Modlińska et al. (2015), colloid membranes Barry and Dogic (2010); Yang et al. (2012); Barry et al. (2009b), achiral membrane seeds Kang et al. (2016), twisted ribbons Gibaud et al. (2012a), -wall Zakhary (2014), pores, colloidal skyrmions, Möbius anchors, scallop membranes Gibaud et al. (2017) to membrane rafts Sharma et al. (2014), section III. First, those structure reinforce the general notion that through a careful choice of particle shapes, sizes, and concentrations it is possible to “engineer entropy” Frenkel (2015) and build structures of ever-increasing complexity. Second, the entropy driven condensation of millions of rods in finite liquid-like objects leads to dynamic equilibrium and allows the structures to permanently rearrange and test their energy landscape. Therefore, those structures are very sensitive to externally tunable interactions like chirality and attractions which trigger shape shifting transitions. Third, external forces like optical tweezers may be utilize to manipulate those structures, probe their mechanical properties and the transition between multiple metastable polymorphic forms with complex topologies. Fourth, those structures represent a showcase of analogies between objects which belong to different fields of science such as colloidal membranes and lipid bilayers, chiral pore actuation and pores in cells, colloidal rafts and membrane rafts, colloidal skyrmions and solid state skyrmions, the twist penetration length at the edge of colloidal membranes and the penetration depth of the magnetic field in superconductor, or Möbius anchors and Möbius strips. Fifth, this experiments work combined with theoretical inputs makes it well establish field in self-assembly. Many theoretical approaches have been proposed. A de Gennes framework accompanied by appropriate surface energy terms was used to characterize colloidal membranes, twisted ribbons and -wall Tu and Pelcovits (2013a, b); Kaplan et al. (2013, 2010); Kaplan and Meyer (2014); Yang and Hagan (2011); Zakhary (2014). Sakhadande et al. adopted a continuum Ginzburg-Landau theory to study raft stability Sakhardande et al. (2016). Xie et al. considered a functional density theory constructed on the free volume theory for depletant-rod interactions, and a third order virial expansion for rod-rod interactions, with the equation of state for a hard disk system to constrain the areal rod density to study 2D colloidal membranes composed of binary mixture of rods with opposing chiralities Xie et al. (2016). Kang et al. formulated an entropically-motivated theory using three simple considerations to characterize colloidal membranes and membrane rafts stability: depletant excluded volume, rod fluctuations perpendicular to the membrane, and rod twisting as described by the Frank free energy Kang and Lubensky (2017); Kang et al. (2016). For all those reasons, fd-like phages constitute an attractive model system in soft matter physics, Fig. 25.
The subject is clearly open and many questions remain unanswered. 2D colloidal membranes do not form vesicles – would it possible with smaller viruses to reduce the lateral bending rigidity of the membranes and have them form vesicles? We have seen that chirality tends to produce 3D structures with gaussian curvature – is possible to enhance this effect to make 3D leather pouch like membranes? Raft are stabilized due to chirality – what happen to micro phase separation in homo chiral mixtures and in achiral mixutures? This review being only based on three different phages (fd-wt, fd-y21m and M13KO7) which is really far from being representative of phage diversity Rohwer (2003), there are many more structures to be discovered in such systems.
The phenomenology described in this review article should be relevant to diverse colloidal and nanosized rods that interact through excluded volume interactions. Indeed, as demonstrated in section II, fd-like viruses are an excellent experimental realization of hard rods. The challenges for applications, especially in materials science, are threefold. Firstly, it lies in the development of monodisperse rods with interactions that exclude aggregation and permits equilibrium self assembly. Secondly, it necessitate robust rods that conserve their integrity in harsh conditions. Thirdly, large scale productions is required. Progress in these directions are clearly on their way Koenderink et al. (1999); Carbone et al. (2007); Querner et al. (2008); Kuijk et al. (2014); Zhou et al. (2012) and material and bio-applications line up Mao et al. (2009); Jin et al. (2016); Farr et al. (2014); Yang et al. (2013): templates for cells growth Merzlyak et al. (2009), colourimetric sensors Oh et al. (2014), photovoltaic devices Dang et al. (2011); Chiang et al. (2012), batteries Nam et al. (2006); Lee et al. (2009); Royston et al. (2008), etc. …
Acknowledgement
I sincerely thank Zvonimir Dogic who introduces me to the subject of self-assembly and filamentous phages. Many thanks to Edward Barry, Anna Modlińska, Prerna Sharma, Andrew Ward and Mark J. Zakhary for countless hours spent together in the lab making those experiments work; to C. Nadir Kaplan, Louis Kang, Tom C. Lubensky, Robert B. Meyer, Robert A. Pelcovits, Thomas R. Powers and Hao Tu for their theoretical insight; and Seth Fraden, Eric Grelet, Pavlik Lettinga and Rudolf Oldenbourg for useful discussions.
References
- Whitesides and Grzybowski (2002) G. M. Whitesides and B. Grzybowski, Science 295, 2418 (2002).
- Philp and Stoddart (1996) D. Philp and J. F. Stoddart, Angewandte Chemie International Edition in English 35, 1154 (1996).
- Rogers et al. (2016) W. B. Rogers, W. M. Shih, and V. N. Manoharan, Nature Reviews Materials 1, 16008 (2016).
- Frenkel (2015) D. Frenkel, Nature materials 14, 9 (2015).
- Cademartiri and Bishop (2015) L. Cademartiri and K. J. Bishop, Nature materials 14, 2 (2015).
- Majewski and Yager (2016) P. W. Majewski and K. G. Yager, Journal of Physics: Condensed Matter 28, 403002 (2016).
- Drummond and Fong (1999) C. J. Drummond and C. Fong, Current opinion in colloid & interface science 4, 449 (1999).
- Poon (2004) W. Poon, Science 304, 830 (2004).
- Xia et al. (2000) Y. Xia, B. Gates, Y. Yin, and Y. Lu, Advanced Materials 12, 693 (2000).
- Glotzer (2004) S. C. Glotzer, Science 306, 419 (2004).
- Glotzer and Solomon (2007) S. C. Glotzer and M. J. Solomon, Nature materials 6, 557 (2007).
- Kraft et al. (2009) D. J. Kraft, J. Groenewold, and W. K. Kegel, Soft Matter 5, 3823 (2009).
- Manoharan et al. (2003) V. N. Manoharan, M. T. Elsesser, and D. J. Pine, Science 301, 483 (2003).
- Milliron et al. (2004) D. J. Milliron, S. M. Hughes, Y. Cui, L. Manna, J. Li, L.-W. Wang, and A. P. Alivisatos, Nature 430, 190 (2004).
- Johnson et al. (2005) P. M. Johnson, C. M. van Kats, and A. van Blaaderen, Langmuir 21, 11510 (2005).
- Malikova et al. (2002) N. Malikova, I. Pastoriza-Santos, M. Schierhorn, N. A. Kotov, and L. M. Liz-Marzán, Langmuir 18, 3694 (2002).
- Laine et al. (1998) R. M. Laine, C. Zhang, A. Sellinger, and L. Viculis, (1998).
- Rycenga et al. (2008) M. Rycenga, J. M. McLellan, and Y. Xia, Advanced Materials 20, 2416 (2008).
- Israelachvili (2011) J. N. Israelachvili, Intermolecular and surface forces (Academic press, 2011).
- Gogelein et al. (2008) C. Gogelein, G. Nagele, R. Tuinier, T. Gibaud, A. Stradner, and P. Schurtenberger, J. Chem. Phys. 8, 085102 (2008).
- van Anders et al. (2014) G. van Anders, N. K. Ahmed, R. Smith, M. Engel, and S. C. Glotzer, ACS Nano 8, 931 (2014).
- Bianchi et al. (2011) E. Bianchi, R. Blaak, and C. N. Likos, Physical Chemistry Chemical Physics 13, 6397 (2011).
- Alivisatos et al. (1996) A. P. Alivisatos, K. P. Johnsson, X. Peng, T. E. Wilson, et al., Nature 382, 609 (1996).
- Mirkin et al. (1996) C. A. Mirkin, R. L. Letsinger, R. C. Mucic, and J. J. Storhoff, Nature 382, 607 (1996).
- Milam et al. (2003) V. T. Milam, A. L. Hiddessen, J. C. Crocker, D. J. Graves, and D. A. Hammer, Langmuir 19, 10317 (2003).
- Park et al. (2008) S. Y. Park, A. K. Lytton-Jean, B. Lee, S. Weigand, G. C. Schatz, and C. A. Mirkin, Nature 451, 553 (2008).
- Hiddessen et al. (2000) A. L. Hiddessen, S. D. Rodgers, D. A. Weitz, and D. A. Hammer, Langmuir 16, 9744 (2000).
- Zhang et al. (2005) G. Zhang, D. Wang, and H. Möhwald, Nano letters 5, 143 (2005).
- Sacanna et al. (2010) S. Sacanna, W. Irvine, P. M. Chaikin, and D. J. Pine, Nature 464, 575 (2010).
- Feng et al. (2013) L. Feng, L.-L. Pontani, R. Dreyfus, P. Chaikin, and J. Brujic, Soft Matter 9, 9816 (2013).
- Poulin et al. (1997) P. Poulin, H. Stark, T. Lubensky, and D. Weitz, Science 275, 1770 (1997).
- Geerts and Eiser (2010) N. Geerts and E. Eiser, Soft Matter 6, 4647 (2010).
- Dreyfus et al. (2009) R. Dreyfus, M. E. Leunissen, R. Sha, A. V. Tkachenko, N. C. Seeman, D. J. Pine, and P. M. Chaikin, Physical review letters 102, 048301 (2009).
- Gibaud et al. (2011) T. Gibaud, F. Cardinaux, J. Bergenholtz, A. Stradner, and P. Schurtenberger, Soft Matter 7, 857 (2011).
- Löwen (2001) H. Löwen, Journal of Physics: Condensed Matter 13, R415 (2001).
- Lin et al. (2001) J. Lin, W. Zhou, A. Kumbhar, J. Wiemann, J. Fang, E. Carpenter, and C. O’Connor, Journal of Solid State Chemistry 159, 26 (2001).
- Puntes et al. (2001) V. F. Puntes, K. M. Krishnan, and P. Alivisatos, Applied Physics Letters 78, 2187 (2001).
- Leunissen et al. (2009) M. E. Leunissen, H. R. Vutukuri, and A. van Blaaderen, Advanced Materials 21, 3116 (2009).
- Liu et al. (2014) B. Liu, T. H. Besseling, M. Hermes, A. F. Demirörs, A. Imhof, and A. Van Blaaderen, Nature communications 5 (2014).
- Pusey and Van Megen (1986) P. N. Pusey and W. Van Megen, Nature 320, 340 (1986).
- Grzelczak et al. (2010) M. Grzelczak, J. Vermant, E. M. Furst, and L. M. Liz-Marzán, ACS nano 4, 3591 (2010).
- Huang et al. (2001) Y. Huang, X. Duan, Q. Wei, and C. M. Lieber, Science 291, 630 (2001).
- Xia et al. (2003) Y. Xia, Y. Yin, Y. Lu, and J. McLellan, Advanced Functional Materials 13, 907 (2003).
- Chan et al. (2004) C. S. Chan, G. De Stasio, S. A. Welch, M. Girasole, B. H. Frazer, M. V. Nesterova, S. Fakra, and J. F. Banfield, Science 303, 1656 (2004).
- Saunders et al. (2009) B. R. Saunders, N. Laajam, E. Daly, S. Teow, X. Hu, and R. Stepto, Advances in colloid and interface science 147, 251 (2009).
- Gibaud et al. (2012a) T. Gibaud, E. Barry, M. J. Zakhary, M. Henglin, A. Ward, Y. Yang, C. Berciu, R. Oldenbourg, M. F. Hagan, D. Nicastro, et al., Nature 481, 348 (2012a).
- Wan et al. (2016) L. Wan, Q. Chen, J. Liu, X. Yang, J. Huang, L. Li, X. Guo, J. Zhang, and K. Wang, Biomacromolecules 17, 1543 (2016).
- Nagpal (2002) R. Nagpal, in Proceedings of the first international joint conference on Autonomous agents and multiagent systems: part 1 (ACM, 2002) pp. 418–425.
- Salgado-Blanco and Mendoza (2015) D. Salgado-Blanco and C. I. Mendoza, Soft Matter 11, 889 (2015).
- Tanaka et al. (2006) K. Tanaka, G. H. Clever, Y. Takezawa, Y. Yamada, C. Kaul, M. Shionoya, and T. Carell, Nature nanotechnology 1, 190 (2006).
- Kotov et al. (1995) N. A. Kotov, I. Dekany, J. H. Fendler, et al., Journal of Physical Chemistry 99, 13065 (1995).
- Di Michele et al. (2013) L. Di Michele, F. Varrato, J. Kotar, S. H. Nathan, G. Foffi, and E. Eiser, Nature communications 4 (2013).
- Lopes and Jaeger (2001) W. A. Lopes and H. M. Jaeger, Nature 414, 735 (2001).
- He et al. (2008) Y. He, T. Ye, M. Su, C. Zhang, A. E. Ribbe, W. Jiang, and C. Mao, Nature 452, 198 (2008).
- Elemans et al. (2003) J. A. Elemans, A. E. Rowan, and R. J. Nolte, Journal of Materials Chemistry 13, 2661 (2003).
- Aggeli et al. (2001) A. Aggeli, I. A. Nyrkova, M. Bell, R. Harding, L. Carrick, T. C. McLeish, A. N. Semenov, and N. Boden, Proceedings of the National Academy of Sciences 98, 11857 (2001).
- Gibaud et al. (2012b) T. Gibaud, N. Mahmoudi, J. Oberdisse, P. Lindner, J. S. Pedersen, C. L. Oliveira, A. Stradner, and P. Schurtenberger, Faraday Discuss. 158, 267 (2012b).
- Nyström et al. (2017) G. Nyström, M. Arcari, and R. Mezzenga, arXiv preprint arXiv:1704.04936 (2017).
- Twort (1915) F. W. Twort, The Lancet 186, 1241 (1915).
- d’Herelle (1917) F. d’Herelle, CR Acad. Sci. Paris 165, 373 (1917).
- Mc Grath and van Sinderen (2007) S. Mc Grath and D. van Sinderen, Bacteriophage: genetics and molecular biology (Horizon Scientific Press, 2007).
- Wommack and Colwell (2000) K. E. Wommack and R. R. Colwell, Microbiology and molecular biology reviews 64, 69 (2000).
- Sulakvelidze et al. (2001) A. Sulakvelidze, Z. Alavidze, and J. G. Morris, Antimicrobial agents and chemotherapy 45, 649 (2001).
- Dogic (2016) Z. Dogic, Frontiers in Microbiology 7 (2016).
- Slonczewski and Foster (2013) J. L. Slonczewski and J. W. Foster, Microbiology: An Evolving Science: Third International Student Edition (WW Norton & Company, 2013).
- Marvin (1963) D. A. Marvin, Nature 197, 517 (1963).
- Day et al. (1988) L. A. Day, C. J. Marzee, S. A. Reisberg, and A. Casadevall, Annual review of biophysics and biophysical chemistry 17, 509 (1988).
- Sambrook et al. (1989) J. Sambrook, E. F. Fritsch, and T. Maniatis, Cold Spring Harbor, NY. VIII. Appendix A. pBIND Vector Sequence (continued) A. pBIND Vector Sequence (continued) B. pBIND Vector Restriction Sites Enzyme# of Sites Location Dra I 4, 4877 (1989).
- Unwin et al. (2015) R. R. Unwin, R. A. Cabanas, T. Yanagishima, T. R. Blower, H. Takahashi, G. P. C. Salmond, J. M. Edwardson, S. Fraden, and E. Eiser, Phys. Chem. Chem. Phys. , 8194 (2015).
- Baus et al. (2012) M. Baus, L. F. Rull, and J.-P. Ryckaert, S. Fraden in Observation, prediction and simulation of phase transitions in complex fluids, Vol. 460 (Springer Science & Business Media, 2012).
- Lekkerkerker et al. (1984) H. N. W. Lekkerkerker, P. Coulon, R. Van Der Haegen, and R. Deblieck, The Journal of chemical physics 80, 3427 (1984).
- Purdy and Fraden (2004) K. R. Purdy and S. Fraden, Physical Review E 70, 061703 (2004).
- Barry et al. (2009a) E. Barry, D. Beller, and Z. Dogic, Soft Matter 5, 2563 (2009a).
- Sharma et al. (2014) P. Sharma, A. Ward, T. Gibaud, M. F. Hagan, and Z. Dogic, Nature 513, 77 (2014).
- Zimmermann et al. (1986) K. Zimmermann, H. Hagedorn, C. C. Heuck, M. Hinrichsen, and H. Ludwig, Journal of Biological Chemistry 261, 1653 (1986).
- Newman et al. (1977) J. Newman, H. L. Swinney, and L. A. Day, Journal of molecular biology 116, 593 (1977).
- Bhattacharjee et al. (1992) S. Bhattacharjee, M. Glucksman, and L. Makowski, Biophysical journal 61, 725 (1992).
- Onsager (1949) L. Onsager, Annals of the New York Academy of Sciences 51, 627 (1949).
- Frenkel (1994) D. Frenkel, Journal of Physics: Condensed Matter 6, A71 (1994).
- Dogic et al. (2014) Z. Dogic, P. Sharma, and M. J. Zakhary, Annu. Rev. Condens. Matter Phys. 5, 137 (2014).
- Dogic and Fraden (2000) Z. Dogic and S. Fraden, Langmuir 16, 7820 (2000).
- Dogic and Fraden (2006) Z. Dogic and S. Fraden, Current opinion in colloid & interface science 11, 47 (2006).
- Grelet and Fraden (2003) E. Grelet and S. Fraden, Physical review letters 90, 198302 (2003).
- Tombolato et al. (2006) F. Tombolato, A. Ferrarini, and E. Grelet, Physical review letters 96, 258302 (2006).
- Dussi et al. (2015) S. Dussi, S. Belli, R. van Roij, and M. Dijkstra, The Journal of chemical physics 142, 074905 (2015).
- Maguire et al. (1980) J. Maguire, J.-P. McTague, and F. Rondelez, Physical Review Letters 45, 1891 (1980).
- Dogic and Fraden (2001) Z. Dogic and S. Fraden, Philosophical Transactions of the Royal Society of London A: Mathematical, Physical and Engineering Sciences 359, 997 (2001).
- Purdy and Fraden (2007) K. R. Purdy and S. Fraden, Physical Review E 76, 011705 (2007).
- Herrmann et al. (1980) R. Herrmann, K. Neugebauer, E. Pirkl, H. Zentgraf, and H. Schaller, Molecular and General Genetics MGG 177, 231 (1980).
- Specthrie et al. (1992) L. Specthrie, E. Bullitt, K. Horiuchi, P. Model, M. Russel, and L. Makowski, Journal of molecular biology 228, 720 (1992).
- Marchi et al. (2014) A. N. Marchi, I. Saaem, B. N. Vogen, S. Brown, and T. H. LaBean, Nano letters 14, 5740 (2014).
- Brown et al. (2015) S. Brown, J. Majikes, A. Martínez, T. Girón, H. Fennell, E. Samano, and T. LaBean, Nanoscale 7, 16621 (2015).
- Sattar et al. (2015) S. Sattar, N. J. Bennett, W. X. Wen, J. M. Guthrie, L. F. Blackwell, J. F. Conway, and J. Rakonjac, Frontiers in microbiology 6 (2015).
- Zimmerman et al. (1986) K. Zimmerman, H. Hagedorn, C. Heuck, M. Hinrichsen, and H. Ludwig, J Biol Chem 261, 1653 (1986).
- Grelet and Rana (2016) E. Grelet and R. Rana, Soft matter 12, 4621 (2016).
- Pouget and Grelet (2013) E. Pouget and E. Grelet, Langmuir 29, 8010 (2013).
- Zhang et al. (2009) Z. Zhang, N. Krishna, M. P. Lettinga, J. Vermant, and E. Grelet, Langmuir 25, 2437 (2009).
- Ruff et al. (2016) Z. Ruff, S. H. Nathan, R. R. Unwin, M. Zupkauskas, D. Joshi, G. P. Salmond, C. P. Grey, and E. Eiser, Faraday discussions 186, 473 (2016).
- Montalvan-Sorrosa et al. (2014) D. Montalvan-Sorrosa, J. González-Solis, J. Mas-Oliva, and R. Castillo, RSC Advances 4, 57329 (2014).
- Szot-Karpinska et al. (2016) K. Szot-Karpinska, P. Golec, A. Lesniewski, B. Palys, F. Marken, J. Niedziolka-Jonsson, G. Wgrzyn, and M. Los, Bioconjugate Chemistry (2016).
- Zhang and Grelet (2013) Z. Zhang and E. Grelet, Soft Matter 9, 1015 (2013).
- Abramov et al. (2017) G. Abramov, R. Shaharabani, O. Morag, R. Avinery, A. Haimovich, I. Oz, R. Beck, and A. Goldbourt, Biomacromolecules (2017).
- Marvin et al. (1994) D. Marvin, R. Hale, C. Nave, and M. H. Citterich, Journal of molecular biology 235, 260 (1994).
- Rowitch et al. (1988) D. H. Rowitch, G. J. Hunter, and R. N. Perham, Journal of molecular biology 204, 663 (1988).
- Hunter et al. (1987) G. J. Hunter, D. H. Rowitch, and R. N. Perham, Nature 327, 252 (1987).
- Whaley et al. (2000) S. R. Whaley, D. S. English, E. L. Hu, P. F. Barbara, and A. M. Belcher, Nature 405, 665 (2000).
- Lee et al. (2002) S.-W. Lee, C. Mao, C. E. Flynn, and A. M. Belcher, Science 296, 892 (2002).
- Huang et al. (2009) F. Huang, K. Addas, A. Ward, N. Flynn, E. Velasco, M. Hagan, Z. Dogic, and S. Fraden, Physical review letters 102, 108302 (2009).
- Nam et al. (2004) K. T. Nam, B. R. Peelle, S.-W. Lee, and A. M. Belcher, Nano letters 4, 23 (2004).
- Asakura and Oosawa (1954) S. Asakura and F. Oosawa, The Journal of Chemical Physics 22, 1255 (1954).
- Dogic et al. (2004) Z. Dogic, K. R. Purdy, E. Grelet, M. Adams, and S. Fraden, Phys. Rev. E 69, 051702 (2004).
- Yang et al. (2012) Y. Yang, E. Barry, Z. Dogic, and M. F. Hagan, Soft Matter 8, 707 (2012).
- Matsuyama and Kato (2001) A. Matsuyama and T. Kato, The European Physical Journal E: Soft Matter and Biological Physics 6, 15 (2001).
- Ichinose et al. (2004) I. Ichinose, K. Kurashima, and T. Kunitake, Journal of the American Chemical Society 126, 7162 (2004), pMID: 15186138.
- Davidson (2010) P. Davidson, Comptes Rendus Chimie 13, 142 (2010).
- Kaznacheev et al. (2002) A. Kaznacheev, M. Bogdanov, and S. Taraskin, Journal of Experimental and Theoretical Physics 95, 57 (2002).
- Tortora and Lavrentovich (2011) L. Tortora and O. D. Lavrentovich, Proceedings of the National Academy of Sciences 108, 5163 (2011).
- Jeong et al. (2014) J. Jeong, Z. S. Davidson, P. J. Collings, T. C. Lubensky, and A. Yodh, Proceedings of the National Academy of Sciences 111, 1742 (2014).
- Bunning et al. (2000) T. J. Bunning, L. V. Natarajan, V. P. Tondiglia, and R. Sutherland, Annual Review of Materials Science 30, 83 (2000).
- Joannopoulos et al. (2011) J. D. Joannopoulos, S. G. Johnson, J. N. Winn, and R. D. Meade, Photonic crystals: molding the flow of light (Princeton university press, 2011).
- Modlińska et al. (2015) A. Modlińska, A. M. Alsayed, and T. Gibaud, Scientific reports 5 (2015).
- Still et al. (2013) T. Still, K. Chen, A. M. Alsayed, K. B. Aptowicz, and A. Yodh, Journal of colloid and interface science 405, 96 (2013).
- ten Wolde and Frenkel (1997) P. R. ten Wolde and D. Frenkel, Science 277, 1975 (1997).
- Barry and Dogic (2010) E. Barry and Z. Dogic, Proceedings of the National Academy of Sciences 107, 10348 (2010).
- Nagle and Scott (1978) J. Nagle and H. Scott, Biochimica et Biophysica Acta (BBA)-Biomembranes 513, 236 (1978).
- Needham and Nunn (1990) D. Needham and R. S. Nunn, Biophysical journal 58, 997 (1990).
- Evans and Rawicz (1990) E. Evans and W. Rawicz, Physical Review Letters 64, 2094 (1990).
- Evans and Needham (1987) E. Evans and D. Needham, J. phys. Chem 91, 4219 (1987).
- Rawicz et al. (2000) W. Rawicz, K. Olbrich, T. McIntosh, D. Needham, and E. Evans, Biophysical journal 79, 328 (2000).
- Helfrich (1978) W. Helfrich, Zeitschrift für Naturforschung A 33, 305 (1978).
- Goetz et al. (1999) R. Goetz, G. Gompper, and R. Lipowsky, Physical Review Letters 82, 221 (1999).
- Israelachvili and Wennerstrom (1996) J. Israelachvili and H. Wennerstrom, Nature 379, 219 (1996).
- Lipowsky and Grotehans (1993) R. Lipowsky and S. Grotehans, Europhysics Letters 23, 599 (1993).
- Gelbart et al. (2012) W. M. Gelbart, A. Ben-Shaul, and D. Roux, Micelles, membranes, microemulsions, and monolayers (Springer Science & Business Media, 2012).
- Feller and Pastor (1999) S. E. Feller and R. W. Pastor, The Journal of chemical physics 111, 1281 (1999).
- Evans (1974) E. A. Evans, Biophysical journal 14, 923 (1974).
- Bermúdez et al. (2004) H. Bermúdez, D. A. Hammer, and D. E. Discher, Langmuir 20, 540 (2004).
- Marchand et al. (2011) A. Marchand, J. H. Weijs, J. H. Snoeijer, and B. Andreotti, American Journal of Physics 79, 999 (2011).
- Oldenbourg and Mei (1995) R. Oldenbourg and G. Mei, Journal of microscopy 180, 140 (1995).
- Mastronarde (2005) D. N. Mastronarde, Journal of structural biology 152, 36 (2005).
- Kremer et al. (1996) J. R. Kremer, D. N. Mastronarde, and J. R. McIntosh, Journal of structural biology 116, 71 (1996).
- Oldenbourg (2008) R. Oldenbourg, Journal of microscopy 231, 419 (2008).
- Jia et al. (2016) L. L. Jia, M. J. Zakhary, Z. Dogic, R. A. Pelcovits, and T. R. Powers, arXiv preprint arXiv:1612.03244 (2016).
- Kang et al. (2016) L. Kang, T. Gibaud, Z. Dogic, and T. Lubensky, Soft matter 12, 386 (2016).
- Fradin et al. (2000) C. Fradin, A. Braslau, D. Luzet, D. Smilgies, M. Alba, N. Boudet, K. Mecke, and J. Daillant, Nature 403, 871 (2000).
- Safran (1994) S. A. Safran, Statistical thermodynamics of surfaces, interfaces, and membranes, Vol. 90 (Perseus Books, 1994).
- Aarts et al. (2004) D. G. Aarts, M. Schmidt, and H. N. Lekkerkerker, Science 304, 847 (2004).
- de Gennes (1972) P. G. de Gennes, Solid State Communications 10, 753 (1972).
- Renn and Lubensky (1988) S. R. Renn and T. C. Lubensky, Physical Review A 38, 2132 (1988).
- Kamien and Selinger (2001) R. D. Kamien and J. V. Selinger, Journal of Physics: Condensed Matter 13, R1 (2001).
- Hough et al. (2009a) L. Hough, H.-T. Jung, D. Krüerke, M. Heberling, M. Nakata, C. Jones, D. Chen, D. R. Link, J. Zasadzinski, G. Heppke, et al., Science 325, 456 (2009a).
- Helfrich and Prost (1988) W. Helfrich and J. Prost, Physical Review A 38, 3065 (1988).
- Efrati and Irvine (2014) E. Efrati and W. T. Irvine, Physical Review X 4, 011003 (2014).
- Zastavker et al. (1999) Y. V. Zastavker, N. Asherie, A. Lomakin, J. Pande, J. M. Donovan, J. M. Schnur, and G. B. Benedek, Proceedings of the National Academy of Sciences 96, 7883 (1999).
- Matsumoto et al. (2009) E. A. Matsumoto, G. P. Alexander, and R. D. Kamien, Physical review letters 103, 257804 (2009).
- Marini et al. (2002) D. M. Marini, W. Hwang, D. A. Lauffenburger, S. Zhang, and R. D. Kamm, Nano Letters 2, 295 (2002).
- Zhang et al. (2002) S. Zhang, D. M. Marini, W. Hwang, and S. Santoso, Current opinion in chemical biology 6, 865 (2002).
- Srivastava et al. (2010) S. Srivastava, A. Santos, K. Critchley, K.-S. Kim, P. Podsiadlo, K. Sun, J. Lee, C. Xu, G. D. Lilly, S. C. Glotzer, et al., Science 327, 1355 (2010).
- Lashuel et al. (2000) H. A. Lashuel, S. R. LaBrenz, L. Woo, L. C. Serpell, and J. W. Kelly, Journal of the American Chemical Society 122, 5262 (2000).
- Zakhary (2014) M. J. Zakhary, The influence of the membrane-polymer interface on colloidal membrane dynamics and phase behavior (Brandeis University, 2014).
- Aarts et al. (2005) D. G. Aarts, H. N. Lekkerkerker, H. Guo, G. H. Wegdam, and D. Bonn, Physical review letters 95, 164503 (2005).
- Aarts and Lekkerkerker (2008) D. G. Aarts and H. N. Lekkerkerker, Journal of fluid mechanics 606, 275 (2008).
- Paulsen et al. (2012) J. D. Paulsen, J. C. Burton, S. R. Nagel, S. Appathurai, M. T. Harris, and O. A. Basaran, Proceedings of the National Academy of Sciences 109, 6857 (2012).
- Paulsen et al. (2011) J. D. Paulsen, J. C. Burton, and S. R. Nagel, Physical Review Letters 106, 114501 (2011).
- Sundararaj et al. (1995) U. Sundararaj, C. Macosko, et al., Macromolecules 28, 2647 (1995).
- Loudet et al. (2000) J.-C. Loudet, P. Barois, and P. Poulin, Nature 407, 611 (2000).
- Chernomordik and Kozlov (2008) L. V. Chernomordik and M. M. Kozlov, Nature structural & molecular biology 15, 675 (2008).
- Haluska et al. (2006) C. K. Haluska, K. A. Riske, V. Marchi-Artzner, J.-M. Lehn, R. Lipowsky, and R. Dimova, Proceedings of the National Academy of Sciences 103, 15841 (2006).
- Jahn and Südhof (1999) R. Jahn and T. C. Südhof, Annual review of biochemistry 68, 863 (1999).
- Shillcock and Lipowsky (2005) J. C. Shillcock and R. Lipowsky, Nature materials 4, 225 (2005).
- Terrones et al. (2000) M. Terrones, H. Terrones, F. Banhart, J.-C. Charlier, and P. Ajayan, Science 288, 1226 (2000).
- Goodby et al. (1994) J. Goodby, A. Slaney, C. Booth, I. Nishiyama, J. Vuijk, P. Styring, and K. Toyne, Molecular Crystals and Liquid Crystals 243, 231 (1994).
- Zakhary et al. (2014) M. J. Zakhary, T. Gibaud, C. N. Kaplan, E. Barry, R. Oldenbourg, R. B. Meyer, and Z. Dogic, Nature communications 5, 3063 (2014).
- Gibaud et al. (2017) T. Gibaud, C. N. Kaplan, P. Sharma, M. J. Zakhary, A. Ward, R. Oldenbourg, R. B. Meyer, R. D. Kamien, T. R. Powers, and Z. Dogic, Proceedings of the National Academy of Sciences , 201617043 (2017).
- Suntharalingam and Wente (2003) M. Suntharalingam and S. R. Wente, Developmental cell 4, 775 (2003).
- Tran and Wente (2006) E. J. Tran and S. R. Wente, Cell 125, 1041 (2006).
- Ackerman et al. (2012) P. J. Ackerman, Z. Qi, Y. Lin, C. W. Twombly, M. J. Laviada, Y. Lansac, and I. I. Smalyukh, Scientific reports 2, 414 (2012).
- Honglawan et al. (2013) A. Honglawan, D. A. Beller, M. Cavallaro, R. D. Kamien, K. J. Stebe, and S. Yang, Proceedings of the National Academy of Sciences 110, 34 (2013).
- Yoon et al. (2007) D. K. Yoon, M. Choi, Y. H. Kim, M. W. Kim, O. D. Lavrentovich, and H.-T. Jung, Nature materials 6, 866 (2007).
- Tkalec et al. (2011) U. Tkalec, M. Ravnik, S. Čopar, S. Žumer, and I. Muševič, Science 333, 62 (2011).
- Goldstein et al. (2010) R. E. Goldstein, H. K. Moffatt, A. I. Pesci, and R. L. Ricca, Proceedings of the National Academy of Sciences 107, 21979 (2010).
- Fukuda and Žumer (2011) J.-i. Fukuda and S. Žumer, Nature communications 2, 246 (2011).
- Mühlbauer et al. (2009) S. Mühlbauer, B. Binz, F. Jonietz, C. Pfleiderer, A. Rosch, A. Neubauer, R. Georgii, and P. Böni, Science 323, 915 (2009).
- Brey et al. (1995) L. Brey, H. Fertig, R. Côté, and A. MacDonald, Physical review letters 75, 2562 (1995).
- Tonomura et al. (2012) A. Tonomura, X. Yu, K. Yanagisawa, T. Matsuda, Y. Onose, N. Kanazawa, H. S. Park, and Y. Tokura, Nano letters 12, 1673 (2012).
- Ravnik et al. (2011) M. Ravnik, G. P. Alexander, J. M. Yeomans, and S. Žumer, Proceedings of the National Academy of Sciences 108, 5188 (2011).
- Skyrme (1962) T. H. R. Skyrme, Nuclear Physics 31, 556 (1962).
- Nagaosa and Tokura (2013) N. Nagaosa and Y. Tokura, Nature nanotechnology 8, 899 (2013).
- Grigoriev et al. (2007) S. Grigoriev, V. Dyadkin, D. Menzel, J. Schoenes, Y. O. Chetverikov, A. Okorokov, H. Eckerlebe, and S. Maleyev, Physical Review B 76, 224424 (2007).
- Grigoriev et al. (2009) S. Grigoriev, D. Chernyshov, V. Dyadkin, V. Dmitriev, S. Maleyev, E. Moskvin, D. Menzel, J. Schoenes, and H. Eckerlebe, Physical Review Letters 102, 037204 (2009).
- Yu et al. (2010) X. Yu, Y. Onose, N. Kanazawa, J. Park, J. Han, Y. Matsui, N. Nagaosa, and Y. Tokura, Nature 465, 901 (2010).
- Bogdanov et al. (2003) A. Bogdanov, U. Rößler, and A. Shestakov, Physical Review E 67, 016602 (2003).
- Ackerman et al. (2014) P. J. Ackerman, R. P. Trivedi, B. Senyuk, J. van de Lagemaat, and I. I. Smalyukh, Physical Review E 90, 012505 (2014).
- Smalyukh et al. (2010) I. I. Smalyukh, Y. Lansac, N. A. Clark, and R. P. Trivedi, Nature materials 9, 139 (2010).
- Hornreich and Shtrikman (1989) R. Hornreich and S. Shtrikman, Liquid Crystals 5, 777 (1989).
- Heppke et al. (1989) G. Heppke, B. Jerome, H. Kitzerow, and P. Pieranski, Liquid Crystals 5, 813 (1989).
- Tu and Pelcovits (2013a) H. Tu and R. A. Pelcovits, Physical Review E 87, 032504 (2013a).
- Kaplan et al. (2013) C. N. Kaplan, T. Gibaud, and R. B. Meyer, Soft Matter 9, 8210 (2013).
- Hu et al. (2012) M. Hu, J. J. Briguglio, and M. Deserno, Biophysical journal 102, 1403 (2012).
- Siegel and Kozlov (2004) D. P. Siegel and M. Kozlov, Biophysical journal 87, 366 (2004).
- Semrau et al. (2008) S. Semrau, T. Idema, L. Holtzer, T. Schmidt, and C. Storm, Physical review letters 100, 088101 (2008).
- Baumgart et al. (2005) T. Baumgart, S. Das, W. Webb, and J. Jenkins, Biophysical journal 89, 1067 (2005).
- Cerda and Mahadevan (2003) E. Cerda and L. Mahadevan, Physical review letters 90, 074302 (2003).
- Leocmach et al. (2015) M. Leocmach, M. Nespoulous, S. Manneville, and T. Gibaud, Science advances 1, e1500608 (2015).
- King et al. (2012) H. King, R. D. Schroll, B. Davidovitch, and N. Menon, Proceedings of the National Academy of Sciences 109, 9716 (2012).
- Pocivavsek et al. (2008) L. Pocivavsek, R. Dellsy, A. Kern, S. Johnson, B. Lin, K. Y. C. Lee, and E. Cerda, Science 320, 912 (2008).
- Link et al. (1997) D. R. Link, G. Natale, R. Shao, J. E. Maclennan, N. A. Clark, E. Körblova, and D. M. Walba, Science 278, 1924 (1997).
- Jeong et al. (2015) J. Jeong, L. Kang, Z. S. Davidson, P. J. Collings, T. C. Lubensky, and A. Yodh, Proceedings of the National Academy of Sciences 112, E1837 (2015).
- Hough et al. (2009b) L. Hough, M. Spannuth, M. Nakata, D. Coleman, C. Jones, G. Dantlgraber, C. Tschierske, J. Watanabe, E. Körblova, D. Walba, et al., Science 325, 452 (2009b).
- Żywociński et al. (2005) A. Żywociński, K. Pawlak, R. Hołyst, and P. Oswald, The Journal of Physical Chemistry B 109, 9712 (2005).
- Kang and Lubensky (2017) L. Kang and T. C. Lubensky, Proceedings of the National Academy of Sciences 114, E19 (2017).
- Stradner et al. (2004) A. Stradner, H. Sedgwick, F. Cardinaux, W. C. Poon, S. U. Egelhaaf, and P. Schurtenberger, Nature 432, 492 (2004).
- Segre et al. (2001) P. Segre, V. Prasad, A. Schofield, and D. Weitz, Physical Review Letters 86, 6042 (2001).
- Groenewold and Kegel (2001) J. Groenewold and W. K. Kegel, The Journal of Physical Chemistry B 105, 11702 (2001).
- Lingwood and Simons (2010) D. Lingwood and K. Simons, science 327, 46 (2010).
- Simons and Vaz (2004) K. Simons and W. L. Vaz, Annu. Rev. Biophys. Biomol. Struct. 33, 269 (2004).
- Hancock (2006) J. F. Hancock, Nature Reviews Molecular Cell Biology 7, 456 (2006).
- Klemm et al. (2009) R. W. Klemm, C. S. Ejsing, M. A. Surma, H.-J. Kaiser, M. J. Gerl, J. L. Sampaio, Q. de Robillard, C. Ferguson, T. J. Proszynski, A. Shevchenko, et al., The Journal of cell biology 185, 601 (2009).
- Dietrich et al. (2001) C. Dietrich, L. Bagatolli, Z. Volovyk, N. Thompson, M. Levi, K. Jacobson, and E. Gratton, Biophysical journal 80, 1417 (2001).
- Veatch and Keller (2002) S. L. Veatch and S. L. Keller, Physical Review Letters 89, 268101 (2002).
- Baumgart et al. (2003) T. Baumgart, S. T. Hess, and W. W. Webb, Nature 425, 821 (2003).
- Barry et al. (2009b) E. Barry, Z. Dogic, R. B. Meyer, R. A. Pelcovits, and R. Oldenbourg, The journal of physical chemistry. B 113, 3910 (2009b).
- Tu and Pelcovits (2013b) H. Tu and R. A. Pelcovits, Physical Review E 87, 042505 (2013b).
- Kaplan et al. (2010) C. N. Kaplan, H. Tu, R. A. Pelcovits, and R. B. Meyer, Physical Review E 82, 021701 (2010).
- Kaplan and Meyer (2014) C. N. Kaplan and R. B. Meyer, Soft Matter , DOI (2014).
- Yang and Hagan (2011) Y. Yang and M. F. Hagan, Phys. Rev. E 84, 051402 (2011).
- Sakhardande et al. (2016) R. Sakhardande, S. Stanojeviea, A. Baskaran, A. Baskaran, M. F. Hagan, and B. Chakraborty, arXiv preprint arXiv:1604.03012 (2016).
- Xie et al. (2016) S. Xie, M. F. Hagan, and R. A. Pelcovits, Physical Review E 93, 032706 (2016).
- Rohwer (2003) F. Rohwer, Cell 113, 141 (2003).
- Koenderink et al. (1999) G. Koenderink, G. Vliegenthart, S. Kluijtmans, A. Van Blaaderen, A. Philipse, and H. Lekkerkerker, Langmuir 15, 4693 (1999).
- Carbone et al. (2007) L. Carbone, C. Nobile, M. De Giorgi, F. D. Sala, G. Morello, P. Pompa, M. Hytch, E. Snoeck, A. Fiore, I. R. Franchini, et al., Nano letters 7, 2942 (2007).
- Querner et al. (2008) C. Querner, M. D. Fischbein, P. A. Heiney, and M. Drndić, Advanced Materials 20, 2308 (2008).
- Kuijk et al. (2014) A. Kuijk, A. Imhof, M. H. Verkuijlen, T. H. Besseling, E. R. van Eck, and A. van Blaaderen, Particle & Particle Systems Characterization 31, 706 (2014).
- Zhou et al. (2012) J. C. Zhou, C. M. Soto, M.-S. Chen, M. A. Bruckman, M. H. Moore, E. Barry, B. R. Ratna, P. E. Pehrsson, B. R. Spies, and T. S. Confer, Journal of nanobiotechnology 10, 1 (2012).
- Mao et al. (2009) C. Mao, A. Liu, and B. Cao, Angewandte Chemie International Edition 48, 6790 (2009).
- Jin et al. (2016) H. E. Jin, W. J. Chung, M. Sena, A. Merzlyak, and S. W. Lee, Virotronics: Viruses as Tools for Functional Nanomaterials Design. Comprehensive Biomaterials II, 2nd edition (Elsevier, 2016).
- Farr et al. (2014) R. Farr, D. S. Choi, and S.-W. Lee, Acta biomaterialia 10, 1741 (2014).
- Yang et al. (2013) S. H. Yang, W.-J. Chung, S. McFarland, and S.-W. Lee, The Chemical Record 13, 43 (2013).
- Merzlyak et al. (2009) A. Merzlyak, S. Indrakanti, and S.-W. Lee, Nano letters 9, 846 (2009).
- Oh et al. (2014) J.-W. Oh, W.-J. Chung, K. Heo, H.-E. Jin, B. Y. Lee, E. Wang, C. Zueger, W. Wong, J. Meyer, C. Kim, et al., Nature communications 5 (2014).
- Dang et al. (2011) X. Dang, H. Yi, M.-H. Ham, J. Qi, D. S. Yun, R. Ladewski, M. S. Strano, P. T. Hammond, and A. M. Belcher, Nature Nanotechnology 6, 377 (2011).
- Chiang et al. (2012) C.-Y. Chiang, J. Epstein, A. Brown, J. N. Munday, J. N. Culver, and S. Ehrman, Nano letters 12, 6005 (2012).
- Nam et al. (2006) K. T. Nam, D.-W. Kim, P. J. Yoo, C.-Y. Chiang, N. Meethong, P. T. Hammond, Y.-M. Chiang, and A. M. Belcher, science 312, 885 (2006).
- Lee et al. (2009) Y. J. Lee, H. Yi, W.-J. Kim, K. Kang, D. S. Yun, M. S. Strano, G. Ceder, and A. M. Belcher, Science 324, 1051 (2009).
- Royston et al. (2008) E. Royston, A. Ghosh, P. Kofinas, M. T. Harris, and J. N. Culver, Langmuir 24, 906 (2008).