12C/13C isotopic ratios in red-giant stars of the open cluster NGC 6791
Abstract
Carbon isotope ratios, along with carbon and nitrogen abundances, are derived in a sample of 11 red-giant members of one of the most metal-rich clusters in the Milky Way, NGC 6791. The selected red-giants have a mean metallicity and standard deviation of [Fe/H]=+0.390.06 (Cunha et al. 2015). We used high resolution H-band spectra obtained by the SDSS-IV Apache Point Observatory Galactic Evolution Experiment (APOGEE). The advantage of using high-resolution spectra in the H-band is that lines of CO are well represented and their line profiles are sensitive to the variation of 12C/13C. Values of the 12C/13C ratio were obtained from a spectrum synthesis analysis. The derived 12C/13C ratios varied between 6.3 and 10.6 in NGC 6791, in agreement with the final isotopic ratios from thermohaline-induced mixing models. The ratios derived here are combined with those obtained for more metal poor red-giants from the literature to examine the correlation between 12C/13C, mass, metallicity and evolutionary status.
keywords:
stars: low-mass – stars: late-type – stars: abundances – stars: evolution1 Introduction
Over the last decade, large surveys (“big data”) in astronomy have advanced significantly our understanding of the structure of the Milky Way. The currently operating high-resolution spectroscopic surveys, Gaia-ESO (Gilmore et al., 2012), GALAH (Martell et al., 2017), APOGEE (Majewski et al., 2017; Blanton et al., 2017), and low-resolution survey, LAMOST (Xiang et al., 2017) are mapping the chemical composition of the Milky Way using different wavelength regions and somewhat different spectral resolutions.
The Apache Point Observatory Galactic Evolution Experiment (APOGEE) was one component of the phase of the Sloan Digital Sky Survey (SDSS-III; (Eisenstein et al., 2011)) and continues as part of SDSSIV. The goal of APOGEE is to obtain high-resolution (R = 22500), high signal-to-noise, H-band spectra ( = 1.511.69m) of nearly 500,000 (mostly) red-giant stars in the Milky Way by the end of 2020, and to determine chemical abundances of as many as 23 elements in these stars111http://www.sdss.org/dr13/irspec/. Majority of APOGEE targets are evolved red-giant branch (RGB), red clump (RC), or asymptotic giant branch (AGB) stars from all major Galactic stellar populations. APOGEE is unique amongst the current high-resolution spectroscopic surveys because it observes in the near infrared and uses telescopes (Bowen & Vaughan, 1973; Gunn et al., 2006) in both the Northern and Southern hemispheres222http://www.sdss.org/surveys/apogee-2/. The APOGEE data reduction Pipeline (ASPCAP) (Zamora et al., 2015; Nidever et al., 2015; García Pérez et al., 2016) produces one-dimensional, wavelength and flux calibrated spectra, corrected for terrestrial airglow lines, and telluric absorption lines. The reduced spectra are then analysed via the APOGEE Stellar Parameters and Chemical Abundance Pipeline (García Pérez et al., 2016) to determine both fundamental stellar parameters, as well as detailed chemical abundances. The current version of ASPCAP does not measure 12C/13C ratios but these are, measurable from CO and CN lines in the observed spectral window, and carry important information about stellar nucleosynthesis and mixing processes along the RGB and AGB. Future versions of ASPCAP are being modified to derive carbon isotope ratios; however, in this study manual determinations of 12C/13C ratios are presented for RGB and RC members of the old, metal-rich cluster NGC 6791, which are used to both probe stellar evolution, nucleosynthesis, and mixing, as well as providing results which will be used to provide checks for future ASPCAP-derived values of 12C/13C.
During stellar evolution on the main sequence, the surface carbon isotopic ratio represents the composition of the interstellar cloud from which the star formed, which is high, e.g., 12C/13C= 89 for the Sun (Asplund et al., 2009). When a low-mass star evolves to the base of the RGB, the outer convective envelope reaches its greatest extent in mass and penetrates into layers where the chemical composition has been partially altered by H-burning on the CN cycle. Convection brings this material to the stellar surface, where the effects of CN-cycle proton-captures can be observed spectroscopically, e.g., a somewhat lower ratio of C/N, along with a significantly lower ratio of 12C/13C. This phase of stellar evolution is referred to as the first dredge-up (Iben, 1965). Standard stellar evolution models for stars with a mass near that of the Sun predict that the 12C/13C ratio decreases to a value of 29 (from an initial value of 89) (Charbonnel, 1994). Carbon and Nitrogen surface abundances are not predicted to change after the first dredge- up in standard model. However, observations show that this is not the case (e.g. Charbonnel et al., 1998; Gratton et al., 2000; Shetrone, 2003b; Recio-Blanco & de Laverny, 2007; Mikolaitis et al., 2012; Tautvaišienė et al., 2015; Tautvaisiene et al., 2016): the abundance of carbon decreases and the abundance of nitrogen increases further as the star climbs the RGB. In order to explain the observations, one requires non-canonical extra mixing. Several mechanisms have been suggested (Tautvaisiene et al., 2016)[and references therein], but in recent years thermohaline mixing (Charbonnel & Lagarde, 2010) has emerged as a leading theory that can explain many of the observations.
Thermohaline mixing was first used in a stellar context by Stothers&Simon (1969). In red giants, the instability is triggered by the molecular weight inversion (Ulrich, 1972), created by the reaction (Charbonnel & Zahn, 2007), when the star reaches the so called luminosity bump (Iben, 1968; King et al., 1985). The reaction starts in the external wing of the hydrogen burning shell when the shell crosses the molecular weight barrier left behind by the dredge up. When the begins to burn, the local mean molecular weight decreases and the temperature becomes higher than its surroundings. Due to the change from two initial to three final particles, the cell expands to establish pressure equilibrium. The expansion reduces the density and the whole cell rises until the external density and pressure become equal to the internal state (Charbonnel & Lagarde, 2010). There will also be a thermal gradient between the bubble and the surroundings. When the temperature and molecular weight gradient build up, they trigger the mixing. Heat begins to diffuse into the bubble faster than the particles, which takes the form of "long fingers". These fingers sink because they are heavier than the environment until they become turbulent and dissolve. Thermohaline mixing is one possible source of changes in surface abundances observed in Li, 12C, 13C, and 14N among luminous RGB stars. The prescription for this mechanism used in current stellar models are however very simplistic. They are currently being challenged by hydrodynamical 2D and 3D simulations which are still far from reaching the actual conditions relevant to stellar interiors (e.g. Traxler et al., 2011; Brown et al., 2013; Wachlin et al., 2014) In this context, it is crucial to determine the abundances of the above mentioned chemical elements in homogeneous stellar samples with good evolution constraints as is the case in open clusters.
Previous studies in the literature determined 12C/13C ratios in stars close to solar metallicity (e.g. Gilroy et al., 1989; Gilroy & Brown, 1991; Tautvaišiene et al., 2000; Shetrone, 2003a; Tautvaišienė et al., 2005; Smiljanic et al., 2009; Mikolaitis et al., 2010, 2011a, 2011b, 2012; Santrich et al., 2013; Tautvaisiene et al., 2016; Drazdauskas et al., 2016a, b). Parts of the H-band spectra are sensitive to the variation of 12C/13C ratio, and the APOGEE survey allows us to derive its value for a broad metallicity range above [Fe/H] 0.6. The most metal-rich stars previously observed were in NGC 6253 (Mikolaitis et al., 2012) with metallicities of [Fe/H] +0.46 dex. We derived 12C/13C ratios from spectra of the most metal-rich stars available in the APOGEE data base, those in NGC 6791, in order to investigate the behavior of the carbon isotopic ratio in the atmospheres of high-metallicity stars.
2 Data and Methods
2.1 Targets Analysed
Red-giants in NGC 6791, one of the most metal-rich open clusters in the Milky Way, are ideal targets for the examination of extra mixing in a high-metallicity regime. This open cluster has a mean metallicity of [Fe/H] = +0.39 (A(Fe)Sun=7.45), as derived in the previous APOGEE study of red-giants from a manual abundance analysis of sodium and oxygen by (Cunha et al., 2015). Recent studies (e.g. Ness et al., 2017; Linden et al., 2017) have different metallicities but we used the value from Cunha et al. (2015) because of the consistency. This cluster has an age of 8 Gyr and it is the youngest one in the -rich thick disc or bulge population (Linden et al., 2017).
In this study, we analyse the same 11 evolved stars selected by Cunha et al. (2015); their membership has been discussed in Frinchaboy et al. (2013); Cunha et al. (2015) and also a radial-velocity membership study (Tofflemire et al., 2014) indicates that all of these targets are cluster members. All of the observed spectra have high ( ) signal-to-noise ratios in order to minimize random observational error.
The basic stellar parameters and metallicities (, log g, [Fe/H]) for the target stars are listed in Table 1. A detailed description of the atmospheric parameter determinations can be found in Cunha et al. (2015).
| 2MASS ID | S/N | vhelio | Teff | [Fe/H] | [C/Fe] | [N/Fe] | Evol. | ||
|---|---|---|---|---|---|---|---|---|---|
| [] | [K] | [] | state | ||||||
| J19204557+3739509 | 92 | -46.3 | 4500 | 2.45 | 0.44 | -0.09 | 0.41 | 1.3 | RC |
| J19204971+3743426 | 368 | -47.5 | 3530 | 0.80 | 0.40 | -0.19 | 0.45 | 1.8 | … |
| J19205338+3748282 | 154 | -48.5 | 4075 | 1.70 | 0.42 | -0.11 | 0.31 | 1.7 | RGB |
| J19205510+3747162 | 159 | -48.2 | 4000 | 1.62 | 0.38 | -0.05 | 0.36 | 1.7 | RGB |
| J19205530+3743152 | 113 | -47.9 | 4300 | 2.27 | 0.42 | -0.04 | 0.36 | 1.7 | RGB |
| J19210112+3742134 | 135 | -47.7 | 4255 | 2.21 | 0.33 | 0.00 | 0.47 | 1.6 | RGB |
| J19210426+3747187 | 132 | -46.8 | 4200 | 1.85 | 0.40 | -0.10 | 0.35 | 1.8 | RGB |
| J19210483+3741036 | 98 | -50.0 | 4490 | 2.48 | 0.39 | -0.15 | 0.36 | 1.5 | RC |
| J19211007+3750008 | 103 | -49.0 | 4435 | 2.66 | 0.41 | -0.06 | 0.37 | 1.3 | RGB |
| J19211606+3746462 | 856 | -46.8 | 3575 | 0.76 | 0.29 | -0.17 | 0.46 | 1.8 | … |
| J19213390+3750202 | 552 | -47.0 | 3800 | 1.25 | 0.28 | -0.09 | 0.40 | 1.7 | … |
2.2 Abundance Analysis
Carbon and nitrogen abundances were not published by Cunha et al. (2015). Molecular lines of CO were used to derive carbon abundances, CN lines for deriving nitrogen abundances, and OH lines were used for obtaining oxygen abundances (see Cunha et al. (2015) for details). The methodology described in Smith et al. (2013) was used to derive abundances of C, N and O by fitting of all molecular lines consistently. The selected line list adopted in the calculations of synthetic spectra was the same used for DR13 and described in detail by Shetrone et al. (2015).
The current version of ASPCAP (DR13 (SDSS Collaboration et al., 2016)) does not determine the 12C/13C ratio, thus we chose an independent code called autosynth (Mészáros et al., 2015), which compares theoretical spectra with observations and determines abundances via a minimization. Our synthetic spectra were based on 1D Local Thermodynamic Equilibrium (LTE) model atmospheres calculated with ATLAS9 (Kurucz, 1979, 1993) using the solar mixture from Asplund et al. (2005). Scaled with the metallicity, model atmospheres were computed using the method described in Mészáros et al. (2012).
For spectrum syntheses, the autosynth gives the parameters to the MOOG201322footnotetext: http://www.as.utexas.edu/ chris/moog.html (Sneden, 1973) and MOOG creates a synthetic spectrum using model atmospheres calculated by adopting atmospheric parameters such as, Teff, log g, [Fe/H] and abundances of [C/Fe], [N/Fe] taken from Cunha et al. (2015). Afterwards, this model spectrum is then compared to the observations.
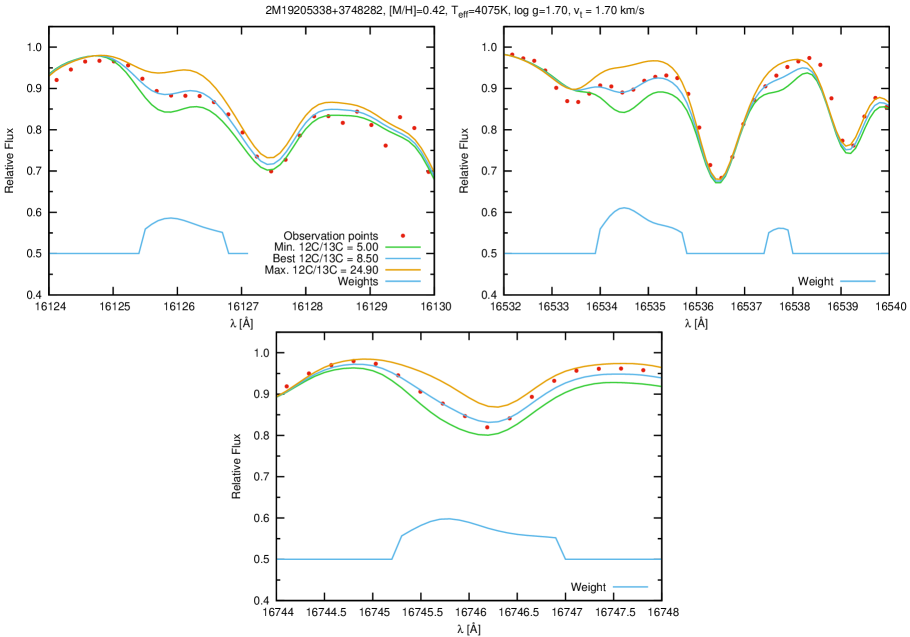
After feeding the main atmospheric parameters and abundances into the program, we fitted the 12C/13C ratios in pre-defined wavelength windows centred around 12CO and 13CO molecular lines. These windows were determined by subtracting two synthetic spectra, one with 12C/13C=100, and one with 12C/13C=2, from each other. The resulting difference highlights the spectral regions most sensitive to the 12C/13C ratio. Only those segments of the spectrum were chosen, where the difference between the two normalized spectra was higher than 0.025. This difference was used as weights during the fitting process, in which the value of 12C/13C was varied between 5 and 25 for all stars. Examples of wavelength windows are shown in Figure 1. The selected regions were: 16125.5 16126.7 Å, 16534.0 16535.9 Å, 16537.5 16537.9 Å and 16745.3 16746.9 Å. The resulting isotopic ratios are listed in Table 2. The second window represent both the second and the third wavelength regions.
The uncertainties in the atmospheric parameters, Teff, log g and [Fe/H], affect the abundances, and therefore, the final 12C/13C ratios as well. The uncertainties were calculated by changing the Teff by 100K, [Fe/H] by 0.1 dex, log g by 0.2 dex one-by-one (these values generally represent the average ASPCAP errors for this cluster), and then by repeating the same fitting procedure described in the previous section. The individual error from each atmospheric parameter was the difference between the original 12C/13C and these altered calculation values. The final value of uncertainty was the sum in quadrature of these three individual errors. Asymmetric values of the errors were calculated because of the carbon isotopic ratio reciprocal nature. We would like to acknowledge that we are taking shortcuts to computing errors. Firstly, we are examining how one value propagates, rather than sampling the error distribution in the parameters and secondly, we are assuming errors in the atmospheric parameters are uncorrelated.
| 2MASS ID | Error | Error | |||||
| [K] | window 1.a | window 2.b | window 3.c | averaged | |||
| J19204557+3739509 | 4500 | 8.80 | 5.80 | 5.20 | 6.3 | 1 | 1 |
| J19204971+3743426 | 3530 | … | 10.6 | 10.5 | 10.6 | 2 | 2 |
| J19205338+3748282 | 4075 | 8.50 | 8.60 | 8.40 | 8.5 | 1 | 2 |
| J19205510+3747162 | 4000 | … | 10.5 | 8.50 | 9.4 | 1 | 2 |
| J19205530+3743152 | 4300 | … | 11.0 | 8.80 | 9.8 | 2 | 3 |
| J19210112+3742134 | 4255 | … | 14.1 | 8.50 | 10.6 | 2 | 3 |
| J19210426+3747187 | 4200 | 10.4 | 9.20 | 7.10 | 8.7 | 2 | 2 |
| J19210483+3741036 | 4490 | 7.3 | 8.6 | … | 7.95 | 2 | 4 |
| J19211007+3750008 | 4435 | … | 6.60 | 6.90 | 6.8 | 1 | 1 |
| J19211606+3746462 | 3575 | 11.2 | 8.10 | 9.0 | 9.3 | 2 | 3 |
| J19213390+3750202 | 3800 | … | 11.4 | 9.20 | 10.2 | 2 | 2 |
| a Fitting range: 16120 Å - 16133 Å | |||||||
| b Fitting range: 16530 Å - 16545 Å | |||||||
| c Fitting range: 16738 Å - 16754 Å | |||||||
| d Mean of the three distinct value | |||||||
3 Discussion
3.1 Carbon Isotope ratios and Models in NGC 6791
The derived values of the carbon isotopic ratios in NGC 6791 are lower than expected from the standard 1st dredge-up model, typically around 2630 depending on mass. An extra mixing mechanism is presumably responsible for this discrepancy in the surface carbon ratio. Shetrone (2003a) derived the carbon isotopic ratio for 32 stars in 4 globular cluster and they pointed out, that the extra mixing effect occurs above the luminosity bump and this is what the thermohaline mixing model predicts. See also Charbonnel et al. (1998)
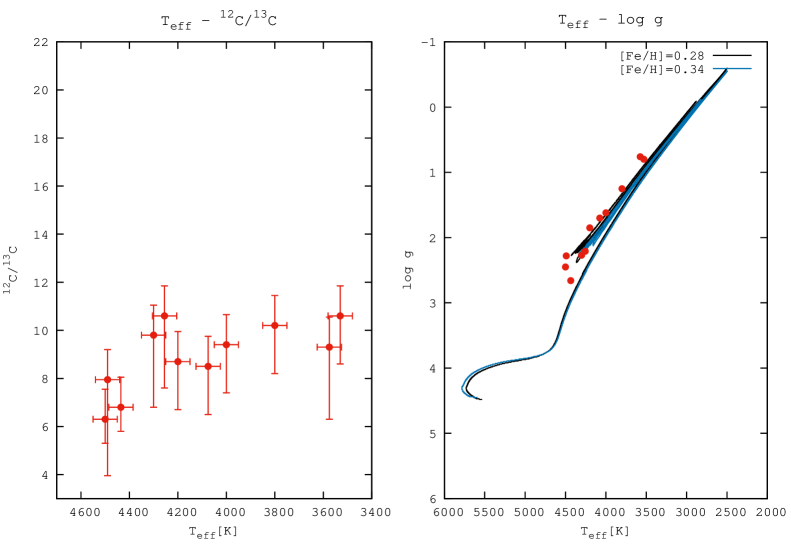
From Figure 2 (left panel), we can see that the 12C/13C ratio in our sample stars does not correlate significantly with the effective temperature, although the three hottest red giants exhibit somewhat lower ratios and these stars are most red clump giants. The amount of extra mixing visible in NGC 6791 could reduce the isotopic ratio to between 6.3 and 10.6, and this is in good correspondence with the lowest value obtained at the RGB tip when thermohaline mixing is taken into account (Charbonnel & Lagarde, 2010). This study indicates that extra mixing occurs at very high metallicities, similarly to solar-metallicity stars.
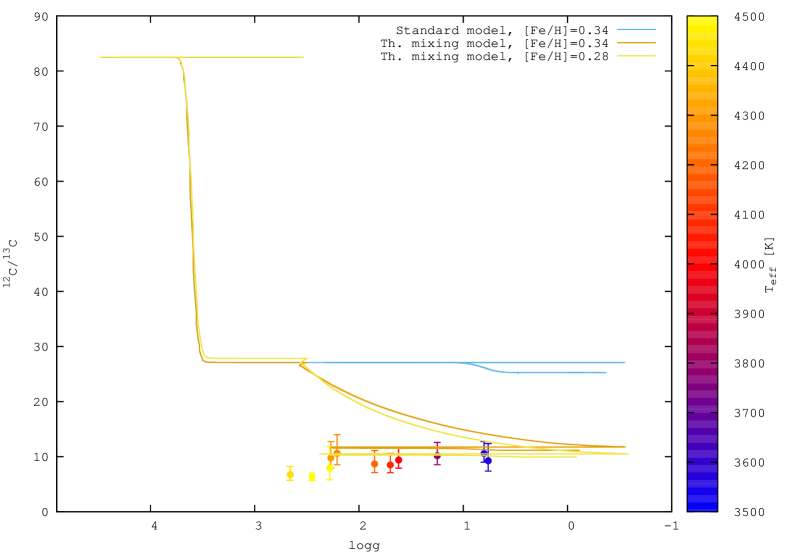
As mentioned previously, the carbon isotopic ratios undergo drastic changes in the RGB. Stellar models have been computed for the present paper using the stellar evolution code STAREVOL (e.g. Lagarde et al., 2012) for two stellar masses (1.15 and 1.10 M⊙) at two metallicities ([Fe/H]=0.34 and 0.28). We use the same main physical ingredients that are used and described in Lagarde et al. (2017). To quantify the effects of thermohaline mixing we computed stellar evolution models assuming the standard prescription (no mixing mechanism other than convection), and including the effects of thermohaline instability induced by 3He burning as described by Charbonnel & Lagarde (2010).
In Figure 3 we plot the theoretical predictions of our stellar models including thermohaline mixing and computed at the average metallicity of NGC 6791 and compare with our observations. The carbon isotopic ratio first decreases under the effect of the first dredge-up (log g 3.7). The value of 12C/13C decreases further after the RGB bump (log g 2.5), as the star evolves up the RGB to the tip. After the He core-flash, the carbon isotope ratio remains fairly constant during the RC and early-AGB phases of evolution.
The final, asymptotic values of 12C/13C predicted by the thermohaline mixing models, shown in Figure 3, agree very well with the derived carbon isotopic ratios in the NGC 6791 red giants. However, an inconsistency remains, in the behavior of the carbon isotope ratio as a function of log g (which is a proxy for luminosity). Instead of a gradual decline in 12C/13C with increasing luminosity (or decreasing log g) above the luminosity bump, as predicted by the thermohaline model, the observed carbon isotope ratios display a rapid decrease in 12C/13C right after the luminosity bump. The predicted behavior of 12C/13C as a function of RGB luminosity from thermohaline mixing models can depend on the detailed numerical treatment of mixing, as discussed by Lattanzio et al. (2015). Further analysis of 12C/13C values in other clusters observed by APOGEE will allow for a more through mapping of observed carbon isotope ratios across a range of RGB masses and metallicities, which can be compared to models of thermohaline mixing.
A more precise determination of the specific evolutionary status for red giants can be made through asteroseismology. NGC 6791 is part of the Kepler field and has extensive asteroseismic information available. Pinsonneault et al. (2014) combined Kepler photometric data with APOGEE observation in the APOKASC catalog. This catalog contains the estimated evolutionary status information using the compilation of Mosser et al. (2014). Eight stars from this sample have an identified evolutionary status (Table 1) from the APOKASC catalog, with 6 classified as RGB and 2 as RC. The other 3 stars are all quite cool (Teff 3500-3800K and are likely to be luminous RGB stars. It is worth noting that the mean value of 12C/12C for the 9 likely RGB stars is 9.3, compared to 7.1 for the two RC stars.
3.2 Dependence on metallicity and stellar mass
Besides evolutionary status, the carbon isotopic ratios depend on stellar mass and perhaps on metallicity, as shown theoretically by Lagarde et al. (2012). Our aim is to collect literature data and directly compare 12C/13C ratios at various metallicities and masses with theoretical models. Currently, published thermohaline-mixing models take into account stellar mass and metallicity (Lagarde et al., 2017). These models cover the initial mass from 0.6 M⊙ to 6.0 M⊙ with five metallicities [Fe/H] = -2.15, -0.54, -0.23, 0 and 0.51. Our new measurements lie in the metal rich region than what was poorly observed before.
Gilroy & Brown (1991) found that in M67, a near-solar metallicity cluster, the least evolved faint stars had significantly higher 12C/13C ratios (40), and as stars advanced further in the evolutionary track, the carbon isotopic ratios decreased to about 13. While a correlation between 12C/13C with Teff could be observed in M67, suggesting that less evolved stars exhibit no extra mixing, the extra mixing in NGC 6791 occurs throughout the full extent of the giant branch. We would like to note that our target selection, unlike that of Gilroy & Brown (1991), did not contain stars near the turn-off and sub-giant branch (see the right panel of Figure 2) and also the comparison has to be done carefully because in metal-rich clusters the bump moves down in luminosity. Thus, the mixing mechanism and equilibrium will occur at a different log g.
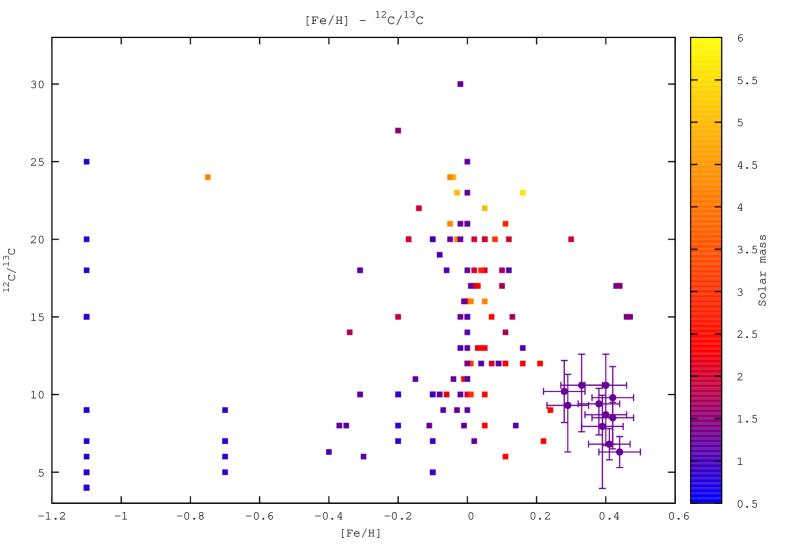
Stars with solar-like and slightly metal poor metallicities have been observed and discussed in the literature (e.g Gilroy et al., 1989; Gilroy & Brown, 1991; Tautvaišiene et al., 2000; Shetrone, 2003a; Tautvaišienė et al., 2005; Smiljanic et al., 2009; Mikolaitis et al., 2010, 2011a, 2011b, 2012; Santrich et al., 2013; Tautvaisiene et al., 2016; Drazdauskas et al., 2016a, b). A collection of these literature results for 12C/13C is plotted in Figure 4 as a function of metallicity. These observed stars cover stellar masses from 1.2 to 5.6 M⊙. Most studies find that above 2.5 solar masses, the carbon isotopic ratio is 22-30, while in lower mass giants, the 12C/13C decreases with mass.
Comparing results from different literature sources is difficult because evolutionary status information is usually not provided. The 15 red-giant stars from M 67 had similar masses to the ones in NGC 6791, observed by Gilroy & Brown (1991). The turn-off mass of the cluster determined from theoretical isochrone fitting was found to be about 1.2 M⊙. Thermohaline mixing occurs after the luminosity-bump (Charbonnel & Lagarde, 2010), and it is believed that the 12C/13C does not change after the bump. Gilroy & Brown (1991) were able to determine the evolutionary status for some of their stars and found that the carbon isotopic ratio for RC stars is between 11 and 13, which is higher than what we find for RC stars in NGC 6791 (around 8).
Comparing results from the literature with our measurements for NGC 6791 is challenging because we do not know the evolutionary status of most of these stars. Based on theoretical models, Lagarde et al. (2012) suggested that slightly stronger mixing (12C/13C 8.36 ) occurs in more metal-rich stars, which is in line with our measurements.
Another difficulty is that the isotopic ratios were not derived in a consistent way using the same wavelength regions and analysis method. From these we conclude that this combined dataset is not enough to examine the connection between isotopic ratios, evolutionary status, mass and metallicity in more detail than what was carried out in previous literature studies. Such a study will be possible by determining the 12C/13C ratios of the APOKASC giants, in which accurate masses, metallicities and evolutionary status are available.
4 Conclusions
We demonstrated the presence of additional mixing beyond first dredge-up dilution in the atmospheres of RGB/AGB stellar members of the metal-rich open cluster NGC 6791 from measurements of the carbon isotope ratios of 12C/13C. The studied stars in NGC 6791 are all beyond the luminosity bump, and our results show good agreement with thermohaline mixing models, if the stars are either on the RC or the AGB. Four stars with derived surface gravities between log g 1 – 2 appear to be on the AGB based on their isotopic ratios, while stars with values of log g less than 1 can either be AGB or RGB, as their evolutionary status is not available. Four stars with log g 2.5 appear to be RC stars, and one of them is in fact, confirmed to be on the RC in the APOKASC catalog.
Carbon isotopic ratios from the literature, combined with our results, do not suggest that extra mixing is stronger at higher metallicities, however, the size of the sample is small so far. We cannot conclude that such correlation exists, because we do not know the evolutionary status of most of the stars from the literature. A more detailed study of the effect of mass and metallicity on the isotopic ratios can be only made with the knowledge of the evolutionary status of the stars.
A methodical study of thermohaline mixing is only possible by observing large number of stars in the context (Lagarde et al., 2015) of large sky surveys. APOGEE is such a survey capable of determining values of 12C/13C for thousands of stars. These new measurements will be available in the data release of SDSS in 2018.
Acknowledgements
L. Sz. and Sz. M. has been supported by the Hungarian NKFI Grants K-119517 of the Hungarian National Research, Development and Innovation Office. Sz. M. has been supported by the Premium Postdoctoral Research Program of the Hungarian Academy of Sciences.
J.G.F-T gratefully acknowledge support from the Chilean BASAL Centro de Excelencia an Astrofísica Technologías Afines (CATA) grant PFB-06/2007
S.V. gratefully acknowledges the support provided by Fondecyt reg. n. 1170518
DAGH was funded by the Ramón y Cajal fellowship number RYC-2013-14182 and he acknowledges support provided by the Spanish Ministry of Economy and Competitiveness (MINECO) under grant AYA-2014-58082-P.
Funding for the Sloan Digital Sky Survey IV has been provided by the Alfred P. Sloan Foundation, the U.S. Department of Energy Office of Science, and the Participating Institutions. SDSS acknowledges support and resources from the Center for High-Performance Computing at the University of Utah. The SDSS web site is www.sdss.org.
SDSS is managed by the Astrophysical Research Consortium for the Participating Institutions of the SDSS Collaboration including the Brazilian Participation Group, the Carnegie Institution for Science, Carnegie Mellon University, the Chilean Participation Group, the French Participation Group, Harvard-Smithsonian Center for Astrophysics, Instituto de Astrofísica de Canarias, The Johns Hopkins University, Kavli Institute for the Physics and Mathematics of the Universe (IPMU) / University of Tokyo, Lawrence Berkeley National Laboratory, Leibniz Institut für Astrophysik Potsdam (AIP), Max-Planck-Institut für Astronomie (MPIA Heidelberg), Max-Planck-Institut für Astrophysik (MPA Garching), Max-Planck-Institut für Extraterrestrische Physik (MPE), National Astronomical Observatories of China, New Mexico State University, New York University, University of Notre Dame, Observatório Nacional / MCTI, The Ohio State University, Pennsylvania State University, Shanghai Astronomical Observatory, United Kingdom Participation Group, Universidad Nacional Autónoma de México, University of Arizona, University of Colorado Boulder, University of Oxford, University of Portsmouth, University of Utah, University of Virginia, University of Washington, University of Wisconsin, Vanderbilt University, and Yale University.
References
- Asplund et al. (2005) Asplund, M., Grevesse, N. Sauval, A. J. 2005, ASPC, 336, 25
- Asplund et al. (2009) Asplund, M., Grevesse, N., Sauval, A. J., & Scott, P. 2009, ARA&A, 47, 481
- Basu et al. (2011) Basu, S., Grundahl, F., Stello, D., et al. 2011, ApJ, 729, L10
- Blanton et al. (2017) Blanton, M. R., Bershady, M. A., Abolfathi, B., et al. 2017, AJ, 154, 28
- Boesgaard et al. (2009) Boesgaard, A. M., Jensen, E. E. C., & Deliyannis, C. P. 2009, AJ, 137, 4949
- Bowen & Vaughan (1973) Bowen, I. S., & Vaughan, A. H., Jr. 1973, Appl. Opt., 12, 1430
- Briley (1995) Briley, M. M., Smith, V. V., & Lambert, D. L. 1995, ApJL, 424, L119
- Brown et al. (2013) Brown, J. M., Garaud, P., & Stellmach, S. 2013, ApJ, 768, 34
- Carretta et al. (2007) Carretta, E., Bragaglia, A., & Gratton, R. G. 2007, A&A, 473, 129
- Chanamé et al. (2005) Chanamé, J., Pinsonneault, M., & Terndrup, D. M. 2005, ApJ, 631, 540
- Charbonnel (1994) Charbonnel C., 1994, A&A, 282, 811
- Charbonnel et al. (1998) Charbonnel, C., Brown, J. A., & Wallerstein, G. 1998, A&A, 332, 204
- Charbonnel & Balachandran (2000) Charbonnel, C., & Balachandran, S. C. 2000, A&A, 359, 563
- Charbonnel & Lagarde (2010) Charbonnel, C., & Lagarde, N. 2010, A&A, 522, A10
- Charbonnel & Palacios (2004) Charbonnel, C., & Palacios, A. 2004, Stellar Rotation, 215, 440
- Charbonnel & Zahn (2007) Charbonnel, C., & Zahn, J.-P. 2007, A&A, 467, L15
- Cunha et al. (2015) Cunha, K., Smith, V. V., Johnson, J. A., et al. 2015, ApJ, 798, L41
- Drazdauskas et al. (2016a) Drazdauskas, A., Tautvaišienė, G., Smiljanic, R., Bagdonas, V., & Chorniy, Y. 2016, MNRAS, 462, 794
- Drazdauskas et al. (2016b) Drazdauskas, A., Tautvaišienė, G., Randich, S., et al. 2016, A&A, 589, A50
- Eisenstein et al. (2011) Eisenstein, D. J., Weinberg, D. H., Agol, E. et al. 2011, AJ, 142, 72
- Frinchaboy et al. (2013) Frinchaboy, P. M., Thompson, B., Jackson, K. M., et al. 2013, ApJ, 777, L1
- García Pérez et al. (2016) García Pérez, A. E., Allende Prieto, C., Holtzman, J. A., et al. 2016, AJ, 151, 144
- Gilmore et al. (2012) Gilmore, G., Randich, S., Asplund, M., et al. 2012, The Messenger, 147, 25
- Gilroy & Brown (1991) Gilroy, K. K., & Brown, J. A. 1991, ApJ, 371, 578
- Gilroy et al. (1989) Gilroy, K. K. 1989, ApJ, 347, 835
- González Hernández & Bonifacio (2009) González Hernández, J. I., & Bonifacio, P. 2009, A&A, 497, 497
- Gratton et al. (2000) Gratton, R. G., Sneden, C., Carretta, E., & Bragaglia, A. 2000, A&A, 354, 169
- Grundahl et al. (2008) Grundahl, F., Clausen, J. V., Hardis, S., & Frandsen, S. 2008, A&A, 492, 171
- Gunn et al. (2006) Gunn, J. E., Siegmund, W. A., Mannery, E. J., et al. 2006, AJ, 131, 2332
- Gustafsson et al. (2008) Gustafsson, B., Edvardsson, B., Eriksson, K., et al. 2008, A&A, 486, 951
- Holtzmann et al. (2016) in preparation
- Iben (1965) Iben, I., Jr. 1965, ApJ, 142, 1447
- Iben (1968) Iben, I. 1968, Nature, 220, 143
- King et al. (1985) King, C. R., Da Costa, G. S., & Demarque, P. 1985, ApJ, 299, 674
- King et al. (2005) King, I. R., Bedin, L. R., Piotto, G., Cassisi, S., & Anderson, J. 2005, AJ, 130, 626
- Kurucz (1979) Kurucz, R. L. 1979, ApJS, 40, 1
- Kurucz (1993) Kurucz, R. L. 1993, IAU Colloq. 138: Peculiar versus Normal Phenomena in A-type and Related Stars, 44, 87
- Lagarde et al. (2011) Lagarde, N., Charbonnel, C., Decressin, T., & Hagelberg, J. 2011, A&A, 536, A28
- Lagarde et al. (2012) Lagarde, N., Decressin, T., Charbonnel, C., et al. 2012, A&A, 543, A108
- Lagarde et al. (2015) Lagarde, N., Miglio, A., Eggenberger, P., et al. 2015, A&A, 580, A141
- Lagarde et al. (2017) Lagarde, N., Robin, A. C., Reylé, C., & Nasello, G. 2017, A&A, 601, A27
- Lattanzio et al. (2015) Lattanzio, J.C., Siess, L., Church, R.P., Angelou, G., Stancliffe, R.J., Doherty, C.L., Stephen, T., Campbell, S.W. 2015, MNRAS, 446, 2673
- Linden et al. (2017) Linden, S. T., Pryal, M., Hayes, C. R., et al. 2017, ApJ, 842, 49
- Majewski et al. (2017) Majewski, S. R., Schiavon, R. P., Frinchaboy, P. M., et al. 2017, AJ, 154, 94
- Marigo et al. (2017) Marigo, P., Girardi, L., Bressan, A., et al. 2017, ApJ, 835, 77
- Martell et al. (2017) Martell, S. L., Sharma, S., Buder, S., et al. 2017, MNRAS, 465, 3203
- Mészáros et al. (2012) Mészáros, S., Allende Prieto, C., Edvardsson, B., et al. 2012, AJ, 144, 120
- Mészáros et al. (2013) Mészáros, S., Holtzman, J., García Pérez, A. E., et al. 2013, AJ, 146, 133
- Mészáros et al. (2015) Mészáros, S., Martell, S. L., Shetrone, M., et al. 2015, AJ, 149, 153
- Mikolaitis et al. (2010) Mikolaitis, Š., Tautvaišienė, G., Gratton, R., Bragaglia, A., & Carretta, E. 2010, MNRAS, 407, 1866
- Mikolaitis et al. (2011a) Mikolaitis, Š., Tautvaišienė, G., Gratton, R., Bragaglia, A., & Carretta, E. 2011, MNRAS, 413, 2199
- Mikolaitis et al. (2011b) Mikolaitis, Š., Tautvaišienė, G., Gratton, R., Bragaglia, A., & Carretta, E. 2011, MNRAS, 416, 1092
- Mikolaitis et al. (2012) Mikolaitis, Š., Tautvaišienė, G., Gratton, R., Bragaglia, A., & Carretta, E. 2012, A&A, 541, A137
- Mosser et al. (2014) Mosser, B., Benomar, O., Belkacem, K., et al. 2014, A&A, 572, L5
- Ness et al. (2017) Ness, M., Rix, H., Hogg, D. W., et al. 2017, arXiv:1701.07829
- Nidever et al. (2015) Nidever, D. L., Holtzman, J. A., Allende Prieto, C., et al. 2015, AJ, 150, 173
- Pinsonneault et al. (2014) Pinsonneault, M. H., Elsworth, Y., Epstein, C., et al. 2014, ApJS, 215, 19
- Recio-Blanco & de Laverny (2007) Recio-Blanco, A., & de Laverny, P. 2007, A&A, 461, L13
- SDSS Collaboration et al. (2016) SDSS Collaboration, Albareti, F. D., Allende Prieto, C., et al. 2016, arXiv:1608.02013
- Santrich et al. (2013) Santrich, O. J. K., Pereira, C. B., & Drake, N. A. 2013, A&A, 554, A2
- Shetrone (2003a) Shetrone, M. D. 2003, ApJ, 585, L45
- Shetrone (2003b) Shetrone, M. 2003, CNO in the Universe, 304, 137
- Shetrone et al. (2015) Shetrone, M., Bizyaev, D., Lawler, J. E., et al. 2015, ApJS, 221, 24
- Smiljanic et al. (2009) Smiljanic, R., Gauderon, R., North, P., et al. 2009, A&A, 502, 267
- Smith et al. (2013) Smith, V. V., Cunha, K., Shetrone, M. D., et al. 2013, ApJ, 765,16
- Sneden (1973) Sneden, C. 1973, ApJ, 184, 839
- Stothers&Simon (1969) Stothers, R., & Simon, N. R. 1969, ApJ, 157, 673
- Tautvaišiene et al. (2000) Tautvaišiene, G., Edvardsson, B., Tuominen, I., & Ilyin, I. 2000, A&A, 360, 499
- Tautvaišienė et al. (2005) Tautvaišienė, G., Edvardsson, B., Puzeras, E., & Ilyin, I. 2005, A&A, 431, 933
- Tautvaišienė et al. (2015) Tautvaišienė, G., Drazdauskas, A., Mikolaitis, Š., et al. 2015, A&A, 573, A55
- Tautvaisiene et al. (2016) Tautvaisiene, G., Drazdauskas, A., Bragaglia, A., Randich, S., & Zenoviene, R. 2016, arXiv:1608.08398
- Tautvaišienė et al. (2016) Tautvaišienė, G., Drazdauskas, A., Bragaglia, A., Randich, S., & Ženovienė, R. 2016, A&A, 595, A16
- Thompson et al. (2010) Thompson, I. B., Kaluzny, J., Rucinski, S. M., et al. 2010, AJ, 139, 329
- Tofflemire et al. (2014) Tofflemire, B. M., Gosnell, N. M., Mathieu, R. D., & Platais, I. 2014, AJ, 148, 61
- Traxler et al. (2011) Traxler, A., Garaud, P., & Stellmach, S. 2011, ApJ, 728, L29
- Ulrich (1972) Ulrich, R. K. 1972, ApJ, 172, 165
- Wachlin et al. (2014) Wachlin, F. C., Vauclair, S., & Althaus, L. G. 2014, A&A, 570, A58
- Wu et al. (2014) Wu, T., Li, Y., & Hekker, S. 2014, ApJ, 781, 44
- Xiang et al. (2017) Xiang, M.-S., Liu, X.-W., Yuan, H.-B., et al. 2017, MNRAS, 467, 1890
- Zamora et al. (2015) Zamora, O., García-Hernández, D. A., Allende Prieto, C., et al. 2015, AJ, 149, 181
- Zasowski et al. (2013) Zasowski, G., Johnson, J. A., Frinchaboy, P. M. et al. 2013, AJ, 146, 81