Original Russian Text @ F.G. Kopylova, A.I. Kopylov,
published in Astrofizicheskii Byulleten, 2017,
Vol.72, No.4, pp.399-412
Peculiar Motions of Galaxy Clusters in the Regions of Superclusters of Galaxies
Abstract
We present results of the study of peculiar motions of 57 clusters and groups of galaxies in the regions of the Corona Borealis (CrB), Bootes (Boo), Z 5029/A 1424, A 1190, A 1750/A 1809 superclusters of galaxies and 20 galaxy clusters located beyond massive structures (). Using the SDSS (Data Release 8) data, a sample of early-type galaxies was compiled in the systems under study, their fundamental planes were built, and relative distances and peculiar velocities were determined. Within the galaxy superclusters, significant peculiar motions along the line of sight are observed with rms deviations of km s-1—in CrB, km s-1—in Boo. For the most massive A 2065 cluster in the CrB supercluster, no peculiar velocity was found. Peculiar motions of other galaxy clusters can be caused by their gravitational interaction both with A 2065 and with the A 2142 supercluster. It has been found that there are two superclusters projected onto each other in the region of the Bootes supercluster with a radial velocity difference of about 4000 km s-1. In the Z 5029/A 1424 supercluster near the rich Z 5029 cluster, the most considerable peculiar motions with a rms deviation of km s-1 are observed. The rms deviation of peculiar velocities of 20 clusters that do not belong to large-scale structures is equal to km s-1. The whole sample of the clusters under study has the mean peculiar velocity equal to km s-1 relative to the cosmic microwave background.
1 INTRODUCTION
In the large-scale structure of the Universe, the largest systems of galaxies, superclusters, are connected with each other with filaments from galaxies and are located at the boundaries of voids. Such large systems (or their separate parts) can be gravitationally bound if the contrast of the mean density of galaxies within is sufficient (see, e.g., Dunner:Kopylova_n_en ). If galaxy clusters in superclusters are quite densely located in the projection to the celestial sphere, one can expect the presence of large peculiar velocities in them which can be measured by determining distances to galaxy clusters. Such compact superclusters within are superclusters of Corona Borealis (CrB), Ursa Major (UMa) and Bootes (Boo). The most well-studied are the CrB and UMa superclusters and the Boo supercluster is the least studied.
As a result of the detailed study of seven galaxy clusters A 2061, A 2065, A 2067, A 2079, A 2089, A 2092, A 2124 in CrB Postman:Kopylova_n_en , it was found that with the radial velocity dispersion equal to 1300 km s-1 and the size equal to Mpc, the supercluster mass is . This mass is sufficient for the system to be gravitationally bound and peculiar velocities not to exceed 2200 km s-1. Small et al. Small1:Kopylova_n_en , having considerably increased the number of galaxies with the measured redshifts and based on modeling a supercluster with parameters similar to those of CrB, determined the mass of the supercluster equal to and proved the hypothesis presented by Postman in paper Postman:Kopylova_n_en on the fact that the supercluster is gravitationally bound. They also supposed that the supercluster is in the dynamic phase of initial gravitational collapse. In paper Kopylova1:Kopylova_n_en , we tried to show the validity of the latest assumption having measured the distances of the galaxy clusters belonging to the supercluster using the Kormendy relation Kormendy:Kopylova_n_en . Recent studies of peculiar motions of galaxy clusters with the fundamental plane (FP) and the Kormendy relation (SDSS and DR7 data) revealed in CrB great peculiar velocities indicating the galaxy clusters to be gravitationally bound Batiste:Kopylova_n_en . In Pearson:Kopylova_n_en , the mass of the supercluster has been estimated with the caustics method, the virial theorem, and model calculations (the spherical collapse model); it has been also determined that the central region of the supercluster (A 2056, A 2061, A 2065, A 2067, and A 2089) with a mass of about is gravitationally bound, has reached the turnaround radius, and is in the state of collapse.
A study of the gravitational potential distribution from the SDSS (DR10) data in the CrB region revealed two deep potential wells that correspond to galaxy clusters systems at and : one system is near the CrB supercluster, in another system there is the very rich A 2142 cluster Pillastrini:Kopylova_n_en . The mass of the system with A 2142 determined with the virial theorem 1.4 times exceeds the mass of the system with CrB. It was found that these galaxy cluster systems are connected with a filament from galaxies and are probably gravitationally bound. From the SDSS (DR8, DR10) data, in the region of the A 2142 cluster a supercluster has been found consisting of 14 galaxy systems (with at least ten members) which has the estimated mass Einasto2:Kopylova_n_en . The supercluster found apparently is a part of a larger system at .
A similar method applied to another massive supercluster, Shapley, allowed one to find that the central core of Shapley consisting of two galaxy clusters is also in the state of the initial gravitational collapse Reisenegger:Kopylova_n_en .
Model calculations of peculiar motions of galaxy clusters (taking errors into account) for the CDM model with have showed that the distribution of one-dimensional peculiar velocities of the clusters has a peak at 400 km s-1 and stretches to 500 km s-1. Their rms deviations is km s-1 and in observations it is km s-1 Bahcall:Kopylova_n_en . It is also noted in the paper that despite the obtained peculiar velocities higher than 2000 km s-1, the observed data are in agreement with model predictions at a level of about –.
The Tully-Fisher relation between the parameters of spiral galaxies allowed the authors of paper Masters:Kopylova_n_en to find the rms deviation of peculiar velocities along the line of sight for 31 galaxy clusters to be equal to km s-1 (for ‘‘In’’-sample of the galaxy cluster members) which is close to model calculations.
Using results of the study of the structure, dynamics, and peculiar velocities of galaxy clusters (, SDSS DR10 O'Mill:Kopylova_n_en ) belonging to theSC 0028-0005 supercluster, we found the estimate of the rms deviation of one-dimensional peculiar velocities with squared consideration of errors to be equal to approximately km s-1 (as it was not done in the paper indicated). Peculiar velocities there were determined with the FP of early-type galaxies.
Determination of the spatial structure and peculiar motions in the region of the Ursa Major supercluster (SDSS DR4) showed that the supercluster has the dimensions Mpc in the plane of sky and looks compact Kopylova2:Kopylova_n_en . It consists of three filamentary structures which do not intersect and influence each other; thus, no considerable peculiar motions are observed in the supercluster: the rms deviation of the observed peculiar velocities is km s-1 taking into consideration the measurement errors Kopylova2:Kopylova_n_en . Peculiar motions are also determined with the FP of early-type galaxies.
We have studied peculiar motions of 26 groups and clusters of the Hercules and Leo superclusters of galaxies() using the SDSS (DR8) data and the FP of early-type galaxies. We have found that for the superclusters under study the Hubble’s law is satisfied, and within them considerable peculiar velocities of the galaxy clusters along the line of sight are observed, with the rms deviations km s-1 (Hercules) and km s-1 (Leo) Kopylova3:Kopylova_n_en . These results were obtained with the forward FP without taking into consideration the Malmquist bias.
The aim of the present paper is the study of peculiar motions of groups and clusters of galaxies located in the regions of the massive superclusters of the Corona Borealis and A 2142, Bootes, in the regions of smaller superclusters of the galaxies such as SCl 24, SCl 38, SCl 61 Einasto1:Kopylova_n_en , and pairs of galaxy clusters. Moreover, there are 20 clusters of galaxies in our sample that do no not practically belong to such large superclusters at the redshifts . These clusters can form pairs or small superclusters but at least they have no great satellites within km s-1 and at a distance of 4 Mpc in the plane of sky. Along with this, the A 1035A and A 1035B clusters are not gravitationally bound systems Kopylov1:Kopylova_n_en . In the A 1691, A 1024, and Anon1 clusters, there are small groups of galaxies falling onto them. We conducted the work using the data from the SDSS (Sloan Digital Sky Survey, DR7, DR8), NED catalogs.
The paper is arranged in the following way. In Section 2, we describe the selection of early-type galaxies, build the FP, and determine relative distances of groups and clusters of galaxies. In Section 3, we calculate peculiar velocities and determine their rms deviations in the superclusters. In the Conclusion, we give the results obtained. In this paper, we used the following cosmological parameters: , , km s-1 Mpc-1.
2 BUILDING THE FUNDAMENTAL PLANE OF EARLY-TYPE GALAXIES
2.1 Description of the Sample
0mm \onelinecaptionstrue\captionstylenormal Cluster (J2000), (J2000), , , , hh mm ss.s dd mm ss Mpc km s-1 SCl CrB A 2019 15 03 28.9 +27 09 16 0.0817 0.82 14 A 2056 15 19 02.8 +28 20 32 0.0754 0.57 5 A 2061 15 21 20.6 +30 40 15 0.0782 1.70 121 A 2065 15 22 29.2 +27 42 27 0.0726 2.64 210 A 2067 15 23 02.0 +30 52 39 0.0733 0.68 14 A 2079 15 23 45.1 +28 55 43 0.0661 1.48 85 A 2089 15 32 49.8 +28 02 22 0.0739 1.27 51 A 2092 15 33 15.4 +31 08 42 0.0669 1.17 37 A 2124 15 44 59.0 +36 06 34 0.0660 1.77 85 CL 1529+29∗ 15 30 28.4 +28 57 03 0.0845 0.98 19 A 2142 15 58 20.0 +27 14 00 0.0904 2.28 190 SCl Bootes A 1775A 13 42 42.0 +26 14 23 0.0656 0.78 18 A 1781∗ 13 44 45.5 +29 44 44 0.0630 0.87 25 A 1795 13 48 52.5 +26 35 34 0.0632 1.86 125 A 1825 13 58 03.3 +20 37 08 0.0641 1.52 40 A 1828 13 58 14.7 +18 20 46 0.0634 0.80 13 A 1831A 13 59 10.7 +27 56 26 0.0637 1.15 34 A 1775B 13 41 49.1 +26 22 24 0.0759 1.39 62 A 1800 13 49 23.6 +28 06 26 0.0761 1.68 67 A 1831B 13 59 15.1 +27 58 34 0.0762 2.27 89 A 1898∗ 14 20 38.9 +25 15 28 0.0792 1.04 21 CL 1350+29 13 50 15.5 +29 13 17 0.0772 0.86 23 SCl Z 5029/A 1424 A 1424 11 57 29.0 +05 0 5 21 0.0771 1.51 63 A 1516 12 18 52.4 +05 14 44 0.0773 1.58 61 Z 4905 12 10 16.8 +05 23 10 0.0780 1.36 42 Z 5029 12 17 41.1 +03 39 21 0.0785 2.18 126 SCl A 1190 A 1173 11 09 15.3 +41 33 41 0.0770 1.23 35 A 1190 11 11 43.6 +40 49 15 0.0762 1.60 79 A 1203 11 13 48.2 +40 17 09 0.0761 0.99 42 SCl A 1750/A 1809 A 1750 13 30 50.6 0.0869 1.78 93 A 1773 13 42 09.6 +02 13 38 0.0784 1.98 83 A 1780 13 44 40.6 +02 51 43 0.0788 1.13 37 A 1809 13 53 06.4 +05 08 59 0.0802 1.74 84 A 0602 07 53 26.6 +29 21 34 0.0612 1.35 59 A 0671 08 28 31.6 +30 25 52 0.0505 1.95 116 A 1024 10 28 23.5 +03 45 32 0.0745 1.38 42 10 32 19.4 +40 10 10 0.0688 1.35 52 A 1035B 10 32 14.0 +40 16 16 0.0790 1.46 37 10 39 25.1 +05 10 15 0.0701 1.84 95 A 1205 11 13 21.4 +02 32 39 0.0773 1.88 74 A 1238 11 22 54.3 +01 06 52 0.0753 1.29 61 A 1371 11 45 20.6 +15 29 28 0.0700 1.32 45 A 1589 12 41 17.5 +18 34 28 0.0725 1.86 109 A 1668 13 03 46.6 +19 16 17 0.0647 1.52 63 A 1691 13 11 08.6 +39 13 37 0.0733 1.76 82 A 1767 13 36 08.3 +59 12 23 0.0707 1.95 121 A 1904 14 22 10.2 +48 34 15 0.0721 1.84 113 A 1991 14 54 31.5 +18 38 32 0.0591 1.33 79 A 2029 15 10 56.1 +05 44 41 0.0785 2.50 180 A 2033 15 11 26.5 +06 20 58 0.0806 2.03 67 A 2064 15 20 52.2 +48 39 38 0.0740 1.51 40 A 2244 17 02 42.5 +34 03 36 0.0989 2.48 95 A 2245 17 02 33.1 +33 31 00 0.0879 2.46 112 RXCJ1022 10 22 10.3 +38 31 04 0.0550 1.33 59 RXCJ1351 13 51 41.9 +46 22 00 0.0634 1.24 51 SHK352 11 21 32.6 +02 53 14 0.0504 1.29 63 Z6718 14 21 35.8 +49 33 04 0.0718 1.32 27
Our sample is compiled from 57 galaxies having the redshifts . A number of galaxy clusters is located in the regions of the CrB and Bootes superclusters, several systems are in the regions of the superclusters that are less rich: Z 5029/A 1424 (SCl 24), A 1190 (SCl 38), A 1750/A 1809 (SCl 61) (the superclusters are named by the richest cluster in them, their names given in brackets are from Einasto3:Kopylova_n_en ). We included two pairs of galaxy systems A 2244+A 2245 and A 2029+A 2033 into the sample; the rest 20 galaxy clusters do not belong to large-scale structures but form the field of galaxy systems. Estimates of dynamic characteristics of galaxy systems are based on measurements of one-dimensional dispersion of radial velocities from which the virial mass is calculated within the empirical radius on the assumption of . The radius is close (although smaller) to the virial and within its the density of the system 200 times exceeds the critical density of the Universe. can be estimated with the formula Mpc Carlberg:Kopylova_n_en .
On the assumption of , the mass within is . First, we estimated the average radial velocity of the cluster and its dispersion , then from the dispersion—the radius . Galaxies with the velocities greater were considered as background. For the other galaxies, we determined , , and again. In an iterative way, we found all the characteristics of the galaxy clusters within the radius given. As a rule, we took the brightest galaxy as a center of galaxy cluster, near which the center of X-ray emission was situated. Galaxy clusters that do not belong to large-scale superclusters like CrB and Boo have km s-1, and all the galaxy clusters belonging to in CrB and Boo are taken including those with smaller dispersion. Table 1 presents the measured dynamic parameters of galaxy clusters for the radius : name of the cluster, center coordinates, heliocentric redshifts in the CMB system (the corrections taken from the NED database), the radius in Mps, the number of galaxies with the measured radial velocities ), radial velocity dispersion with cosmological correction and error, the mass with error corresponding to determination error . For galaxy clusters marked with an asterisk, we took a centroid as a center, because several bright galaxies are situated in their central parts.
2.2 Comments to the Sample
The Corona Borealis supercluster. The first study of the dynamics of galaxy clusters in the region of the CrB supercluster was based on six systems: A 2061, A 2067, A 2065, A 2079, A 2089, and A 2092 Postman:Kopylova_n_en . For a more detailed study in this field, Small with his colleagues in the Norris Survey Small1:Kopylova_n_en ; Small2:Kopylova_n_en ; Small3:Kopylova_n_en included two more systems in the supercluster: A 2056 and CL 1529+29. In the galaxy superclusters catalog Einasto3:Kopylova_n_en , A 2019 and A 2124 were added to galaxy clusters Postman:Kopylova_n_en . In paper Kopylova1:Kopylova_n_en , the authors used eight galaxy clusters from catalog Postman:Kopylova_n_en and the Kormendy relation for early-type galaxies in order to determine the dynamic state of the CrB supercluster. To determine the dynamic state of the supercluster with the FP of early-type galaxies using the data from the SDSS (DR7) in Batiste:Kopylova_n_en , six galaxy systems were studied in paper Batiste:Kopylova_n_en as well as in paper Postman:Kopylova_n_en , and then in Pearson:Kopylova_n_en —eight, as well as in Small1:Kopylova_n_en .
In order to obtain new measurements of peculiar velocities, at first, we determined dynamic characteristics of galaxy clusters themselves with the data from the SDSS (DR7), because in the region of A 2067, for example, we do not find such a rich galaxy system in contrast with many other authors. For a more detailed characterization of the structure and kinematics of the A 2067 cluster and its vicinity, Fig. 1 shows the following as an example:
-
a)
deviation of the radial velocities of the galaxies–members of the cluster and galaxies referring to the background from the mean radial velocity of the cluster depending on the squared radius (distance from the cluster center);
-
b)
integrated distribution of the number of galaxies depending on the squared radius;
-
c)
position of galaxies in the sky plane in equatorial coordinates;
-
d)
histogram of radial velocity distributions of all the galaxies with the radius .
5mm \onelinecaptionsfalse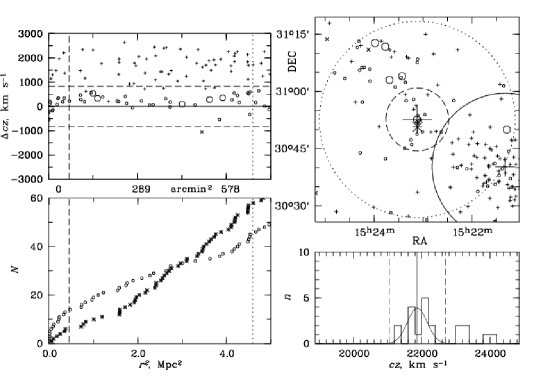 \captionstylenormal
In the upper right-hand panel of Fig. 1, the big crosses correspond to the centers of the clusters A 2061 (in the lower corner) and A 2067 (in the center) and the radii that we found are shown with the solid and dashed liens respectively. It can be noticed that A 2067 is a small group in the filament stretching from the rich A 2061 cluster. As far as no X-ray emission was detected in the system, it is not a random projection of galaxies but began to separate from the filament into a single group (the upper left-hand panel of Fig. 1). The A 2056 system of galaxies is also a small group, although, without any detected emission. The CL 1529+29 galaxy system is a binary non-virialized system with two brightest galaxies of approximately similar brightness. The centroid of galaxies was taken as a center of this system.
The Bootes supercluster. In the galaxy supercluster catalog Einasto3:Kopylova_n_en , the Bootes supercluster is specified as consisting of 12 members. The SDSS data show that two clusters from the Abell catalog: A 1861 and A 1927 are more remote systems, and two other A 1827 and A 1873 are very poor groups which we did not considered in our study. Furthermore, we have derived that the A 1775 and A 1831 clusters are bimodal galaxy clusters Kopylov2:Kopylova_n_en ; Kopylov3:Kopylova_n_en , where main clusters which we have denoted as A 1775B and A 1831B (as they are more distant) have the detected X-ray emission. The region of the the Bootes supercluster is a layered structure: in the nearest layer with we have found six galaxy systems, among which the A 1795 cluster is the richest; in the distant layer with —five galaxy systems with the richest one—A 1831B. The A 1825 and A 1828 clusters in the nearby system are situated slightly aside from the main sample and the A 1898 cluster—aside from the distant sample.
The Z 5029/A 1424 supercluster is a part of the SCl 24 supercluster. In the catalog of galaxy superclusters Einasto1:Kopylova_n_en , two Abell clusters, A 1424 and A 1516, are referred to this system, although, the most massive system in this region is the Z 5029 cluster (in Fig. 10 in paper Einasto1:Kopylova_n_en this cluster is marked as A 1516 by mistake). The A 1516 cluster is located in the sky plane above Z 5029 and there is the Z 4905 cluster near it. According to the obtained dynamic parameters of these galaxy clusters (Table 1), they have similar radial velocities.
The A 1190 supercluster is a part of the SCl 38 supercluster. In the catalog of galaxy superclusters Einasto1:Kopylova_n_en and earlier catalogs, five galaxy clusters have been found in this region: A 1155, A 1173, A 1187, A 1190, A 1203. We have determined parameters of these systems and found that the clusters A 1155 and A 1187 correspond to poor galaxy groups with the radial velocity dispersion smaller than 200 km s-1, thus, we do not consider them here. Actually, there are three rich galaxy clusters in this supercluster, A 1190 is the most massive system of all.
The A 1750/A 1809 supercluster is a part of the SCl 61 supercluster. We have determined the peculiar motions only for the most massive galaxy systems in this supercluster Einasto1:Kopylova_n_en . All three superclusters have close redshifts and are characterized by the presence of several peaks in the radial velocity dispersions of the clusters belonging to them, consequently, they are forming systems.
Apart from large galaxy superclusters, we also considered the pairs of the galaxy clusters: A 2029 and A 2033, A 2244 and A 2245.
2.3 Selection of Early-Type Galaxies
In the present paper, to determine relative distances of galaxy clusters we used galaxy parameters given in the SDSS Data Release 8 Aihara:Kopylova_n_en . Using the data of this issue, which takes into consideration the errors in reducing massive galaxy images made in previous issues, we built the FP of 93 000 early-type galaxies with in all filters Saulder:Kopylova_n_en . We used the shape of the built FP having specified the zero-point for our sample along with this. While selecting early-type galaxies in the groups and clusters under study, we used the following criteria which slightly differ from those in paper Saulder:Kopylova_n_en :
-
1) the central stellar velocity dispersion— km s-1;
-
2) the parameter characterizing the contribution of the de Vaucouleurs profile into the surface-brightness profile—;
-
3) the concentration index equal to the ratio of the radii containing 90% and 50% of the Petrosian fluxes—;
-
4) the restriction by color— in order to exclude late-type galaxies, where = Kopylova4:Kopylova_n_en ;
-
5) the relation of axes of the galaxies—;
-
6) the ratio in the galaxy spectra— ;
-
7) the limiting value for our sample which corresponds to the spectral limit of the SDSS equal to the value not corrected for absoption, Strauss:Kopylova_n_en .
The quantity of the galaxies used plays a key role in determination of relative distances of galaxy clusters, as the standard error of the average distance equals the standard deviation divided by . However, it is important that the galaxies are selected homogeneously. Our criteria are close to those applied in Pearson:Kopylova_n_en . Our main criteria are (1) and (2). Because of the galaxies with km s-1, the scatter in the distances to determine increases Jorgensen:Kopylova_n_en . Accuracy of measurements of such is lower than accuracy of measurements of high velocities. Criterion (4) makes it possible to exclude late-type galaxies left after applying criterion (2). The other criteria provide a stricter selection of early-type galaxies. Moreover, with one and the same radial velocity dispersion , galaxies can have slight population differences (metallicity, age) Jorgensen:Kopylova_n_en . We excluded such galaxies by their residual deviations from the FP (Fig. 3, item 2.4).
We used galaxy parameters that were obtained by fitting the de Vaucouleurs profile to the observed galaxy profile. All corrections: aperture corrections (, where is the model radius of a galaxy from the SDSS with regard to its ellipticity), corrections for absorption in a Galaxy (from the SDSS data), correction Chilingarian:Kopylova_n_en —were made in accordance with paper Saulder:Kopylova_n_en . Radial velocities of galaxy clusters were normalized to the system of the CMB: corrections were taken from the NED data base. In the correction for cosmological dimming of the average surface brightness
it has been taken into account that is the measured redshift which also includes the peculiar velocity of an object and is the redshift corresponding to the actual cosmological distance Mohr:Kopylova_n_en . When estimating the surface brightness, only the first part of the correction was taken into account, the second part of it was taken into account in the zero point in determination of the Hubble relation (Section 2.4)
2.4 The Fundamental Plane
5mm \onelinecaptionsfalse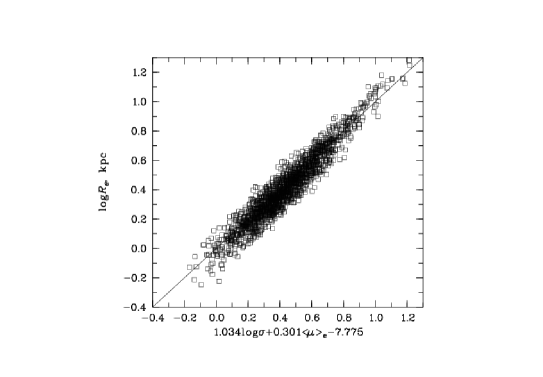 \captionstylenormal
Figure 2 shows the FP derived in the band (SDSS) for 1732 early-type galaxies selected according to the above criteria. The line corresponds to the forward regression Saulder:Kopylova_n_en relative to and is written as:
| (1) |
where is the effective radius of a galaxy in kpc, is the average surface brightness within the limits of this radius, and is the central dispersion of stellar radial velocities. We determined the more accurate zero point for our sample and obtained . The root-mean-square deviation of the FP zero point is equal to which is equivalent to the 16% error of the distance determination for a single galaxy. The formal error of the cluster distance determination depends on the number of the used galaxies and varies from 2% to 12%. Measurement errors of the FP galaxy parameters give the contribution to the root-mean-square deviation on the 0.045 FP (the SDSS data Batiste:Kopylova_n_en ). Age and metallicity of galaxies can contribute additional scattering; they can be determined from the Mg2 line, although, according to Hudson:Kopylova_n_en , while comparing residual deviations from the FP and from the relation Mg2–, we have not found any strong correlation between them. Inconsiderable influence of the and galaxies separately on the coefficients and the FP zero point was found Hudson:Kopylova_n_en . Moreover, the galaxy scatter on the FP is increased by subsystems belonging to the clusters under study Gibbons:Kopylova_n_en . The homogeneous Malmquist bias significantly contributes into the galaxy scatter on the FP; we introduced the correction for it according to Kaiser:Kopylova_n_en . The zero point varies with distance of galaxies in case varies in arcseconds, as the other parameters ( and ) do not vary with distance. According to Kaiser:Kopylova_n_en , when using the forward FP for estimation of distances, corrections for the homogeneous Malmquist bias should be taken into consideration (equation (A3) in this paper). We took this bias into account when determining distances of galaxy clusters.
5mm \onelinecaptionsfalse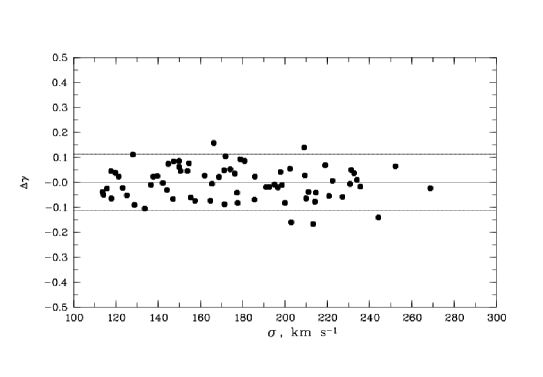 \captionstylenormal
Residual deviations from the FP
do not depend on the central stellar dispersion in galaxies. We used this fact to improve the sample of the galaxies selected earlier in each cluster (Fig. 3). Empirically, we found that almost all deviations of the zero points of galaxies from the average zero point of the cluster do not exceed . The figure shows the A 2065 cluster as an example, in which galaxies beyond (horizontal lines in the figure) were not considered while calculating the average zero point of the cluster.
3 PECULIAR VELOCITIES OF GALAXY CLUSTERS
5mm \onelinecaptionsfalse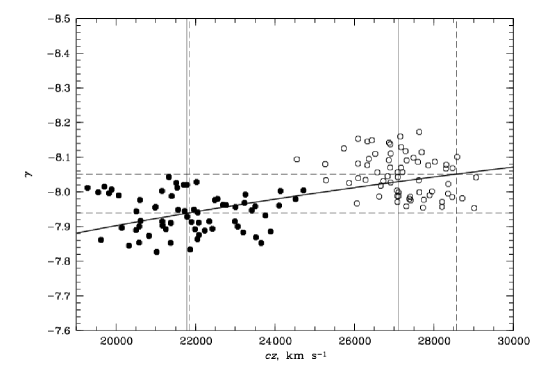 \captionstylenormal
Figure 4 gives the observed individual distances (the zero points calculated with in arcseconds) of the galaxies in the A 2065 cluster (solid circles) and in the more remote cluster A 2142 (open circles) depending on their radial velocities relative the CMB. A bold line shows the expected Hubble dependence between radial velocity and distance calculated for a model we accepted and the zero point equal to . In this case, the comoving radial distance is calculated with , and the correction for stellar evolution in the galaxy is introduced in the zero point of the FP Saulder:Kopylova_n_en and a part of geometric dimming of light of the galaxies is taken into account ). Solid vertical lines near each cluster show their radial velocities relative to the CMB determined for the region with the radius . Dashed (horizontal) lines show average distances of the galaxy clusters determined from the FP and radial velocities corresponding to them (vertical lines). The difference of radial velocities is characterized as a peculiar velocity of a group or a galaxy cluster along the line of sight. In other words, , where is the light velocity, is the radial velocity of a cluster relative to the CMB, and is the radial velocity of a cluster corresponding to a distance determined with the FP. Table LABEL:data2:Kopylova_n_en presents the results obtained for the galaxy systems under study. The first column contains the name of the galaxy system; the second—the average distance of the system (the observed zero point with error); the third—the number of galaxies used; the fourth shows the redshift corresponding to ; the fifth—the distance in Mpc corresponding to ; the sixth column gives the peculiar velocity with error; the seventh—the relation of the peculiar velocity to its error. Table 3 presents average peculiar velocities of the galaxy cluster systems and their rms deviations along the line of sight with squared error check.
0mm \onelinecaptionstrue\captionstylenormal
| Cluster | , Mpc | , km s-1 | |||||
|---|---|---|---|---|---|---|---|
| (1) | (2) | (3) | (4) | (5) | (6) | (7) | |
| SCl CrB | |||||||
| A 2019 | 9 | 0.0760 | 319.9 | 1.96 | |||
| A 2056 | 3 | 0.0660 | 278.5 | 1.73 | |||
| A 2061 | 40 | 0.0739 | 311.1 | 2.55 | |||
| A 2065 | 66 | 0.0728 | 306.9 | 0.17 | |||
| A 2067 | 7 | 0.0758 | 319.3 | 1.67 | |||
| A 2079 | 24 | 0.0649 | 273.9 | 0.67 | |||
| A 2089 | 17 | 0.0710 | 299.3 | 1.25 | |||
| A 2092 | 15 | 0.0662 | 279.3 | 0.30 | |||
| A 2124 | 32 | 0.0687 | 289.5 | 1.36 | |||
| CL 1529+29 | 18 | 0.0801 | 337.5 | 1.34 | |||
| A 2142 | 67 | 0.0953 | 399.5 | 2.63 | |||
| SCl Bootes | |||||||
| A 1775A | 6 | 0.0655 | 276.6 | 0.14 | |||
| A 1781 | 12 | 0.0678 | 281.7 | 1.48 | |||
| A 1795 | 29 | 0.0712 | 299.9 | 4.12 | |||
| A 1825 | 11 | 0.0605 | 255.7 | 1.29 | |||
| A 1828 | 7 | 0.0634 | 267.5 | 0.02 | |||
| A 1831A | 10 | 0.0599 | 253.2 | 1.30 | |||
| A 1775B | 27 | 0.0776 | 326.4 | 0.89 | |||
| A 1800 | 30 | 0.0797 | 335.2 | 1.75 | |||
| A 1831B | 34 | 0.0731 | 307.8 | 1.76 | |||
| A 1898 | 7 | 0.0735 | 309.7 | 1.23 | |||
| CL 1350+29 | 13 | 0.0830 | 348.9 | 1.32 | |||
| SCl Z 5029/A 1424 | |||||||
| A 1424 | 30 | 0.0738 | 310.6 | 1.60 | |||
| A 1516 | 26 | 0.0744 | 313.2 | 1.26 | |||
| Z 4905 | 25 | 0.0845 | 354.9 | 1.72 | |||
| Z 5029 | 39 | 0.0802 | 337.2 | 0.89 | |||
| SCl A 1190 | |||||||
| A 1173 | 20 | 0.0810 | 340.7 | 1.16 | |||
| A 1190 | 38 | 0.0801 | 337.0 | 1.74 | |||
| A 1203 | 12 | 0.0751 | 316.2 | 0.37 | |||
| SCl A 1750/A 1809 | |||||||
| A 1750 | 45 | 0.0854 | 358.8 | 0.85 | |||
| A 1773 | 30 | 0.0730 | 307.4 | 2.23 | |||
| A 1780 | 14 | 0.0740 | 311.5 | 1.02 | |||
| A 1809 | 37 | 0.0794 | 334.0 | 0.40 | |||
| A 0602 | 14 | 0.0617 | 260.5 | 0.19 | |||
| A 0671 | 30 | 0.0497 | 210.5 | 0.40 | |||
| A 1024 | 14 | 0.0772 | 325.0 | 0.95 | |||
| A 1035A | 37 | 0.0683 | 288.1 | 0.30 | |||
| A 1035B | 17 | 0.0754 | 317.4 | 1.11 | |||
| A 1066 | 25 | 0.0728 | 306.8 | 1.24 | |||
| A 1205 | 27 | 0.0833 | 349.9 | 2.14 | |||
| A 1238 | 16 | 0.0740 | 311.4 | 0.68 | |||
| A 1371 | 20 | 0.0684 | 288.3 | 0.65 | |||
| A 1589 | 34 | 0.0726 | 305.7 | 0.04 | |||
| A 1668 | 25 | 0.0660 | 278.3 | 0.70 | |||
| A 1691 | 40 | 0.0703 | 296.7 | 2.19 | |||
| A 1767 | 30 | 0.0730 | 307.5 | 1.34 | |||
| A 1904 | 40 | 0.0714 | 301.0 | 0.67 | |||
| A 1991 | 28 | 0.0564 | 238.5 | 1.68 | |||
| A 2029 | 61 | 0.0803 | 337.8 | 0.75 | |||
| A 2033 | 26 | 0.0820 | 344.6 | 0.41 | |||
| A 2064 | 13 | 0.0773 | 325.2 | 0.75 | |||
| A 2244 | 33 | 0.0981 | 410.9 | 0.45 | |||
| A 2245 | 37 | 0.0800 | 336.6 | 4.65 | |||
| RXC J1022 | 19 | 0.0554 | 234.5 | 0.22 | |||
| RXC J1351 | 24 | 0.0617 | 260.7 | 0.86 | |||
| SHK 352 | 23 | 0.0518 | 219.2 | 0.74 | |||
| Z 6718 | 12 | 0.0726 | 305.8 | 0.25 | |||
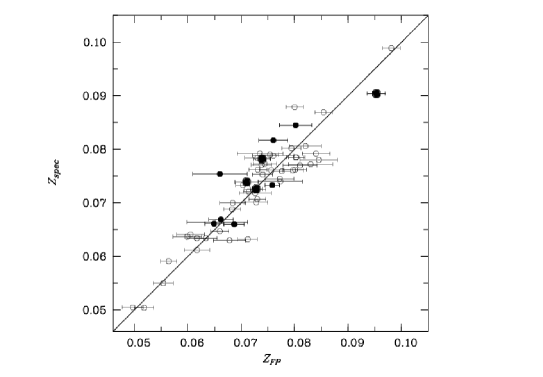
Figure 5 shows the Hubble diagram for galaxy systems in the region of the Corona Borealis supercluster and the A 2142 cluster against the background of the whole sample. Earlier, in Fig. 1, we show that the A 2067 system is a small group with the radial velocity dispersion smaller than 300 km s-1. The A 2056 system is also a poor group with a small number of members (Table 1). If we do not consider them, then the average peculiar velocity of A 2061+A 2065+A 2089, the gravitationally bound core of the supercluster Pearson:Kopylova_n_en , is positive and equal to km s-1. The galaxy clusters move away as for the CMB with a velocity 2.2 times exceeding the measurement error. The rms deviation of their peculiar velocities is km s-1 (Table 3).
However, as the richest cluster in CrB A 2065 does not have a peculiar velocity (Table LABEL:data2:Kopylova_n_en), then one can suppose that the most remote clusters in CrB with great positive peculiar velocities, A 2019, A 2061, and CL 1529+29, move toward the massive galaxy supercluster having A 2142 along the filament connecting them Pillastrini:Kopylova_n_en . It was found using the SDSS DR8 and DR10 data that this supercluster with the center in A 2142 is a supercluster with the collapsing core Einasto1:Kopylova_n_en .
0mm \onelinecaptionstrue\captionstylenormal Sample Ref. SCl CrB 9 this work A 2061, A 2065, A 2089 3 this work SCl Boo 11 this work 6 this work 5 this work SCl Z 5029/A 1424 4 this work SCl A 1190 3 this work SCl A 1750/A 1809 4 this work SCl Her 13 Kopylova3:Kopylova_n_en SCl Leo 13 Kopylova3:Kopylova_n_en A 2244+A 2245 2 this work A 2029+A 2033 2 this work field 20 this work total 57 this work
5mm \onelinecaptionsfalse
 \captionstylenormal
A 2142 is a massive cluster (according our estimates, its mass ) at with the highest X-ray luminosity Ebeling:Kopylova_n_en in the whole sample. Figure 4 shows it with open circles and it can be noted that the basic amount of galaxies are situated further ( is smaller) than they should according to the Hubble dependence (a bold line). The A 2142 cluster has a negative peculiar velocity 2.6 times exceeding the error, i.e, the cluster is possibly moving toward the supercluster to CrB. Thus, the gravitational interaction of large galaxy cluster systems of the CrB supercluster and the supercluster with A 2142 Pillastrini:Kopylova_n_en is confirmed.
The A 2079, A 2092, and A 2124 clusters show small peculiar velocities; most probably they are not significantly influenced by the central part of the cluster. On the whole, within CrB we observe considerable peculiar motions along the line of sight with the rms deviation km s-1 which considerably exceeds the motions of galaxy clusters not belonging to big structures, km s-1. In the earlier paper Kopylova1:Kopylova_n_en , using Kormendy relation (two-parameter), we found significant negative peculiar velocities in the A 2089 and A 2092 galaxy clusters and, as a result, inferred on the gravitational collapse of the supercluster’s core. In the present work performed with the FP (a three-parameter plane) and a large number of galaxies, we do not find such velocities in these galaxy systems. In other galaxy clusters, the signs of peculiar velocities determined with two methods coincide, except for the poor A 2067 group. If we compare the peculiar velocities found and the results of paper Pearson:Kopylova_n_en from the SDSS (DR7) data, then we can note that the signs of peculiar velocities coincide in all the galaxy clusters except for the systems A 2067 and A 2092.
5mm \onelinecaptionsfalse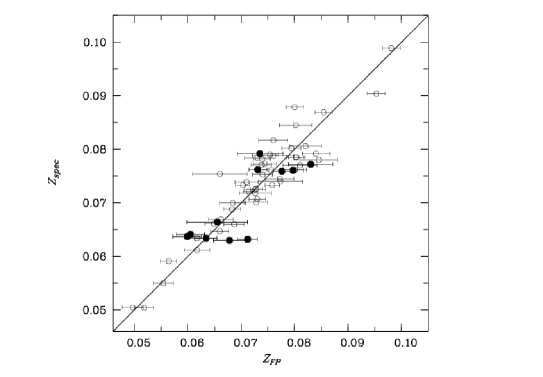 \captionstylenormal
Figure 6 shows the Hubble diagram for the region of the Bootes supercluster. The supercluster consists of two galaxy superclusters projected on each other and having the difference of peculiar velocities of about 4000 km s-1. It can be noted that peculiar motions in both systems are significant and their rms deviations are greater than those for the CrB supercluster. The peculiar velocity of the majority of the clusters inconsiderably exceeds the accuracy of measurements (). The peculiar velocity of the richest cluster in the nearby A 1795 subsystem appeared unexpectedly high; the cluster has a mass of within . It is equal to about 2223 km s-1 and four times exceeds the measurement error. A 1795 is a powerful X-ray source Ebeling:Kopylova_n_en , contains an active cD galaxy with a peculiar velocity of 245 km s-1 (relative to the average velocity of the cluster), and has two more peaks in the radial velocity dispersion apart from the central one with the cD galaxy.
The greatest rms deviations of one-dimensional peculiar velocities are observed in the cluster system A 1750/A 1809 and in the pair of rich galaxy clusters A 2244 and A 2245. The A 2244 cluster is the major in this pair, as it has the X-ray luminosity an order larger than that for A 2245 Ebeling:Kopylova_n_en . With a radial velocity difference between these clusters of 3310 km s-1 and a distance between them of about 45 Mpc, the A 2245 cluster, being situated closer to us than the A 2244 cluster, is moving toward it with a great positive peculiar velocity. In A 2245, there is a dip in the radial velocity dispersion, i.e., it consists of two subsystems with a difference in radial velocities of about 1714 km s-1. We found that both subsystems have positive peculiar velocities. In the pair of the A 2029 and A 2033 galaxy clusters, is equal to zero. The major system is A 2029 with very high X-ray luminosity Ebeling:Kopylova_n_en and A 2033 is a smaller system gravitationally bound with it. Both clusters are situated at the same distance and their small peculiar velocities have the same sign; they are moving away from us. The whole sample of galaxy clusters has an inconsiderable peculiar velocity relative to the CMB km s-1. The rms deviation of peculiar velocities of 20 galaxy clusters beyond the massive structures with km s-1 is equal to km s-1; if we take the same clusters in the superclusters, then we will obtain the rms deviation km s-1.
4 CONCLUSIONS
Model calculations show that high peculiar velocities, km s-1, appear in dense galaxy superclusters Bahcall:Kopylova_n_en . In the present paper, we analyze the dynamics of galaxy clusters in the rich superclusters Corona Borealis and Bootes and in poorer superclusters Z 5029/A 1424, A 1190, A 1750/A 1809, in pairs and galaxy clusters which do not belong to any large structures and do not have neighbors comparable in size within the limits of about 4 Mpc in the sky plane in the radial velocity range of 3000 km s-1. The work has been done using the SDSS (DR8) and NED databases. The CrB and Bootes galaxy superclusters are extended structures projected on the celestial sphere that occupy approximately Mpc and Mpc. Within these limits, ten and eleven galaxy systems respectively are located in the projection; they extend to the third coordinate at 76 and 68 Mpc. In order to find peculiar motions of galaxy clusters (57 systems), we determined their relative distances with the FP of the early-type galaxies and compared them with the distances found from the Hubble’s law.
The peculiar velocities that we obtained vary in module from 12 to 2200 km s-1. Five galaxy clusters have peculiar velocities more than two times exceeding measurement errors (A 2061, A 2142, A 1773, A 1205, A1691), two clusters, A 1795 and A 2245,—four times. The rms deviation of peculiar velocities is maximum in the A 1750/ 1809 supercluster and in the pair of the clusters A 2244 and A 2245. In the CrB supercluster, the rms deviation of peculiar velocities is also large and equals km s-1, and in the Boo supercluster components— km s-1 and km s-1. In the Hercules and Leo galaxy superclusters, we earlier obtained similar results using the SDSS (DR7) data Kopylova3:Kopylova_n_en . Table 3 presents these results. In the CrB supercluster, the massive cluster A 2065 has no peculiar velocity. To explain the observed peculiar velocities of other members of galaxy systems, there are two variants: the collapsing central region of CrB consisting of A 2056, A 2061 A 2065, A 2067, A 2089 and, possibly, A 2092 Pearson:Kopylova_n_en and the motion of the remotest galaxy clusters A 2019, A 2061, and CL 1529+29 toward the galaxy supercluster with A 2142. The A 2142 cluster that is 50 Mpc distant from the A 2061 cluster, in its turn, moves toward the CrB supercluster which confirms the presence of a gravitational interaction of these galaxy cluster systems Pillastrini:Kopylova_n_en .
The main conclusion of our study is that the rms deviation of the peculiar velocities of galaxy clusters in superclusters is larger than 500 km s-1 and is much higher than the rms deviation of the peculiar velocities of galaxy systems that do not belong to massive structures. The mean peculiar velocity of the whole sample of the galaxy clusters relative to the CMB is km s-1.
Acknowledgements.
This research has made use of the NASA/IPAC Extragalactic Database (NED, http://nedwww..ipac.caltech.edu), which is operated by the Jet Propulsion Laboratory, California Institute of Technology, under contract with the National Aeronautics and Space Administration, Sloan Digital Sky Survey (SDSS, http://www.sdss.org), which is supported by Alfred P. Sloan Foundation, the participant institutes of the SDSS collaboration, National Science Foundation, and the United States Department of Energy.References
References
- (1) R. Dünner, P. A. Araya, A. Meza, and A. Reisenegger, Monthly Notices Roy. Astronom. Soc.366, 803 (2006).
- (2) M. Postman, M. J. Geller, and J. P. Huchra, Astronom. J.95, 267 (1988).
- (3) T. A. Small, C.-P. Ma, W. L. W. Sargent, and D. Hamilton, Astrophys. J. 492, 45 (1998).
- (4) F. G. Kopylova and A. I. Kopylov, Astron. Lett. 24, 491 (1998).
- (5) J. Kormendy, Astrophys. J. 218, 333 (1977).
- (6) M. Batiste and D. J. Batuski, Monthly Notices Roy. Astronom. Soc.436, 3331 (2013).
- (7) D. W. Pearson, M. Batiste, and D. J. Batuski, Monthly Notices Roy. Astronom. Soc.441, 1601 (2014).
- (8) G. C. Baiesi Pillastrini, Astrophys. and Space Sci.361, 176 (2016).
- (9) M. Einasto, M. Gramann, E. Saar, et al., Astronom. and Astrophys.580, A69 (2015).
- (10) A. Reisenegger, H. Quintana, E. R. Carrasco, and J. Maze, Astronom. J.120, 523 (2000).
- (11) N. A. Bahcall, M. Gramann, and R. Cen, Astrophys. J. 436, 23 (1994).
- (12) K. L. Masters, C. M. Springob, M. P. Haynes, and R. Giovanelli, Astrophys. J. 653, 861 (2006).
- (13) A. L. O’Mill, D. Proust, H. V. Capelato, et al., Monthly Notices Roy. Astronom. Soc.453, 868 (2015).
- (14) F. G. Kopylova and A. I. Kopylov, Astron. Lett. 33, 211 (2007).
- (15) F. G. Kopylova and A. I. Kopylov, Astron. Lett. 40, 595 (2014).
- (16) M. Einasto, L. J. Liivamägi, E. Tago, et al., Astronom. and Astrophys.532, A5 (2011).
- (17) A. I. Kopylov and F. G. Kopylova, Astrophysical Bulletin 62, 311 (2007).
- (18) M. Einasto, J. Einasto, E. Tago, et al., Astronom. J.122, 2222 (2001).
- (19) R. G. Carlberg, H. K. C. Yee, E. Ellingson, et al., Astrophys. J. 485, L13 (1997).
- (20) T. A. Small, W. L. W. Sargent, and D. Hamilton, Astrophys. J. Suppl.111, 1 (1997).
- (21) T. A. Small, W. L. W. Sargent, and D. Hamilton, Astrophys. J. 487, 512 (1997).
- (22) H. Ebeling, A. C. Edge, H. Bohringer, et al., Monthly Notices Roy. Astronom. Soc.301, 881 (1998).
- (23) A. I. Kopylov and F. G. Kopylova, Astrophysical Bulletin 64, 207 (2009).
- (24) A. I. Kopylov and F. G. Kopylova, Astrophysical Bulletin 65, 205 (2010).
- (25) H. Aihara, C. Allende Prieto, D. An, et al., Astrophys. J. Suppl.193, 29 (2011).
- (26) C. Saulder, S. Mieske, W. W. Zeilinger, and I. Chilingarian, Astronom. and Astrophys.557, A21 (2013).
- (27) F. G. Kopylova, Astrophysical Bulletin 68, 253 (2013).
- (28) M. A. Strauss, D. H. Weinberg, R. H. Lupton, et al., Astronom. J.124, 1810 (2002).
- (29) I. Jorgensen, M. Franx, and P. Kjaergaard, Monthly Notices Roy. Astronom. Soc.280, 167 (1996).
- (30) I. V. Chilingarian, A.-L. Melchior, and I. Y. Zolotukhin, Monthly Notices Roy. Astronom. Soc.405, 1409 (2010).
- (31) J. J. Mohr and G. Wegner, Astronom. J.114, 25 (1997).
- (32) M. J. Hudson, R. J. Smith, J. R. Lucey, and E. Branchini, Monthly Notices Roy. Astronom. Soc.352, 61 (2004).
- (33) R. A. Gibbons, A. S. Fruchter, and G. D. Bothun, Astronom. J.121, 649 (2001).
- (34) N. Kaiser and M. J. Hudson, Monthly Notices Roy. Astronom. Soc.454, 280 (2015).