Diffuse ionized gas in galaxies across the Hubble sequence at the CALIFA resolution
Abstract
We use spatially resolved spectroscopy from the Calar Alto Legacy Integral Field Area (CALIFA) survey to study the nature of the line emitting gas in galaxies of different Hubble types, focusing on the separation of star-forming (SF) regions from those better characterized as diffuse ionized gas (DIG). The diagnosis is carried out in terms of the equivalent width of H (). Three nebular regimes are identified. Regions where Å define what we call the hDIG, the component of the DIG where photoionization is dominated by hot, low-mass, evolved stars. Regions where Å trace SF complexes. values in the intermediate 3–14 Å range reflect a mixed regime (mDIG) where more than one process contributes.This three-tier scheme is inspired both by theoretical and empirical considerations. Its application to CALIFA galaxies of different types and inclinations leads to the following results: (i) the hDIG component is prevalent throughout ellipticals and S0’s as well as in bulges, and explains the strongly bimodal distribution of both among and within galaxies. (ii) Early-type spirals have some hDIG in their discs, but this component becomes progressively less relevant for later Hubble types. (iii) hDIG emission is also present above and below galactic discs, as seen in several edge-on spirals in our sample. (iv) The SF/mDIG proportion grows steadily from early- to late-type spirals, and from inner to outer radii. (v) Besides circumventing basic inconsistencies in conventional DIG/SF separation criteria based on the H surface brightness, our -based method produces results in agreement with a classical excitation diagram analysis.
keywords:
surveys – galaxies: ISM – ISM: general1 Introduction
Much of what we know about galaxies comes from their optical emission-lines. Measurements of lines like H, H, [O iii] , [N ii] and others allow properties like star formation rates, dust attenuation, gas-phase metallicity, and the presence and intensity of an active nucleus to be estimated through well-known recipes. This approach of converting emission-line data on to astrophysically valuable information has been extensively explored in the context of large surveys like the Sloan Digital Sky Survey (York et al., 2000), producing important results in the quest for a better understanding of galaxy physics. Examples include the relation between the star formation rate and galaxy stellar mass (Brinchmann et al., 2004), the mass–metallicity relation (Tremonti et al., 2004), connections between AGN power and stellar populations (Kauffmann et al., 2003), and between gas-phase metallicities and star formation histories (Cid Fernandes et al., 2007), to name but a few.
A fundamental caveat of integrated-light (single-fiber) spectroscopy of galaxies is that it effectively treats as a single point source what is in reality a complex system, with physically and structurally different components. Disc and bulge, arm and inter-arm, H ii regions and diffuse gas, dusty and clean regions, young and old stars are all mixed in a total spectrum where the parts are no longer recognizable. This simplified view of galaxies is bound to affect estimates of their properties. For instance, when estimating nebular metallicities, one would in principle need to count only the emission-line photons produced in star-forming (SF) regions, isolating them from those coming from other nebular regimes, like the diffuse ionized gas (DIG), or photoionization by an active nucleus or old stars. Similarly, estimates of the dust attenuation and star formation rate from a single spectrum forcefully neglect variations in dust content across the face of galaxies. A proper assessment of these effects is important to better understand the precise meaning of (and potential biases in) properties derived from integrated-light data.
As a starting step towards this goal, this paper takes advantage of integral field spectroscopy from the CALIFA survey (Sánchez et al., 2016) to study the importance and characteristics of the DIG in different regions of galaxies of all types. The complete coverage in terms of Hubble types and inclinations makes CALIFA ideal for a first general exploration of the DIG in galaxies of the local Universe, even though its spatial resolution does not allow for a detailed description of the different interstellar medium (ISM) components. Imaging spectroscopy of galaxies with higher spatial resolution is developing (e.g., Sánchez et al., 2015; Vogt et al., 2017; Rousseau-Nepton et al., 2017) but the data available so far cover too few objects for an overall study as the one presented here.
The DIG was first detected in the Galactic disc through faint emission-lines outside the classical H ii regions (Reynolds, 1971). Observations of edge-on spiral galaxies using deep H imaging (Dettmar, 1990; Hoopes et al., 1996; Hoopes et al., 1999) showed the existence of DIG not only in the vicinity of H ii regions but also at large distances above galaxy planes. By studying 109 H i selected galaxies in the SINGS survey, Oey et al. (2007) came to the conclusion that diffuse H emission is present in galaxies of all types and represents about 60 per cent of the total H emission, irrespective of the galaxy Hubble type or total star formation rate.
Radiation from massive OB stars leaking out from H ii regions is a commonly advocated ionization source for the DIG (see review by Haffner et al., 2009). However, the existence of additional/alternative sources is required by the increase of [N ii]/H, [S ii]/H, and [O iii]/H with galactic height found in many galaxies.
Such features cannot be reproduced with models of photoionization by hot, massive stars, even taking into account the hardening of the ionizing radiation due to intervening absorption (Hoopes & Walterbos, 2003). The most commonly invoked sources of additional ionization/heating are shocks (Collins & Rand, 2001a), turbulent mixing layers (Slavin et al., 1993; Binette et al., 2009), magnetic reconnection, cosmic rays or photoelectric emission from small grains (Reynolds et al., 2001), and hot low-mass evolved stars (HOLMES; Flores-Fajardo et al., 2011). HOLMES have also been invoked as the ionization source of the weak emission-lines in retired galaxies (Stasińska et al. 2008 and Cid Fernandes et al. 2011, hereafter CF11). These are systems that have stopped forming stars and are ionized by their hot, old stellar populations, producing LINER-like emission-line ratios, a phenomenon that is common in both ellipticals and in bulges of spiral galaxies (Sarzi et al., 2010; Gomes et al., 2016a; Belfiore et al., 2016).
Regardless of what powers the DIG, its nebular regime differs from that in H ii regions, with lower densities, lower ionization parameters, and higher electron temperatures. Failure to account for its contribution may thus lead to biases in the derived properties of galaxies.
In the literature, DIG and SF regions are separated on the basis of the H surface brightness, . This is a natural criterion, since the H surface brightness is directly related to the density of the ionized gas. Zhang et al. (2017), for instance, use erg skpc-2 to ‘select reliable H ii-dominated spaxels’. In other studies, the criterion is not a simple threshold, but still based on (see discussions in Zurita et al. 2000, Oey et al. 2007, and Vogt et al. 2017). This intuitively valid approach is however not fully adequate. As argued in this paper, separating SF and DIG regions on the basis of is conceptually incorrect, and may lead to inconsistent results under certain circumstances. Furthermore, gives no clue as to the nature of the DIG emission.
These drawbacks are solved with a simple diagnostic based on the equivalent width of H (). As shown in this paper, correctly tracks the qualitative differences inherent to the SF and DIG regimes, and is also capable of identifying the component of the DIG corresponding to gas predominantly ionized by HOLMES, the hDIG, in an observationally simple and physically sound fashion. The nature of the remaining (neither HOLMES nor SF-dominated) DIG emission is most probably a mixture of processes, and will hereafter be dubbed mDIG, where the ‘m’ stands for ‘mixed’.
This paper is organized as follows. Section 2 describes the data and processing steps. Section 3 presents our -based method to separate DIG from SF spaxels, and to distinguish the mDIG and hDIG components. Section 4 applies the method to CALIFA data to study hDIG/mDIG/SF fractions and the nature of extraplanar DIG emission in edge-on systems. Comparisons with -based methods and a classical excitation diagram analysis are also presented. Finally, Section 5 highlights our main findings.
2 Data
The spatially resolved 3650–6850 Å spectra covering the whole optical extent of relatively nearby galaxies gathered by CALIFA (Sánchez et al., 2012, 2016; Husemann et al., 2013; García-Benito et al., 2015) provide a suitable data set to address the issues raised above. We use the COMBO data cubes, obtained by merging the observations with the two grisms used by CALIFA. The spectral resolution is 6 Å in full width at half-maximum, the field of view is slightly over 1 arcmin2, and the spaxel size is arcsec2, but the spatial resolution is arcsec. At the distance of our sources (20–123 Mpc), this corresponds to 0.2–1.5 kpc (0.8 kpc on the median).
Our working sample contains 391 galaxies, morphologically distributed as follows: 57 ellipticals, 47 S0–S0a, 62 Sa–Sab, 67 Sb, 70 Sbc, and 88 Sc or later. These same six bins in galaxy morphology will be used to evaluate how the SF, mDIG, and hDIG components vary across the Hubble sequence. Morphologically distorted systems (such as those studied by Wild et al. 2014; Barrera-Ballesteros et al. 2015a, b; Cortijo-Ferrero et al. 2017a, b) were discarded from the analysis. Besides its diversity in Hubble types, the sample also covers inclination angles from edge-on to face-on.
All data cubes were processed though the pycasso111Python CALIFA starlight Synthesis Organizer pipeline described in Cid Fernandes et al. (2013) and de Amorim et al. (2017). Briefly, after masking artefacts, foreground sources, and low signal-to-noise () regions, the data cubes are binned into Voronoi zones gauged to reach an of 20 or more in the continuum around 5635 Å. Our sample contains 307958 zones ( per galaxy). These zone spectra are then processed through the starlight code (Cid Fernandes et al., 2005), obtaining a model for the stellar continuum. Previous papers using this pipeline concentrated on the analysis of the spatially resolved properties of the stellar populations as deduced from the spectral fits (Pérez et al., 2013; González Delgado et al., 2014, 2015, 2016, 2017). Instead, this paper focuses on emission-line properties.
Emission-line fluxes are measured with the sherpa IFU line fitting software (SHIFU; García-Benito et al., 2017), based on ciao’s sherpa package (Freeman et al., 2001; Doe et al., 2007) by fitting single Gaussians to the residual spectra obtained after subtracting the starlight fit () from the observed spectrum (). These can be delicate measurements in the cases where lines are weak, as it is often the case with H. This study deals almost exclusively with H, whose flux is much less affected by uncertainties. Indeed, the median is 16 over all our zones, and in only 5 per cent of the cases .
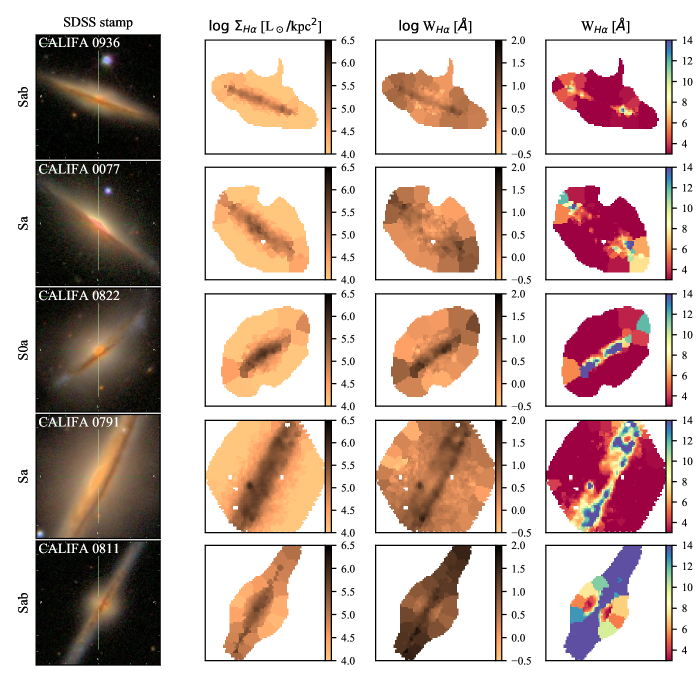
Fig. 1 shows SDSS stamps along with our CALIFA-based and maps for a selection of galaxies in our sample. Dotted ellipses mark the distance to the nucleus (), measured along the major axis of ellipses defined on the basis of the spatial moments of the continuum flux in the (rest-frame) Å continuum. We measure in units of the half-light radius (HLR), measured in the same continuum window around Å. As illustrated by the studies of Pérez et al. (2013), Sánchez et al. (2014), and González Delgado et al. (2016), the HLR is a convenient metric for comparing galaxies of different sizes. For our galaxies, HLR kpc (mean dispersion). In spirals, one may generally associate HLR with the disc and HLR with the bulge. The meaning of becomes ambiguous for highly inclined systems, a limitation that does not affect our main results.
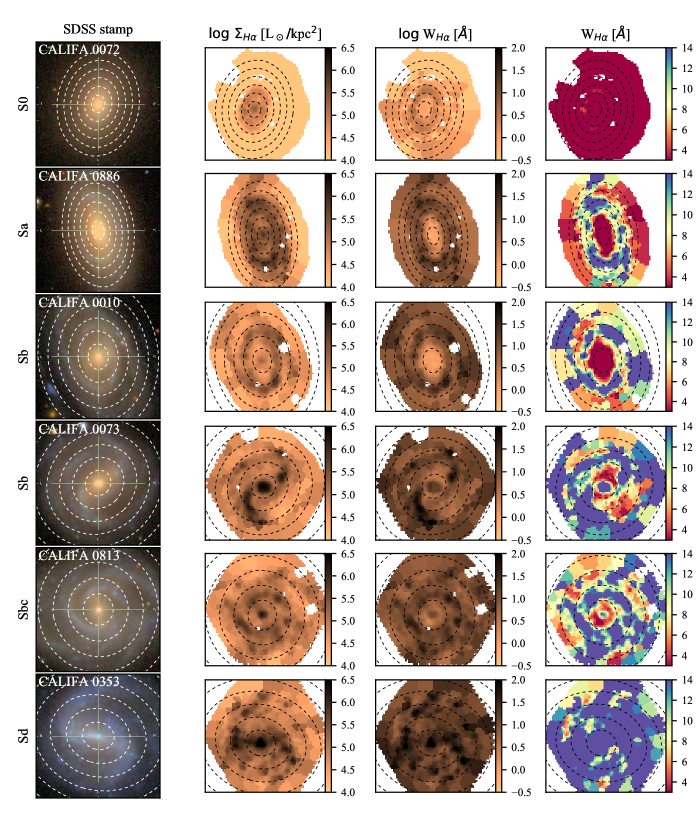
The constant patches in the example and maps in Fig. 1 correspond to the Voronoi zones used to ensure reliable continuum spectra to be processed through starlight. As seen in the figure, these are always located in the fainter, outer parts of our galaxies. Within , HLR over 97 per cent of the individual spaxels have , and so no spatial binning is performed. Of the 307958 spectra in our sample, 274534 (89 per cent) correspond to single spaxels. The remaining ones correspond to Voronoi zones containing six spaxels in the median.
Part of the analysis that follows is based on the statistics of among the spectra in our sample. The variable size of our extractions introduces some distortion in these statistics, since a large zone counts the same as one containing a single spaxel. The effects of this distortion will be discussed below, but we anticipate that they do not affect the main results reported in this paper.
3 as a diagnostic of the nebular regime: SFc, mDIG, and hDIG
We wish to devise a method to characterize the dominant nebular regime in the various galaxy regions, one that is able to distinguish SF- from DIG-dominated zones, and also to differentiate DIG components. The ulterior goal of establishing such a taxonomical scheme is to provide a basis for other studies. With a solid classification scheme, one can, for instance, perform a comparative study of the physical properties (say, dust content or stellar populations) associated with these components of the ISM, or evaluate possible biases resulting from the mix of different nebular regimes in single-fibre (one spectrum per galaxy) observations.
Given that our spatial resolution of kpc exceeds the physical scale of H ii regions (even giant ones like 30 Dor or NGC 604, which are typically 0.1–0.3 kpc across, e.g.; González Delgado & Pérez 2000), SF regions in our data are bound to contain diffuse gas emission. Naturally, this mixture is even stronger in regions spatially binned into Voronoi zones. To convey this relevant fact in our nomenclature, we will hereafter use the term star-forming complexes (SFc) to refer to regions that contain H ii regions, but inevitably mixed with DIG emission in our data. A more precise definition is that our SFc are the zones with a larger SF/DIG ratio. Note that our SFc are not even necessarily dominated by star formation, but simply contain a good proportion of SF-powered line emission. This relative, ranking-based scale is implicit in all that follows.
3.1 Rationale for a -based SF/DIG separator
Previous work favours the use of the H surface brightness () as a means to separate the DIG from SF regions. For instance, in a recent study, Zhang et al. (2017) claim that, for MaNGA Bundy et al. (2015) data, a erg skpc-2 criterion selects reliable SF-dominated spaxels.
We prefer to distinguish SF from DIG on the basis of the equivalent width of H. A simple thought experiment suffices to demonstrate that offers a more suitable way to distinguish DIG from SF regions than .
Consider combining the emission of two identical DIG-dominated cubic volume elements, each of area and emitting a flux . As is appropriate for diffuse gas, suppose also the medium is optically thin to the H photons, so that one sees the whole volume. Clearly, this DIG + DIG operation should not alter the identification of the nebular regime in the combined element, which should still be identified as DIG. Seen side by side, the joint surface brightness of the two elements will also be (twice the flux over twice the area). If, however, the two cubes were to be placed along the same line of sight, one would see twice the H flux over the same area , and hence a doubling of the surface brightness. A -based criterion will thus lead to a DIG DIG SF logical inconsistency if the original elements are brighter than half the chosen threshold. A -based criterion, on the other hand, would lead to a consistent DIG classification independent of how the merged element is seen, as the final equivalent width is the same as that of the original elements.
As shown in Section 4.3, the difference between - and -based criteria is particularly important in bulges, whose geometrically long path lengths may lead to even in the absence of SF.
A further and independent argument in favour of a -based criterion is that properties such as colours, stellar mass density, gas content, and others show a radial dependence in galaxies, so a criterion based on a fixed threshold is likely not appropriate for all the regions of a galaxy. In particular, in the case where the DIG emission is powered by HOLMES, the approximately constant ratio of ionizing photons per unit mass of old stellar populations implies a of the order of 1 Å (Binette et al. 1994; CF11; Belfiore et al. 2016), independently of the total line fluxes involved, so that one may well have H-bright HOLMES-powered regions (the hDIG) mistakenly classified as SF with a -based criterion. Conversely, faint SF regions may be misclassified as DIG because of a low .
In both arguments, it is the extensive nature of that makes it prone to confusing DIG and SF regions. , in contrast, is an intensive property222The qualifications ‘intensive’ and ‘extensive’ are used here in analogy with their thermodynamic connotation: intensive properties do not depend on the size or mass of a system (the column projected in a spaxel, in our case), whereas extensive properties are additive. The juxtaposition, either in 3D or just in projection, of two identical volume elements, each emitting a line flux and a continuum flux density over an area , results in a equivalent width identical to that of the individual elements, so that is an intensive property. On the other hand, one now has twice the flux exiting the same area, so that equals the sum of the individual ’s. In this sense, surface brightness behaves as an extensive property., and one that passes the two consistency tests posed above.
3.2 The observed distribution of and the hDIG component
Having made the case for a -based characterization of DIG regions, this section presents empirical evidence that guides the implementation of thresholds to separate SF from DIG, and to identify the HOLMES-dominated component.
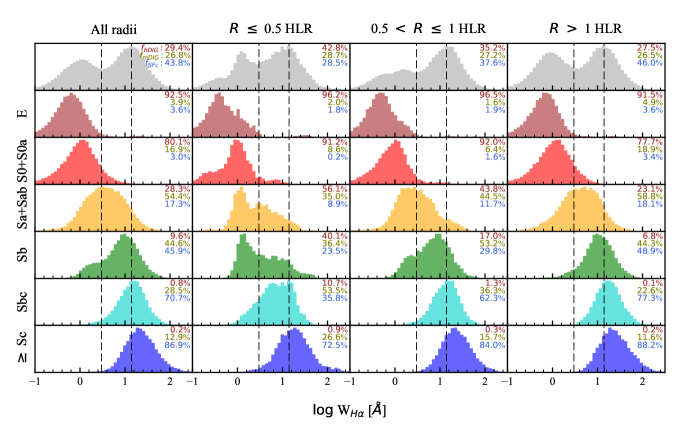
The observed distribution of among and within galaxies offers valuable insight on this issue. Fig. 2 shows histograms for k zones from the 391 CALIFA data cubes in our sample. The top panels show the result for the full sample, while the other rows split the sample by morphological types, from ellipticals in the second row to Sc and later in the bottom. Histograms in the left column count all zones, whereas columns to the right show results for different radial regions: , 0.5–1, and HLR.
The global distribution (top-left panel) is strongly bimodal, with a low -population peaking at Å and a higher one at Å. This behaviour is remarkably similar to that seen in SDSS galaxies (Bamford et al. 2008; CF11).Previous spatially resolved studies based on both CALIFA (Morisset et al., 2016) and MaNGA data (Belfiore et al., 2016, 2017) have also identified this bimodality in .
The relative amplitudes of the two peaks in the distribution are sensitive to the spatial binning scheme. Without Voronoi binning, and restricting the analysis to the inner 2 HLR to eliminate the noisiest spectra, we find that the high- population at HLR increases by about a factor of 3 with respect to that seen in the top right panel of Fig. 2. This increase comes almost exclusively from galaxies of Hubble type Sb or later. The low- peak, on the other hand, changes by just per cent. The bimodality, however, is preserved. Indeed, two-Gaussians fits to the pixel and zone-based distributions identify similar components, with peaks centred at and 14 Å in both cases.
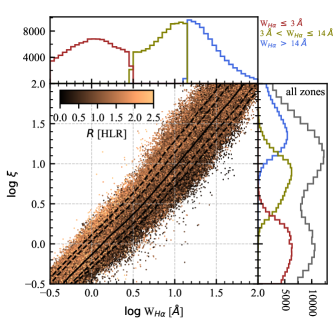
We interpret the low- population as representing gas photoionized by HOLMES. To test this, we followed the methodology in CF11 by computing the ratio between the observed H luminosity and that predicted from the ionizing photons produced by populations older than yr (inferred from the starlight analysis). Since the stellar population models used in our starlight fits (González Delgado et al., 2005; Vazdekis et al., 2010) do not extend to eV, we have borrowed the number of ionizing photons from Bruzual & Charlot (2003) for a Salpeter initial mass function and Girardi et al. (2000) tracks. As discussed in CF11, different sets of models lead to systematic differences of 0.2–0.5 dex in the predicted ionizing fluxes. Fig. 3 shows as a function of , with histograms colour-coded by our hDIG/mDIG/SFc classification. We find that is indeed of the order of 1 for zones in the low- peak. Hence, despite all uncertainties involved in this computation (CF11; Belfiore et al. 2016; Morisset et al. 2016), the end result corroborates the interpretation that HOLMES are responsible for the low- population.
The correspondence of this interpretation with the concept of retired galaxy put forth by Stasińska et al. (2008) is evident. These are systems that have stopped forming stars long ago and whose ionizing photon budget is dominated by hot post-asymptotic giant branch stars and white dwarfs, leading to values of the order of Å. Furthermore, the minimum seen at Å coincides with the threshold proposed by CF11 to distinguish retired galaxies from those where SF or AGN activity dominates the line emission. We thus claim that Å regions should be treated as HOLMES-ionized gas, the hDIG, a sub-type of DIG emission.
The breakdown of the distribution by Hubble type in Fig. 2 suggests that the bimodality is always present, but the proportion of the low- to high- populations shifts with morphology: early-type galaxies are overwhelmingly dominated by values around the Å peak, well within the hDIG regime, while in late-type spirals it is the higher population that dominates.
The radial dependence of the distribution offers further insight. The second to last columns in Fig. 2 show that the hDIG population is evenly spread in for early-type galaxies, confirming earlier CALIFA-based studies by Kehrig et al. (2012), Singh et al. (2013), and Gomes et al. (2016b), as well as the MaNGA-based analysis by Belfiore et al. (2016, 2017). Among Sb and later type spirals, on the other hand, the hDIG is evidently concentrated in the central regions of galaxies. To put this in numbers, 82 per cent of the Å points in the 225 Sb or later type galaxies are located within HLR.
We interpret this higher incidence of hDIG zones in the central regions of galaxies as a corollary of the prevalence of old stellar populations in galaxy bulges. The ionizing photon budget in these retired bulges is dominated by HOLMES, as any relevant contribution from other sources would raise their observed to larger values.
Conversely, the low incidence of Å zones at large in spirals indicates that pure hDIG emission is not a statistically relevant component of the DIG that permeates the space between SF regions in galaxy disks. This is not meant as a general conclusion, as Fig. 2 itself suggests that HOLMES may explain a substantial part of the disc emission in Sa–Sab galaxies. Among Sb and later type systems, however, hDIG-dominated disc zones are rare.
The motivation to introduce the hDIG category is thus firmly rooted on both observational and theoretical arguments. This well-understood component of the DIG becomes dominant whenever old stellar populations are the most relevant source of ionizing photons.
We close this section by noting that experiments were carried out to investigate to which extent galaxy inclination affects the distributions depicted in Fig. 2. This was done by first eliminating E and S0’s and then splitting the sample into bins in minor-to-major axis ratio (measured as explained in de Amorim et al. 2017). No major effect is found. The only noteworthy trend identified is that for zones within HLR, the histograms tend to shift towards smaller (by –0.3 dex on the median) as one goes from edge-on to face-on viewing angles, a tendency that is understood as a simple projection effect. While face-on views of these inner regions sample the bulge, with its characteristic hDIG emission, as the inclination increases, parts of the disc and get projected upon the bulge, resulting in a mixture of hDIG and SFc zones. Thus, as for the Voronoi binning effects discussed above, inclination effects do not erase the fundamental dichotomy between these two nebular regimes.
3.3 Identification of hDIG, mDIG, and SFc components
Unlike the low- regions, which can be safely associated with an hDIG regime, zones belonging to the high- population cannot be unequivocally tagged as SFc. Sure enough, SFc are among those with Å, but this population includes other processes too. In particular, diffuse gas powered by ionizing radiation leaking from H ii regions is also part of this population, with a ratio of ionizing photons per unit stellar mass leading to values above those typical of the HOLMES-dominated regime.
Though the whole Å population ultimately comprises a mixture of regimes, it is useful to sub-divide it into mDIG and SFc classes in order to identify zones where SF is comparatively more important. There is no conspicuous boundary that cleanly separates SFc from mDIG in terms of , however. Indeed, the continuous, unimodal behaviour of the Å population in Fig. 2 is not suggestive of sub-populations, but of a continuous distribution. In the absence of a clear-cut criterion, we place the mDIG/SFc division at Å, coinciding with the peak of the high population in the histograms in Fig. 2.
Our final hDIG/mDIG/SFc classification scheme thus becomes
-
•
hDIG: ,
-
•
mDIG: ,
-
•
SFc: .
The reader should take note of a marked conceptual asymmetry in these definitions. While the mDIG/hDIG frontier at 3 Å is based on a firm theoretical understanding of the nature of the hDIG population, fully corroborated by the bimodal distribution of , nothing of the sort can be said about the mDIG/SFc division. All that can be said about regions above the Å limit is that they have a higher proportion of SFc than those below it. This scheme should thus be used with the understanding that our mDIG regions may well host some star formation, and that Å does not isolate pure SF regions. Bona fide giant H ii regions, those that are the basis of any emission-line study of galaxies, have an order of magnitude larger (McCall et al., 1985; Garnett & Shields, 1987; Kennicutt & Garnett, 1996; Luridiana & Peimbert, 2001; Bresolin et al., 2004), but these are heavily diluted at our resolution.
The rightmost panels in Fig. 1 show maps with a colour scheme designed to saturate at and Å. hDIG regions are thus depicted in red and SFc ones in blue, with intermediate colours used to trace the 3–14 Å mDIG range. The S0 galaxy at the top of the plot exemplifies the dominance of the hDIG component amongst early-type galaxies, as previously inferred from their histograms in Fig. 2. The prevalence of this same component in bulges is also illustrated in this figure, particularly in the cases of CALIFA 0886 (NGC 7311) and 0010 (NGC 0036). As expected, SFc become increasingly important as one moves down the Hubble sequence (top to bottom in Figs. 1 and 2).
The reader is referred to Sánchez et al. (2015) for an example of a map obtained under much higher spatial resolution. Their MUSE-image of the spiral galaxy NGC 6754 shows a plethora of SFc, embedded in a smoother medium with mDIG-like values that permeates the whole disc.
4 Discussion
The theoretically and empirically inspired set of criteria to identify hDIG, mDIG, and SFc in galaxies serves a variety of purposes. In this section, we apply them to our CALIFA data with the specific goals of (i) estimating the relative strengths of hDIG, mDIG, and SFc components in galaxies across the Hubble sequence (Section 4.1), (ii) studying the nature of extraplanar diffuse line emission in edge-on systems (Section 4.2), (iii) comparing results obtained with our method with those derived with a -based SF/DIG separation scheme (Section 4.3), (iv) investigating the possibility of differentiating SF and DIG regimes with density-sensitive line ratios (Section 4.4), (v) testing the consistency of our criteria with a classical diagnostic diagram analysis (Section 4.5), and (vi) investigating the mDIG mixture (Section 4.6). We close with a discussion of caveats involved (Section 4.7).
4.1 The relative strengths of the hDIG, mDIG, and SFc components
One of the questions that can be addressed with the classification proposed above is what are the relative strengths of the hDIG, mDIG, and SFc components, and how these proportions vary as a function of Hubble type. This issue bears on the interpretation of properties derived through spatially unresolved spectroscopic data, where these components cannot be separated, like for galaxies at high redshifts, for example.
A simple and observationally relevant way to quantify this is to compute the fractional contribution of each component to the total H flux of a galaxy. For the galaxies in Fig. 1, for instance, these fractions range from for the S0 galaxy CALIFA 0072, to for the Sb galaxy CALIFA 0010, and for CALIFA 0813, an Sbc. This steady progression along the Hubble sequence reflects the tendencies seen in Fig. 2, where the values of are given in each panel, along with the histogram, for different radial regions and morphological types.
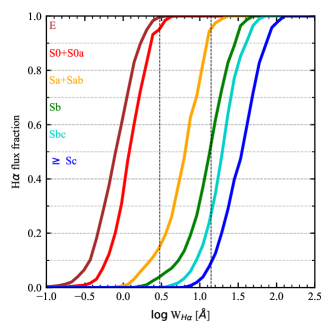
Fig. 4 presents these fractions for the whole sample in a more elaborate way. For each galaxy, we compute the cumulative fraction () of the total H flux coming from zones with smaller than a given value. The resulting growth curves yield not only the fractions, but a more continuous depiction of the makeup of a galaxy’s H output in terms of . The figure shows the median curves obtained for each of our six bins in Hubble type. Vertical dashed lines mark the hDIG/mDIG and mDIG/SFc frontiers at 3 and 14 Å respectively.
The steady progression from early to late types confirms the expectation from their distributions (Fig. 2), and allows us to quantify the relative importance of each component to the total H flux. Ellipticals and S0’s have nearly all of their H in the hDIG phase ( Å). Among Sa–Sab systems, this component accounts for of H, with mDIG emission contributing most of the remaining flux. From Sb onwards, the SFc fraction is 50 per cent or larger. Note that these fractions reflect the median behaviour. Naturally, there is substantial scatter from galaxy to galaxy even for a fixed morphological class.
DIG fractional contribution to H fluxes has been estimated in several previous studies based on narrow-band (H + [N ii]) imaging (Ferguson et al., 1996; Zurita et al., 2000; Thilker et al., 2002; Oey et al., 2007), with results varying substantially due to differences in the methodology to separate the DIG emission. The largest study to date is that by Oey et al. (2007), who estimate a mean DIG fraction of among 109 galaxies in the SINGG survey (Meurer et al., 2006). For our sample and definitions, we find a very similar DIG (mDIG + hDIG) fraction of 56 per cent, but a larger dispersion ( per cent). Unlike in our study (Fig. 4), they find no evidence for a correlation with Hubble type, a difference that may be due to sample selection criteria and methodology to define DIG/SF.
4.2 Edge-on systems: the nature of extraplanar line emission
Edge-on galaxies are important for the study of the DIG, as they exhibit a systematic behaviour of emission-line properties with height above the galactic discs (Tüllmann & Dettmar, 2000; Otte et al., 2002; Jones et al., 2017). The prototype galaxy is NGC 891, which has been extensively studied at all wavelengths (Rand, 1998; Hodges-Kluck & Bregman, 2013; Seon et al., 2014; Hughes et al., 2015). Many studies have emphasized that the observed properties of the extraplanar DIG in edge-on galaxies cannot be purely due to Lyman photons escaping from disc H ii regions. A variety of suggestions have been put forward: dissipation of turbulence (Minter & Spangler, 1997), magnetic reconnection (Raymond, 1992), shocks (Collins & Rand, 2001b), cosmic rays, photoelectric heating from interstellar dust grains (Weingartner & Draine, 2001), and Lyman photons from old stars (Flores-Fajardo et al., 2011).
CALIFA data can bring new insight into this problem. Fig. 5 shows SDSS images and our CALIFA H maps for five edge-on galaxies in our sample.333While CALIFA 0077, 0936, and 0811 are very nearly edge-on, CALIFA 0822 and 0791 have inclinations of and respectively. The latter two galaxies are nevertheless still useful in this analysis as long as one considers locations far from the disc plane. The layout is as in Fig. 1. The top four galaxies show a very similar structure in their maps, with SFc emission concentrated in the disc, where it is surrounded by mDIG. Above and below the plane, however, essentially all emission is hDIG-like. This provides strong support for the scenario of Flores-Fajardo et al. (2011) where the ionization becomes dominated by HOLMES at large galactic latitudes. Maps of standard diagnostic line ratios reinforce this conclusion, as illustrated in the MaNGA-based studies by Belfiore et al. (2016) and Zhang et al. (2017).
For the first time, we can relate this extraplanar DIG emission to the underlying stellar population. We do this by using the starlight results to compute the ratio (see Section 3.2). For hDIG regions in the top four edge-on galaxies in Fig. 5, we find a median value of 1.5, and an interquartile range from 1.1 to 1.9. Given the factor of –3 uncertainty in this estimate (CF11), the main conclusion here is that is of the order of 1, and thus that the old stellar populations in these regions produce enough eV photons to explain the observed extraplanar H emission.
Face-on views of these same galaxies would project the extraplanar hDIG on top of a predominantly SFc + mDIG disc. For a constant H emissivity, the ratio of face-on to edge-on equals the ratio between height and radius of the extraplanar hDIG layer. In the edge-on examples in Fig. 5, the extraplanar hDIG has of the order of a few times kpc-2. For , this is also the expected face-on surface brightness of this component. This is much smaller than the of SFc in the face-on systems shown in Fig. 1, so that the projected extraplanar emission has a negligible effect. Some mDIG regions, however, have values not much larger than kpc-2, and thus could carry a non-negligible contribution from extra-planar hDIG.
The galaxy in the bottom row (CALIFA 0811, UGC 10043) differs from the others in Fig. 5 in having much more SFc along its disc, as well as SFc-like extra-planar emission over the disc, and a bipolar cone of intermediate values centred in the nucleus. This galaxy has been recently studied by López-Cobá et al. (2017), who find the emission-line ratios and kinematics along the biconical structure to be consistent with a galactic wind powered by a central SF event. This combination of shock ionization and the widespread SF along its disc explains why there are so little signs of hDIG emission in this galaxy, although it is curious that does drop close to hDIG values in the inner parts of the bicone.
4.3 Comparison with -based SF/DIG separation schemes
Despite its conceptual advantages insofar as distinguishing different nebular regimes is concerned, contains in its numerator, so one may think that criteria based on these two variables may end up producing similar results. The maps in Fig. 1 show that structures like SF arms are indeed similarly traced by and , but others are not. Most notably, always peaks in the central regions of galaxies while, for early-type galaxies, shows clear dips.
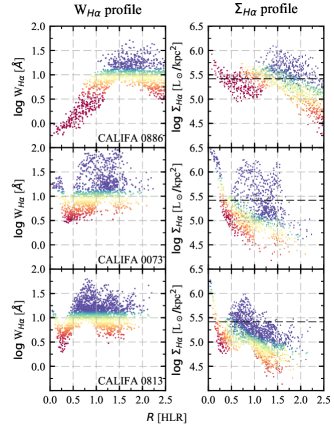
Fig. 6 examines this issue by means of radial profiles for CALIFA 0886, 0073, and 0813, three of the examples in Fig. 1. (For more examples of profiles see Papaderos et al. 2013; Belfiore et al. 2016, 2017; Gomes et al. 2016b; González Delgado et al. 2016.) The left- and right-hand panels plot and against , respectively. Both are coloured by using the same colour scheme of previous plots.
CALIFA 0886 is a good example of the many galaxies that show low-, hDIG-dominated emission in their central regions, yet a peak in . The reason why these retired bulges appear brighter than the surrounding disc is the much higher concentration of HOLMES in the bulge. This geometrically enhanced H emission can be erroneously attributed to SF with an SF/DIG criterion based on . As seen in the top-right panel, the inner regions of this galaxy cross the erg skpckpc-2 threshold claimed to ‘select reliable H ii region dominated spaxels’ according to Zhang et al. (2017). Yet, their of Å are firmly in the hDIG regime. The criterion thus correctly identifies the bulge of this and other galaxies as retired, while a criterion would interpret them as bright, SF regions.
Throughout most of the disc of CALIFA 0886, the Zhang et al. (2017) -based SF/DIG criterion agrees with the nebular regime identified via . This agreement is only partial in CALIFA 0073 (central panels in Fig. 6), where we find more disc SF regions with than with , and even more so in CALIFA 0813 (bottom panels), where most Å zones fall below the threshold. These differences stem from the contrasting radial behaviours of and . For a fixed , the highest ’s tend to be located in central regions, while, in contrast, for a fixed , the largest values of are generally found in the outskirts. Indeed, as seen in the examples in Fig. 6, tends to decrease outwards while remains roughly constant, both with large dispersions at any given in the disc. About 37 per cent of our SFc spaxels have erg skpc-2. On average, these faint SF regions are at HLR from the centre.
In summary, compared to the hDIG/mDIG/SFc separation criteria proposed in this paper, a -based criterion tends to overestimate the population of SF regions at low and underestimate it at large . More worryingly, as already mentioned, by itself cannot identify the hDIG component, the main source of H emission in old spheroids. In fact, we have seen that retired bulges may be mistaken for their very opposite when bright enough to exceed .
Previous CALIFA-based studies by Kehrig et al. (2012), Singh et al. (2013), and Gomes et al. (2016b) also find values in excess of the limit of Zhang et al. (2017) in the inner regions of early-type galaxies, where the absence of young stars is beyond dispute (see also Sarzi et al. 2010 for results based on the SAURON survey). These examples are the observational realization of the DIG + DIG = SF conceptual inconsistency pointed out in Section 3.1. The -based scheme presented in this paper solves this problem by extending to spatially resolved data the concept of retired galaxy proposed by Stasińska et al. (2008) and CF11 in the context of integrated galaxy spectra.
4.4 Can the DIG be detected with density-sensitive line ratios?
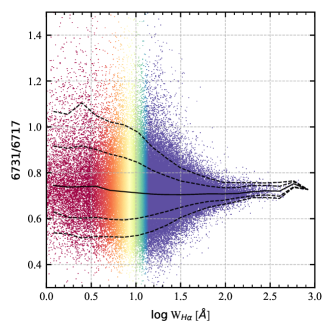
The electron densities in the Milky Way DIG obtained from dispersion measures and H i column densities towards pulsars at known distances are typically less than cm-3 (Berkhuijsen & Fletcher, 2008), orders of magnitude smaller than those of H ii regions. One could then expect that the density-sensitive [S ii]6731,6716 line ratios in our data would indicate smaller densities in the DIG than in SFc, and show a tendency with . Fig. 7 plots the [S ii] 6731/6716 flux ratio as a function of (only zones where in the [S ii] ratio are plotted). The median and the and percentiles curves are overplotted. We find no trend of [S ii] 6731/6716 with . The increase in scatter towards lower is consistent with the corresponding decrease in the of the lines. In essence, [S ii] 6731/6716, in regions where this ratio can be safely measured, is everywhere consistent with its low density limit of 0.7. Of course, this figure cannot say anything about regions where .
The reason why the [S ii] line ratio is not substantially different in the DIG zones where it can be measured and in the SFc is twofold: first, at our resolution, SFc contain a significant amount of diffuse gas. Secondly, the [S ii] line ratio is not sensitive to densities below cm-3.
One could expect to obtain a different picture if using a line doublet sensitive to lower electron densities, like the far-infrared doublet [N ii]205, 125m. Recent observations have allowed one to map this ratio in the Milky Way and several galaxies (Goldsmith et al., 2015; Herrera-Camus et al., 2016). The derived densities range between 1 and 300 cm-3, with a median value of 30 cm-3, and do not get anywhere close to the DIG densities obtained from pulsar measurements.
Classical density estimators are thus not able to detect the DIG, at least not at the resolution of CALIFA and similar surveys. However, it is not clear whether they would do a better job at higher spatial resolution, since, as noted by Rubin (1989) in another context, density inhomogeneities severely hamper any quantitative interpretation of such density-sensitive line ratios.
4.5 and the BPT diagram
The different ionization and heating conditions in hDIG, mDIG, and SFc should lead to different collisional-to-recombination line flux ratios, and thus to different loci on diagnostic diagrams like [O iii]5007/H versus [N ii]6584/H. This famous BPT diagram (after Baldwin, Phillips & Terlevich, 1981) is widely used to separate SF galaxies from those where harder ionizing sources contribute significantly to the ionization of the gas. It is thus legitimate to ask whether our -based scheme is consistent with this independent way of characterizing the nebular regime.
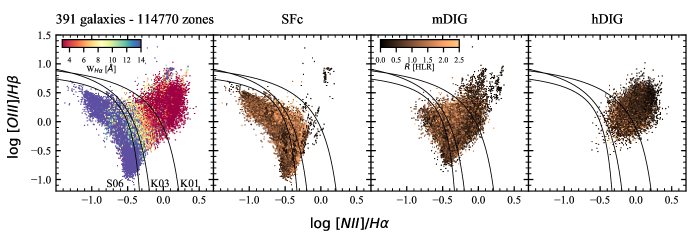
Fig. 8 shows BPT diagrams obtained from all zones in our sample where in all four lines involved. The top-left panel shows results for the entire sample, colouring points according to following the scheme used for the right-hand panels in Fig. 1, which saturates at Å (blue) and Å (red). The curves correspond to the demarcation lines proposed by Stasińska et al. (2006, S06), Kauffmann et al. (2003, K03), and Kewley et al. (2001, K01) – see CF11 for a discussion of the meaning of these curves.
The strong correspondence between and the BPT coordinates is evident to the eye, as previously noted by Morisset et al. (2016) for CALIFA data and Belfiore et al. (2016) for MaNGA. The left wing is predominantly populated by SFc, while hDIG regions populate the tip of the right wing, with mDIG regions in between. This correspondence is further confirmed in the right-hand panels in Fig. 8, which separate SFc, mDIG, and hDIG zones according to our criterion, with points coloured by their radial distance to the nucleus. Deviant points are concentrated in the inner regions of galaxies (red–orange points), where some high- SFc or mDIG zones intrude into a region in the BPT diagram otherwise dominated by hDIG emission. These outliers come from AGN in our sample, as discussed in Section 4.7.
Fig. 8 thus makes a visually compelling case for our -based SFc/mDIG/hDIG separation scheme. Translating this impression to numbers, and restricting the analysis to HLR, 58 (92) per cent of our Å zones are in the SF region of the BPT diagram according to the S06 (K03) criterion. The relatively large number of zones trespassing the S06 line is not surprising if one recalls that this curve was derived on the basis of photoionization models designed to establish the boundaries of pure SF regions in the BPT plane. As reiterated several times in this paper, at the resolution of CALIFA, our SFc are nowhere near pure H ii regions, but include plenty of diffuse emission, which enhances both line ratios in the BPT diagram.
We thus conclude that our SFc/mDIG/hDIG separation scheme leads to diagnostic line ratios that are qualitatively consistent with what one expects for these nebular regimes. In conjunction with the conceptual and empirical arguments presented in Section 3, this adds further strength to our methodology.
4.6 The mDIG as an SF+hDIG mixture
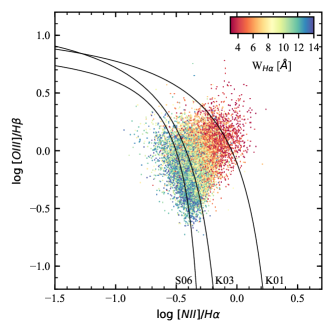
Fig. 8 shows that mDIG zones straddle the region between the classical SF wing and the loci of hDIG zones in the BPT diagram, a behaviour that lends itself to an interpretation in terms of a mixture of SFc and hDIG emission. This behaviour is better appreciated in Fig. 9, which shows the mDIG points coloured according to . To mitigate potential contamination by AGN-affected zones, only points at HLR ( kpc on average) are shown.
The same steady progression in along the right wing seen in the top-left panel of Fig. 8 is also seen in Fig. 9, suggesting that the mDIG component may be described as a mixture of SFc and hDIG emission. That the mDIG is interpretable as a mixture of processes is of course just what one would expect. The large population of mDIG zones approaching the Å threshold and whose BPT coordinates overlap with those of SFc probably correspond to the leakage scenario. Above the SF wing in the BPT diagram, the main ionization process is likely still due to young, massive stars, but the influence of the heating due to HOLMES increases gradually as decreases. When approaches the Å hDIG regime, the ionizing field of HOLMES starts dominating the photoionization budget too.
4.7 AGN and other caveats
Our whole hDIG/mDIG/SFc classification scheme ignores other mechanisms of line production, most notably AGN. AGN are found in the central parts of some galaxies and recognized as such through the BPT diagram. For example, the cluster of blue ( Å) points at the tip of the right wing of the BPT in Fig. 8, at coordinates come from the central regions of CALIFA 0897 (UGC12348), a known type 2 Seyfert (Cusumano et al., 2010; Asmus et al., 2014). Other Å outliers in BPT loci otherwise dominated by hDIG zones also tend to be located at small (reddish points in the central panels of Fig. 8).
AGN may also power line emission well outside the nucleus (up to distances as large as 20 kpc; Veilleux et al., 2003). These are the so-called extended emission-line regions (EELRs) or ionization cones. They can be due either to photoionization by X-ray photons leaving the AGN with a small opening angle or to an interaction between radio jets and the galaxy ISM producing strong shocks (Wilson, 1996). However, in the framework of the present study, which is to evaluate the importance of the DIG in galaxies and pinpoint its different regimes, EELRs in Seyfert galaxies are a secondary issue, as they affect only specific zones of galaxies with a well-defined AGN – and perhaps not all of them. Understanding the EELRs is a topic in itself, which indeed can be tackled with sensitive 3D spectroscopy, and some recent studies already started doing so (e.g., Dopita et al., 2014), but it is outside the scope of the present paper.
Another line-producing process neglected in this study is shocks. In the case of the galactic wind in CALIFA 0811, shown in Fig. 5, we find –12 Å in the shocked region, i.e., mDIG-like values. Again, by itself cannot identify the shock origin of the nebular emission, though it at least tells that photoionization by HOLMES is not an energetically feasible explanation. Only a detailed study of the geometry, line ratios, and kinematics can fully reveal the processes governing line emission in objects like this (Kreckel et al., 2014; Beirão et al., 2015; López-Cobá et al., 2017).
Because of their relative rarity and spatial constraints, these processes do not affect much the hDIG/mDIG/SFc statistics found in this study. They should nevertheless be taken into consideration in studies of individual sources.
Finally, a word of caution about the so-called composite region in the BPT diagram, commonly defined as the zone below the K01 line and above the K03 or S06 line. Though this region is usually thought to correspond to SF + AGN mixtures, AGN and hDIG have indistinguishable line ratios. It is therefore not a priori clear what this composite region is composed of!
The way to break this degeneracy is through . Given that (unlike AGN or SF) old stars are everywhere in galaxies, one should understand the hDIG regime as a floor level of ionization, one that is only energetically relevant when no other source is. Whenever the stellar continuum around H is dominated by old stars (which is the case even in SF regions at kpc resolution), the direct scaling between the optical continuum and the ionizing fluxes of the corresponding HOLMES population leads to –2 Å according to current evolutionary population synthesis models (see CF11 and references therein). Thus, composite spectra where approaches this limit likely represent an SFc + hDIG mixture. Conversely, as long as is above the hDIG range, an SF + AGN mixture is more plausible.
The Davies et al. (2014) study illustrates this point. Using the CALIFA data cubes of two type 2 Seyferts (NGC 2410 and NGC 6394) and two other more ambiguous (Seyfert–LINER) cases (IC 0540 and NGC 6762), they identify approximately one-dimensional distributions in the BPT and other diagnostic diagrams, suggestive of SF + AGN mixing sequences. They however verified that in NGC 6762 the majority () of the spaxels have Å, so that the contribution of HOLMES cannot be ignored. NGC 2410 and NGC 6394, on the other hand, have central values well above the hDIG range, which makes the SF + AGN interpretation plausible. IC0540 has values in the mDIG-to-hDIG range, so that the interpretation is less clear, although they favour an SF + AGN scenario. The bottom line here is should be taken into account when studying composite systems in order to avoid confusing hDIG and AGN effects.
5 Summary
We have used data cubes from the CALIFA survey to investigate the origin of the line emission in over 300k zones of 391 galaxies across the Hubble sequence. Studies based on integrated galaxy data like the SDSS give great emphasis on determining whether or not a galaxy hosts an AGN. In a sample of spaxel spectra like ours, however, a more relevant question is whether the ionization is locally dominated by photons arising from massive stars (either in bona fide H ii regions or in diffuse regions surrounding them) or by photons arising from old stellar populations. This has been the focus of our study.
We have shown that the commonly adopted method to separate DIG from SF regions on the basis of the surface brightness of H () is conceptually flawed, and that the H equivalent width () is more suitable to distinguish the qualitative differences between these regimes. Moreover, and perhaps more importantly, further allows us to confidently identify the cases where the line emission is predominantly powered by HOLMES, an omnipresent population that provides a floor level of ionizing radiation in galaxies.
The observed distribution of within and among galaxies was used to propose a classification scheme. Zones where Å are attributed to a HOLMES-ionized gas (hDIG) component, responsible for the Å peak in the strongly bimodal distribution of . This observational definition of hDIG is identical to the one for retired galaxies. In the absence of any (astro)physically motivated argument, we have defined the concept of SFc as regions where Å, the mode of the high- population in our sample. Regions where falls in the 3–14 Å intermediate range are tagged as having a mixed nature (mDIG).
Some of the main results obtained with this empirically and theoretically motivated scheme are as follows.
-
1.
In agreement with their predominantly old stellar populations, the hDIG is the main nebular regime in early-type galaxies (E and S0) and in bulges.
-
2.
The extraplanar emission in edge-on spirals is also of hDIG type, vindicating the scenario put forward and elaborated by Flores-Fajardo et al. (2011). In face-on systems, this extraplanar hDIG makes a negligible contribution when projected over SFc, but a potentially relevant one when projected on to regions classified as mDIG.
-
3.
A -based SF/DIG separation scheme tends to classify hDIG-dominated retired bulges as SF, an inconsistency that is ultimately due to the extensive nature of . In addition, faint SF regions tend to be misclassified as DIG with a criterion.
-
4.
The hDIG, mDIG, and SFc contributions to the H luminosity vary in a systematic way along the Hubble sequence, ranging from per cent in ellipticals and S0’s to per cent in Sa–Sb’s and per cent in later types.
-
5.
SFc and hDIG regions occupy characteristic loci on the BPT diagram. mDIG regions form a continuous sequence between SFc and hDIG line ratios, indicative of an mDIG = SFc + hDIG mixture.
ACKNOWLEDGEMENTS
EADL, RCF, GS, and NVA acknowledge the support from the CAPES CsF–PVE project 88881.068116/2014-01. RGD acknowledges the support of CNPq (Brazil) through Programa Ciência sem Fronteiras (401452/2012-3). CALIFA is the first legacy survey carried out at Calar Alto. The CALIFA collaboration would like to thank the IAA-CSIC and MPIA-MPG as major partners of the observatory, and CAHA itself, for the unique access to telescope time and support in manpower and infrastructures. We also thank the CAHA staff for the dedication to this project. Support from the Spanish Ministerio de Economía y Competitividad, through projects AYA2016-77846-P, AYA2014-57490-P, AYA2010-15081, and Junta de Andalucía FQ1580.
References
- Asmus et al. (2014) Asmus D., Hönig S. F., Gandhi P., Smette A., Duschl W. J., 2014, MNRAS, 439, 1648
- Baldwin et al. (1981) Baldwin J. A., Phillips M. M., Terlevich R., 1981, PASP, 93, 5
- Bamford et al. (2008) Bamford S. P., Rojas A. L., Nichol R. C., Miller C. J., Wasserman L., Genovese C. R., Freeman P. E., 2008, MNRAS, 391, 607
- Barrera-Ballesteros et al. (2015a) Barrera-Ballesteros J. K., et al., 2015a, A&A, 579, A45
- Barrera-Ballesteros et al. (2015b) Barrera-Ballesteros J. K., et al., 2015b, A&A, 582, A21
- Beirão et al. (2015) Beirão P., et al., 2015, MNRAS, 451, 2640
- Belfiore et al. (2016) Belfiore F., et al., 2016, MNRAS, 461, 3111
- Belfiore et al. (2017) Belfiore F., et al., 2017, MNRAS, 466, 2570
- Berkhuijsen & Fletcher (2008) Berkhuijsen E. M., Fletcher A., 2008, MNRAS, 390, L19
- Binette et al. (1994) Binette L., Magris C. G., Stasińska G., Bruzual A. G., 1994, A&A, 292, 13
- Binette et al. (2009) Binette L., Drissen L., Ubeda L., Raga A. C., Robert C., Krongold Y., 2009, A&A, 500, 817
- Bresolin et al. (2004) Bresolin F., Garnett D. R., Kennicutt Jr. R. C., 2004, ApJ, 615, 228
- Brinchmann et al. (2004) Brinchmann J., Charlot S., White S. D. M., Tremonti C., Kauffmann G., Heckman T., Brinkmann J., 2004, MNRAS, 351, 1151
- Bruzual & Charlot (2003) Bruzual G., Charlot S., 2003, MNRAS, 344, 1000
- Bundy et al. (2015) Bundy K., et al., 2015, ApJ, 798, 7
- Cid Fernandes et al. (2005) Cid Fernandes R., Mateus A., Sodré L., Stasińska G., Gomes J. M., 2005, MNRAS, 358, 363
- Cid Fernandes et al. (2007) Cid Fernandes R., Asari N. V., Sodré L., Stasińska G., Mateus A., Torres-Papaqui J. P., Schoenell W., 2007, MNRAS, 375, L16
- Cid Fernandes et al. (2011) Cid Fernandes R., Stasińska G., Mateus A., Vale Asari N., 2011, MNRAS, 413, 1687
- Cid Fernandes et al. (2013) Cid Fernandes R., et al., 2013, A&A, 557, A86
- Collins & Rand (2001a) Collins J. A., Rand R. J., 2001a, ApJ, 551, 57
- Collins & Rand (2001b) Collins J. A., Rand R. J., 2001b, ApJ, 551, 57
- Cortijo-Ferrero et al. (2017a) Cortijo-Ferrero C., et al., 2017a, preprint, (arXiv:1706.01896)
- Cortijo-Ferrero et al. (2017b) Cortijo-Ferrero C., et al., 2017b, MNRAS, 467, 3898
- Cusumano et al. (2010) Cusumano G., et al., 2010, A&A, 524, A64
- Davies et al. (2014) Davies R. L., Kewley L. J., Ho I.-T., Dopita M. A., 2014, MNRAS, 444, 3961
- Dettmar (1990) Dettmar R.-J., 1990, A&A, 232, L15
- Doe et al. (2007) Doe S., et al., 2007, in Shaw R. A., Hill F., Bell D. J., eds, Astronomical Society of the Pacific Conference Series Vol. 376, Astronomical Data Analysis Software and Systems XVI. p. 543
- Dopita et al. (2014) Dopita M. A., et al., 2014, A&A, 566, A41
- Ferguson et al. (1996) Ferguson A. M. N., Wyse R. F. G., Gallagher III J. S., Hunter D. A., 1996, AJ, 111, 2265
- Flores-Fajardo et al. (2011) Flores-Fajardo N., Morisset C., Stasińska G., Binette L., 2011, MNRAS, 415, 2182
- Freeman et al. (2001) Freeman P., Doe S., Siemiginowska A., 2001, in Starck J.-L., Murtagh F. D., eds, Proc. SPIEVol. 4477, Astronomical Data Analysis. pp 76–87 (arXiv:astro-ph/0108426), doi:10.1117/12.447161
- García-Benito et al. (2015) García-Benito R., et al., 2015, A&A, 576, A135
- García-Benito et al. (2017) García-Benito R., et al., 2017, preprint, (arXiv:1709.00413)
- Garnett & Shields (1987) Garnett D. R., Shields G. A., 1987, ApJ, 317, 82
- Girardi et al. (2000) Girardi L., Bressan A., Bertelli G., Chiosi C., 2000, A&AS, 141, 371
- Goldsmith et al. (2015) Goldsmith P. F., Yıldız U. A., Langer W. D., Pineda J. L., 2015, ApJ, 814, 133
- Gomes et al. (2016a) Gomes J. M., et al., 2016a, A&A, 586, A22
- Gomes et al. (2016b) Gomes J. M., et al., 2016b, A&A, 588, A68
- González Delgado & Pérez (2000) González Delgado R. M., Pérez E., 2000, MNRAS, 317, 64
- González Delgado et al. (2005) González Delgado R. M., Cerviño M., Martins L. P., Leitherer C., Hauschildt P. H., 2005, MNRAS, 357, 945
- González Delgado et al. (2014) González Delgado R. M., et al., 2014, ApJ, 791, L16
- González Delgado et al. (2015) González Delgado R. M., et al., 2015, A&A, 581, A103
- González Delgado et al. (2016) González Delgado R. M., et al., 2016, A&A, 590, A44
- González Delgado et al. (2017) González Delgado R. M., et al., 2017, A&A, 607, A128
- Haffner et al. (2009) Haffner L. M., et al., 2009, Reviews of Modern Physics, 81, 969
- Herrera-Camus et al. (2016) Herrera-Camus R., et al., 2016, ApJ, 826, 175
- Hodges-Kluck & Bregman (2013) Hodges-Kluck E. J., Bregman J. N., 2013, ApJ, 762, 12
- Hoopes & Walterbos (2003) Hoopes C. G., Walterbos R. A. M., 2003, ApJ, 586, 902
- Hoopes et al. (1996) Hoopes C. G., Walterbos R. A. M., Greenwalt B. E., 1996, AJ, 112, 1429
- Hoopes et al. (1999) Hoopes C. G., Walterbos R. A. M., Rand R. J., 1999, ApJ, 522, 669
- Hughes et al. (2015) Hughes T. M., et al., 2015, A&A, 575, A17
- Husemann et al. (2013) Husemann B., et al., 2013, A&A, 549, A87
- Jones et al. (2017) Jones A., et al., 2017, A&A, 599, A141
- Kauffmann et al. (2003) Kauffmann G., et al., 2003, MNRAS, 341, 54
- Kehrig et al. (2012) Kehrig C., et al., 2012, A&A, 540, A11
- Kennicutt & Garnett (1996) Kennicutt Jr. R. C., Garnett D. R., 1996, ApJ, 456, 504
- Kewley et al. (2001) Kewley L. J., Dopita M. A., Sutherland R. S., Heisler C. A., Trevena J., 2001, ApJ, 556, 121
- Kreckel et al. (2014) Kreckel K., et al., 2014, ApJ, 790, 26
- López-Cobá et al. (2017) López-Cobá C., et al., 2017, MNRAS, 467, 4951
- Luridiana & Peimbert (2001) Luridiana V., Peimbert M., 2001, ApJ, 553, 633
- McCall et al. (1985) McCall M. L., Rybski P. M., Shields G. A., 1985, ApJS, 57, 1
- Meurer et al. (2006) Meurer G. R., et al., 2006, ApJS, 165, 307
- Minter & Spangler (1997) Minter A. H., Spangler S. R., 1997, ApJ, 485, 182
- Morisset et al. (2016) Morisset C., et al., 2016, A&A, 594, A37
- Oey et al. (2007) Oey M. S., et al., 2007, ApJ, 661, 801
- Otte et al. (2002) Otte B., Gallagher III J. S., Reynolds R. J., 2002, ApJ, 572, 823
- Papaderos et al. (2013) Papaderos P., et al., 2013, A&A, 555, L1
- Pérez et al. (2013) Pérez E., et al., 2013, ApJ, 764, L1
- Rand (1998) Rand R. J., 1998, ApJ, 501, 137
- Raymond (1992) Raymond J. C., 1992, ApJ, 384, 502
- Reynolds (1971) Reynolds R. J., 1971, PhD thesis, THE UNIVERSITY OF WISCONSIN - MADISON.
- Reynolds et al. (2001) Reynolds R. J., Sterling N. C., Haffner L. M., Tufte S. L., 2001, ApJ, 548, L221
- Rousseau-Nepton et al. (2017) Rousseau-Nepton L., Robert C., Drissen L., Martin R. P., Martin T., 2017, preprint, (arXiv:1704.05121)
- Rubin (1989) Rubin R. H., 1989, ApJS, 69, 897
- Sánchez et al. (2012) Sánchez S. F., et al., 2012, A&A, 538, A8
- Sánchez et al. (2014) Sánchez S. F., et al., 2014, A&A, 563, A49
- Sánchez et al. (2015) Sánchez S. F., et al., 2015, A&A, 573, A105
- Sánchez et al. (2016) Sánchez S. F., et al., 2016, A&A, 594, A36
- Sarzi et al. (2010) Sarzi M., et al., 2010, MNRAS, 402, 2187
- Seon et al. (2014) Seon K.-i., Witt A. N., Shinn J.-h., Kim I.-j., 2014, ApJ, 785, L18
- Singh et al. (2013) Singh R., et al., 2013, A&A, 558, A43
- Slavin et al. (1993) Slavin J. D., Shull J. M., Begelman M. C., 1993, ApJ, 407, 83
- Stasińska et al. (2006) Stasińska G., Cid Fernandes R., Mateus A., Sodré L., Asari N. V., 2006, MNRAS, 371, 972
- Stasińska et al. (2008) Stasińska G., et al., 2008, MNRAS, 391, L29
- Thilker et al. (2002) Thilker D. A., Walterbos R. A. M., Braun R., Hoopes C. G., 2002, AJ, 124, 3118
- Tremonti et al. (2004) Tremonti C. A., et al., 2004, ApJ, 613, 898
- Tüllmann & Dettmar (2000) Tüllmann R., Dettmar R.-J., 2000, A&A, 362, 119
- Vazdekis et al. (2010) Vazdekis A., Sánchez-Blázquez P., Falcón-Barroso J., Cenarro A. J., Beasley M. A., Cardiel N., Gorgas J., Peletier R. F., 2010, MNRAS, 404, 1639
- Veilleux et al. (2003) Veilleux S., Shopbell P. L., Rupke D. S., Bland-Hawthorn J., Cecil G., 2003, AJ, 126, 2185
- Vogt et al. (2017) Vogt F. P. A., Pérez E., Dopita M. A., Verdes-Montenegro L., Borthakur S., 2017, A&A, 601, A61
- Weingartner & Draine (2001) Weingartner J. C., Draine B. T., 2001, ApJ, 563, 842
- Wild et al. (2014) Wild V., et al., 2014, A&A, 567, A132
- Wilson (1996) Wilson A. S., 1996, Vistas in Astronomy, 40, 63
- York et al. (2000) York D. G., et al., 2000, AJ, 120, 1579
- Zhang et al. (2017) Zhang K., et al., 2017, MNRAS, 466, 3217
- Zurita et al. (2000) Zurita A., Rozas M., Beckman J. E., 2000, A&A, 363, 9
- de Amorim et al. (2017) de Amorim A. L., et al., 2017, MNRAS, 471, 3727