reception date \Acceptedacception date \Publishedpublication date
Stars: individual:IGR J16318–-4848 — binaries: general — X-rays: binaries
Glimpse of the highly obscured HMXB IGR J16318–4848 with Hitomi ††thanks: The corresponding authors are Hiroshi Nakajima, Kiyoshi Hayashida, Tim Kallman, Takuya Miyazawa, Hiromitsu Takahashi, and Matteo Guainazzi
Abstract
We report a Hitomi observation of IGR J16318–4848, a high-mass X-ray binary system with an extremely strong absorption of cm-2. Previous X-ray studies revealed that its spectrum is dominated by strong fluorescence lines of Fe as well as continuum emission. For physical and geometrical insight into the nature of the reprocessing material, we utilize the high spectroscopic resolving power of the X-ray microcalorimeter (the soft X-ray spectrometer; SXS) and the wide-band sensitivity by the soft and hard X-ray imager (SXI and HXI) aboard Hitomi. Even though photon counts are limited due to unintended off-axis pointing, the SXS spectrum resolves Fe K and K lines and puts strong constraints on the line centroid and width. The line width corresponds to the velocity of 160 km s-1. This represents the most accurate, and smallest, width measurement of this line made so far from any X-ray binary, much less than the Doppler broadening and shift expected from speeds which are characteristic of similar systems. Combined with the K-shell edge energy measured by the SXI and HXI spectra, the ionization state of Fe is estimated to be in the range of Fe I–IV. Considering the estimated ionization parameter and the distance between the X-ray source and the absorber, the density and thickness of the materials are estimated. The extraordinarily strong absorption and the absence of a Compton shoulder component is confirmed. These characteristics suggest reprocessing materials which are distributed in a narrow solid angle or scattering primarily with warm free electrons or neutral hydrogen. This measurement was achieved using the SXS detection of 19 photons. This provides strong motivation for follow-up observations of this and other X-ray binaries using the X-ray Astrophysics Recovery Mission, and other comparable future instruments.
1 Introduction
High-mass X-ray binaries (HMXBs) consist of a compact object (neutron star or black hole candidate) and a massive companion star that is typically a Be star or a supergiant O or B type star. HXMBs with Be companions often show periodic variability in X-ray flux when the compact object passes through a circumstellar decretion disk surrounding the star. Supergiant HMXBs exhibit X-ray time variability associated with eclipse, or partial eclipse, of the compact object by the companion star.
In addition to the comprehensive catalog of the galactic HMXBs by Liu et al. (2006), a recent deep survey in the hard X-ray and soft gamma-ray band performed by IBIS/ISGRI (Ubertini et al., 2003; Lebrun et al., 2003) onboard International Gamma-Ray Astrophysics Laboratory (INTEGRAL) (Winkler et al., 2003) has discovered a considerable number of HMXBs that are summarized in a catalog by Krivonos et al. (2017). More than half exhibit persistent time variability in the hard X-ray band (Lutovinov et al., 2013). One of the highlights of the survey is the discovery of a number of HMXBs that exhibit extraordinarily strong absorption with their distribution in the galaxy correlating with that of star forming regions (Bodaghee et al., 2012; Coleiro and Chaty, 2013). IGR J16318–4848 (hereafter IGR J16318) was the first discovered and remains the most extreme example of such objects.
IGR J16318 was discovered in the scanning observation of the Galactic plane by the INTEGRAL/IBIS/ISGRI (Courvoisier et al., 2003; Walter et al., 2003). Examination of archival ASCA data revealed extremely strong X-ray absorption toward the direction of the source (Murakami et al., 2003). The X-ray spectrum is dominated by Fe K, K, and Ni K fluorescence emission lines and continuum (Matt and Guainazzi, 2003; Revnivtsev, 2003). The fluorescence lines as well as the continuum vary on time scales of thousands of seconds, corresponding to an upper limit on the emitting region size approximately cm (Walter et al., 2003).
The optical/near-infrared (NIR) counterpart exhibits less absorption than that measured in the X-ray band, which implies that the absorbing material is concentrated around the compact object (Filliatre and Chaty, 2004; Lutovinov et al., 2005). The NIR spectroscopy suggests that the counterpart is a supergiant B[e] star (Filliatre and Chaty, 2004) based on the detection of forbidden lines of Fe. Such stars are also known to contain dust in their envelopes (Miroshnichenko, 2007); a mid-infrared observation revealed that it is surrounded by dust and cold gas with a heated inner rim (Chaty and Rahoui, 2012). The distance to the target was derived by Filliatre and Chaty (2004) based on fitting of the optical/NIR spectral energy distribution (SED) fitting to be 0.9–6.2 kpc. Rahoui et al. (2008) performed SED fitting from optical to mid-infrared band, and utilizing the known stellar classification of the companion star obtained a distance of 1.6 kpc.
Long term monitoring of the hard X-ray flux with Swift/BAT shows a periodicity of 80 d (Jain et al., 2009; Iyer and Paul, 2017). Although the companion star belongs to the spectral type of B[e], there is no obvious coincidence between numbers of outbursts and orbital phase (Jain et al., 2009). Monitoring in the soft and hard X-ray band shows that the source is always bright with flux dynamic range of a factor 5 and Compton thick ( 1.1 cm-2) (Barragan et al., 2010). The statistically best spectrum obtained with Suzaku (Mitsuda et al., 2007) shows no Compton shoulder, which implies a non-spherical and inhomogeneous absorber (Barragán et al., 2009). The average X-ray spectrum of the source exhibits a continuum typical for neutron stars (Walter et al., 2004). Moreover, the source shows disagreement in its X-ray/radio flux relationship with that observed in the low/hard state of black hole binaries (Filliatre and Chaty, 2004). Nevertheless, the nature of the compact source (neutron star or black hole candidate) is uncertain because pulsations have not been detected.
Hitomi, the Japan-led X-ray astronomy satellite (Takahashi et al., 2017), carried a microcalorimeter array (SXS; soft X-ray spectrometer) (Kelley et al., 2017) which had outstanding energy resolution in the energy band containing the Fe K-shell lines. Combined with an X-ray CCD camera (SXI; soft X-ray imager) (Tanaka et al., 2017) and a hard X-ray imager (HXI) (Nakazawa et al., 2017), it provided unprecedented wide-band imaging spectroscopy. Hitomi was lost due to an accident a month after the launch. The observation of IGR J16318 was performed during the instrument check-out phase to demonstrate the spectroscopic performance of Hitomi. In spite of offset pointing during the observation due to incomplete attitude calibration, it is possible to extract significant scientific results from the limited data.
In the remainder of this paper, we first describe the observation log including some notes on the data reduction in section 2. The imaging and spectroscopic analyses (section 3) are followed by the discussion (section 4) and summary (section 5). Measurement errors correspond to the 90 % confidence level, unless otherwise indicated.
2 Observation and data reduction
2.1 Observation
Pointing toward IGR J16318 started on 22:28 10th March 2016 UT and ended on 16:20 14th March 2016 UT. While the SXS and SXI were already in operation, the HXI was undergoing the startup procedure of one of the two sensors (HXI-1). Because the observation was performed before optimizing the alignment matrices of star trackers (STT1 and STT2), the target was at off-axis positions throughout the observation. The off-axis angle was \timeform5’ according to the SXI image after the switch of the STT from STT1 to STT2 on 17:58 13th March, which limit the effective area of all the instruments. The fields of view (FoV) of the SXS and HXI are \timeform3.05’ and \timeform9.2’ square, respectively. Therefore only the SXI caught the target securely within its FoV thanks to its large FoV of \timeform38’ square (Nakajima, 2017).
The microcalorimeter array in the SXS was already in thermal equilibrium at the time of our observation (Fujimoto et al., 2016; Noda et al., 2016). The energy resolution of the onboard radioactive 55Fe source was 4.9 eV full width half maximum (FWHM) as reported by Leutenegger et al. (2017). However, the SXS was not in the normal operation mode in terms of some calibration items as follows. The gate valve was still closed and hence the effective area in the soft energy band was limited. The Modulated X-ray Source (MXS; de Vries et al. (2017)) was also not yet available for contemporaneous gain measurement, which forces us to estimate the gain uncertainty only by onboard radioactive 55Fe sources.
The SXI was in normal operation with the ”Full Window + No Burst” mode (Tanaka et al., 2017). Temperature of the CCDs was already stable at C at the time of the exposure (Nakajima et al., 2017). The observation was carried out before optimizing the parameters for the dark level calculation and hence the SXI suffered from a cross-talk issue. That is, an anomalously low dark level can be induced in a pixel by a charged particle event in the adjacent segment. The dark level leads to continuous false events in the pixel and the erroneously higher pulse heights for the normal events around the pixel. To minimize the effect of the cross-talk issue, the lower threshold of the effective energy band was set to be 100 ch, which corresponds to 600 eV.
The HXI-1 completed its startup procedure and started observation on 21:30 12th March UT. The target came at the edge of the HXI-1 FoV after the switch of the STT. Another sensor HXI-2 was still undergoing increasing of the high voltage for the Si/CdTe double-sided strip detectors.
2.2 Data reduction
Hereafter, we concentrate on the data after the STT switch because event files of all the three instruments are available in the interval. We utilize the data cleaned and processed with a script version 03.01.005.005. All the reduction and analyses below employ the Hitomi software version 5b and the calibration database released on 11th May 2017 (Angelini et al., 2017) 111https://heasarc.gsfc.nasa.gov/docs/hitomi/calib/. The effective exposure times of the SXI, SXS, and HXI-1 are 39.4, 68.9, and 39.4 ks, respectively, after the data reduction.
2.2.1 SXS
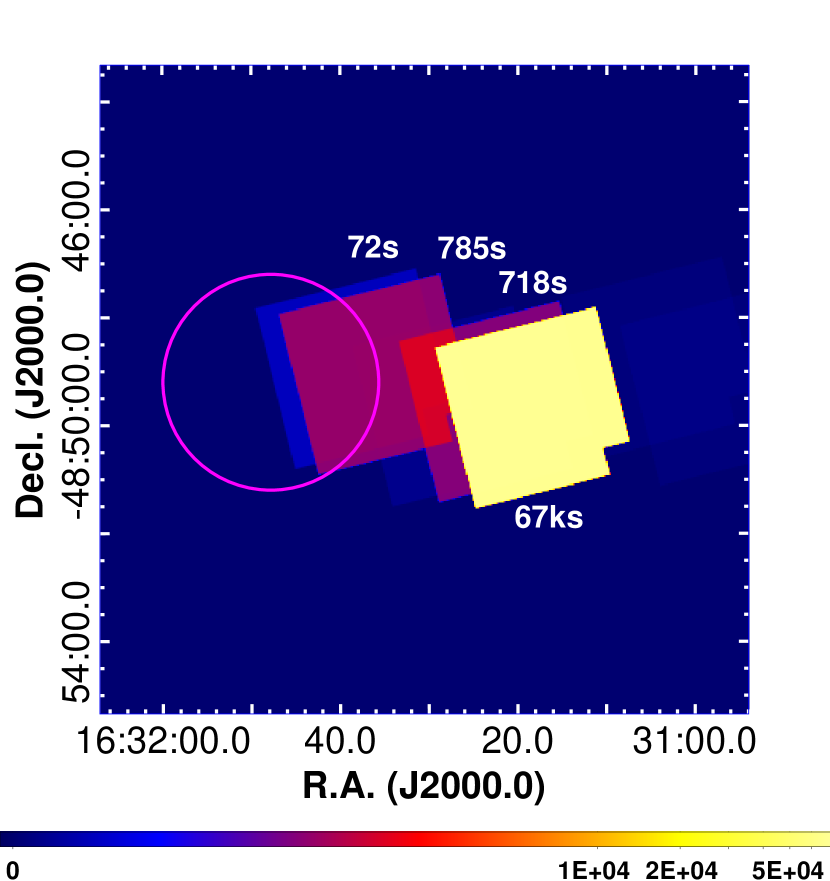
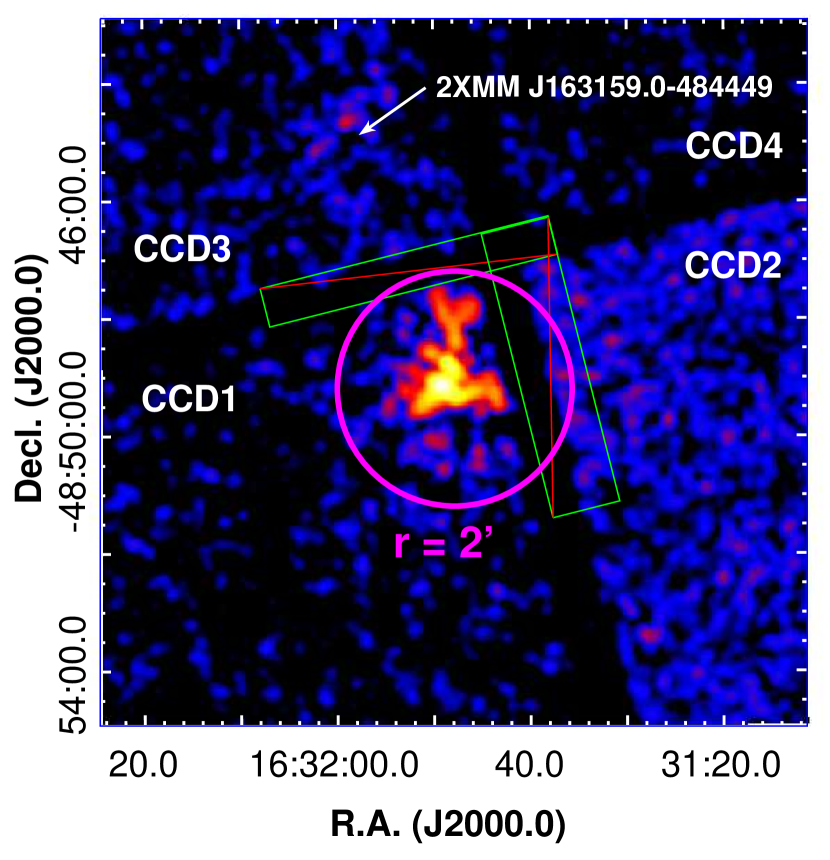
Owing to the shape of the point spread function (PSF) of the soft X-ray telescope (SXT-S; Maeda et al. (2017)), some photons from the target reached the SXS in spite of the off-axis pointing. Furthermore, there was a wobble of the satellite at the beginning of the observation, so that the optical axis of the SXT-S temporarily approached the target direction. Then a part of the FoV of the SXS overlapped with a photon extracting region for the SXI as shown in figure 1 top panel.
To retrieve photons from the target during the wobbling, we relax the standard screening criteria for the angular distance between the actual pointing and the mean pointing position (ANG_DIST) from \timeform1.5’ to \timeform4.0’. Besides the grade filtering in the standard screening, events flagged due to close proximity in time of 0.72 ms to other events are additionally filtered.
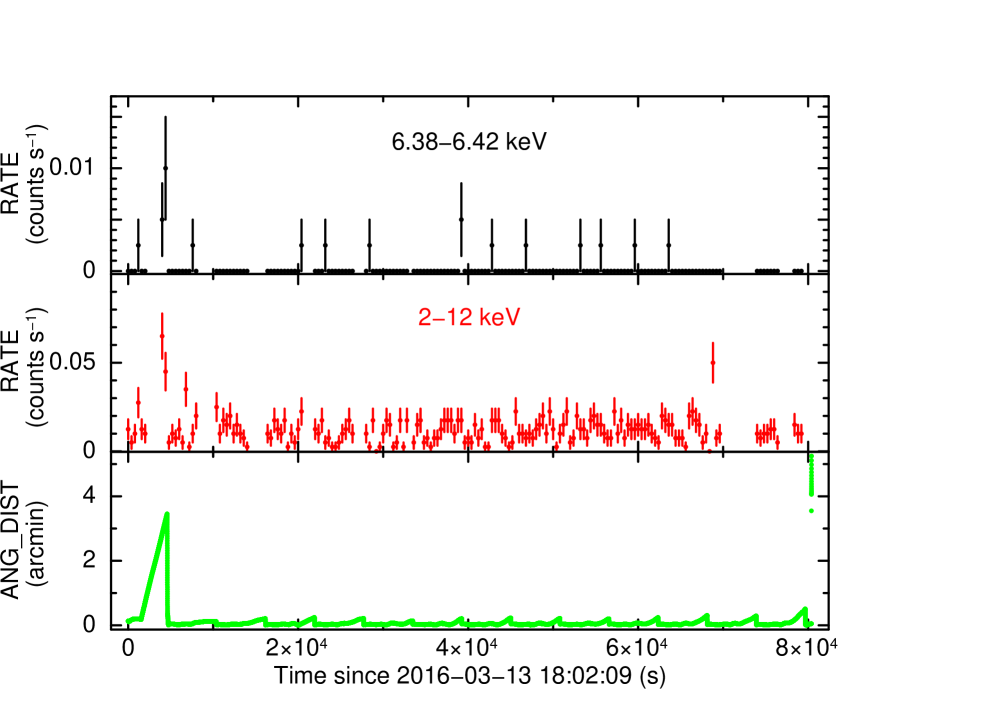
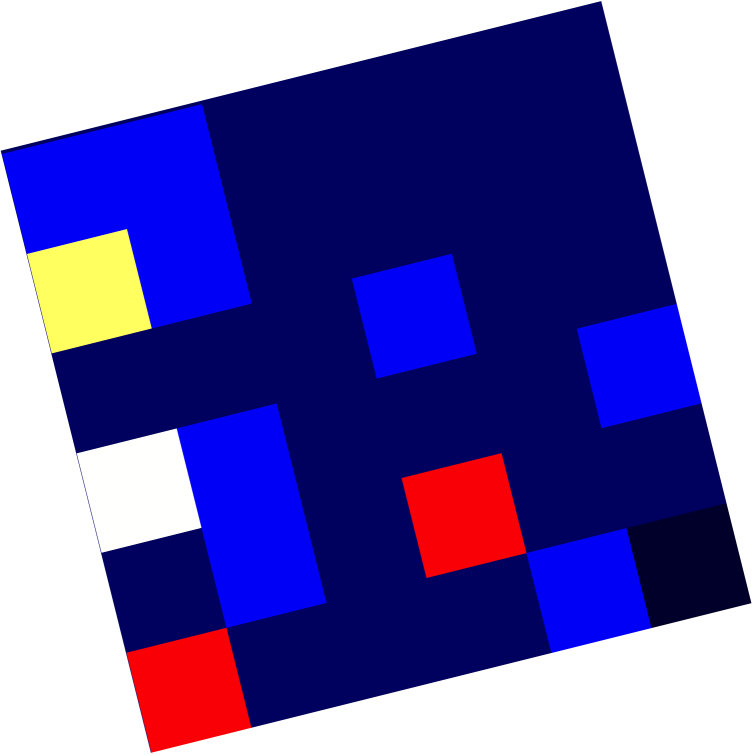
Figure 2 shows light curves around Fe K line, wide energy band as well as the history of the ANG_DIST. The events concentrate around the time of the wobbling in both energy bands. There is no bright celestial target around the direction where the satellite pointed at this time. No background flare events can be seen for other instruments around this time. Figure 1 bottom panel shows the spatial distribution of the events in the energy band from 6.38 to 6.42 keV. The 19 events spatially concentrate toward the target position. This provides strong indication that these events originate from the target.
2.2.2 SXI and HXI
With regard to the SXI data, false events originating from the cross talk issue are eliminated with the parameters in sxipipeline set as follows: of 6, of 15, and of 0.7 (Nakajima et al., 2017). The SXI also suffers from a light leak due to optical/infrared light primarily when the minus Z axis of the spacecraft points to the day earth (MZDYE). Although our observation was free from the MZDYE periods, there was another moderate light leak during the sun illumination of the spacecraft. We also see possible charges left inside the CCDs after the passage of the South Atlantic Anomaly (SAA) as described in Nakajima et al. (2017). The pulse heights of the events detected around the physical edge of the CCDs are weakly affected by these issues. The target was always near the physical edge of the CCD1 during the exposure. To minimize the effect of these problems, we choose only the data during the eclipse of the spacecraft and when the time after the passage of the SAA is larger than 1800 s (Nakajima et al., 2017). The pile-up fraction is estimated using pileest and the results is below 0.7% with a grade migration parameter of 0.1.
No additional filtering is applied to the HXI-1 cleaned event files.
3 Analyses
All the spectral analyses described below are performed using XSPEC v12.9.0u (Arnaud, 1996). We adopt the spectral model tbvarabs for the photoelectric absorption using the interstellar medium abundances described in Wilms et al. (2000).
3.1 SXS Spectral Analysis
The spectrum obtained with the SXS in the 2–12 keV band is shown in the top panel of figure 3. The events are summed over all the 35 pixels and their total number is 752. The concentrations of events near 5.9, 9.7 and 11.5 keV originate from the instrumental background lines of Mn K, Au L and L, respectively. Due to the limited statistics of the events, we focus on the spectral analysis around a peak at 6.4 keV that is magnified in the bottom panel of figure 3. Most of the events fall within 6.39–6.41 keV and the primary peak is slightly above 6.40 keV. This distribution corresponds to the Fe K and K lines.
We estimate the number of non-X-ray background (NXB) events (Kilbourne et al., 2017) included in the 6.4 keV line utilizing sxsnxbgen. This tool considers the magnetic cut-off rigidity (COR) weighting of the observation and extract events with identical filtering as the source data from the SXS archive NXB event file. Because the events in the energy band of 6.38–6.42 keV are detected in the specific pixels as shown in the bottom panel of figure 1, we only consider those pixels to calculate the NXB. The estimated NXB spectrum is overlaid on the source spectrum in the bottom panel of figure 3. The expected number of NXB counts in 6.38–6.42 keV range is 2 when we assume the same exposure time as the target.

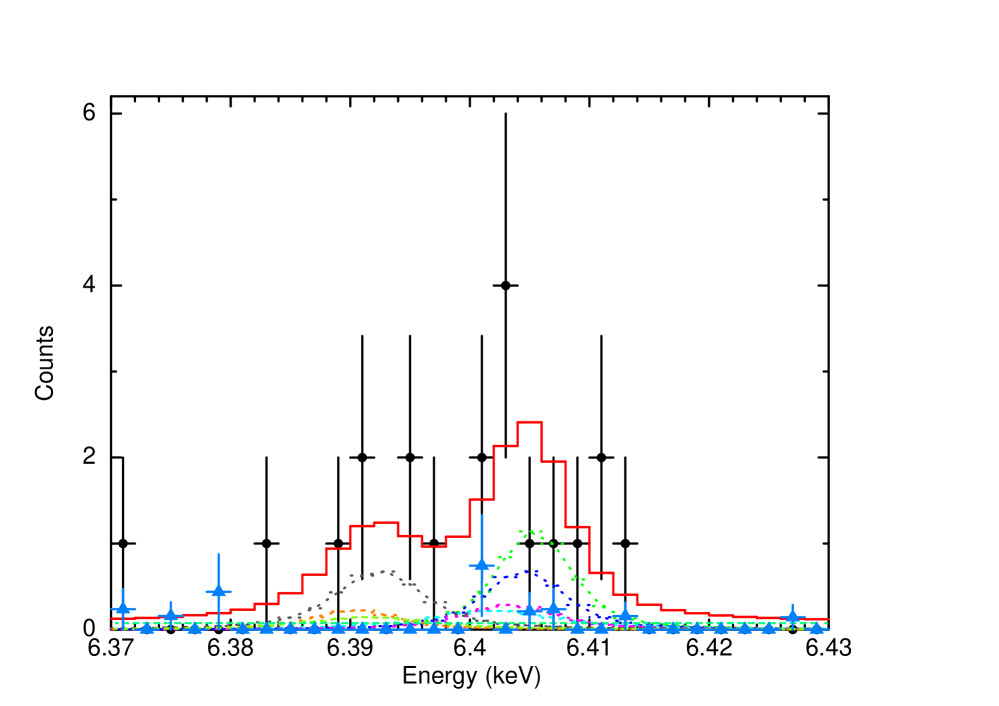
The K line centroid near 6.4 keV implies neutral or near-neutral ionization state of Fe. If so, the line should be modeled with Lorentzian functions (Agarwal, 1979) that analytically represent the natural shape of an emission line. It is well known that the K lines of the transition metals are highly asymmetric. Hölzer et al. (1997) applied seven Lorentzians to accurately represent the asymmetric K line from neutral Fe. We assume the near-neutral state and then adopt the best-fit parameters in Hölzer et al. (1997), which will be justified in section 4. The NXB spectrum is represented using a power-law model with its index fixed to zero. The power-law component is also included to the source spectrum with its parameters linked between the source and background. We set the following four parameters to be free: the energy at the maximum of the primary Lorentzian ( in Table II in Hölzer et al. (1997)), its width, the normalization factor commonly multiplied to all the seven Lorentzians, and the flux of the power-law component. The relative energy at the maximum of each Lorentzian is fixed as well as the relative width and amplitude. The continuum emissions from the target and the cosmic X-ray background are ignored from the statistical point of view. We adopt c-statistics (Cash, 1979) for the spectral fitting. The original 0.5 eV per bin source and background spectra are fitted while the binned spectra are shown in figure 3 for display purposes. The best-fit energy at the maximum of the primary Lorentzian is 6405.4 eV and its width is 3.5 eV (FWHM). This yields the Fe K line centroid of 6404.3 eV, a value which is remarkably similar with that of neutral Fe (6403.1 eV) measured by Hölzer et al. (1997).
Best-fit parameters for the SXS spectrum.
Parameter
Value
(eV)
6405.4
(FWHM in eV)
3.5
(10-4 cm-2 s-1)
2.4
0 (fixed)
(10-3 cm-2 s-1)
1.6
-
131.7 (234)
{tabnote}
Energy at the maximum of the primary Lorentzian
( in Table II in Hölzer et al. (1997)).
See text for a discussion of the probability
distributions for and .
To investigate the probability distribution function in the parameter space, we performed Markov Chain Monte Carlo simulations within XSPEC. We adopt a proposal distribution of a Gaussian for the chain with a length of 105. Considering the distribution, the energy at the maximum of the primary component and its width are estimated to be 6405.4 eV and 3.5 eV, respectively. The best-fit parameters for the spectral fit are summarized in table 3.1. This is the first observational result resolving Fe K and K lines for X-ray binary systems, which demonstrates the superb energy resolution of the microcalorimeter.
The accuracy of the energy scale of the SXS is affected by the instrumental gain uncertainty. There had been no on-orbit full-array gain calibration before the observation of IGR J16318. A later calibration using the filter-wheel 55Fe sources was carried out after changing several cooler power settings (Eckart et al. in preparation). Because the MXS was not yet available, a dedicated calibration pixel that was located outside of the aperture and continuously illuminated by a collimated 55Fe source served as the only contemporaneous energy-scale reference. The time-dependent scaling required to correct the gain was applied to each pixel in the array. It was known prior to launch that the time-dependent gain-correction function for the calibration pixel generally did not adequately correct the energy scale of the array pixels. The relationship between changes of the calibration pixel and of the array was not fixed, but rather depended on the temperatures of the various shields and interfaces in the dewar. Therefore, although the relative drift rates across the array were characterized during the later calibration with the filter-wheel 55Fe source, the changes in cooler power settings between the IGR J16318 observation and that calibration limit the usefulness of that characterization. In fact, the measured relative gain drift predict a much larger energy-scale offset between the final two pointings of the Perseus cluster of galaxies than was actually observed.
To overcome our limited ability to extrapolate from the calibration pixel, we examined the whole-array Mn K instrumental line (Kilbourne et al., 2017) in source-free data taken from 7th March to 15th March, when the SXS was being operated with the same cooler settings (Tsujimoto et al., 2017) as those in the IGR J16318 observation. The SXS energy scale is found to be shifted by at most +1 0.5 eV at 5.9 keV. Further insight into the gain uncertainty comes from examining the errors in the Mn K position in the filter-wheel 55Fe data after adjusting all the pixels gain scales based on the Mn K line. The errors ranged within –+0.2 eV, which indicate the minimum scale of the gain uncertainty at 6.5 keV. We conclude that the gain shift with uncertainty of the line centroid of Fe K, which is between the Mn K and K lines, is +1 0.5 eV at the time of the observation of IGR J16318.
3.2 SXI and HXI Analysis
The SXI image in the energy band from 4.0 to 12 keV is shown in figure 4. This shows the only additional X-ray source in the FoV, based on the 2XMMi-DR3 catalog (Lin et al., 2012). Note that the additional filtering of the sun illumination of the spacecraft and the time after the passage of the SAA is not applied to the image because the filtering has only a small effect on the pulse height of each event. Another note is that the PSF shape of the target is not smooth because some pixels are affected by the cross-talk issue (Nakajima et al., 2017) and have been filtered. In spite of the unintended off-axis pointing, the target was securely in the CCD1. Photon extracting regions are drawn with a magenta circle.
The hard X-ray image obtained by the HXI-1 in the energy band from 5.5 to 80 keV is shown in figure 5. The circular region in magenta designates the same region as that in figure 4. Thanks to the moderate PSF of the hard X-ray telescope (Awaki et al., 2016), a number of events were detected even though the target is just on the edge of the FoV. The source and background spectra are extracted from the regions colored in yellow with solid and dashed lines, respectively.
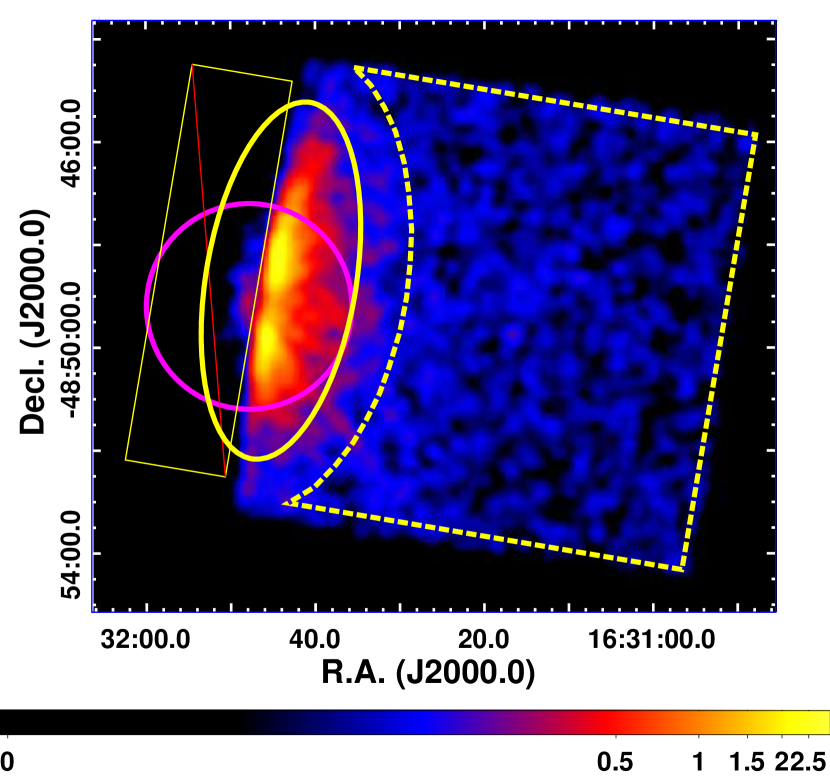
Figure 6 shows the light curves of the SXI and HXI-1 extracted from the source regions designated in figure 4 and figure 5, respectively. Background is not subtracted and aspect correction is not applied. Barycenter and dead time correction are applied for the HXI-1 data prior to the extraction. Note that the additional filtering of the sun illumination of the spacecraft and the time after the passage of the SAA is not applied for the SXI light curve because the filtering has only a small effect on the pulse height of each event. The event rate in the energy band dominated by fluorescence lines and continuum both exhibit time variability on a time scale of thousands of seconds, which is also seen in the previous observations (Ibarra et al., 2007; Barragán et al., 2009). The root mean square fractional variation of the continuum band is 0.34 0.03 (HXI-1) and 0.17 (3) (SXI), while that of the fluorescence line band is 0.25 (HXI-1) and 0.15 (SXI).

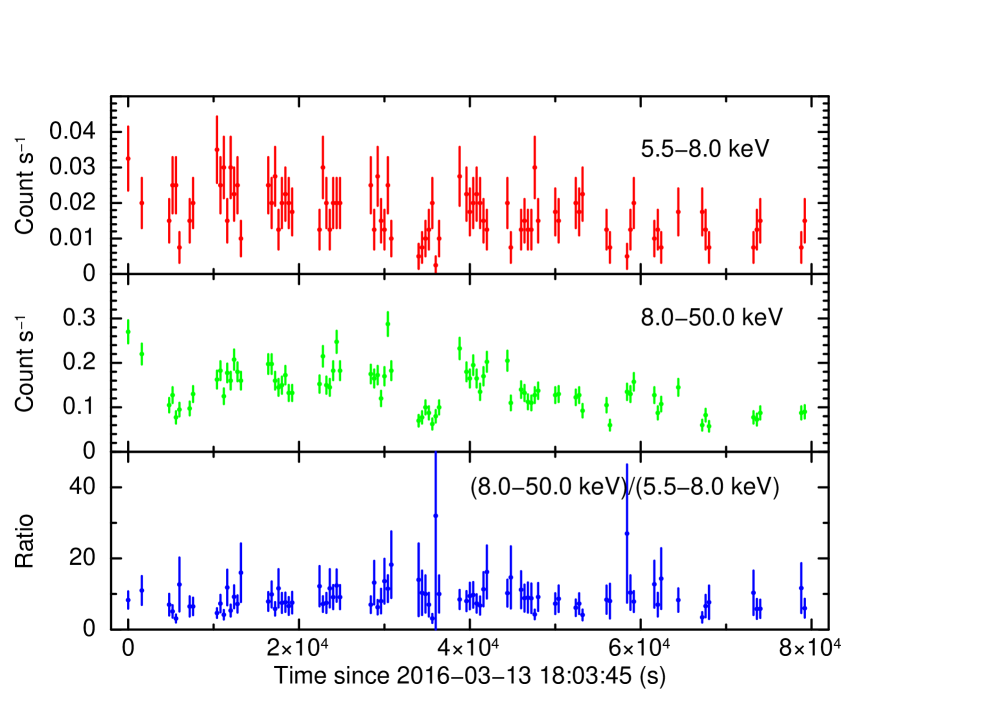
Pulsation search was performed both for the SXI and HXI-1 light curves in each band shown in figure 6 and also in the entire band. After the search from 1 s to one tenth of the exposure time of each instrument, we found no significant periodic pulsation. This prevents a conclusive determination that the compact object is a neutron star.
Because there is no apparent outburst during the exposure, we extract the spectra of the SXI and HXI-1 without any distinction of time. The NXB for the SXI is calculated using sxinxbgen that considers both the magnetic COR weighting of the observation and the position of the source extracting region in the CCD. To maximize the statistics, we subtract only the NXB component rather than extracting background spectrum from the surrounding region for the SXI. We extract all the events during the good time interval of each instrument and hence the extracted durations are not precisely coincident between the SXI and HXI-1. In figure 7 top panel, we apply a model of tbvarabs*{cutoffpl+gau+gau+gau} (hereafter model A). We set the Fe abundance of the absorbing material to be free to reproduce both of the low-energy extinction and the Fe absorption edge, while the abundances of other elements are fixed to solar values. The difference from the model adopted in Barragán et al. (2009) is that we represent the fluorescence lines from the excitation states with different total angular momenta (K and K, K and K) with a single Gaussian function, while Barragán et al. (2009) introduce a Gaussian function for each fluorescence line. Considering that the Fe K line width measured with the SXS is negligible for the SXI and HXI-1, the widths of the Gaussian functions are fixed to be zero. Furthermore, the line centroid of Ni K is fixed so that the ratio of the centroids of Fe K and Ni K becomes the value in Hölzer et al. (1997). We also introduce a constant factor that is multiplied to the HXI-1 data to account for possible inter-instrument calibration uncertainty of the effective area. An edge-like structure seen slightly below 30 keV is due to an edge in quantum efficiency of the CdTe double-sided strip detectors and hence is not seen in the unfolded spectrum shown in the bottom panel of figure 7.
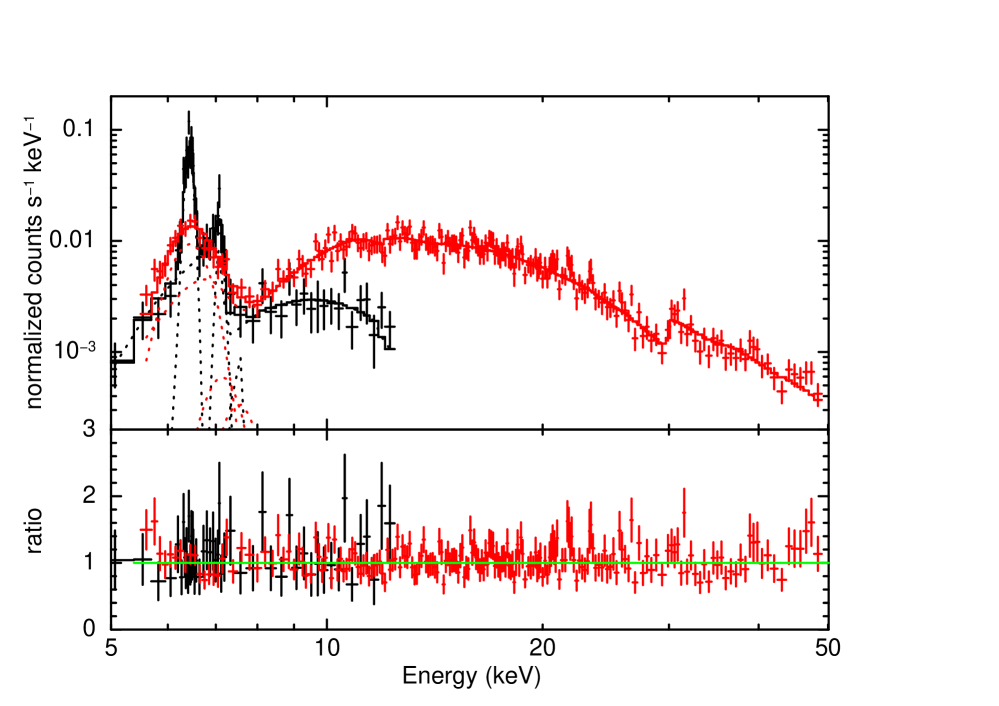
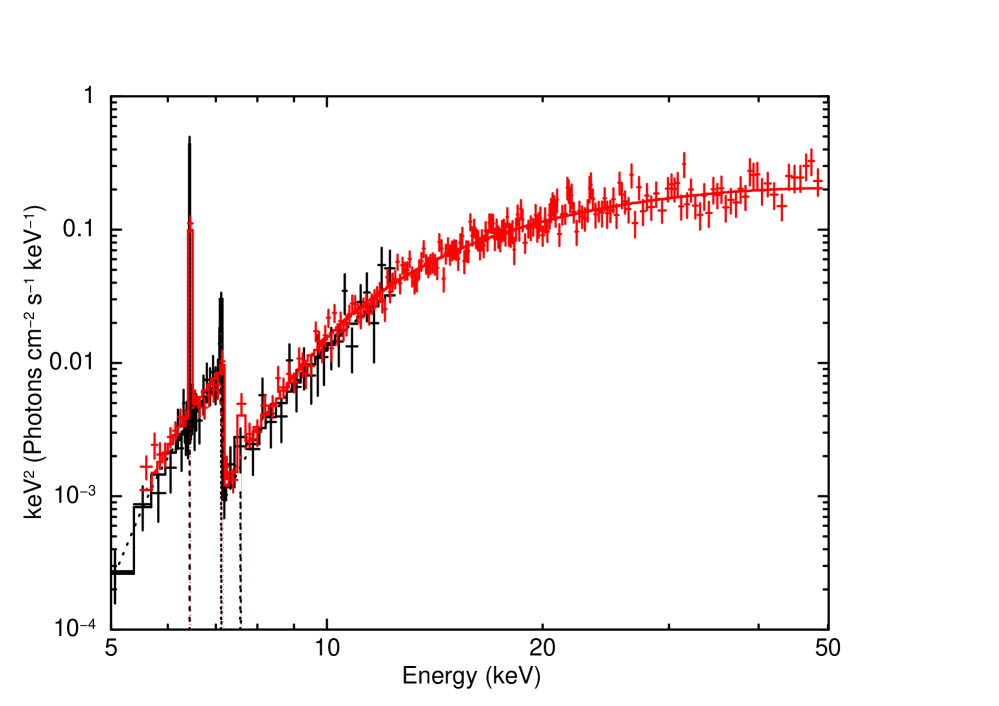
The best-fit parameters are summarized in table 3.2. Comparison of the spectral parameters with those obtained from the Suzaku observation in 2006 (Barragán et al., 2009) shows that the flux of continuum and line components significantly decreased in the ten year interval while the equivalent widths increased. The unabsorbed luminosity in the 2–10 keV band is 1.0 1034 and 5.0 ergs s-1 assuming the distance to the target of 0.9 and 6.2 kpc, respectively. This is much less than the Eddington limit of 1.8 ergs s-1 for a neutron star of 1.4 M and is consistent with values derived for the vast majority of HMXBs, even if including correction for the partial blockage of the continuum source as discussed in section 4.
The Fe K-shell absorption edge energy is another key parameter that strongly depends on the ionization state of the reprocessing materials. In order to explore this we add the edge model that gives
where and are the edge position and the absorption depth at the edge, respectively. Because the edge model accounts for absorption at the edge position, we set the Fe abundance of the tbvarabs to zero in our spectral fitting. The results are given in table 3.2 in the column labelled model B.
Evaluating the flux of the possible Compton shoulder is performed by adding another Gaussian function to model A with its centroid and width (1) fixed to 6.3 keV and 50 eV, respectively (Matt, 2002). There is no significant flux of the additional line with its 90% upper limit of 5.4 cm-2 s-1 that corresponds to the 90% upper limit of the equivalent width of 103 eV.
Best-fit parameters for the SXI and HXI-1 spectra.
Parameter
model A
model B
(1024 cm-2)
2.06
2.19
1.19
0 (fixed)
N/A
7.108
N/A
2.32
0.74
0.50
(keV)
37.8
30.9
(10-3 cm-2 s-1)
4.7
2.4
(keV)
6.426
6.427
(keV)
2.15
2.09
(10-3 cm-2 s-1)
2.2
1.6
(keV)
7.101
7.108
(keV)
0.38
0.49
(10-4 cm-2 s-1)
1.9
1.8
(10-4 cm-2 s-1)
4.0
2.1
factor
1.177
1.213
245.0 (251)
250.3 (249)
{tabnote}
Exponential cutoff energy in the power-law model.
4 Discussion
The Fe line in IGR J16318 contains information about the ionization state and kinematics of the emitting gas via the profile shape. It also contains information about the quantity and geometrical distribution of the emitting gas via the line strength, i.e., the flux or equivalent width. This does not necessarily yield unique determinations of interesting physical quantities, but can strongly constrain them under various scenarios. General discussions of the dependence of flux or equivalent width have been provided by many authors, e.g., Koyama (1985), Makishima (1986), Torrejón et al. (2010), and Giménez-García et al. (2015).
In particular, in the simplest case of a point source of continuum producing the Fe K line via fluorescence at the center of a spherical uniform cloud, simple analytic calculations show that the line equivalent width is approximately proportional to the equivalent hydrogen column density () of the cloud for 1.5 cm-2. At greater the gas becomes Thomson thick and the equivalent width no longer increases. The maximum equivalent width is 1–2 keV and depends on the Fe elemental abundance and on the shape of the SED of the continuum source in the energy band above 6 keV. For solar Fe abundance and an SED consisting of a power-law with photon index of 2, the maximum attainable equivalent width is less than 2 keV. Numerical calculations for toroidal reprocessors show that the Thomson thin approximation breaks down at much less than 1.5 cm-2 (Yaqoob et al., 2010).
Equivalent widths greater than 2 keV can be obtained if the reprocessor is not spherically symmetric around the continuum source, i.e., if there is an opaque screen along the direct line of sight to the continuum source. This is the most likely explanation for large equivalent widths observed from X-ray binaries during eclipse (e.g., Watanabe et al. (2006)), or Seyfert 2 galaxies (Krolik and Kallman, 1987; Koss et al., 2016). This provides a likely explanation for the large equivalent width observed from IGR J16318; it is crudely consistent with the column density we measure 2.1 cm-2 together with at least a partial blockage of the continuum source by a structure that has Thomson depth much greater than unity. Then we predict that the true luminosity of the source is greater than we infer from simple dilution at a distance of 0.9–6.2 kpc, by a factor 2.
We derived the line centroid of Fe K in spite of low photon statistics. The weighted average of the energies at the maxima of the seven Lorentzian functions is 6399.1 eV if we consider the gain shift and uncertainty of the SXS. Our result is consistent with those obtained with CCD detectors aboard XMM-Newton (Ibarra et al., 2007) and Suzaku (Barragán et al., 2009). However, the uncertainty of the measurement significantly improved with the SXS. We have to consider the systematic velocity and the orbital velocity of the reprocessor. According to the NIR spectroscopy, there is no significant systemic velocity of the companion star with = 130 km s-1 (Filliatre and Chaty, 2004). If we assume the masses of the companion star and the compact object of 30 and 1.4 respectively, the line-of-sight velocity of the compact object with respect to the companion star is within km s-1. Then the total Doppler velocity is expected to be 200 km s-1, corresponding to the shift of eV.
The top panel of figure 8 shows the theoretical value of the Fe K line centroid () versus ionization state (Palmeri et al., 2003; Mendoza et al., 2004; Yamaguchi et al., 2014). Comparing those with the measured values, the ionization state of Fe I–X is preferred. This is in agreement with the other HMXBs reported by Torrejón et al. (2010). On the other hand, the line centroid measured with the SXI and HXI-1 conflicts formally, at the 90% level with that measured with the SXS. Monitoring the pulse heights of the onboard calibration 55Fe source by the SXI (Nakajima et al., 2017) reveals that the pulse heights disperse in the range of 2–3 ch that corresponds to 12–18 eV. This can be interpreted as a systematic uncertainty on the SXI energy scale and this brings the SXI+HXI-1 into marginal agreement with the SXS.
The middle panel shows the absorption edge of the Fe () as a function of ionization state (Kallman et al., 2004; Bearden and Burr, 1967). The edge energy measured with the SXI and HXI-1 strongly constrain the ionization state to be no higher than Fe III, which is consistent with that obtained with the Fe K line centroid. Even if we consider the gain uncertainty of the SXI as noted above, the ionization state is no higher than Fe IV. We also plot the difference between and in the bottom panel because such difference is rather robust against the inaccurate energy scale. Although the result suggests the very cold reprocessor, Fe I–IV is possible if we introduce a Doppler shift of 1000 km s-1 (see later for a justification of this assumed value). Barragán et al. (2009) also discuss the ionization state of Fe with the statistically best spectrum. Although their line centroid value itself does not reject the slightly ionized state, they claim that the reprocessing materials are neutral considering the systematic uncertainty of the gain of Suzaku/XIS (Koyama et al., 2007). Here we develop the discussion with the updated and upgraded data obtained with Hitomi.
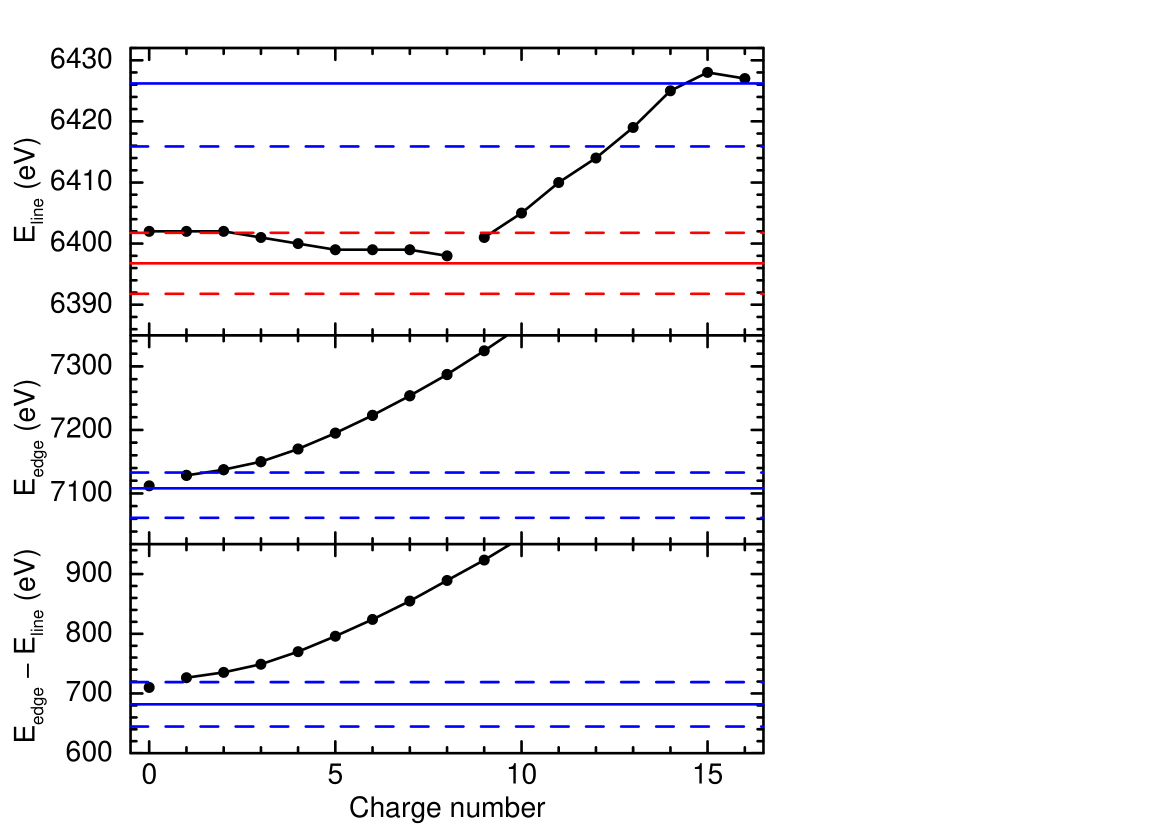
Kallman et al. (2004) calculated the abundance distribution of the Fe ions in a photoionized plasma as a function of the ionization parameter = (Tarter et al., 1969), where is the gas density, is the distance between the X-ray source of ionizing radiation and the gas, and is the luminosity of the continuum emission. The range of ionization states Fe I–IV is consistent with an ionization parameter value log() . The distance between X-ray source and gas responsible for the Fe emission, , can be estimated based on the X-ray time variability. Walter et al. (2003) estimated the distance to be cm with XMM-Newton by the maximum delay observed between the Fe K line and the continuum variations. Light curves obtained from other observations (Ibarra et al., 2007) also exhibited that Fe K line followed almost immediately the continuum. Applying the cm, we estimate and the thickness of the reprocessing materials along the line of sight () to be 3 cm-3 and = 7 cm, respectively. If we consider the 80 d orbit and the masses of the companion star and the compact object as above, the distance between them is 2 cm. The maximum size of the reprocessor and may be comparable with the system size.
One of the most probable candidates for the reprocessor is the cold stellar wind from the massive companion star. The wind velocity () at the distance can be estimated assuming the typical -law of
where is the terminal velocity and is the stellar radius. Assuming the commonly used = 0.5 and = , we obtain 0.7. When we assign a typical of the early type stars of 1500–2000 km s-1 (Abbott, 1978), 1050–1400 km s-1 is obtained. The measured Fe K line width is equivalent to = 160 km s-1. This is much less than the Doppler broadening expected from speeds that are characteristic of similar systems. This indicates that the line emitting region does not cover the whole region of the stellar wind including the companion star. It suggests that the line may be produced in a relatively small region centered on the compact object. In this case, the line centroid will be Doppler-shifted depending on the orbital phase of the compact object. When we shift both of the line centroid and the K-shell edge energy by 25 eV that corresponds to of 1250 km s-1, the two estimates of ionization state contradict each other. This implies that the preferred orbital phase is 0.25 or 0.75. However, distributes in a wide range even among members of the supergiant HMXBs (Giménez-García et al., 2016). Furthermore, Manousakis and Walter (2011) argue that highly absorbed HMXB systems have lower wind velocities than classical supergiant HMXBs. An atmosphere model for the donor of Vela X-1 by Sander et al. (2017) also expects that the wind velocity at the neutron star location is significantly lower than that predicted by the -law. More accurate determination of of the companion star is needed for further discussion. Another interesting possibility is discussed by Torrejón et al. (2015) for supergiant HMXB. These authors argue that Fe K must be produced close to the photosphere of the donor star, where the wind is still in the acceleration zone, in the region facing the compact object. This case agrees with the fact that the reprocessor does not cover the X-ray source completely. The SXS established an empirical upper limit to the Fe K width which would imply stellar wind velocities at distances of 1.06 –1.10 . This is in agreement with theoretical predictions on the onset of wind clumps given by Sundqvist and Owocki (2013).
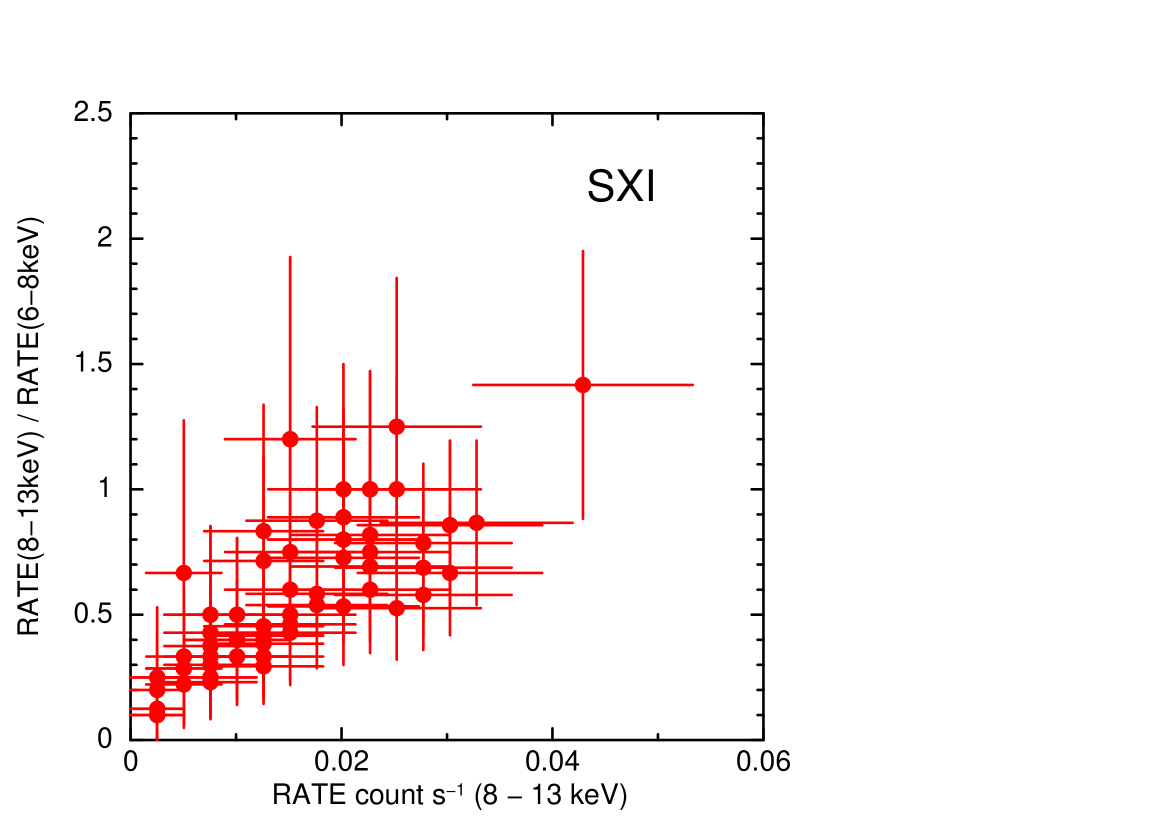
To investigate the time variability of the line and continuum emissions obtained in this observation, we plot the ratio of the continuum flux to the fluorescence line flux as a function of the latter for the SXI in figure 9 top panel. The clear positive correlation indicates that the continuum component exhibits variability with a larger dynamical range than the line component, as measured with the fractional variation of the light curves in section 3.2. In other words, at least part of the line emission does not follow the continuum variability on time scales less than 400 s. This is consistent with the results obtained by Ibarra et al. (2007) with XMM-Newton. One possible explanation for the positive correlation is that the continuum is produced in a compact region while the line emission takes place in a significantly extended region. Another possibility is the time variation of the column density on the line of sight. Because the X-ray flux around the Fe K band can be affected by the absorption column, time variation of the absorption column on the line of sight can cause time variation only in the low energy band. To clarify this, we check the correlation between the count light curves in the 8–13 keV and 13–50 keV band with the HXI-1 as shown in the bottom panel of figure 9. The clear positive correlation is a hint of the intrinsic variation of the continuum rather than due to the changes in the intervening column density.

The absence of the Compton shoulder is confirmed as it was in the spectrum obtained by Suzaku (Barragán et al., 2009), making a clear contrast with another strongly absorbed HMXB GX 301–2 (Watanabe et al., 2003; Fürst et al., 2011). Walter et al. (2003) and Ibarra et al. (2007) point out that the absence of a Compton shoulder can be due to an inhomogeneous distribution of reprocessing material. Another possibility is the smearing of the Compton shoulder due to the free electrons with an temperature of several eV (Watanabe et al., 2003) and/or the scattering with neutral hydrogen (Sunyaev and Churazov, 1996; Sunyaev et al., 1999). In fact, mid-infrared observations of IGR J16318 by Chaty and Rahoui (2012) revealed a spectral component with a temperature 37,000–40,000 K. Since this temperature is higher than that of typical B1 supergiant stars, they suggest that the component corresponds to dense and hot material surrounding the stellar photosphere and irradiated by X-rays from the compact object. Deeper exposure with high spectral resolution like the SXS is required for the further understanding of the circumstellar environment of this system.
5 Summary
In spite of observing challenges such as the large offset angle and the issues such as cross-talk for the SXI, we analyze photons from the target for all of the instruments that had been started up at the time of the Hitomi observation of IGR J16318. The microcalorimeter spectrum resolved the Fe K and K lines for the first time in an X-ray binary system and revealed that the line width is narrower than that compatible with the full range of speeds expected from a stellar wind. Combining the line centroid measured by the SXS and the energy of the Fe K-shell absorption edge by SXI+HXI-1, we put a constraint on the ionization state of the reprocessing materials to be in the range of Fe I–IV. Judging from the ionization parameter, the density and thickness of the materials are estimated. As reported in the past observations, the absorption is extraordinarily strong ( cm-2) and the Compton shoulder component is not apparent. These characteristics can be attributed to reprocessing materials which are distributed in a narrow solid angle or scattering primarily with warm free electrons or neutral hydrogen.
The Hitomi observation of IGR J16318 measured the width and energy of the Fe K fluorescence line with precision which are unprecedented for an X-ray binary. They reveal a line width and shift which are much less than the Doppler broadening and shift expected from speeds which are characteristic of similar systems. This was achieved using the SXS detection of 19 photons. If the aspect stability and accuracy of Hitomi pointing system had been accurate at the few arc minutes level, we would have obtained far more detailed diagnostics for the Fe K line and absorption edge diagnostics. However this was not achieved in the initial operations of the Hitomi mission. We now know that the physics of the Fe K line is considerably different for this object, and perhaps for other X-ray binaries, from that previously assumed despite over 40 years of detailed study. Thus, microcalorimeter observations of X-ray binaries in the future with the X-ray recovery mission will open up a new and exciting field of study.
Author contributions
H. Nakajima led this research in data analysis and writing manuscript. He also contributed to the SXI hardware design, fabrication, integration and tests, in-orbit operation, and calibration. K. Hayashida provided key comments on the whole discussion. He also made hardware and software contributions to the SXI as one of the instrument principal investigators. T. Kallman contributed for discussion primarily on the Fe line diagnostics and to elaborate the manuscript. T. Miyazawa worked for the fabrication and calibration of the Hard X-ray Telescope. H. Takahashi contributed to the timing analyses of the HXI. He also made software and hardware contribution to the HXI. M. Guainazzi led observation planning and gave critical comments mainly on the reprocessing materials. H. Awaki, T. Dotani, C. Ferrigno, L. C. Gallo, P. Gandhi, C. A. Kilbourne, P. Laurent, K. Mori, K. Pottschmidt, C. S. Reynolds, and M. Tsujimoto improved the manuscript.
We thank the support from the JSPS Core-to-Core Program. We acknowledge all the JAXA members who have contributed to the ASTRO-H (Hitomi) project. All U.S. members gratefully acknowledge support through the NASA Science Mission Directorate. Stanford and SLAC members acknowledge support via DoE contract to SLAC National Accelerator Laboratory DE-AC3-76SF00515. Part of this work was performed under the auspices of the U.S. DoE by LLNL under Contract DE-AC52-07NA27344. Support from the European Space Agency is gratefully acknowledged. French members acknowledge support from CNES, the Centre National d’Études Spatiales. SRON is supported by NWO, the Netherlands Organization for Scientific Research. Swiss team acknowledges support of the Swiss Secretariat for Education, Research and Innovation (SERI). The Canadian Space Agency is acknowledged for the support of Canadian members. We acknowledge support from JSPS/MEXT KAKENHI grant numbers JP15J02737, JP15H00773, JP15H00785, JP15H02070, JP15H02090, JP15H03639, JP15H03641, JP15H03642, JP15H05438, JP15H06896, JP15K05107, JP15K17610, JP15K17657, JP16J00548, JP16J02333, JP16H00949, JP16H03983, JP16H06342, JP16K05295, JP16K05296, JP16K05300, JP16K05296, JP16K05309, JP16K13787, JP16K17667, JP16K17672, JP16K17673, JP21659292, JP23340055, JP23340071, JP23540280, JP24105007, JP24244014, JP24540232, JP24684010, JP25105516, JP25109004, JP25247028, JP25287042, JP25400236, JP25800119, JP26109506, JP26220703, JP26400228, JP26610047, JP26670560, and JP26800102. The following NASA grants are acknowledged: NNX15AC76G, NNX15AE16G, NNX15AK71G, NNX15AU54G, NNX15AW94G, and NNG15PP48P to Eureka Scientific. H. Akamatsu acknowledges support of NWO via Veni grant. C. Done acknowledges STFC funding under grant ST/L00075X/1. A. Fabian and C. Pinto acknowledge ERC Advanced Grant 340442. P. Gandhi acknowledges JAXA International Top Young Fellowship and UK Science and Technology Funding Council (STFC) grant ST/J003697/2. Y. Ichinohe, K. Nobukawa, and H. Seta are supported by the Research Fellow of JSPS for Young Scientists. N. Kawai is supported by the Grant-in-Aid for Scientific Research on Innovative Areas “New Developments in Astrophysics Through Multi-Messenger Observations of Gravitational Wave Sources”. S. Kitamoto is partially supported by the MEXT Supported Program for the Strategic Research Foundation at Private Universities, 2014-2018. B. McNamara and S. Safi-Harb acknowledge support from NSERC. T. Dotani, T. Takahashi, T. Tamagawa, M. Tsujimoto and Y. Uchiyama acknowledge support from the Grant-in-Aid for Scientific Research on Innovative Areas “Nuclear Matter in Neutron Stars Investigated by Experiments and Astronomical Observations”. N. Werner is supported by the Lendület LP2016-11 grant from the Hungarian Academy of Sciences. D. Wilkins is supported by NASA through Einstein Fellowship grant number PF6-170160, awarded by the Chandra X-ray Center, operated by the Smithsonian Astrophysical Observatory for NASA under contract NAS8-03060.
We thank contributions by many companies, including in particular, NEC, Mitsubishi Heavy Industries, Sumitomo Heavy Industries, and Japan Aviation Electronics Industry. Finally, we acknowledge strong support from the following engineers. JAXA/ISAS: Chris Baluta, Nobutaka Bando, Atsushi Harayama, Kazuyuki Hirose, Kosei Ishimura, Naoko Iwata, Taro Kawano, Shigeo Kawasaki, Kenji Minesugi, Chikara Natsukari, Hiroyuki Ogawa, Mina Ogawa, Masayuki Ohta, Tsuyoshi Okazaki, Shin-ichiro Sakai, Yasuko Shibano, Maki Shida, Takanobu Shimada, Atsushi Wada, Takahiro Yamada; JAXA/TKSC: Atsushi Okamoto, Yoichi Sato, Keisuke Shinozaki, Hiroyuki Sugita; Chubu U: Yoshiharu Namba; Ehime U: Keiji Ogi; Kochi U of Technology: Tatsuro Kosaka; Miyazaki U: Yusuke Nishioka; Nagoya U: Housei Nagano; NASA/GSFC: Thomas Bialas, Kevin Boyce, Edgar Canavan, Michael DiPirro, Mark Kimball, Candace Masters, Daniel Mcguinness, Joseph Miko, Theodore Muench, James Pontius, Peter Shirron, Cynthia Simmons, Gary Sneiderman, Tomomi Watanabe; ADNET Systems: Michael Witthoeft, Kristin Rutkowski, Robert S. Hill, Joseph Eggen; Wyle Information Systems: Andrew Sargent, Michael Dutka; Noqsi Aerospace Ltd: John Doty; Stanford U/KIPAC: Makoto Asai, Kirk Gilmore; ESA (Netherlands): Chris Jewell; SRON: Daniel Haas, Martin Frericks, Philippe Laubert, Paul Lowes; U of Geneva: Philipp Azzarello; CSA: Alex Koujelev, Franco Moroso.
References
- Abbott (1978) Abbott, D. C. 1978, ApJ, 225, 893–901. 10.1086/156554
- Agarwal (1979) Agarwal, B. K. 1979. X-ray spectroscopy : an introduction / B. K. Agarwal. Springer-Verlag Berlin ; New York. ISBN 0387092684
- Angelini et al. (2017) Angelini, L., Terada, Y., Dutka, M., Eggen, J., Harrus, I., Hill, R. S., & Krimm, H. 2017, J. Ast. Inst. Sys., submitted
- Arnaud (1996) Arnaud, K. A. 1996. In Jacoby, G. H., & Barnes, J., editors, Astronomical Data Analysis Software and Systems V, 101 of Astronomical Society of the Pacific Conference Series, 17
- Awaki et al. (2016) Awaki, H., Kunieda, H., Ishida, M., et al. 2016. In Space Telescopes and Instrumentation 2016: Ultraviolet to Gamma Ray, 9905 of Proc. SPIE, 990512. 10.1117/12.2231258
- Barragan et al. (2010) Barragan, L., Wilms, J., Kreykenbohm, I., Hanke, M., Fuerst, F., Pottschmidt, K., & Rothschild, R. E. 2010. In Eighth Integral Workshop. The Restless Gamma-ray Universe (INTEGRAL 2010), 135
- Barragán et al. (2009) Barragán, L., Wilms, J., Pottschmidt, K., Nowak, M. A., Kreykenbohm, I., Walter, R., & Tomsick, J. A. 2009, A&A, 508, 1275–1278. 10.1051/0004-6361/200810811
- Bearden and Burr (1967) Bearden, J. A., & Burr, A. F. 1967, Reviews of Modern Physics, 39, 125–142. 10.1103/RevModPhys.39.125
- Bodaghee et al. (2012) Bodaghee, A., Tomsick, J. A., Rodriguez, J., & James, J. B. 2012, ApJ, 744, 108. 10.1088/0004-637X/744/2/108
- Cash (1979) Cash, W. 1979, ApJ, 228, 939–947. 10.1086/156922
- Chaty and Rahoui (2012) Chaty, S., & Rahoui, F. 2012, ApJ, 751, 150. 10.1088/0004-637X/751/2/150
- Coleiro and Chaty (2013) Coleiro, A., & Chaty, S. 2013, ApJ, 764, 185. 10.1088/0004-637X/764/2/185
- Courvoisier et al. (2003) Courvoisier, T. J.-L., Walter, R., Rodriguez, J., Bouchet, L., & Lutovinov, A. A. 2003, IAU Circ., 8063
- de Vries et al. (2017) de Vries, C. P., Haas, D., Yamasaki, N. Y., et al. 2017, J. Ast. Inst. Sys., submitted
- Filliatre and Chaty (2004) Filliatre, P., & Chaty, S. 2004, ApJ, 616, 469–484. 10.1086/424869
- Fujimoto et al. (2016) Fujimoto, R., Takei, Y., Mitsuda, K., et al. 2016. In Space Telescopes and Instrumentation 2016: Ultraviolet to Gamma Ray, 9905 of Proc. SPIE, 99053S. 10.1117/12.2232933
- Fürst et al. (2011) Fürst, F., Suchy, S., Kreykenbohm, I., et al. 2011, A&A, 535, A9. 10.1051/0004-6361/201117665
- Gehrels (1986) Gehrels, N. 1986, ApJ, 303, 336–346. 10.1086/164079
- Giménez-García et al. (2016) Giménez-García, A., Shenar, T., Torrejón, J. M., et al. 2016, A&A, 591, A26. 10.1051/0004-6361/201527551
- Giménez-García et al. (2015) Giménez-García, A., Torrejón, J. M., Eikmann, W., Martínez-Núñez, S., Oskinova, L. M., Rodes-Roca, J. J., & Bernabéu, G. 2015, A&A, 576, A108. 10.1051/0004-6361/201425004
- Hölzer et al. (1997) Hölzer, G., Fritsch, M., Deutsch, M., Härtwig, J., & Förster, E. 1997, Phys. Rev. A, 56, 4554–4568. 10.1103/PhysRevA.56.4554
- Ibarra et al. (2007) Ibarra, A., Matt, G., Guainazzi, M., Kuulkers, E., Jiménez-Bailón, E., Rodriguez, J., Nicastro, F., & Walter, R. 2007, A&A, 465, 501–507. 10.1051/0004-6361:20066225
- Iyer and Paul (2017) Iyer, N., & Paul, B. 2017, MNRAS, in press. 10.1093/mnras/stx1575
- Jain et al. (2009) Jain, C., Paul, B., & Dutta, A. 2009, Research in Astronomy and Astrophysics, 9, 1303–1316. 10.1088/1674-4527/9/12/002
- Kallman et al. (2004) Kallman, T. R., Palmeri, P., Bautista, M. A., Mendoza, C., & Krolik, J. H. 2004, ApJS, 155, 675–701. 10.1086/424039
- Kelley et al. (2017) Kelley, R., Mitsuda, K., & Akamatsu, H. 2017, J. Ast. Inst. Sys., submitted
- Kilbourne et al. (2017) Kilbourne, C. A., Sawada, M., Tsujimoto, M., et al. 2017, PASJ
- Koss et al. (2016) Koss, M. J., Assef, R., Baloković, M., et al. 2016, ApJ, 825, 85. 10.3847/0004-637X/825/2/85
- Koyama (1985) Koyama, K. 1985. In Tabaka, Y., & Lewin, W. H. G., editors, Galactic and Extra-Galactic Compact X-ray Sources, 153
- Koyama et al. (2007) Koyama, K., Tsunemi, H., Dotani, T., et al. 2007, PASJ, 59, 23–33. 10.1093/pasj/59.sp1.S23
- Krivonos et al. (2017) Krivonos, R. A., Tsygankov, S. S., Mereminskiy, I. A., Lutovinov, A. A., Sazonov, S. Y., & Sunyaev, R. A. 2017, MNRAS, 470, 512–516. 10.1093/mnras/stx1276
- Krolik and Kallman (1987) Krolik, J. H., & Kallman, T. R. 1987, ApJ, 320, L5–L8. 10.1086/184966
- Lebrun et al. (2003) Lebrun, F., Leray, J. P., Lavocat, P., et al. 2003, A&A, 411, L141–L148. 10.1051/0004-6361:20031367
- Leutenegger et al. (2017) Leutenegger, A. M., Sato, K., & Boyce, K. R. 2017, PASJ, in preparation
- Lin et al. (2012) Lin, D., Webb, N. A., & Barret, D. 2012, ApJ, 756, 27. 10.1088/0004-637X/756/1/27
- Liu et al. (2006) Liu, Q. Z., van Paradijs, J., & van den Heuvel, E. P. J. 2006, A&A, 455, 1165–1168. 10.1051/0004-6361:20064987
- Lutovinov et al. (2005) Lutovinov, A., Revnivtsev, M., Gilfanov, M., Shtykovskiy, P., Molkov, S., & Sunyaev, R. 2005, A&A, 444, 821–829. 10.1051/0004-6361:20042392
- Lutovinov et al. (2013) Lutovinov, A. A., Revnivtsev, M. G., Tsygankov, S. S., & Krivonos, R. A. 2013, MNRAS, 431, 327–341. 10.1093/mnras/stt168
- Maeda et al. (2017) Maeda, Y., Sato, T., Hayashi, T., et al. 2017, PASJ, submitted
- Makishima (1986) Makishima, K. 1986. In Mason, K. O., Watson, M. G., & White, N. E., editors, The Physics of Accretion onto Compact Objects, 266 of Lecture Notes in Physics, Berlin Springer Verlag, 249. 10.1007/3-540-17195-9_14
- Manousakis and Walter (2011) Manousakis, A., & Walter, R. 2011, A&A, 526, A62. 10.1051/0004-6361/201015707
- Matt (2002) Matt, G. 2002, MNRAS, 337, 147–150. 10.1046/j.1365-8711.2002.05890.x
- Matt and Guainazzi (2003) Matt, G., & Guainazzi, M. 2003, MNRAS, 341, L13–L17. 10.1046/j.1365-8711.2003.06658.x
- Mendoza et al. (2004) Mendoza, C., Kallman, T. R., Bautista, M. A., & Palmeri, P. 2004, A&A, 414, 377–388. 10.1051/0004-6361:20031621
- Miroshnichenko (2007) Miroshnichenko, A. S. 2007, ApJ, 667, 497–504. 10.1086/520798
- Mitsuda et al. (2007) Mitsuda, K., Bautz, M., Inoue, H., et al. 2007, PASJ, 59, 1–7. 10.1093/pasj/59.sp1.S1
- Murakami et al. (2003) Murakami, H., Dotani, T., & Wijnands, R. 2003, IAU Circ., 8070
- Nakajima (2017) Nakajima, H. 2017, Nucl. Instr. and Meth. A, in press
- Nakajima et al. (2017) Nakajima, H., Maeda, Y., Uchida, H., & Tanaka, T. 2017, PASJ, in press
- Nakazawa et al. (2017) Nakazawa, K., Sato, G., & Kokubun, M. 2017, J. Ast. Inst. Sys., submitted
- Noda et al. (2016) Noda, H., Mitsuda, K., Okamoto, A., et al. 2016. In Space Telescopes and Instrumentation 2016: Ultraviolet to Gamma Ray, 9905 of Proc. SPIE, 99053R. 10.1117/12.2231356
- Palmeri et al. (2003) Palmeri, P., Mendoza, C., Kallman, T. R., Bautista, M. A., & Meléndez, M. 2003, A&A, 410, 359–364. 10.1051/0004-6361:20031262
- Rahoui et al. (2008) Rahoui, F., Chaty, S., Lagage, P.-O., & Pantin, E. 2008, A&A, 484, 801–813. 10.1051/0004-6361:20078774
- Revnivtsev (2003) Revnivtsev, M. G. 2003, Astronomy Letters, 29, 644–648. 10.1134/1.1615332
- Sander et al. (2017) Sander, A. A. C., Fürst, F., Kretschmar, P., Oskinova, L. M., Todt, H., Hainich, R., Shenar, T., & Hamann, W.-R. 2017, A&A, submitted
- Sundqvist and Owocki (2013) Sundqvist, J. O., & Owocki, S. P. 2013, MNRAS, 428, 1837–1844. 10.1093/mnras/sts165
- Sunyaev and Churazov (1996) Sunyaev, R. A., & Churazov, E. M. 1996, Astronomy Letters, 22, 648–663
- Sunyaev et al. (1999) Sunyaev, R. A., Uskov, D. B., & Churazov, E. M. 1999, Astronomy Letters, 25, 199–205
- Takahashi et al. (2017) Takahashi, T., Kokubun, M., & Mitsuda, H. 2017, J. Ast. Inst. Sys., submitted
- Tanaka et al. (2017) Tanaka, T., Uchida, H., & Nakajima, H. 2017, J. Ast. Inst. Sys., submitted
- Tarter et al. (1969) Tarter, C. B., Tucker, W. H., & Salpeter, E. E. 1969, ApJ, 156, 943. 10.1086/150026
- Torrejón et al. (2010) Torrejón, J. M., Schulz, N. S., Nowak, M. A., & Kallman, T. R. 2010, ApJ, 715, 947–958. 10.1088/0004-637X/715/2/947
- Torrejón et al. (2015) Torrejón, J. M., Schulz, N. S., Nowak, M. A., Oskinova, L., Rodes-Roca, J. J., Shenar, T., & Wilms, J. 2015, ApJ, 810, 102. 10.1088/0004-637X/810/2/102
- Tsujimoto et al. (2017) Tsujimoto, M., Mitsuda, K., Kelley, R. L., den Herder, J. W., & et al. 2017, J. Ast. Inst. Sys., submitted
- Ubertini et al. (2003) Ubertini, P., Lebrun, F., Di Cocco, G., et al. 2003, A&A, 411, L131–L139. 10.1051/0004-6361:20031224
- Walter et al. (2004) Walter, R., Courvoisier, T. J.-L., Foschini, L., et al. 2004. In Schoenfelder, V., Lichti, G., & Winkler, C., editors, 5th INTEGRAL Workshop on the INTEGRAL Universe, 552 of ESA Special Publication, 417–422
- Walter et al. (2003) Walter, R., Rodriguez, J., Foschini, L., et al. 2003, A&A, 411, L427–L432. 10.1051/0004-6361:20031369
- Watanabe et al. (2003) Watanabe, S., Sako, M., Ishida, M., et al. 2003, ApJ, 597, L37–L40. 10.1086/379735
- Watanabe et al. (2006) Watanabe, S., Sako, M., Ishida, M., et al. 2006, ApJ, 651, 421–437. 10.1086/507458
- Wilms et al. (2000) Wilms, J., Allen, A., & McCray, R. 2000, ApJ, 542, 914–924. 10.1086/317016
- Winkler et al. (2003) Winkler, C., Courvoisier, T. J.-L., Di Cocco, G., et al. 2003, A&A, 411, L1–L6. 10.1051/0004-6361:20031288
- Yamaguchi et al. (2014) Yamaguchi, H., Eriksen, K. A., Badenes, C., et al. 2014, ApJ, 780, 136. 10.1088/0004-637X/780/2/136
- Yaqoob et al. (2010) Yaqoob, T., Murphy, K. D., Miller, L., & Turner, T. J. 2010, MNRAS, 401, 411–417. 10.1111/j.1365-2966.2009.15657.x