Quasar lenses and pairs in the VST-ATLAS and Gaia
Abstract
We report on discovery results from a quasar lens search in the ATLAS public footprint, extending quasar lens searches to a regime without band or fiber-spectroscopic information, using a combination of data mining techniques on multi-band catalog magnitudes and image-cutout modelling. Spectroscopic follow-up campaigns, conducted at the 2.6m Nordic Optical Telescope (La Palma) and 3.6m New Technology Telescope (La Silla) in 2016, yielded seven pairs of quasars exhibiting the same lines at the same redshift and monotonic flux-ratios with wavelength (hereafter NIQs, Nearly Identical Quasar pairs). The quasar redshifts range between and contaminants are typically pairs of bright blue stars, quasar-star alignments along the line of sight, and narrow-line galaxies at Magellan data of A0140-1152 (01h40m03.0s-11d52m19.0s, ) confirm it as a lens with deflector at and Einstein radius . We show the use of spatial resolution from the Gaia mission to select lenses and list additional systems from a WISE-Gaia-ATLAS search, yielding three additional lenses (02h35m27.4s-24d33m13.2s, 02h59m33.s-23d38m01.8s, 01h46m32.9s-11d33m39.0s). The overall sample consists of 11 lenses/NIQs, plus three lenses known before 2016, over the ATLAS-DR3 footprint ( deg2). Finally, we discuss future prospects for objective classification of pair/NIQ/contaminant spectra.
keywords:
gravitational lensing: strong – quasars: general – methods: statistical – astronomical data bases: surveys – techniques: image processing1 Introduction
In an era of large data stemming from ever more ambitious surveys, large samples of intrinsically rare objects become possible. Quasar pairs and strongly lensed quasars are particularly interesting classes of rare astronomical objects, because the information content for each system is high and in some sense unique. Through the lensing effect, one can obtain111A general review is given by Treu (2010).: (i) a purely gravitational measurement of the properties of the deflector(s), including their invisible components like dark matter halos and individual stars (e.g. Oguri et al., 2014); (ii) a magnified view of the background quasar, accretion disk, and host galaxy (Peng et al., 2006; Sluse et al., 2015; Motta et al., 2017; Ding et al., 2017); (iii) information about distances and thus cosmological parameters (Refsdal, 1964; Cárdenas et al., 2013; Treu & Marshall, 2016; Suyu et al., 2017). Spectroscopy of close sightlines, be they to multiple quasar images or to pairs of physically distinct quasars, is a probe of: (i) kinematics of the cosmic web at high redshift (Rauch et al., 2005); (ii) small-scale structure of Ly absorbers (Smette et al., 1992; Dinshaw et al., 1998; Rorai et al., 2017); (iii) physical conditions of the cool ISM/CGM of galaxies and quasars (Farina et al., 2014; Zahedy et al., 2016).
Unfortunately, lensed quasars are rare on the sky – typically 1 per 10 square degrees (deg2) at depth and resolution of present day surveys (Oguri & Marshall 2010) – since they require a very close aligment of quasars with foreground massive galaxies, or galaxy clusters. Finding them is thus a classic needle in a haystack problem, that requires sophisticated algorithms to identify promising candidates for further follow-up and confirmation. In the case of current wide field imaging surveys consisting of thousands of , the data mining problem consists of identifying of order candidates from catalogs consisting of astronomical sources.
In imaging surveys, lensed quasars can be recognized from their colours and morphology. In photometric catalogues, they can appear as quasars with contributions from the lensing galaxy, or galaxies with contributions from the background source, or anything intermediate. Their image cutouts have morphologies that may be more or less marked, ranging from wide-separation lenses with a clearly visible deflector, to lenses whose image-separation can be ascertained just by direct modelling of the cutouts. In order to ensure maximum efficiency and purity, search strategies have typically been tailored to the specifics of each surveys in the past. Partially-overlapping areas of the Southern Hemisphere are being probed in (at least) bands by the DES (Sánchez & DES Collaboration, 2010; Dark Energy Survey Collaboration et al., 2016), KiDS (de Jong et al., 2013), Pan-STARRS (Chambers et al., 2016) and VST-ATLAS (Shanks et al., 2015). The typical resolution of these surveys is just below FWHM, in most cases insufficient to fully deblend the multiple images and the deflector for galaxy-scale lenses, at least at pipeline and object-detection level.
Therefore, follow-up is almost always necessary, consisting of spectroscopy to confirm that the quasars are indeed multiply imaged and not a chance alignment, and possibly detect spectral features from the deflector, and high resolution images to map out the lensing configuration. Sometimes confirmation is pretty straightforward, other times it requires substantial observational resources, including Hubble Space Telescope imaging. For example, veritable lenses, like HE1104 (Wisotzki et al., 1993) or HS2209 (Hagen et al., 1999), were identified as ‘bright’ quasar pairs with almost identical spectra and had to wait for deeper and high-resolution follow-up (e.g. Chantry et al., 2010) for a full confirmation. Others (e.g. the quad WFI 2026, Morgan et al., 2004) are lacking secure spectroscopy of the deflector to this day. These systems are not uncommon in quasar lens searches: the Sloan Quasar Lens Search (SQLS: Oguri et al., 2006; Inada et al., 2012; More et al., 2016) yielded some quasar pairs with nearly identical spectra at the same redshifts, but not deflectors detected. In small separation lenses, the deflector may be faint enough to be undetectable unless the quasar images are subtracted from deep, high-resolution imaging data (e.g. for HS2209, Williams et al., 2017b).
Here, we report on spectroscopic follow-up results from a two-step search applied mainly to the VST-ATLAS public footprint222Accessible at http://osa.roe.ac.uk/. In Section 2, we describe the target and candidate selection procedures; follow-up campaigns are summarized in Section 3; results are discussed in Section 4 and Table 3; we discuss future prospects in Section 5, and list additional candidates (Table 4) that could not be followed up in 2016, including the first quasar lens candidates identified using Gaia data and three new lenses among them. Target selection was based on and WISE (Wright et al., 2010) magnitudes. For consistency with previous work, the WISE magnitudes were left in the Vega system, whereas the ATLAS magnitudes were translated in the AB system.
2 Targets and Candidates
The strategy followed here consists of two steps. First, targets are selected from the ATLAS catalogs based on their magnitudes in optical and infra-red magnitudes. Then, candidates are obtained by retaining just the targets that pass a first visual inspection and modelling their cutouts, to ensure that they are consistent with two or more point-sources with consistent colours. A similar search was performed on a patch of the SDSS footprint with right ascensions accessible to observation around February 2016, further concentrating on four objects with SDSS fibre spectra that were used as a control sample.
A different kind of target mining, based on outlier selection (Agnello, 2017), was applied to the ATLAS-DR3 footprint once it became publicly available in November 2016. For the ATLAS-DR3 and SDSS targets, the only candidate selection step consisted in visual inspection.
2.1 ATLAS DR2 Target Selection
The coverage of ATLAS over its footprint is not uniform in all bands. Then, different selection procedures were adopted for different combinations of bands, in order to maximize the target sample. When querying objects from the ATLAS public footprint, we required an extendedness criterion, given by either p_Galaxy or AperMag3_i-AperMag6_i i.e. that the objects have extra flux besides that of an isolated point-source.
2.1.1 Artificial Neural Networks
When bands were available, we selected objects that are ‘blue and extended’, using colour cuts along the lines of Agnello et al. (2015b), but without restrictions on or This is to avoid the exclusion of higher-redshift quasars () and redder objects where a lensing galaxy could contribute more to the colours. For these objects, we used Artificial Neural Networks (ANNs) to select those that were compatible with lensed quasars, or quasars at redshift this was made possible by extending the ANNs designed by Agnello et al. (2015a) to split the ‘quasar’ class into multiple redshift intervals (cf Williams et al., 2017), bringing the total number of classes to nine from the initial four that were used by Agnello et al. (2015b).
2.1.2 Missing magnitudes and hybrid colours
In the absence of some optical bands, we could still select some objects based on their infra-red excess, i.e. optical colours resembling those of quasars and redder optical-infrared colours that could be indicative of a lensing galaxy. This approach was used successfully by Ofek et al. (2007) in the case of the SDSS, and we used it here with either or for the optical colours and or for the hybrid colours, whenever or magnitudes are available from 2MASS (Skrutskie et al., 2006).
An additional sub-sample of targets consisted of objects that satisfied some strict colour-magnitude cuts
| (1) |
This identifies the locus where 7 out of the 10 small-separation lenses of Inada et al. (2012) lie. They are dominated by the source quasar, being blue in the optical and having a high WISE excess, and a low typical of quasars at higher redshift.
2.1.3 Colour grading of DR2 targets
Targets in the ATLAS DR2 footprint were also graded based on their colours, where a grade of 0 (resp. 3) means low (resp. high) chances to be a quasar lens. The colour grade was assigned as with
| (2) |
where the Heaviside step function is 1 (resp. 0) for (resp. ), and for and (resp ) for (resp. ). Whenever a magnitude is not available (especially ), the grade to which it contributes is set to 0.
2.2 Candidate Selection
From the previous step, we obtained a pool of targets that were further refined to obtain a final candidate sample. First, the targets were visually inspected by three of us (AA, TT, CER) to exclude obvious contaminants, such as galaxies, low-redshift quasars with a bright host, line-of-sight quasar-galaxy alignments, isolated objects and pairs with colours that were manifestly inconsistent. As a second step, the multi-band ATLAS-DR2 cutouts were modelled automatically to verify whether the objects could be ‘split’ into two (or more) point-sources with consistent colours across the available magnitudes, as described below.
2.2.1 Candidate Corroboration
Fourteen of the 15 DR1 and DR2 candidates for which spectra were eventually obtained were independently evaluated as candidates using the ATLAS cutout morphology approach described by Schechter et al. (2017). Of these, ten had been independently targeted by them for cutout evaluation based solely on a simple cut on the colour.
Besides accepting or rejecting a target, this procedure also assigned grades corresponding to different diagnostics (see Schechter et al., 2017, for details). For the sake of completeness, we retain the ufom overall figure of merit in what follows, even though it was not used to prioritize candidates for follow-up.
2.2.2 General candidate properties
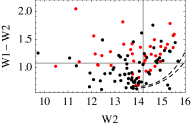
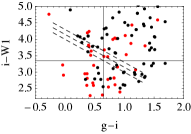
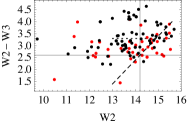
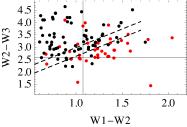
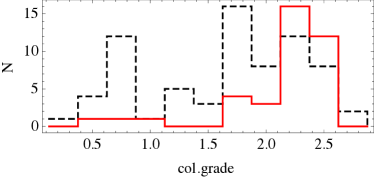
The cutout-modelling stage enabled a further refinement of the visual-inspection survivors into model-accepted and model-rejected candidates. Their selected colour-magnitude diagrams are displayed in figure 1. The histograms of colour-grade of the model-accepted and rejected targets are shown in the bottom panel. Between half and two thirds of the DR2 targets with grade are accepted by the cutout modelling.
From the colour-magnitude diagrams, model-rejected targets tend to lie at lower or higher which are regions typically populated by galaxies or, at best, quasars with an extended host. The dashed lines in vs separate most of the model-accepted candidates from the rest, with different thresholds. The upper line also happens to separate the 10 SQLS small separation lenses of Inada et al. (2012) from about half of the 40 false-positives in that search. This suggests that adds information over the original ANN implementation (see in particular Williams et al., 2017, for a detailed discussion), and in fact this is used in the outlier selection method (Agnello, 2017) that has been applied to the DR3 data.
3 Follow-up
Long-slit spectroscopy was used to ascertain the nature of the candidates. The DR2 and SDSS candidates were mostly observed with the Andalucia Faint Object Spectrograph and Camera (ALFOSC) at the 2.6 m Nordic Optical Telescope (NOT) in La Palma (Spain). The remaining candidates from DR2 and DR3 were observed with the ESO Faint Object Spectrograph and Camera (EFOSC2) at the 3.6 m New Technology Telescope (NTT) in La Silla (Chile). The objects are listed in Table 3.
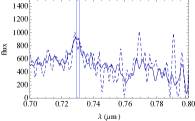
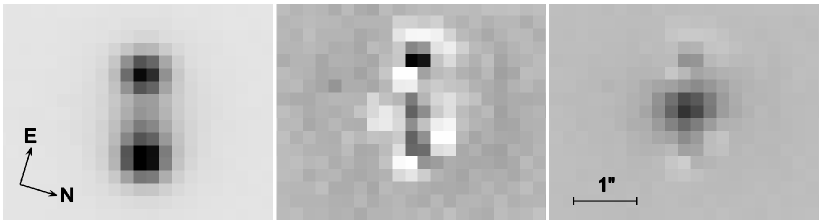
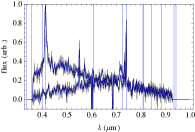
For one object, A0140-1152, we also show spectra taken with IMACS at the 6.5m Walter Baade Telescope at Magellan (Las Campanas), where a red galaxy at is detected between two quasar images at making this system most likely a lens. This system was observed on UT Nov 28, 2016, IMACS was set up in ‘long’ f/4 camera mode, and a filter was used.
Custom routines were used for data reduction, as specified below for the two setups. The sky subtraction and 1D spectral extraction were performed in a second stage, on the reduced 2D spectra (Agnello et al., 2015b; Schechter et al., 2017). At each wavelength pixel, the raw data in the spatial direction were modeled as a superposition of two (or more) Gaussians and a spatially-uniform component for the sky lines. Within each science frame, the Gaussians are forced to have the same FWHM and the same separation across the whole wavelength range, even though their peak positions are allowed to vary (linearly) with wavelength. The extracted 1D spectra of each component were then co-added, and data and noise spectra were obtained via de-trended fluctuation analysis, with a 5+5 wavelength-pixel window and a quadratic polynomial for the de-trending. This procedure allowed us to reliably separate the multiple components in all observed candidates despite sub-optimal observing conditions, with seeing FWHM between and and clouds during the NOT observations, and variable weather and seeing during the NTT observations.
3.1 NOT Follow-up
The data were obtained on 2016 February 5 and 6 as part of a Niels Bohr Institute Guaranteed Time Observing Program (P52-802). We positioned wide long-slits through the candidate multiple images and used ALFOSC with the #4 grism, covering thea wavelength range with a dispersion of . Two science exposures were taken per object, with arc (HeNe, Ar) and flat lamps bracketing each observing block. Standard Iraf routines were used for bias subtraction, flat-field corrections and wavelength solution.
3.2 NTT Follow-up
The data were obtained on 2016 Sept.25-27th and Dec.5th at the ESO-NTT (PI Anguita, 097.A-0473(A), 098.A-0395(A)). The wise long-slit in combination with EFOSC grism #13 was used, covering with . Mostly one exposure was taken per object, with calibrations taken once per night. The ESO-provided pipeline (v2.5.5) was used for data reduction.
4 Discussion and Conclusions
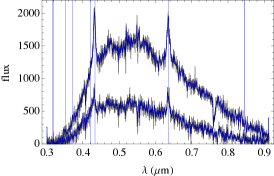
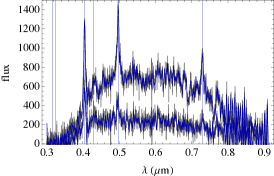
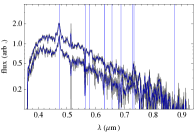
Long-slit spectra of twenty-seven objects were obtained (tab. 3), out of which seven were nearly identical quasar pairs (NIQs), i.e. pairs of quasars with the same lines at the same redshift and smooth flux-ratios as measured on the continua. These could be veritable lenses where the deflector has not been detected yet, or truly physical pairs of quasars. At least one of them, A0140-1152, is a lens based on the deeper Magellan spectra (fig. 4). An eighth system, A1020-1002, is a pair of quasars at (fig. 5) and could also be a NIQ, with flux ratio measured between C iii and Mg ii, but deeper data are needed. Some, peculiar false positives are discussed in Sect.4.2.
4.1 Near-Identical Quasar Pairs
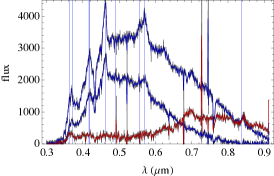
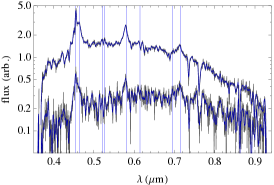
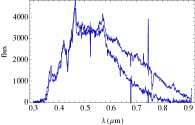
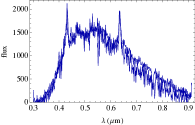
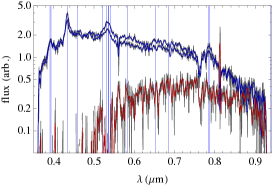
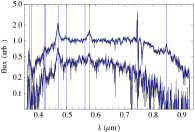
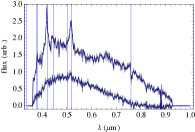
Seven objects have two quasar spectra with the same lines at the same redshift and same shapes, and monotonic flux-ratios as measured on the continua (figs. 2,3,4). Four, marked by asterisks in Tab. 3, were also flagged independently in the search described by Schechter et al. (2017, whence the terminology of NIQs is adopted). In all cases the traces could be reliably deconvolved, and their flux ratios vary from to for the sample. One NIQ was found among the four SDSS targets with quasar fibre spectra, the others being quasar+quasar or quasar+star alignments. Two systems in particular are described below.
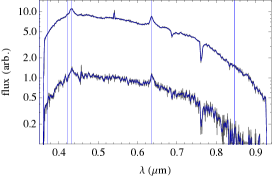
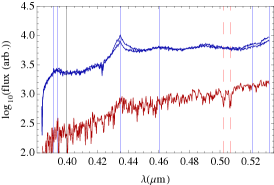
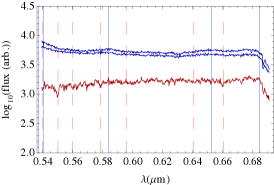
4.1.1 A1012-0307, a known lens with power-law flux-ratios
A1012-0307 is the known lens LBQS1009-0252 (Hewett et al., 1994). The NTT data can be well deblended into two quasar spectra, showing the same lines with the same shape (fig. 2). The redshift from NTT spectra is slightly higher than the one () quoted in its original discovery paper. Differently from the other NIQs, whose flux ratios are almost constant with wavelength, in this case the flux ratio is well fitted over the whole spectral range by In principle, such a variation could be produced by intrinsically different continua in two physically separate quasars, or significant differential reddening by a foreground galaxy. In simple models of doubly imaged quasars (without shear), the fainter image forms closer to the lens and so can be more heavily reddened. Still within the lensing hypothesis, also microlensing should be considered as a possible source of chromatic flux ratios.
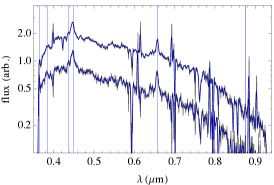
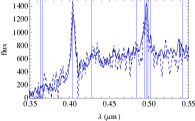
4.1.2 A0140-1152, a new quasar lens
A0140 was observed at the NTT and Magellan independently (fig. 4), having been respectively targeted in the ATLAS-DR3 catalog and separately found via cutout modelling in the whole footprint. Both data-sets revealed nearly-identical quasar spectra, plus a red ‘excess’ between the two traces that the Magellan spectra and acquisition images confirmed to be a galaxy at with prominent Ca (G,H,K) absorption features. The flux-ratio between the two quasar images, as measured on the continua, is between C lines on the blue side and on the red side; the NTT spectra gave between the C iii/Fe complex and Mg ii. The small discrepancy may be ascribed to lower S/N, atmospheric dispersion corrections and slight slit misalignment.
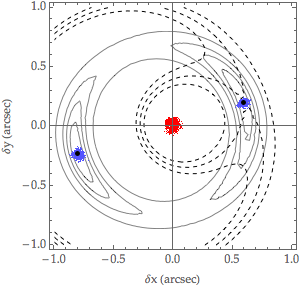
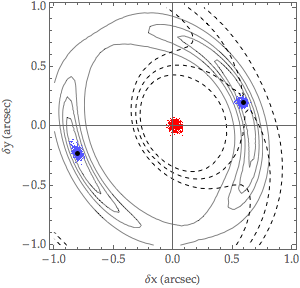
For this system, we also run simple lens models. From the IMACS band acquisition image, aligned with the slit (fig. 4), the relative positions and magnitudes of the quasar images and deflector have been obtained, as listed in table 1. The flux ratio between images A and B varies depending on whether it is measured on the continua or on (continuum-subtracted) emission lines, or on the broad-band IMACS image. Besides instrumental effects (chromatic atmospheric refraction and slit-losses), this chromaticity results from differential extinction in the deflector and microlensing. We then adopt as a measured flux-ratio constraint, which is obtained on the emission lines and accounts for systematics in continuum-subtraction, differential extinction, and instrumental effects. The observational constraints are then: the positions of images A,B relative to G; and the flux ratio An additional constraint is the presence of only two (observed) quasar images.
The deflector (G) is described as a Singular Isothermal Ellipsoid (SIE, Kassiola & Kovner, 1993), and we consider an external shear component to account for (possible) corrections to the quadrupole, e.g. from additional mass along the line of sight or by deviations from a simple, SIE model. A model with free shear and ellipticity is unconstrained, so we explore three restricted models: mod.(a, SIE) adopts a SIE for the deflector, without external shear; mod.(b, SIS+XS) adopts the spherical limit (1) for G and includes external shear; mod.(c,SIE+XS) includes external shear, and has G described by a SIE with and p.a. deg (E of N) as inferred from the IMACS image.
A model with SIE+XS and wider, uniform priors on all parameters is discussed in the Appendix. Since this last model is unconstrained, we use it to characterize the quadrupole degeneracy between shear and ellipticity. To this aim, we adopt unrealistically low positional uncertainties, exploring a ‘tube’ of solutions.
Figure 6 summarizes the lens model results, displaying the Fermat potential contours (dashed) and a set of isophotes in the hypothesis of a circular source, for best-fitting SIE models (b,c). The inferred parameters are listed in Table 2. The resulting Einstein radius from (a,b) is very close to half the A-B image separation, and slightly higher for models with more substantial shear/ellipticity. The axis ratio from mod.(b,SIE) is significantly rounder than the value suggested by IMACS images. This may mean that either the lens axis ratio from the IMACS image is biased (due to the proximity of quasar images, coarse resolution, PSF mismatch), or that the overall quadrupole is small but substantial shear and ellipticity are present.
As exemplified in figure 6, models with different shear/ellipticity result in different Einstein ring shapes (see also Kochanek et al., 2001). Deeper and higher-resolution imaging data would be useful to: obtain a robust measurement of the lens ellipticity; and detect extended emission from the source host galaxy, thereby adding constraints to the lens model and breaking quadrupole degeneracies.
| img. | (′′) | (′′) | mag_i |
|---|---|---|---|
| r.a. | dec. | ||
| A | 0.592 | 0.199 | 18.226 |
| B | 0.804 | 0.231 | 18.484 |
| G | [ 0.00 | 0.00 ] | 19.253 |
| parameter | mod.(a) | mod.(b) | mod.(c) |
|---|---|---|---|
| (SIS+XS) | (SIE) | (SIE) | |
| [1.0] | [0.5] | ||
| — | [28.0] | ||
| (deg E of N) | |||
| — | |||
| (deg N of W) | |||
| [0.0] |
4.2 Peculiar false positives
Some contaminants, such as single quasars and quasar-star alignments, are common in similar searches, like the SQLS (Oguri et al., 2006; Inada et al., 2012). Others, such as narrow-line galaxies (NLGs) at and star-star alignments, are due to the lack of spectroscopic or UV-excess pre-selection. Some (cf fig. 5) deserve a special mention. A1507-1442 was flagged as a ‘sure lens’ because visual inspection showed a red galaxy between the two blue point-sources with identical colours identified automatically by cutout modelling, which however the ALFOSC data identified as stars. It had ufom=0.76; its UVx (not entering the definition of ufom) was mag redder than the threshold adopted used by Schechter et al. (2017). In general, this could also indicate a source at but this was not the case here. Similar considerations hold for A2243-3840 (ufom=0.56, ). A2338-2700 shows two blue clumps on either side of a ‘yellow’ galaxy, whose NTT spectra have one secure line (possibly Mg ii at ) and no information on the central galaxy; preliminary imaging data (SOAR-SAM, PI Motta; not shown here) suggest that this system is probably a merger of NLGs, rather than a low-redshift lens. Spectra of A0054-3951 can be clearly de-blended, yielding a galaxy at (Mg ii, O ii, H) or a quasar at (C iii Ne v, [Ne iv]), plus a heavily reddened companion. Finally, the nature of A0008-3655 is unclear, as the lines in the fainter object may just be imperfections in the spectral de-convolution.
| name | mag_i | grade | ufom | telescope | outcome | notes | ||
| A1507-1442 | 20.10 | 2.01 | 0.76 | NOT | contaminant | galaxy seen through two stars | ||
| A1132-0730(s),∗ | 18.31 | 2.4 | 0.44 | NOT | NIQ | |||
| A1112-0335∗ | 19.33 | 2.35 | 0.46 | NOT | NIQ | |||
| A1428-0302 | 19.70 | 2.0 | — | NOT | contaminant | stars? | ||
| A0326-3122∗ | 19.54 | 2.0 | 0.47 | NTT | NIQ | |||
| A2338-2700(s) | 18.45 | 2.50 | — | NTT | contaminant | (Mg ii), merging NLGs | ||
| A2213-2652(s),∗ | 18.10 | 2.24 | 0.51 | NTT | NIQ | |||
| A0008-3655 | 18.57 | 2.00 | 0.14 | NTT | unclear | qso | ||
| A0015-1116 | 20.02 | 2.21 | 0.34 | NTT | contaminant | star+qso | ||
| A0054-3951 | 19.40 | 1.50 | 0.57 | NTT | uncertain | or | ||
| A0106-1030 | 20.05 | 2.00 | 0.22 | NTT | contaminant | star+qso | ||
| A0355-3448 | 19.26 | 2.18 | 0.42 | NTT | contaminant | qso+qso, | ||
| A2145-3927 | 19.00 | 2.36 | 0.19 | NTT | contaminant | single qso | ||
| A2243-3840 | 19.69 | 2.09 | 0.56 | NTT | contaminant | qso and galaxy | ||
| A2356-1213 | 19.31 | 2.31 | 0.25 | NTT | contaminant | star+qso | ||
| S1128+2402 | 17.75 | 2.83 | — | NOT | NIQ | |||
| S1030+6055 | 19.25 | 2.89 | — | NOT | contaminant | qso+star | ||
| S1332+3433 | 18.74 | 2.20 | — | NOT | contaminant | qso+star | ||
| S0332-0021 | 19.32 | 2.78 | — | NOT | contminant | qso+qso | ||
| A0140-1152∗ | 17.63 | — | — | NTT | lens | |||
| A1044-1639(s) | 18.33 | — | — | NTT | contaminant | NLG | ||
| A1020-1002(s) | 18.14 | — | — | NTT | pair/NIQ | |||
| A0054-2404 | 19.72 | — | — | NTT | contaminant | NLG+qso at ? | ||
| A0202-2850 | 19.42 | — | — | NTT | contaminant | NLG | ||
| A0303-3331(s) | 19.20 | — | — | NTT | contaminant | NLGs? | ||
| A2201-3613 | 15.61 | — | — | NTT | contaminant | stars | ||
| A1012-0307(s) | 18.05 | — | — | NTT | known lens | |||
| A1116-0657 | 17.25 | 2.42 | — | — | known lens | not obs. |
4.3 Further candidates from a search in Gaia, and three additional lenses
Further development can be brought by the high spatial resolution of Gaia (Lindegren et al., 2016), where Finet et al. (2012) estimated lensed quasars to be found within a limiting magnitude . In fact, in the current Gaia-DR1, about of known quasar lenses and pairs are recognized as multiple sources with separations suggesting that these systems can be found by selecting quasar-like objects in WISE and then retaining those that correspond to Gaia multiplets. The details of this search are discussed elsewhere (Agnello, 2017). When applied to objects with a counterpart in the public ATLAS footprint (i.e. covered in at least one band in DR3), this search recognized three known lenses (LBQS1009-0252, RXJ1131-1231, and W2329-1258: Hewett et al., 1994; Sluse et al., 2003; Schechter et al., 2017). A fourth lens, HE1113-0641 (Blackburne et al., 2008, at 11h16m-06d57m in J2000 system), was re-discovered through the target selection of Sect. 2.1, but due to its very small separation it is not resolved as a multiplet by Gaia-DR1.
To facilitate follow-up, in Table 4 we list additional candidates that could not be followed-up before this paper was completed, due to time and visibility constraints. Besides four identified in DR2 target+candidate selection and one found in DR3 with outlier selection (Agnello, 2017), eleven (denoted by ‘WGAhhmm-ddmm’ names) are discovered purely from the Gaia multiplet search333Search performed in November 2016, candidate selection in February 2017.. Some of these were identified independently by the search of Schechter et al. (2017), using ATLAS cutout modelling of WISE-selected objects. Others, having ATLAS coverage in just two bands, could not be selected by the cutout modelling approach, but are found by the Gaia multiplet selection. Most of the candidates have Pan-STARRS1 imaging, which we use to further grade them based on visual inspection.
After this paper was completed with the 2016 campaign results, three candidates of Table 4 (WGA0235-2433, WGA0259-2338, WGA0146-1133) were spectroscopically confirmed as lenses/NIQs in the fall of 2017, by two independent campaigns (NTT, PI Anguita; and WHT, Lemon et al., private comm.). These also fall in the DES footprint, where deeper imaging in good seeing conditions shows red galaxies between the pairs of blue images (Agnello et al., 2017). As the discussion in Section 4.1.2 and by (Agnello et al., 2017) demonstrates, lens models on the discovery images are limited to on the Einstein radii, due to systematics from the quadrupole contributions of shear and ellipticity. Besides that, in order to translate Einstein radii into masses, the redshifts of deflectors are needed. For these three systems, the data collected in 2017 are not deep enough to obtain a deflector redshift.
5 Summary and Prospects
A rare-object search, charting the VST-ATLAS public footprint for lensed quasars, has given 7 nearly identical quasar pairs (NIQs), including a new quasar lens, out of a sample of 27 objects observed in 2016. The number of NIQs among followed-up systems could be higher, as two objects are confirmed quasars but currently inconclusive and three additional lenses (tab. 4) have been confirmed as NIQs/lenses in 2017 (PI Anguita; in prep.) after this paper was completed. This experiment demonstrated that previous searches (e.g. the SQLS, Oguri et al., 2006; Inada et al., 2012; More et al., 2016) can be extended to the regime of patchy waveband coverage and absence of band or spectroscopic pre-selection, still with moderate () seeing and depth ( in band). Due to the heterogeneous quality of survey data and range of expected image separations, a combination of techniques (Morgan et al., 2004; Ofek et al., 2007; Agnello et al., 2015a; Agnello, 2017, and Section 2 above) has been deployed.
The model-based candidate selection (applied to ATLAS-DR2) seems to give results comparable to the outlier-based target selection (applied to DR3), but is a necessary step to ascertain that the detected point sources have compatible colours and in fact it found lenses (Schechter et al., 2017) that were not flagged by the target selection. On the other hand, two systems (A1012-0307, A1020-1002) were identified via target selection, whereas independent cutout modelling had excluded them. While the lenses discovered in previous campaigns seem biased towards the colours of nearby quasars (see Williams et al., 2017, for a discussion), the ones selected here occupy distinctive regions of optical/IR colour-magnitude diagrams (fig. 1), including sources at redshift
| name | mag_i | grade | ufom | release | Pan-STARRS1? | 2017 follow-up(d) | ||
|---|---|---|---|---|---|---|---|---|
| A1501-1404 | 19.37 | 2.34 | 0.13 | DR1+2 | good | |||
| A1523-0517 | 18.78 | 1.91 | 0.35 | DR1+2 | good | |||
| A1528-1341 | 18.44 | — | — | DR3 | good | |||
| WGA1122-0529 | 18.45 | — | 0.52 | DR3+Gaia | good | |||
| WGA0336-2406(a) | 18.72 | — | 0.45 | DR3+Gaia | dubious | |||
| WGA1149-0747 | 17.94 | — | 0.37 | DR3+Gaia | qso+gal? | |||
| WGA0235-2433 | 17.12 | — | — | DR3+Gaia | likely a lens | lens(d) | ||
| WGA0259-2338 | 18.41 | — | — | DR3+Gaia | likely a lens | lens(d) | ||
| WGA0146-1133(a) | 17.48 | — | — | DR3+Gaia | likely a lens | lens(d) | ||
| WGA0343-3309 | 18.41 | — | — | DR3+Gaia | outside footprint | |||
| WGA0030-2326 | 19.05 | — | — | DR3+Gaia | good | low S/N(d) | ||
| WGA1216-1138(c) | 18.29 | — | — | DR3+Gaia | contaminant | |||
| WGA1112-1855(c) | 19.39 | — | — | DR3+Gaia | contaminant | |||
| WGA1409-1444(c) | 17.77 | — | — | DR3+Gaia | contaminant | |||
| A1201-0324(c) | 19.10 | 2.45 | 0.15 | DR1+2 | contaminant | |||
| A1333-0453(c) | 19.41 | 2.34 | 0.19 | DR1+2 | contaminant |
5.1 Spectral classification of pairs/NIQs and contaminants
The primary aim of this search was to assemble a comprehensive sample of lenses/NIQs over the ATLAS (publicly accessible, DR3) footprint. From a sample of objects with varying amount of multi-band information, over444This is an estimate of the effective footprint, which accounts for inhomogeneous waveband coverage of the DR3 footprint as of 2016, when the searches were performed. deg2 and mostly brighter than a sample of objects was isolated for follow-up spectroscopy (Tables 3, 4). Given these final numbers, the spectra of all candidates can be visually inspected with ease, the most obvious contaminants excluded, and pairs/NIQs or lenses can be examined individually.
Upcoming spectroscopic surveys will render this task less immediate. For example, Gaia-DR4 is expected to provide low-resolution optical spectra of all detected sources (down to roughly ), over the whole sky, and the Euclid Wide survey (due 2021-2027) will obtain NIR slitless spectroscopy of objects down to over deg If our ATLAS search is to be rescaled to these expectations, the number of spectra to be examined increases significantly and objective criteria should be devised to discard as many contaminants as possible, while also ensuring a complete selection, and retaining a ‘manageable’ sample for further inspection.
Learning from the sample presented in this paper, the following guidelines can be devised for objective (possibly semi-automatic) spectral classification of candidates. Since we are tasked with classification of spectra, a zeroth-order criterion would be the detection of the same (possibly broad) emission lines in both objects, at the same redshifts within a measurement accuracy. This immediately eliminates chance alignments of different objects, and red galaxies seen between blue stars. A first criterion is: given two spectra of putative multiple images, can they be fit as a common source spectrum with extinction/microlensing effects? Based on the spectra shown above, this translates into a model spectrum and a prescription for flux-ratios and chromatic effects. The flux-ratio laws explored in this paper are either simple constants, in two wavelength ranges, or power-laws to imitate differential extinction. In order to account for the presence of a possible lens, which can contribute on the redder side of the spectra, the goodness-of-fit can be parameterized by two values, one from a model fit below (where the most prominent emission lines lie, typically), and one fit to A second criterion is a refinement of the first: are the flux-ratios consistent among different lines, or among different ranges on the continua? This would then amount to three values overall: one for the continuum-subtracted lines, one on the continua below and one for The combination of these three criteria, accounting for discrepancies in the flux-ratios over lines and continua in different wavelength ranges, excludes all of the contaminants shown in this paper and retains all of the pairs/NIQs/lenses. Allowing for chromatic effects is important in order not to lose veritable lenses (e.g. LBQS1009-0252), and recognize possible lenses whose deflectors contribute to the spectra but are not bright enough to be resolved as separate spectral traces. In presence of spectra with good S/N, one can add a third criterion to classify objects as pairs or NIQs/lenses, by requiring that (once continuum-subtracted) the dispersions on corresponding lines are comparable across the multiple-image spectra. Requiring that the spectra contain broad lines at and with comparable dispersions (not simply the equivalent widths) eliminates most contaminants in the form of binary NLGs and binary quasars.
The criteria listed above can be translated into spectral grades, each corresponding roughly to the likelihood of realizing a NIQ/lens. The use of model values provides a smooth grading, and uncertainties in the observed spectra can be translated into data-driven uncertainties in the grades. This procedure in turn enables a quantitative (possibly automatic) evaluation of spectra, while also allowing for some flexibility in candidate ranking. A smooth, data-driven ranking scheme, which also incorporates uncertainties and is based on spectroscopic rather than broad-band information, can be tested on data from different campaigns. Scaling to larger samples, the spectra provided by Gaia-DR4 can be used as a testbed on large datasets, in view of automated and spectroscopic lens searches by the Euclid mission.
Acknowledgments
The data presented here were obtained in part with ALFOSC, which is provided by the Instituto de Astrofisica de Andalucia (IAA) under a joint agreement with the University of Copenhagen and NOTSA. This paper includes data gathered with the 6.5 meter Magellan Telescopes located at Las Campanas Observatory, Chile.
TT acknowledges support from NSF through grant AST-1450141, and from the Packard Foundation through a Packard Research Felllowship. VM acknowledges support from Centro de Astrofísica de Valparaíso. TA and YA acknowledge support by proyecto FONDECYT 11130630 and by the Ministry for the Economy, Development, and Tourism’s Programa Inicativa Científica Milenio through grant IC 12009, awarded to The Millennium Institute of Astrophysics (MAS). DM acknowledges financial support from the Instrument center for Danish Astrophysics (IDA). KR is supported by Becas de Doctorado Nacional CONICYT 2017.
AA is grateful to Mike Read for explanations on the ATLAS releases and support with the queries, to Alain Smette and Dominique Sluse for advice on quasar pairs, as well as to Johan Fynbo for sharing part of the NOT guaranteed time in February 2016 for this project.
References
- Agnello et al. (2015a) Agnello, A., Kelly, B. C., Treu, T., & Marshall, P. J. 2015, MNRAS, 448, 1446
- Agnello et al. (2015b) Agnello, A., Treu, T., Ostrovski, F., et al. 2015, MNRAS, 454, 1260
- Agnello (2017) Agnello, A. 2017, MNRAS, 471, 2013
- Agnello et al. (2017) Agnello, A., et al., MNRAS subm., arxiv:1711.03971
- Assef et al. (2013) Assef, R. J., Stern, D., Kochanek, C. S., et al. 2013, ApJ, 772, 26
- Blackburne et al. (2008) Blackburne, J. A., Wisotzki, L., & Schechter, P. L. 2008, AJ, 135, 374-379
- Cárdenas et al. (2013) Cárdenas, V. H., Bonilla, A., Motta, V., & del Campo, S. 2013, JCAP, 11, 053
- Chambers et al. (2016) Chambers, K. C., Magnier, E. A., Metcalfe, N., et al. 2016, arXiv:1612.05560
- Chantry et al. (2010) Chantry, V., Sluse, D., & Magain, P. 2010, AA, 522, A95
- Dark Energy Survey Collaboration et al. (2016) Dark Energy Survey Collaboration, Abbott, T., Abdalla, F. B., et al. 2016, MNRAS, 460, 1270
- de Jong et al. (2013) de Jong, J. T. A., Verdoes Kleijn, G. A., Kuijken, K. H., & Valentijn, E. A. 2013, Experimental Astronomy, 35, 25
- Ding et al. (2017) Ding, X., Liao, K., Treu, T., et al. 2017, MNRAS, 465, 4634
- Dinshaw et al. (1998) Dinshaw, N., Foltz, C. B., Impey, C. D., & Weymann, R. J. 1998, ApJ, 494, 567
- Farina et al. (2014) Farina, E. P., Falomo, R., Scarpa, R., et al. 2014, MNRAS, 441, 886
- Finet et al. (2012) Finet, F., Elyiv, A., & Surdej, J. 2012, MmSAI, 83, 944
- Hagen et al. (1999) Hagen, H.-J., Engels, D., & Reimers, D. 1999, ApJS, 134, 483
- Hewett et al. (1994) Hewett, P. C., Irwin, M. J., Foltz, C. B., et al. 1994, AJ, 108, 1534
- Inada et al. (2012) Inada, N., Oguri, M., Shin, M.-S., et al. 2012, AJ, 143, 119
- Kassiola & Kovner (1993) Kassiola, A., & Kovner, I. 1993, Liege International Astrophysical Colloquia, 31, 571
- Kochanek et al. (2001) Kochanek, C. S., Keeton, C. R., & McLeod, B. A. 2001, ApJ, 547, 50
- Lindegren et al. (2016) Lindegren, L., Lammers, U., Bastian, U., et al. 2016, AA, 595, A4
- Morgan et al. (2004) Morgan, N. D., Caldwell, J. A. R., Schechter, P. L., et al. 2004, AJ, 127, 2617
- More et al. (2016) More, A., Lee, C.-H., Oguri, M., et al. 2016, arXiv:1608.06288
- Motta et al. (2017) Motta, V., Mediavilla, E., Rojas, K., et al. 2017, ApJ, 835, 132
- Ofek et al. (2007) Ofek, E. O., Oguri, M., Jackson, N., Inada, N., & Kayo, I. 2007, MNRAS, 382, 412
- Oguri et al. (2006) Oguri, M., Inada, N., Pindor, B., et al. 2006, AJ, 132, 999
- Oguri & Marshall (2010) Oguri, M., & Marshall, P. J. 2010, MNRAS, 405, 2579
- Oguri et al. (2014) Oguri, M., Rusu, C. E., & Falco, E. E. 2014, MNRAS, 439, 2494
- Peng et al. (2006) Peng, C. Y., Impey, C. D., Rix, H.-W., et al. 2006, ApJ, 649, 616
- Rauch et al. (2005) Rauch, M., Becker, G. D., Viel, M., et al. 2005, ApJ, 632, 58
- Refsdal (1964) Refsdal, S. 1964, MNRAS, 128, 307
- Rorai et al. (2017) Rorai, A., Hennawi, J. F., Oñorbe, J., et al. 2017, Science, 356, 418
- Sánchez & DES Collaboration (2010) Sánchez, E., & DES Collaboration 2010, Journal of Physics Conference Series, 259, 012080
- Schechter et al. (1993) Schechter, P. L., Mateo, M., & Saha, A. 1993, PASP, 105, 1342
- Schechter et al. (2017) Schechter, P. L., Morgan, N. D., Chehade, B., et al. 2017, AJ, 153, 219
- Sluse et al. (2012) Sluse, D., Hutsemékers, D., Courbin, F., Meylan, G., & Wambsganss, J. 2012, AA, 544, A62
- Shanks et al. (2015) Shanks, T., Metcalfe, N., Chehade, B., et al. 2015, MNRAS, 451, 4238
- Skrutskie et al. (2006) Skrutskie, M. F., Cutri, R. M., Stiening, R., et al. 2006, AJ, 131, 1163
- Sluse et al. (2003) Sluse, D., Surdej, J., Claeskens, J.-F., et al. 2003, AA, 406, L43
- Sluse et al. (2015) Sluse, D., Hutsemékers, D., Anguita, T., Braibant, L., & Riaud, P. 2015, AA, 582, A109
- Smette et al. (1992) Smette, A., Surdej, J., Shaver, P. A., et al. 1992, ApJ, 389, 39
- Stern et al. (2012) Stern, D., Assef, R. J., Benford, D. J., et al. 2012, ApJ, 753, 30
- Suyu et al. (2017) Suyu, S. H., Bonvin, V., Courbin, F., et al. 2017, MNRAS, 468, 2590
- Treu (2010) Treu, T. 2010, ARA&A, 48, 87
- Treu & Marshall (2016) Treu, T., & Marshall, P. J. 2016, AA Rev, 24, 11
- Wright et al. (2010) Wright, E. L., Eisenhardt, P. R. M., Mainzer, A. K., et al. 2010, AJ, 140, 1868
- Williams et al. (2017) Williams, P., Agnello, A., & Treu, T. 2017, MNRAS, 466, 3088
- Williams et al. (2017b) Williams, P. R., Agnello, A., Treu, T., et al. 2017, MNRAS subm. arXiv:1706.01506
- Wisotzki et al. (1993) Wisotzki, L., Koehler, T., Kayser, R., & Reimers, D. 1993, AA, 278, L15
- Zahedy et al. (2016) Zahedy, F. S., Chen, H.-W., Rauch, M., Wilson, M. L., & Zabludoff, A. 2016, MNRAS, 458, 2423
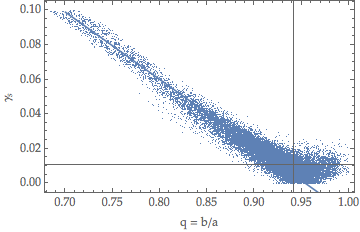
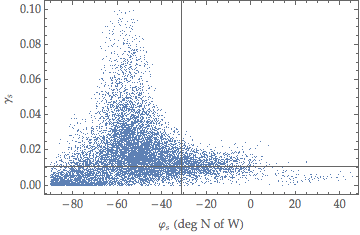
Appendix A The ‘locus’ of SIE+XS solutions for A0140-1152
A model with SIE and external shear, when fit to the image configuration and flux ratios of a double, is unconstrained. Here, we explore the main degeneracies among parameters that result in the same observed constraints. In what follows, we fix the lens p.a. to that measured from the cutouts, i.e. 28 deg E of N, with an uncertainty of 5 deg.
Besides the measurements (image positions, flux ratios), an additional constraint is the presence of only two observed images; this splits the parameter space into different connected components, possibly more than two, i.e. there may be two (separate) connected components within which two images are produced. These connected components are not compact, since there are sequence of parameter choices that converge to solutions where neither two nor four (non-degenerate) images are produced.
The ‘locus’ is the set of points (parameter choices) for which two images are produced and the measured constraints are satisfied. The projection of the ‘locus’ on different parameters is non-trivial; for example, the Einstein radius is for most values of the axis ratio, increasing towards when approaches 0.35 (). This explains why is robust against the chosen model (‘a’ or ‘b’ in the main text), unless one posits significant ellipticity in the lens. When the shear is small () and the solutions are almost independent of it. Within there is a simple relation between shear amplitude and flattening:
| (3) |
slightly steeper (resp. shallower) at lower (resp. higher) At shear values above 0.02, the ‘locus’ projects almost orthogonally on the shear angle, i.e. deg almost independently of the shear amplitude. This is just because shear and ellipticity must compensate to yield a small quadrupole (to produce only two images), and the lens p.a. is kept fixed (within 5 degree tolerance).
These relations are shown in figure 7. Since the ‘locus’ is topologically non-trivial, we explored a tube around it, adopting small but finite uncertainties on the constraints. The non-compactness of the locus can be understood as does not approach the same value as approaches deg from the right or from the left. The plots are truncated at just for visual convenience. The shear and flattening ‘saturate’ towards and This also explains the parameters inferred for the restricted models (a,b) in the main text.