ALMA and VLA Observations of the HD 141569 System
Abstract
We present VLA 9 mm (33 GHz) observations of the HD 141569 system from semester 16A. The observations achieve a resolution of 0.25 arcsec ( au) and a sensitivity of . We find (1) a Jy point source at the location of HD 141569A that shows potential variability, (2) the detected flux is contained within the SED-inferred central clearing of the disc meaning the spectral index of the dust disc is steeper than previously inferred, and (3) the M dwarf companions are also detected and variable. Previous lower-resolution VLA observations (semester 14A) found a higher flux density, interpreted as solely dust emission. When combined with ALMA observations, the VLA 14A observations suggested the spectral index and grain size distribution of HD 141569’s disc was shallow and an outlier among debris systems. Using archival ALMA observations of HD 141569 at 0.87 mm and 2.9 mm we find a dust spectral index of . The VLA 16A flux corresponds to a brightness temperature of K, suggesting strong non-disc emission is affecting the inferred grain properties. The VLA 16A flux density of the M2V companion HD 141569B is Jy, corresponding to a brightness temperature of K and suggesting significant stellar variability when compared to the VLA14A observations, which are smaller by a factor of .
keywords:
stars: circumstellar matter; stars: HD 1415691 Introduction
HD 141569 is a multiple star system that contains an extensive circumstellar disc of dust and gas. The disc was first detected by IRAS (Walker & Ashcroft, 1988; Andrillat et al., 1990) and later imaged in scattered light by HST. The scattered light images revealed that the disc has large spiral/ring structures at separations of to 400 au (Van Den Ancker et al., 1998; Fisher et al., 2000; Weinberger et al., 2000; Clampin et al., 2003). Simulations by Augereau & Papaloizou (2004) showed that some of these morphological features are consistent with perturbations by two nearby ( arcsec) M dwarfs (Weinberger et al., 2000; Reche et al., 2009), but suggested that planetary perturbations may also be required to explain the morphology.
Interior to the spiral structure is an additional dust disc, which has been partly imaged in scattered light (Konishi et al., 2016) and resolved by ALMA at 870 m (345 GHz) (White et al., 2016). We refer to this component as the “warm” disc and the outer rings/spirals as the “cold” disc to distinguish between these morphologically separated areas. The scattered light and ALMA observations show that the outer radius of the warm disc is at about 55 au, leaving a large gap between the warm and cold components. This further suggests that an embedded object, such as a planet or planets, may be responsible for some of the disc structure. Furthermore, SED modelling predicts that the warm disc has an inner radius of 11 to 17 au (Malfait et al., 1998; Maaskant et al., 2015), which again, may require the presence of an unseen companion (Brittain et al., 2003).
There is also a resolved gas disc, observed in CO emission, that extends from about 30 to 210 au (Flaherty et al., 2016; White et al., 2016), straddling the warm and cold components. The origin of this gas is debated in the literature, i.e., whether it is leftover from the disc’s formation or being released from material within the disc (such as the dynamical evolution of comets; e.g., Dent et al., 2014). For a more extensive overview of the previous gas and debris observations of HD 141569, see White et al. (2016).
In addition to the large-scale morphological features, HD 141569’s disc is of interest because of its potentially unique grain size distribution. Previous Karl G. Jansky Very Large Array (VLA) 9 mm (33 GHz) observations from Semester 14A (MacGregor et al., 2016) measured an unresolved flux density of Jy centred on HD 141569A and its disc (the M dwarf subsystem was resolved separately). This emission was attributed mainly to the warm disc due to the expectation that the flux density from HD 141569A would be negligible. When combined with shorter wavelength observations, the 9 mm flux density implies that the warm disc must have a spectral slope . If the emission is indeed due to dust in the warm disc, the result implies that the corresponding grain size distribution is very shallow and a clear outlier compared with debris discs (MacGregor et al., 2016). If this interpretation is correct, then HD 141569’s disc may reflect a unique (or short lived) evolutionary state. There may however be other reasons for the large 9 mm flux density. The beam size for the semester 14A observations was arcsec2 ( au at the system distance), which may include diffuse emission from the cold disc that was missed in some of the higher frequency, higher resolution observations. However, this would still be difficult to reconcile with typical spectral slopes.
Another possible source of contamination is HD 141569A itself. HD 141569A is a Herbig Ae/Be pre-main sequence star classified as B9.5Ve by Jaschek & Jaschek (1992) and A2Ve, as well as a possible Boo member, by Murphy et al. (2015). The Boo features suggest that HD 141569A is accreting dust-poor gas from its disc (Venn & Lambert, 1990). Mendigutía et al. (2017) detect Hα emission coming from within au of HD 141569A, but were unable to constrain whether or not the emission is from accretion. The atmospheres around Herbig Ae/Be stars are largely unstudied observationally at millimetre/centimetre (mm/cm) wavelengths and the corresponding emission may not be captured well in stellar models. Moreover, the submm and cm emission from main sequence stars other than the Sun are just now being explored, e.g. Cen (Liseau et al., 2015); AU Mic (MacGregor et al., 2013); Fomalhaut (White et al., 2017); Vega (Hughes et al., 2012); Sirius A (White et al., in prep). If significant non-disc emission is present in pre-MS and MS stars, then inferred dust properties in circumstellar discs may be biased by this emission.
The possibility of significant mm/cm emission from stars is highlighted by HD 141569A’s M dwarf companions, HD 141569B and HD 141569C. The stars were not detected by ALMA at 870 m (345 GHz) (White et al., 2016) or 2.9 mm (103 GHz) (as discussed here), but MacGregor et al. (2016) found a 9 mm flux of Jy for both stars (the beam size was larger than the separation between the two stars). This flux is significantly greater than what would be expected from a blackbody at the photosphere temperature and is indicative of significant coronal processes that dominate the mm/cm wavelength emission for M dwarfs, as appears to be occurring in AU Mic (e.g., MacGregor et al., 2013).
In order to properly characterize circumstellar debris, the emission from the host star must be taken into account. The observations presented here contribute to the ongoing project entitled Measuring the Emission of Stellar Atmospheres at Submillimetre/millimetre wavelengths (MESAS). The MESAS project aims to assess the contributions of stellar atmospheres at submm-cm wavelengths and use the results to inform stellar atmosphere models (e.g., PHOENIX Hauschildt & Baron, 1999).
In this paper we present 9 mm observations of the HD 141569 triple system. Throughout this work, we adopt the Gaia parallactic distance of pc (Lindegren et al., 2016). In Section 2 we give an overview of the observations. This includes the new VLA observations presented here, the archival VLA (semester 14A) observations, and also ALMA 2.9 mm measurements taken from the ALMA archive. In Section 3 we describe the model fitting procedures used to derive flux values. In Section 4 we discuss properties of the warm disc. In Section 5 we discuss the stellar atmospheres, and summarize the results in Section 6.
2 Observations
Observations were taken during the VLA Semester 16A (project ID VLA/2015-06-140) using the Ka band (9 mm) in the B antenna configuration with 27 antennas. The longest baseline was 11.1 km. The observations were centred on HD 141569A using J2000 coordinates RA = 15 h 49 min 57.73 s and . Three scheduling blocks (SBs) were requested starting on 2016 June 19th, but only one SB was obtained, yielding a total on-source integration time of 1.15 hr.
The correlator setup used MHz basebands with rest frequency centres at 30, 32, 34, and 36 GHz. Quasars J1256-0547 (3C279), J1246-0730, and J1557-0001 were used for bandpass and gain calibration. J1331+305 (3C286) was used as a flux calibration source. Data were reduced using the Common Astronomy Software Applications (CASA 4.5.0) pipeline (McMullin et al., 2007), which included bandpass, flux, and phase calibrations. The size of the synthesized beam is arcsec2 at a position angle of 21.6∘. The beam size corresponds to au at the system distance of 111 pc.
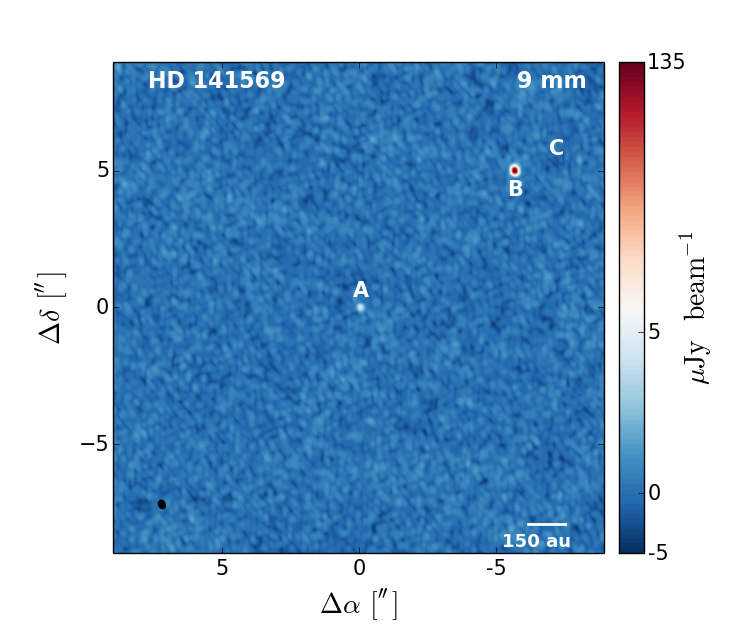
Fig. 1 shows the resulting 9 mm continuum image using natural weighting and cleaned using CASA’s CLEAN algorithm down to a threshold of . The observations achieve a 0.25 arcsec resolution and a sensitivity of . The average wavelength across the frequency range is 9.06 mm. HD 141569A and the companion HD 141569B were clearly detected. However, the disc around HD 141569A, as well the second companion, were not detected. The positions of all three stars are based on Gaia astrometry and are denoted by A, B, and C in Fig. 1.
2.1 Archival Data
In addition to the new VLA 16A 9 mm observations presented here (henceforth referred to as VLA 16A), three other data sets are used in this study. This includes VLA 9 mm observations from semester 14A (henceforth VLA 14A), which measured an unresolved flux density of Jy centred on HD 141569A and its disc (MacGregor et al., 2016). As described below, we take this data from the VLA archive so that we can perform additional analysis of the observations. We take ALMA and SMA 870 m flux and beam size values from literature White et al. (2016); Flaherty et al. (2016). We also present archival ALMA 2.9 mm observations that to our knowledge are not yet published. All of the newly present data and values from literature are summarized in Table LABEL:obs.
The VLA 14A data were taken from the VLA archive and calibrated with CASA 4.5.0 pipeline (McMullin et al., 2007) in the procedure described in MacGregor et al. (2016). The observations took place on 2014 June 6th in the D configuration with 25 antennas and a longest baseline of 1.31 km. The on-source integration time was 1.03 hr. Quasars J1256-0547, J1557-0001, and 3C286 were used as bandpass, gain and flux calibrators. The size of the synthesized beam is arcsec2 at a position angle of 338.6∘. The beam size corresponds to au at the system distance of 111 pc. These data achieve a sensitivity of .
The 2.9 mm ALMA data were taken from the ALMA archive (ID 2013.1.00883). These observations were made in two execution blocks (EBs) on 2015 August 8th, but one EB was not used due to phase amplitude and water vapor radiometer (WVR) problems. The total integration time for the successful EB was 1.24 hr. Data were taken with 44 antennas with baselines ranging from 15 to 1547 m. Three different spectral windows were used with 2000 MHz bandpasses at rest frequencies centred at 98.24, 100.04, and 108.14 GHz. The correlator in FDM yielded 128 channels with widths of 15625 kHz. Data were reduced using CASA 4.5.0 (McMullin et al., 2007) pipeline, which included WVR calibration; system temperature corrections; and bandpass, flux, and phase calibrations with quasars J1517-2422, J1550+054, and J1550+0527. Ceres was originally selected as a flux calibrator but the ALMA Pipeline quality assurance (QA) suggested to use the quasar J1550+05, as it is a more reliable calibrator for Band 3 wavelengths.
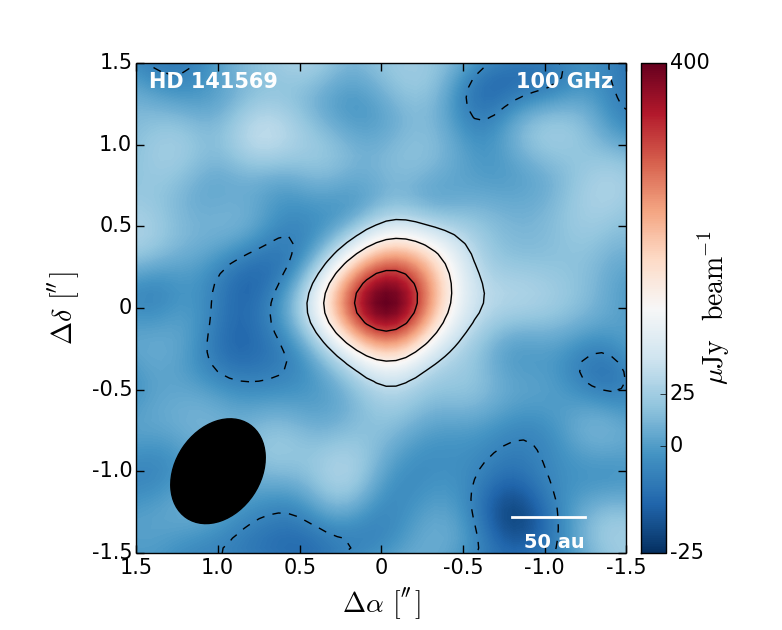
Figure 2 shows the ALMA 2.9 mm continuum image of HD 141569. The companions HD 141569B and HD 141569C were not detected. The image was generated using natural weighting and cleaned using CASA’s CLEAN algorithm down to a threshold of . The observations achieve a sensitivity of . The size of the resulting synthesized beam is arcsec2 at a position angle of 56∘, corresponding to au at the system distance of 111 pc.
3 UV Modelling
3.1 VLA Data
We use the CASA task uvmodelfit to recover the best fit flux density and position of HD 141569A and HD 141569B. The task fits a given component type to the visibilities of the data, which in this case is a single point source. The algorithm converges on the minimum iteratively. The solution is sensitive to the starting position and flux values, which were taken from the CLEANed images. The sensitivity to the initial starting position allows us to fit point source models to components A and B separately. The results are consistent with the peak flux densities per beam as measured directly from the dirty image, which for true point sources, should be the same value for the flux densities. Table 1 summarizes the best fit values for HD 141569A. We find a flux of and for VLA 14A and VLA 16A, respectively. The uncertainties represent the and a 5% flux calibration uncertainty, added in quadrature. The best fit value of for VLA 14A agrees well with the found by MacGregor et al. (2016). In the analysis, we use the value derived here.
HD 141569B was also fit with a point source model in the VLA 16A observations. The best fit flux is and model results are summarized in Table 1. The uncertainties represent the and a 5% flux calibration uncertainty111The 5% flux calibration uncertainty was added in accordance with the VLA documentation detailed on https://science.nrao.edu/. If the absolute flux uncertainty is assumed to be negligible, then the uncertainties are characterized by which is for VLA 14A and for VLA 16A., added in quadrature. As the separation between HD 141569B and HD 141569C is not resolved in the VLA 14A observations, we use reported by MacGregor et al. (2016) and assume the flux is equally distributed over the two companions.
| HD 141569A | HD 141569B | |||
| Parameter | VLA 16A 9 mm | VLA 14A 9 mm | ALMA 2.9 mm | VLA 16A 9 mm |
| Flux [] | ||||
| Location [mas] | , | , | , | , |
| Major Axis [arcsec] | - | - | - | |
| Axis Ratio | - | - | - | |
| Position Angle [∘] | - | - | - | |
| Reduced | 3.88616 | 5.67236 | 1.47999 | 3.88616 |
3.2 ALMA Data
The archival ALMA 2.9 mm observations have a synthesized beam that is only slightly smaller than the warm disc. For this reason, we use a disc with a flat intensity profile (instead of point source) to model the visibilties with the CASA task uvmodelfit. The best fit flux density is Jy. Including an absolute flux uncertainty of 10% and the we find a total flux of Jy. The uvmodelfit best fit parameters are also summarized in Table 1.
4 The Warm Dust Disc
4.1 The VLA 16A Null Detection of the Disc
The warm disc is predicted by SED modelling to have an inner radius somewhere between 11-17 au (Malfait et al., 1998; Maaskant et al., 2015) at the Gaia distance of pc (Lindegren et al., 2016). The synthesized beams of the ALMA observations at 870 m and 2.9 mm were too large to spatially resolve this central cavity. The synthesized beam for the VLA 14A observations was larger than the full extent of the warm disc, and thus also could not resolve the central clearing.
The VLA 16A observations presented here have a synthesized beam width of 0.25 arcsec, which is sufficient for spatially resolving the warm disc’s inner edge for radii au. The 870 m ALMA observations found a peak intensity of 1740 , which is presumed to be solely due to dust emission in the warm disc. If this intensity is scaled to the frequency and beam size of the 9 mm observations using the spectral index of = 1.63 (MacGregor et al., 2016), then the disc should have had a peak of .
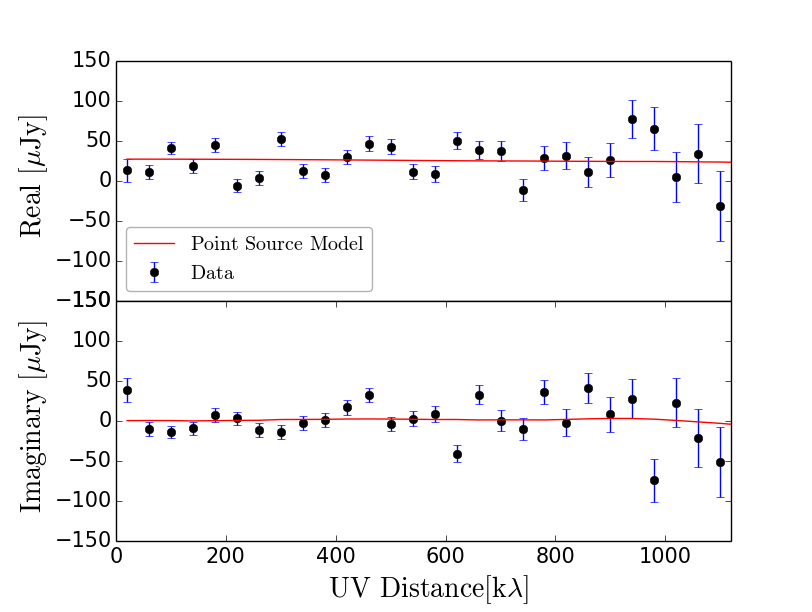
Fig. 3 shows the visibilities of the VLA 16A observations. The projected visibilities shown are annularly averaged with 40-k bins. Both the visibilities of the 16A observations and the reconstructed image are consistent with a point source centred within the SED predicted central clearing of the warm disc. With no detection of a warm dust disc, the observations place a upper limit on the intensity of the disc’s inner edge to be at 9 mm.
4.2 Millimetre Spectral Index of the Disc
| Observatory | [mm] | Flux [Jy] | Peak [Jy beam-1] | Beam Size [arcsec2] | Beam P.A | Resolved | Reference |
|---|---|---|---|---|---|---|---|
| SMA | 0.87 | N | Flaherty et al. (2016) | ||||
| ALMA | 0.87 | Y | White et al. (2016) | ||||
| ALMA | 2.9 | Y | - | ||||
| VLA 14A | 9 | N | - | ||||
| VLA 16A | 9 | N | - |
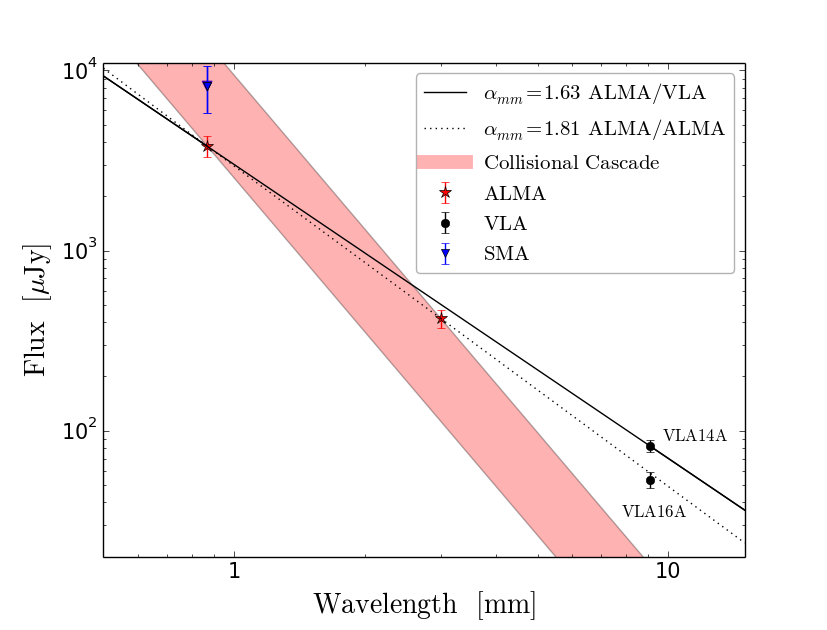
Fig. 4 shows the flux densities as measured by ALMA (red), VLA (black), and SMA (blue). Using the ALMA 870 m and VLA 14A 9 mm observations, MacGregor et al. (2016) found a mm spectral index of (black line), assuming the flux density at these frequencies is characterized by . Constraining the spectral index is key as it is related to the distribution of grain sizes over the given wavelength range (e.g., Wyatt & Dent, 2002). Adopting the methods of D’Alessio et al. (2001), Ricci et al. (2012), MacGregor et al. (2016), and White et al. (2017), we can determine the slope of the grain size distribution, , as follows. If the number of grains per size interval is given by for grain diameter , then the slope of the size distribution is related to the flux density spectral index by
| (1) |
where is a power law index for the dust opacity (Draine, 2006) and is a power law index for the Planck function that depends on the temperature of the dust and the wavelengths of interest (e.g, Holland et al., 2003). Specifically,
| (2) |
where Bν is the Planck Function and is the frequency. As a reference, a Dohnanyi (1969) collisional cascade will have , although other size distributions are possible depending on assumptions for the internal strength of the grains and other dynamical processes (see MacGregor et al., 2016, for a summary).
Using this formalism and the flux from VLA 14A, we calculate (consistent with MacGregor et al., 2016) and a grain size distribution , which would make HD 141569 a clear outlier from other discs with values . As discussed in MacGregor et al. (2016), such a value for is inconsistent with proposed models for debris size distributions. However, Fig. 4 highlights that deriving an appropriate is non-trivial for HD 141569.
The ALMA 2.9 mm observations are not consistent with at (where is the total measurement uncertainty). Furthermore, with the VLA 16A data, we find a 9 mm flux that is lower than the VLA 14A observations, meaning the 9 mm flux density between semesters is inconsistent at . Because of this, we argue that the additional ALMA and VLA observations support a steeper than that found by MacGregor et al. (2016).
If only the two ALMA measurements at 870 m and 2.9 mm are considered, then we find (Fig. 4, dotted line). This would correspond to a , which while still shallow, is marginally consistent with some models for the grain size distributions in collisional cascades (e.g., Pan & Sari, 2005).
Without a clear detection of any disc emission in the VLA datasets it is difficult to make firm conclusions regarding the true spectral index of the warm disc at cm wavelengths. We show in Fig. 4 the spectral slope that would be consistent with a Dohnanyi (1969) collisional cascade. The red region is shown instead of a single line to highlight the range bounded between the two ALMA observations. This is not intended to suggest that the spectra index must lie within this region; rather, it is intended to illustrate the range of possibilities with the current data set.
5 Origin of the 9 mm Emission
5.1 HD 141569A
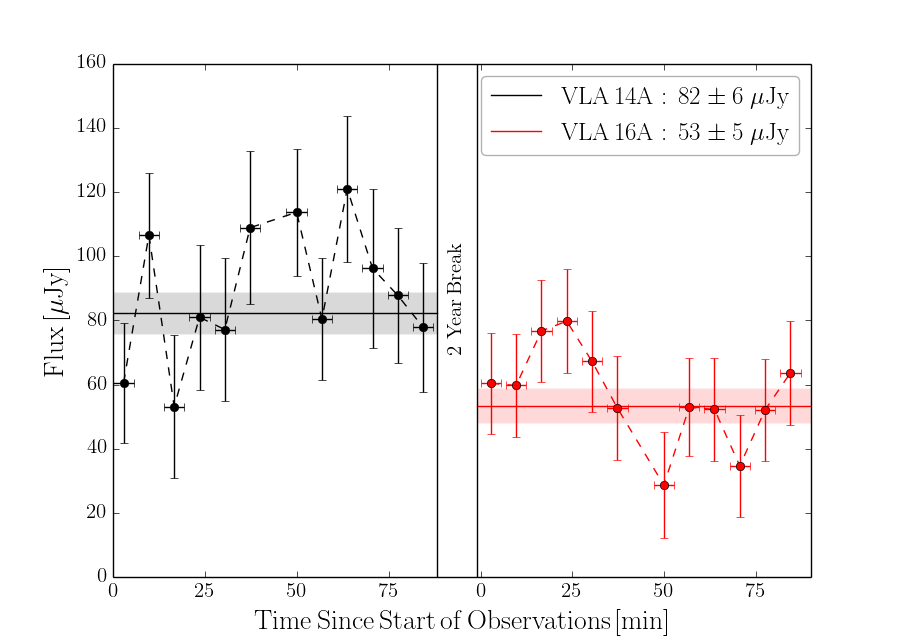
Fig. 5 shows a time series analysis of the HD 141569A 9 mm flux for both VLA 14A and VLA 16A. These points were generated by splitting out the data into min chunks. Each time chunk was fit with a point source model using uvmodelfit similar to the procedure in Section 3. The uncertainties are the of the reconstructed image of each chunk. The mean values of are and for VLA 14A and VLA 16A, respectively. While there is potential variability between the two years between observations, there is also potentially some low amplitude variability within each on hr on source. However, we note that there is some correlation between the perceived variability in HD 141569A and HD 141569B, suggesting an additional systematic effect (Pearson correlation coefficient of ).
The VLA 16A observations presented here measure a flux density of Jy centred at the location of HD 141569A. If this flux is entirely due to stellar emission (i.e. no dust emission), and taking a stellar radius of R⊙, then it would imply a brightness temperature of K. This is nearly 500 times the photosphere temperature of HD 141569A (10500 K). While the photosphere temperature is not expected to be representative of the mm/cm brightness temperature of stars, the mm/cm temperature profile of A type stars is only just now being tested with observations (White et al., in prep). The only star thoroughly studied and modelled at these wavelengths is the Sun, which at 1 cm has an observed brightness temperatures that is 2 - 3 times larger than the Solar photosphere temperature (Loukitcheva et al., 2004). Another example is TW Hydrae, a pre-MS K6 star that hosts an intricate circumstellar disc. VLA observations of TW Hydrae at 3.6 cm found more emission than expected from a simple extrapolation of the disk dust spectrum at shorter wavelengths (Wilner et al., 2000). Subsequent VLA observations showed no significant time variability and resolved this emission, ruling out a gyrosynchrotron origin in stellar activity and implicating a population of pebbles (Wilner et al., 2005) and possibly also ionized wind (Pascucci et al., 2012).
Thermal bremsstrahlung is a dominant emission mechanism in stars with K (Güdel, 2002). While the derived temperature is a factor of a few less than this, it could contribute to HD 141569A’s emission. Magnetic fields can provide a strong, variable source of emission through synchrotron emission in stellar atmospheres, however, the magnetic field properties of Herbig Ae/Be stars (such as HD 141569A) are not very well constrained. Radio flaring has been observed in pre-MS stars of all spectral types and may be correlated to X-ray variability (Forbich et al., 2017). Stellar winds are another possible source of radio emission, although the mass loss rate for A/B stars is thought to not be appreciable enough to contribute to significant radio emission (Drake & Linsky, 1989). If HD 141569A is in fact a Boo type star (Murphy et al., 2015), then accretion may be driving the observed radio variability. Ultimately, the stellar emission in the mm and cm from more massive stars, and particularly pre-MS stars, is poorly understood (see e.g. Güdel, 2002; Cauley et al., 2016).
5.2 M Dwarfs
There are two candidate M dwarf companions to HD 141569A (Weinberger et al., 2000). Their positions are denoted in Fig.1. The peak of HD 141569B is at the Gaia predicted location and is consistent with a point source. There is a non-detection for the expected location of HD 141569C and the surrounding area. The effective temperatures of the stars are K and K for B and C, respectively (Weinberger et al., 2000).
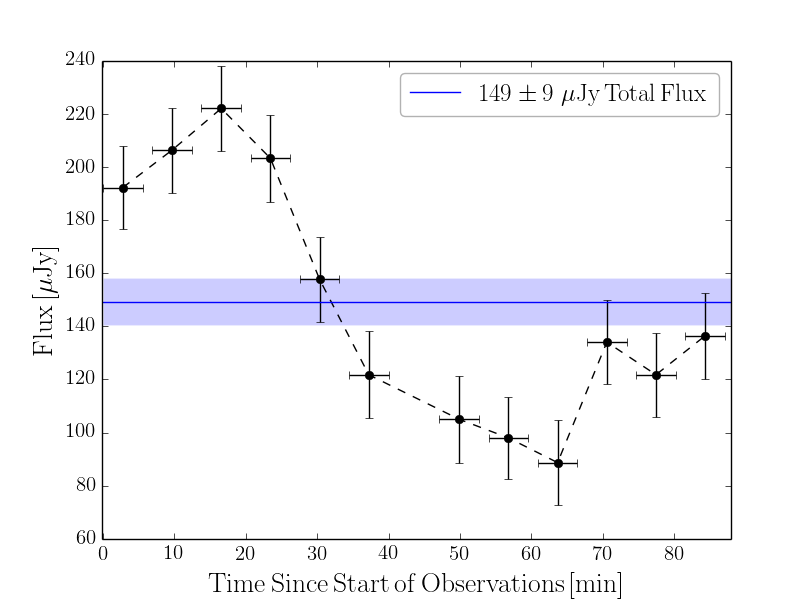
Fig. 6 shows a time series analysis of the HD 141569B 9 mm flux from VLA 16A. This plot was generated by the same procedure as Fig. 5. The uncertainty of each data point is characterized by the of reconstructed image of each time chunk. The mean for all points is . The flux density for HD 141569B is measured to be Jy (See Section 3). This is roughly 300% of the Jy flux recovered from VLA 14A (MacGregor et al., 2016), although they were not able to clearly distinguish between B and C due to the large beam size. The values from both semesters, nonetheless, imply very large brightness temperatures. If the two companion stars are indeed bound to HD 141569A, then they likely have the same approximate age of Myr (Clampin et al., 2003). These pre-MS M dwarfs would be expected to have variable radio emission (Forbich et al., 2017), as is observed. The emission at these wavelengths may likely be dominated by magnetic effects, which will extend out to times R∗ with R (Burrows et al., 2001). Using the VLA 16A flux density for HD 141569B and using the as an upper level limit of HD 141569C, we find brightness temperatures of K and K, respectively. The derived temperatures are in line with the temperatures of other magnetically active M dwarfs (Burgasser & Putman, 2005).
If the emission reported by MacGregor et al. (2016) for the VLA 14A observations is equally distributed between HD 141569B and HD 141569C, then we expect a flux of Jy for each M dwarf. This would correspond to a drop in flux for HD 141569C and a flux increase for HD 141569B. The flux of HD 141569B, however, is not constant throughout the 1.15 hr observations (see Fig. 6) and ranges from about 90 to 220 Jy. This variability of is similar to what MacGregor et al. (2016) observed in AU Mic. We note again however that there is some correlation between the perceived variability in HD 141569A and HD 141569B, likely due to systematic effects.
The quiescent emission at these temperatures could be dominated by thermal bremsstrahlung Güdel (2002). Possible flaring features have been observed in other M dwarfs with durations of less than 10 minutes (Burgasser & Putman, 2005). Accurately characterizing the expected emission of these types of stars can also play an important role in debris disc studies. As HD 141569B and C were not detected in the either of the ALMA observations, this implies that they likely do not have significant, detectable debris and all the observed flux is stellar emission (White et al., 2016).
6 Summary
We have presented VLA Ka Band 9 mm (33 GHz) observations of the HD 141569 system. These 0.25 arcsec resolution observations targeted both the circumstellar disc around HD 141569A as well as the two M dwarf companions, HD 141569B and HD 141569C. The sensitivity was insufficient for detecting the disc. We conclude that the previously constrained spectral index of is too shallow. Using ALMA 870 m (345 GHz) and archival ALMA 2.9 mm (102 GHz) data, we place a lower level limit of , corresponding to a grain size distribution of .
The recovered 9 mm emissions of Jy for HD 141569A and Jy for HD 141569B are both consistent with point sources (HD 141569C was not detected). The brightness temperatures of HD 141569A and B are K and K, respectively. While there is clearly significant variability in the emission from HD 141569B, there is also non-negligible variability in HD 141569A.
Acknowledgments
We thank the anonymous referee for comments that improved this manuscript. J.A.W. and A.C.B. acknowledge support from an NSERC Discovery Grant, the Canadian Foundation for Innovation, The University of British Columbia, and the European Research Council (agreement number 320620). M.A.M. acknowledges support from a NSF Graduate Research Fellowship (DGE1144152) and under NSF Award No. 1701406. A.M.H. is supported by NSF grant AST-1412647.
The National Radio Astronomy Observatory is a facility of the National Science Foundation operated under cooperative agreement by Associated Universities, Inc. This paper makes use of the following ALMA data: ADS/JAO.ALMA[2013.1.00883.S]. ALMA is a partnership of ESO (representing its member states), NSF (USA) and NINS (Japan), together with NRC (Canada), NSC and ASIAA (Taiwan), and KASI (Republic of Korea), in cooperation with the Republic of Chile. The Joint ALMA Observatory is operated by ESO, AUI/NRAO and NAOJ.
References
- Andrillat et al. (1990) Andrillat Y.M., Jaschek M., & Jaschek C. 1990, A&A, 233, 474
- Augereau & Papaloizou (2004) Augereau & Papaloizou 2004, A&A, 414, 1153
- Brittain et al. (2003) Brittain S.D., Rettig T.W., Simon T., et al., 2003, ApJ, 588, p.535
- Burgasser & Putman (2005) Burgasser A.J. & Putman M.E, 2005, ApJ, 626, p.486
- Burrows et al. (2001) Burrows A., Hubbard W.B., Lunine J.I., et al., 2001, Rev. Mod. Phys., 73, 719
- Cauley et al. (2016) Cauley P.W. & Johns-Krull C.M., 2016, ApJ, 825(2), p.147.
- Clampin et al. (2003) Clampin M., Krist J.E., Ardila D.R., et al., 2003, AJ, 126, 385
- D’Alessio et al. (2001) D’Alessio P., Calvet N., Hartmann, L. 2001, ApJ, 553, 321
- Dent et al. (2014) Dent W.R.F., Wyatt M.C., Roberge A., et al. 2014, Science, 343, 1490
- Dohnanyi (1969) Dohnanyi B.T., 1969, J. Geophys. Res., 74, 2531
- Draine (2006) Draine B.T., 2006, ApJ, 636, 1114
- Drake & Linsky (1989) Drake S.A. & Linsky J.L., 1989, AJ, 98, 1831-1841
- Fisher et al. (2000) Fisher R.S., Telesco C.M., Pina R.K., et al., 2000, ApJL, 532, L141
- Flaherty et al. (2016) Flaherty K.M., Hughes A.M., Andrews S.M., et al., 2016, ApJ, 818, 97
- Forbich et al. (2017) Forbrich J., Reid M.J., Menten K.M., et al., 2017, ApJ, 844(109), p.12pp.
- Güdel (2002) Güdel M. 2002, Annual Review of Astronomy and Astrophysics, 40, 217-261
- Holland et al. (2003) Holland W.S., Greaves J.S., Dent W.R.F., et al., 2003, ApJ, 582(2), p.1141
- Hauschildt & Baron (1999) Hauschildt & Baron 1999, Journal of Computational and Applied Mathematics, 109, 41;
- Hughes et al. (2012) Hughes A.M., Wilner D.J., Mason B., et al., 2012, ApJ, 750(1), 82
- Jaschek & Jaschek (1992) Jaschek C. & Jaschek M., 1992, A&AS, 95, 535
- Konishi et al. (2016) Konishi M., Grady C. A., Schneider G., et al., 2016, arXiv:1601.06560
- Lindegren et al. (2016) Lindegren L., Lammers U., Bastian U., et al., 2016, A&A, pp.arXiv-1609.
- Liseau et al. (2015) Liseau R., Vlemmings W., Bayo A., et al. 2015, A&A, 573, L4
- Loukitcheva et al. (2004) Loukitcheva M., Solanki S.K., Carlsson M. et al., 2004, A&A, 419, 747
- Maaskant et al. (2015) Maaskant K.M., de Vries B.L., Min M., et al. 2015, A&A, 574, A140
- Malfait et al. (1998) Malfait K., Waelkens C., Waters L.B.F.M., et al. 1998, A&A, 332, L25
- Mendigutía et al. (2017) Mendigutía I., Oudmaijer R.D., Mourar, D. et al. 2017, MNRAS, 464(2), p.1984
- Perryman et al. (1997) Perryman M.A.C., Lindegren L., Kovalevsky J., et al. 1997, A&A, 323, 49
- MacGregor et al. (2016) MacGregor M.A., Wilner D.J., Chandler, C., et al., 2016, ApJ, 823(2), p.79
- MacGregor et al. (2013) MacGregor M.A., Wilner D.J., Rosenfeld K.A., et al. 2013, ApJL, 762, L21
- McMullin et al. (2007) McMullin J.P., Waters B., Schiebel D., et al., 2007, Astronomical Data Analysis Software and Systems XVI (ASP Conf. Ser. 376), ed. R. A. Shaw, F. Hill, & D. J. Bell (San Francisco, CA: ASP), 127
- Murphy et al. (2015) Murphy J.S., Corbally C.J, Gray O.G., et al. 2015, PASA, 32, 43
- Pan & Sari (2005) Pan M. & Sari R. 2005, Icarus, 173, 342
- Pascucci et al. (2012) Pascucci, I., Gorti, U., & Hollenbach, D. 2012, ApJL, 751, L42
- Van Den Ancker et al. (1998) Van Den Ancker M.E., De Winter D., Tjin a Djie, H.R.E., et al. 1998, A&A, 330, 145
- Reche et al. (2009) Reche R., Beust H. & Augereau J.C., 2009, A&A, 493, 661
- Ricci et al. (2012) Ricci L., Testi L., Maddison S.T., Wilner D.J., 2012, A&A, 539, p.L6
- Venn & Lambert (1990) Venn K.A, & Lambert D.L. 1990, ApJ, 363, 234
- Walker & Ashcroft (1988) Walker H.J., & Wolstencroft R.D., 1988, PASP, 100, 1509
- Weinberger et al. (2000) Weinberger A.J., Rich R.M., Becklin E.E., et al., 2000, ApJ, 544, 937
- White et al. (2016) White J.A., Boley A.C., Hughes A.M., et al., 2016, ApJ, 829(6), p.11
- White et al. (2017) White J.A., Boley A.C., Dent W.R.F., et al., 2017, MNRAS, 466(4), pp.4201-4210
- White et al. (in prep) White J.A, Boley A.C, Matthews B., et al., in preparation
- Wilner et al. (2000) Wilner D.J., Ho P.T.P., Kastne, J.H. & Rodríguez L.F., 2000, ApJL, 534(1), p.L101.
- Wilner et al. (2005) Wilner D.J., D’Alessio P., Calvet N., et al., 2005, ApJL, 626(2), p.L109.
- Wyatt & Dent (2002) Wyatt M.C. & Dent W.R.F., 2002, MNRAS, 334, 589