On the phonon dispersion relation of single-crystalline –FeSe
Abstract
We report on the phonon spectrum probed at the –FeSe(001) surface by means of high-resolution electron energy-loss spectroscopy (HREELS). Single crystals of –FeSe are cleaved under ultra-high vacuum conditions and are subsequently measured below and above the nematic transition temperature. In total we observe five phonon modes and a phonon cutoff energy of about 40 meV. We identify the origin of each phonon mode based on the selection rules of HREELS and by comparing the experimental results to the ones of ab initio density functional calculations. The most prominent phonon modes , , and appear at energies of about and and meV, respectively. These phonon modes disperse rather weakly while changing the momentum from zero up to the zone boundary, indicating that they are mainly of optical nature. A comparison between our results and the results of ab initio calculations indicates that there must be a mutual interplay between magnetism and lattice dynamics in this compound, similar to the other Fe-based superconductors. Finally, we comment on the role of temperature on the phonon modes probed at the –point. It is observed that both the and phonon modes undergo a downward shift while increasing the temperature from 15 to 300 K. In the case of the mode this shift is about 1.5 meV.
pacs:
74.70.Xa, 74.25.Kc, 68.49.JkI Introduction
Among all Fe-based superconductors –FeSe is, structurally, the simplest one and has been investigated extensively in past years Hsu et al. (2008). The superconducting transition temperature in this material is K at ambient pressure Hsu et al. (2008) and can increase to K at high pressures Medvedev et al. (2009). Similar to the FeAs planes in LiFeAs, LaFeAsO and BaFe2As2, which are prototypes of the well-known families of Fe-As based high- superconductors, –FeSe contains also square planar sheets of tetrahedrally coordinated Fe atoms Johnson et al. (2015). The recent discovery of superconductivity up to 100 K in the single unit cell of FeSe grown on SrTiO3 has brought this material to the centre of attention and to the forefront of research in the field of superconductivity Ge et al. (2015).
Although there are distinct differences between FeSe and the other Fe-based superconductors, it is now generally accepted that similar to the other Fe-based compounds, FeSe also belongs to the family of unconventional superconductors, of which their superconductivity is not directly mediated by the electron-phonon coupling Stewart (2011); Lumsden et al. (2010); Paglione and Greene (2010); Johnson et al. (2015); Ewings et al. (2008); Kotegawa and Fujita (2012); Inosov (2015); Rahn et al. (2015); Park et al. (2011). Recent inelastic neutron scattering experiments have revealed the so-called spin resonance mode, suggesting that the superconductivity in this material is associated with spin excitations Ma et al. (2017); Wang et al. (2016). However, observation of the isotope effect has opened up many questions regarding the role of phonons in the superconductivity Khasanov et al. (2010). Although the material appears simple at first glance, the actual role of the structural degrees of freedom and lattice dynamics in superconductivity remains unresolved Gnezdilov et al. (2013); Baek et al. (2015); Chubukov et al. (2015); Mazin (2015). Many efforts have been devoted to investigate the phonons in this material Phelan et al. (2009); Ksenofontov et al. (2010); Xia et al. (2009); Okazaki et al. (2011); Litvinchuk et al. (2008); Kumar et al. (2010a); Um et al. (2012); Gnezdilov et al. (2013). However, due to the lack of large single crystals, most of those experiments are performed on polycrystalline or powder samples. Only a few experiments are reported on the single-crystalline samples Xia et al. (2009); Okazaki et al. (2011); Litvinchuk et al. (2008); Kumar et al. (2010a); Gnezdilov et al. (2013), but those experiments focus only on the phonon modes at the Brillouin zone center and mainly on the Raman active modes.
Here we aim to look at the problem from the perspective of surface science. We therefore prepare clean and well-ordered –FeSe(001) surfaces and investigate them under ultra-high vacuum conditions. We provide the first phonon spectrum recorded on the surface of –FeSe(001) single crystals by means of electrons, with the particular attention on the , and phonon modes, observed at the zone center. Our results indicate that these phonon modes originate from the atomic displacements of either Se or Fe atoms along the -axis, normal to the surface and hence can be very efficiently excited by electrons. The modes show a rather weak dispersion, as expected. By comparing our results to those of available ab initio density functional calculations, we discuss the interplay between magnetism and the lattice dynamics in this compound. In addition, we comment on the role of temperature on the observed phonon modes.
II Experimental details
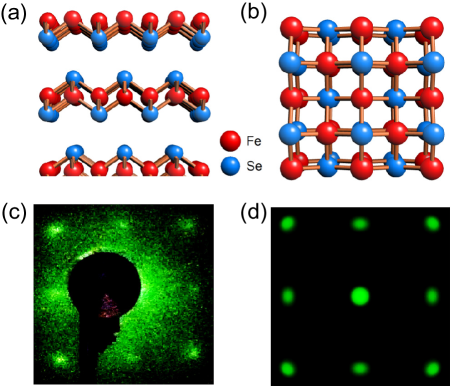
High-quality single crystals of -FeSe were synthesized from Fe and Se powders mixed in an atomic ratio 1.1 to 1 and sealed in an evacuated SiO2 ampoule together with an eutectic mixture of KCl and AlCl3. Details of the crystal growth method may be found elsewhere (see for example Ref. [Böhmer et al., 2013]). Samples were fixed on a holder and were transferred into the ultra-high vacuum (UHV) chamber. They were cleaved at a pressure of about mbar at room temperature. This leads to a clean and well-ordered FeSe(001) surface, with a () surface reconstruction. In Fig. 1(a) the crystal structure of -FeSe is shown with a cut along the plane. The Fe atoms are covalently coordinated with Se anions above and below the Fe plane. The FeSe sheets are weakly connected with a weak van der Waals interaction along the axis and hence the crystal can easily be cleaved. The resulting surface is the (001) surface, parallel to the plane and perpendicular to the axis. This surface is schematically shown in Fig. 1 (b). The structural analysis of the surface was performed by means of low-energy electron diffraction (LEED) at room temperature. A typical LEED pattern recorded at an electron energy of 92 eV and the corresponding simulated pattern are shown in Figs. 1 (c) and (d), respectively. The clear () LEED pattern indicates a contamination free surface with a low step density.
The phonon spectrum of the (001) surface was measured by means of our spin-resolved high-resolution electron energy loss spectrometer Zakeri (2014). The incident electron energy was set on eV. The full width at half maximum (FWHM) of the elastic peak was about 6.3 meV. Note that the actual resolution of the spectrometer is even higher than this value. The additional broadening might be due to different reasons. For instance the presence of low energy phonons near the elastic peak can lead to a broadening of this peak. Likewise the presence of the twins and grain boundaries of the crystal can also broaden this peak. Such twins and grain boundaries lead to the broadening of the LEED spots shown in Fig. 1 (c). The scattering plane was chosen to be along the [110]-direction. Based on the scattering selection rules, this would allow probing all the possible phonon modes which have a polarization along any of the main crystallographic directions (all phonons with polarization along either the [100]- or the [010]-direction can be probed) Ibach and Mills (1982). This means that both even and odd modes of the (100) plane are allowed to be excited. In this geometry the phonon dispersion relation is probed along the – direction of the surface Brillouin zone. The total scattering angle (the angle between the incident and scattered beam) was set on . This means the angle of incident and scattered beam with respect to the surface normal at the specular reflection was . For probing the phonon dispersion relation the energy-loss spectra were recorded at different in-plane wave vector transfers . Here and are the in-plane wave vectors of incident and scattered beam, respectively. Different values of were achieved by changing the angles of the incident and scattered beam with respect to the surface normal. A spin polarized electron beam was used for the experiments. However, phonons are spin independent collective excitations and therefore no spin dependence was observed, as expected. Thus the spectra were recorded in the so-called spin integrated mode. In this mode both the spin-flip and non-spin-flip contributions to the scattering intensity are present.
III Results and Discussions
A typical spin-integrated spectrum recorded at a sample temperature of about 15 K and at the specular geometry (with no parallel momentum transfer ) is shown in Fig. 2. The spectrum is dominated by the presence of the elastic peak at the energy loss of zero. Beside the elastic line one clearly observes peaks associated with the inelastic scattering of the electrons by different phonon modes.
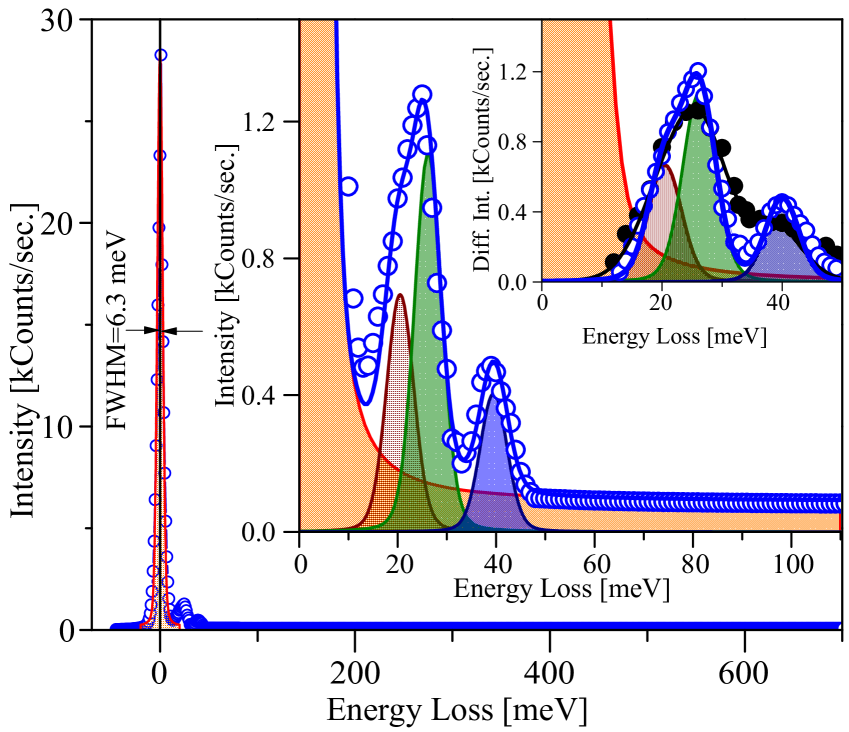
In this geometry one clearly observes three different phonon modes. In order to extract the energies of these phonon modes from the experimental data, the spectra were evaluated by a set of Voigt functions. The same analysis was performed on the spectra with the elastic peak subtracted (right upper inset of Fig. 2). We first fitted the quasi-elastic peak at the energy loss of zero and then subtracted it from the experimental data. With this only the loss intensities caused by the scattering of electrons from the vibrational excitations remain. The remaining intensity profile was fitted by a set of Voigt profiles. We note that analyses of data with and without the quasi-elastic peak subtracted lead to exactly the same results (see Fig. 2). In the Voigt profiles the Gaussian broadening was chosen to be the experimental energy resolution (FWHM = 6.3 meV). The Lorentzian linewidth in such a case denotes the intrinsic phonon lifetime.
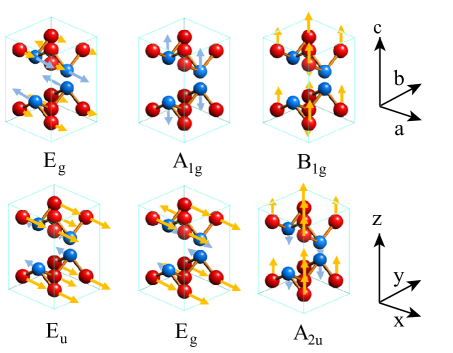
At room temperature FeSe has the tetragonal PbO structure and belongs to the space group . At low temperatures, below the nematic transition temperature, the crystal structure transforms into Hsu et al. (2008). Based on simple group theory consideration, one can predict the possible phonon modes of the system. The possible phonon modes of –FeSe are depicted in Fig. 3. Among the different phonon modes depicted in Fig. 3 the , and modes are the polarized modes, which involve vertical displacement of Se and Fe atoms. The and modes are the so-called Raman active modes while is an infrared active phonon. These modes are expected to be observed at the –point of the three-dimensional bulk Brillouin zone Xia et al. (2009); Kumar et al. (2010a); Okazaki et al. (2011); Gnezdilov et al. (2013); Hu et al. (2016).
At the specular geometry the parallel component is zero. The kinematic model of electron scattering predicts that the intensity of a phonon that is polarized perpendicular to the surface should be much higher than the intensity of an in-plane polarized phonon, since the vertical component of the wave vector transfer is much larger than the parallel component Ibach and Mills (1982). Hence mainly the phonon modes which have a polarization perpendicular to the surface shall be observed near the specular geometry . The observed loss features at , and meV can therefore be assigned to the -polarized , and phonon modes, respectively. Both the and modes have already been observed in the Raman scattering experiments Xia et al. (2009); Kumar et al. (2010a); Okazaki et al. (2011); Gnezdilov et al. (2013); Hu et al. (2016). Since the mode is not a Raman active mode it has not been observed in those experiments.
As a side note we would like to point out that the typical probing depth of HREELS is only a few atomic layers below the surface layer. Generally the , , and modes are referred to as the modes which are excited at the –point of the three-dimensional bulk Brillouin zone. In the HREELS experiments the momentum in the direction perpendicular to the surface is not conserved and hence only the excitations in the two-dimensional surface Brillouin zone are probed. The modes observed in the two-dimensional surface Brillouin zone are the projected states of the three-dimensional Brillouin zone. Owing to the layered nature of FeSe the , , and modes do not show any particular momentum dependence along the –Z direction of the three-dimensional Brillouin zone (along this direction the phonon branches are rather flat). Hence their projection to the surface Brillouin zone would not result in any additional dispersion, in particular when projecting to . Therefore the notations , , and can also be used for the zone center of the two-dimensional surface Brillouin, –point.
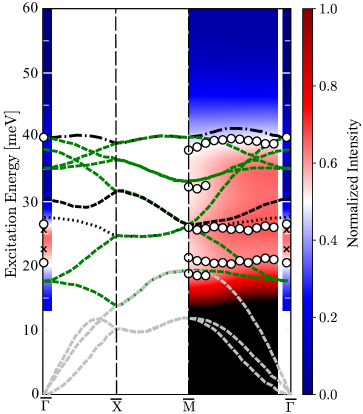
In order to obtain the dispersion relation of the observed phonon modes, the spectra were recorded at different values of and the results are presented in Fig. 4. The data were recorded along the [110]-direction of the surface, which corresponds to the high-symmetry – line of the surface Brillouin zone. As is apparent from Fig. 4, all the three , and modes observed at the -point could also be observed at the higher wave vector transfers. The modes show a rather weak dispersion. At higher wave vector transfers, close to the –point, two additional sets of excitations could clearly be observed. These excitations must exhibit a large in-plane polarization and can therefore be assigned to those phonon modes which exhibit a large in-plane polarization e.g. and modes (see the discussion below).
t at –point111This point is equivalent to the –point of the bulk Brillouin zone. near –point222This point is equivalent to the –point of the bulk Brillouin zone. T [K] This work SC Expt. Phelan et al. (2009) PC Expt.Ksenofontov et al. (2010) PC Expt. Gnezdilov et al. (2013) SC FeSe Expt. Kumar et al. (2010a) SC 3 Calc. Subedi et al. (2008) NM Calc. Okazaki et al. (2011) NM Calc. Wang et al. (2012) NM – Calc. Wang et al. (2012) SAFM – Calc. Ye et al. (2013) CBAFM FeTe0.92 Expt.Xia et al. (2009) SC Fe1.074Te Expt.Okazaki et al. (2011) SC FeTe0.6Se0.4 Expt.Okazaki et al. (2011) SC Fe1.02Te Expt.Um et al. (2012) SC FeTe0.78Se0.22 Expt.Um et al. (2012) SC Fe0.95Te0.56Se0.44 Expt.Um et al. (2012) SC (K,Sr)Fe2As2 Expt.Litvinchuk et al. (2008) C
The phonon dispersion relation of –FeSe has been calculated by different density functional based ab initio methods Subedi et al. (2008); Nakamura et al. (2009); Kumar et al. (2010b); Wang et al. (2012). We note that the calculations performed by different groups using different functionals have resulted a similar phonon dispersion relation (the shape of the dispersion relation in all the calculations is nearly the same). The absolute values of the energies are slightly different. A comparison between different results can be found in Tab. 1. As an example the phonon dispersion relation calculated within the local-density approximation and the general potential linearized augmented plane-wave method, by Subedi et al. Subedi et al. (2008) is shown in Fig. 4 for a comparison. One immediately notices that these calculations which are performed for the nonmagnetic –FeSe cannot precisely account for the phonon frequencies of the , and modes. For example according to the results of calculations at the zone center the and modes should have energies of about 27.5 meV and 30.4meV, respectively. They should merge together in the midway of to . These modes are shown in Fig. 4 by black dotted and dashed lines, respectively. However our experiments show that these modes possess energies of about and meV, respectively and do not disperse with wave vector. A comparison between our results and the ones reported in the literature on FeSe and the other similar systems is provided in Tab. 1. Our results near the –point are close to the values reported by Gnezdilov et al. Gnezdilov et al. (2013) obtained on single-crystalline samples by means of Raman scattering and obtained by Ksenofontov et al. Ksenofontov et al. (2010) on polycrystalline samples using 57Fe nuclear inelastic scattering. We note that the energy of the phonon (25.6 meV) is in excellent agreement with the previous report on the bulk single crystals. On the other hand, the value of the mode at the –point is smaller by 10% when comparing our results to the ones of the single-crystalline bulk samples Gnezdilov et al. (2013). The is associated with the motion of the Se atoms. Since the crystal is cleaved so that the surface is Se terminated, one would expect that the Se atoms at the surface are subject to a weaker interatomic coupling. This would naturally lead to a lower energy of the surface phonons. We note that the Fe2Se2-layers interact rather weakly via the van der Waals interaction. This means that the surface effects are not as strong as what is observed in the case of materials with covalent, metallic or ionic bonding. A comparison between the results of calculations performed for nonmagnetic FeSe and for the stripe antiferromagnetic phase of FeSe shows that the and modes are sensitive to the magnetic state of the system Wang et al. (2012). These calculations result in the values of 21.5 and 27.8 meV for the and modes, respectively, when a stripe antiferromagnetic order is assumed as the ground state. Compared to the experimental value one recognizes that both modes are slightly overestimated, in particular the mode. Calculations performed by Ye et al. Ye et al. (2013) assuming a checkerboard antiferromagnetic ground state predict the values of 24.1 and 26.6 meV for the and modes, respectively. Also in this case the phonon energies are overestimated. However, now the mode agrees better with the experiment and the is overestimated by about 3.5 meV. A similar effect has been observed for the other Fe-based materials e.g iron-pnictides Yildirim (2009) and other iron-chalcogenides Okazaki et al. (2011); Um et al. (2012), indicating similarities between FeSe and the other Fe-based superconductors. It has been discussed that similar to other Fe-based superconductors, the magnetism has a considerable impact on the lattice dynamics of FeSe and determines the phonon frequencies Nakamura et al. (2009); Kumar et al. (2010b); Wang et al. (2012). The effect is discussed in terms of spin–phonon coupling Gnezdilov et al. (2013); Kumar et al. (2010b); Wang et al. (2012); Ye et al. (2013). In optical spectroscopy experiments spin-phonon coupling can induce peculiar features on the shape of the spectra, leading to an asymmetric lineshape Homes et al. (2016). In such a case the excitation peak may be described by a Fano lineshape, instead of a Lorentzian. We did not, however, observe any additional effect on the shape of the spectra which could be associated with the spin-lattice coupling. This might be due to the fact that the underlying physical mechanism behind the excitation of phonons by means of electrons is entirely different from that of the polarized photons Ibach and Mills (1982). Interestingly, the calculations for the nonmagnetic FeSe predict the mode rather accurately. At the –point the agreement is perfect. Away from the –point the measured dispersion relation of this mode is very similar to what has been predicted by theory (the black dashed-dotted curve in Fig. 4), in spite of the small energy shift of about 2 meV. The experimentally probed dispersion relation of this mode exhibits a slight “downward” parabolic shape as predicted by the calculations.
The phonon mode observed at about 32-33 meV in Fig. 4 is most likely caused by the or the high-energy mode (the one which involves a larger displacement of the Fe atoms). As these two modes are very close in energy, it could be that the feature observed at about 32-33 meV is a combination of these two modes. The mode at about 18-19 meV can be assigned to the low-energy mode (the one which involves the displacement of the Se atoms). It could also be the top of the highest energy acoustic phonons, as the energy of the acoustic phonon branches reaches the value of 18-19 meV near the –point (see the dashed gray curves in Fig. 4). Interestingly these modes are also accurately predicted by calculations, indicating the robustness of these modes with respect to the magnetic state of the system.
Finally, in order to investigate the effect of temperature on the observed phonon modes the same experiments were performed at room temperature. The data recorded at T=300 K are shown by black solid circles in the upper-right corner of Fig. 2 for a comparison. A small shift toward lower energies was observed for the and modes, while warming up the sample to room temperature. In addition the linewidth of both modes increases with temperature. It is not easy to quantify the temperature-induced shift of the mode, as it moves toward the mode and, at the same time, broadens. The phonon mode undergoes a downward shift from 40 meV to about 38.5 meV. The shift is clearly visible in the data presented in Fig. 2. An unusual temperature dependence of the surface phonon modes has been observed in the case of Ba(Fe1-xCox)2As2 Teng et al. (2013). We did not, however, observe any additional effect associated with the surface properties. The temperature-induced shift of the and Raman active modes has been observed in the Raman experiments by Gnezdilov et al. Gnezdilov et al. (2013). It has been observed that the mode undergoes a shift of about 1.5 meV, while the mode exhibits a very small shift of about 0.35 meV. This behavior is in agreement with our observations. Such a behavior could not be explained only by the contraction of the lattice during cooling. An analysis based on the Grüneisen law has shown that the parameter must be about 1.04 for the mode and about 5.09 in the case of the mode Gnezdilov et al. (2013). Both of these values deviate from the conventional value of about 2. We performed the same analysis for the mode and obtained the value of the Grüneisen parameter for this mode. This value also deviates from the conventional value, meaning that the phonon hardening, observed during cooling, must be associated with the changes of the spin state of the Fe atoms within the FeSe unit cell. This is another indication of the presence of the spin-phonon coupling in the system.
The temperature dependence of the mode in the Fe1+ySe1-xTex compound has been investigated Um et al. (2012). In the case of Fe1.02Te it has been observed that both the phonon frequency and the linewidth show a kink at the magnetic ordering temperature (=67 K). The kink gradually evolves into a rather smooth behavior as Te atoms are substituted with Se. In the case of Fe0.95Se0.56Te0.44 only a very smooth temperature dependence of phonon frequency and linewidth is observed. This observation has been attributed to a peculiar coupling of the phonon mode of the Fe1+ySe1-xTex system to magnetic fluctuations Um et al. (2012).
Recently the temperature dependence of the infrared active mode has been investigated for Fe1.03Te and Fe1.13Te as well as for the superconducting FeTe0.55Se0.45. It has been observed that these modes exhibit an asymmetric Fano lineshape which is superimposed on a background of Drude free carriers and symmetric Lorentz oscillators. This behavior has been discussed in terms of an anharmonic decay process Homes et al. (2016). In the case of the superconducting sample the infrared active mode has been observed to display an asymmetric lineshape at all temperatures, in particular in the temperature range of 100–200 K. This observation has been attributed to the presence of the spin-/electron-phonon coupling in the systemHomes et al. (2016).
IV Conclusion
The dispersion relation of different phonon modes probed at the –FeSe(001) surface by means of HREELS is reported. Five different phonon modes and a phonon cutoff energy of about 40 meV are observed. The origin of each phonon mode is identified based on the selection rules of HREELS and in comparison with the results of ab initio calculations. The , , and phonons are found to possess energies of about and and meV at the zone center (–point). All modes show a rather flat dispersion relation. The measured energies of these phonon modes do not match the values predicted by the available density functional calculations assuming a nonmagnetic Subedi et al. (2008), a stripe antiferromagnetic Wang et al. (2012) or checkerboard antiferromagnetic Ye et al. (2013) structure for –FeSe, indicating a mutual interplay between magnetism and lattice dynamics in this system. The role of temperature on the phonon modes probed at the –point is investigated. A downward shift is observed for both the and phonon modes while increasing the temperature from 15 to 300 K. The effect seems to be largest on the phonon mode which exhibits a shift from 40 meV to about 38.5 meV. Such a temperature-induced phonon softening must be due to the changes of the spin state of the Fe atoms within the FeSe unit cell. This is another indication of the presence of the spin-phonon coupling in the system.
V Acknowledgments
This work has been supported by the Deutsche Forschungsgemeinschaft (DFG) through the Heisenberg Programme ZA 902/3-1.
References
- Hsu et al. (2008) F.-C. Hsu, J.-Y. Luo, K.-W. Yeh, T.-K. Chen, T.-W. Huang, P. M. Wu, Y.-C. Lee, Y.-L. Huang, Y.-Y. Chu, D.-C. Yan, et al., Proceedings of the National Academy of Sciences 105, 14262 (2008).
- Medvedev et al. (2009) S. Medvedev, T. M. McQueen, I. A. Troyan, T. Palasyuk, M. I. Eremets, R. J. Cava, S. Naghavi, F. Casper, V. Ksenofontov, G. Wortmann, et al., Nat Mater 8, 630 (2009), ISSN 1476-1122, URL http://dx.doi.org/10.1038/nmat2491.
- Johnson et al. (2015) P. Johnson, G. Xu, and W. Yin, Iron-Based Superconductivity, Springer Series in Materials Science (Springer International Publishing, 2015), ISBN 9783319112541.
- Ge et al. (2015) J.-F. Ge, Z.-L. Liu, C. Liu, C.-L. Gao, D. Qian, Q.-K. Xue, Y. Liu, and J.-F. Jia, Nat Mater 14, 285 (2015), ISSN 1476-1122, URL http://dx.doi.org/10.1038/nmat4153.
- Stewart (2011) G. R. Stewart, Rev. Mod. Phys. 83, 1589 (2011), and references therein, URL http://link.aps.org/doi/10.1103/RevModPhys.83.1589.
- Lumsden et al. (2010) M. D. Lumsden, A. D. Christianson, E. A. Goremychkin, S. E. Nagler, H. A. Mook, M. B. Stone, D. L. Abernathy, T. Guidi, G. J. MacDougall, C. de la Cruz, et al., Nat Phys 6, 182 (2010), ISSN 1745-2473, URL http://dx.doi.org/10.1038/nphys1512.
- Paglione and Greene (2010) J. Paglione and R. L. Greene, Nat Phys 6, 645 (2010), ISSN 1745-2473, URL http://dx.doi.org/10.1038/nphys1759.
- Ewings et al. (2008) R. A. Ewings, T. G. Perring, R. I. Bewley, T. Guidi, M. J. Pitcher, D. R. Parker, S. J. Clarke, and A. T. Boothroyd, Phys. Rev. B 78, 220501 (2008), URL http://link.aps.org/doi/10.1103/PhysRevB.78.220501.
- Kotegawa and Fujita (2012) H. Kotegawa and M. Fujita, Science and Technology of Advanced Materials 13, 054302 (2012), ISSN 1468-6996, URL http://stacks.iop.org/1468-6996/13/i=5/a=054302.
- Inosov (2015) D. S. Inosov, Comptes Rendus Physique pp. – (2015), ISSN 1631-0705, URL http://www.sciencedirect.com/science/article/pii/S1631070515000523.
- Rahn et al. (2015) M. C. Rahn, R. A. Ewings, S. J. Sedlmaier, S. J. Clarke, and A. T. Boothroyd, Phys. Rev. B 91, 180501 (2015), URL http://link.aps.org/doi/10.1103/PhysRevB.91.180501.
- Park et al. (2011) H. Park, K. Haule, and G. Kotliar, Physical review letters 107, 137007 (2011).
- Ma et al. (2017) M. Ma, P. Bourges, Y. Sidis, Y. Xu, S. Li, B. Hu, J. Li, F. Wang, and Y. Li, Phys. Rev. X 7, 021025 (2017), URL https://link.aps.org/doi/10.1103/PhysRevX.7.021025.
- Wang et al. (2016) Q. Wang, Y. Shen, B. Pan, Y. Hao, M. Ma, F. Zhou, P. Steffens, K. Schmalzl, T. Forrest, M. Abdel-Hafiez, et al., Nature Materials 15, 159 (2016), URL http://dx.doi.org/10.1038/nmat4492.
- Khasanov et al. (2010) R. Khasanov, M. Bendele, K. Conder, H. Keller, E. Pomjakushina, and V. Pomjakushin, New Journal of Physics 12, 073024 (2010), URL http://stacks.iop.org/1367-2630/12/i=7/a=073024.
- Gnezdilov et al. (2013) V. Gnezdilov, Y. G. Pashkevich, P. Lemmens, D. Wulferding, T. Shevtsova, A. Gusev, D. Chareev, and A. Vasiliev, Phys. Rev. B 87, 144508 (2013), URL https://link.aps.org/doi/10.1103/PhysRevB.87.144508.
- Baek et al. (2015) S.-H. Baek, D. V. Efremov, J. M. Ok, J. S. Kim, J. van den Brink, and B. Büchner, Nat Mater 14, 210 (2015), ISSN 1476-1122, URL http://dx.doi.org/10.1038/nmat4138.
- Chubukov et al. (2015) A. V. Chubukov, R. M. Fernandes, and J. Schmalian, arXiv preprint arXiv:1504.02315 (2015).
- Mazin (2015) I. I. Mazin, Nat Mater 14, 755 (2015), ISSN 1476-1122, URL http://dx.doi.org/10.1038/nmat4371.
- Phelan et al. (2009) D. Phelan, J. N. Millican, E. L. Thomas, J. B. Leão, Y. Qiu, and R. Paul, Phys. Rev. B 79, 014519 (2009), URL http://link.aps.org/doi/10.1103/PhysRevB.79.014519.
- Ksenofontov et al. (2010) V. Ksenofontov, G. Wortmann, A. I. Chumakov, T. Gasi, S. Medvedev, T. M. McQueen, R. J. Cava, and C. Felser, Phys. Rev. B 81, 184510 (2010), URL http://link.aps.org/doi/10.1103/PhysRevB.81.184510.
- Xia et al. (2009) T.-L. Xia, D. Hou, S. C. Zhao, A. M. Zhang, G. F. Chen, J. L. Luo, N. L. Wang, J. H. Wei, Z.-Y. Lu, and Q. M. Zhang, Phys. Rev. B 79, 140510 (2009), URL https://link.aps.org/doi/10.1103/PhysRevB.79.140510.
- Okazaki et al. (2011) K. Okazaki, S. Sugai, S. Niitaka, and H. Takagi, Phys. Rev. B 83, 035103 (2011), URL http://link.aps.org/doi/10.1103/PhysRevB.83.035103.
- Litvinchuk et al. (2008) A. P. Litvinchuk, V. G. Hadjiev, M. N. Iliev, B. Lv, A. M. Guloy, and C. W. Chu, Phys. Rev. B 78, 060503 (2008), URL http://link.aps.org/doi/10.1103/PhysRevB.78.060503.
- Kumar et al. (2010a) P. Kumar, A. Kumar, S. Saha, D. Muthu, J. Prakash, S. Patnaik, U. Waghmare, A. Ganguli, and A. Sood, Solid State Communications 150, 557 (2010a), ISSN 0038-1098, URL http://www.sciencedirect.com/science/article/pii/S0038109810000402.
- Um et al. (2012) Y. J. Um, A. Subedi, P. Toulemonde, A. Y. Ganin, L. Boeri, M. Rahlenbeck, Y. Liu, C. T. Lin, S. J. E. Carlsson, A. Sulpice, et al., Phys. Rev. B 85, 064519 (2012), URL https://link.aps.org/doi/10.1103/PhysRevB.85.064519.
- Böhmer et al. (2013) A. E. Böhmer, F. Hardy, F. Eilers, D. Ernst, P. Adelmann, P. Schweiss, T. Wolf, and C. Meingast, Phys. Rev. B 87, 180505 (2013), URL https://link.aps.org/doi/10.1103/PhysRevB.87.180505.
- Zakeri (2014) K. Zakeri, Physics Reports 545, 47 (2014), ISSN 0370-1573.
- Ibach and Mills (1982) H. Ibach and D. Mills, Electron Energy Loss Spectroscopy and Surface Vibrations (Academic Press, New York, London, Paris, 1982), URL http://www.amazon.com/Electron-Energy-Spectroscopy-Surface-Vibrations/dp/0123693500.
- Hu et al. (2016) Y. Hu, X. Ren, R. Zhang, H. Luo, S. Kasahara, T. Watashige, T. Shibauchi, P. Dai, Y. Zhang, Y. Matsuda, et al., Phys. Rev. B 93, 060504 (2016), URL http://link.aps.org/doi/10.1103/PhysRevB.93.060504.
- Subedi et al. (2008) A. Subedi, L. Zhang, D. J. Singh, and M. H. Du, Phys. Rev. B 78, 134514 (2008), URL http://link.aps.org/doi/10.1103/PhysRevB.78.134514.
- Wang et al. (2012) W. Wang, J. Sun, S. Li, and H. Lu, Physica C: Superconductivity 472, 29 (2012), URL http://www.sciencedirect.com/science/article/pii/S0921453411004898.
- Ye et al. (2013) Q.-Q. Ye, K. Liu, and Z.-Y. Lu, Phys. Rev. B 88, 205130 (2013), URL http://link.aps.org/doi/10.1103/PhysRevB.88.205130.
- Nakamura et al. (2009) H. Nakamura, N. Hayashi, N. Nakai, and M. Machida, Physica C: Superconductivity 469, 1024 (2009), ISSN 0921-4534, URL http://www.sciencedirect.com/science/article/pii/S0921453409002123.
- Kumar et al. (2010b) A. Kumar, P. Kumar, U. V. Waghmare, and A. K. Sood, Journal of Physics: Condensed Matter 22, 385701 (2010b), URL http://stacks.iop.org/0953-8984/22/i=38/a=385701.
- Yildirim (2009) T. Yildirim, Physica C: Superconductivity 469, 425 (2009), ISSN 0921-4534, superconductivity in Iron-Pnictides, URL http://www.sciencedirect.com/science/article/pii/S092145340900077X.
- Homes et al. (2016) C. C. Homes, Y. M. Dai, J. Schneeloch, R. D. Zhong, and G. D. Gu, Phys. Rev. B 93, 125135 (2016), URL https://link.aps.org/doi/10.1103/PhysRevB.93.125135.
- Teng et al. (2013) J. Teng, C. Chen, Y. Xiong, J. Zhang, R. Jin, and E. W. Plummer, Proceedings of the National Academy of Sciences 110, 898 (2013), URL http://www.pnas.org/content/110/3/898.abstract.