Department of Physics and Gothenburg Physics Centre, Chalmers University of Technology, SE-412 96 Göteborg, Sweden
Quantum-Size Effects in the Visible Photoluminescence of Colloidal ZnO Quantum Dots: A Theoretical Analysis
Abstract
ZnO has been known long since to be a highly efficient luminescent material. In the last years, the experimental investigation of the luminescent properties of colloidal ZnO nanocrystals in the nanometer range of sizes has attracted a lot of of interest for their potential applications in light-emitting diodes and other optical devices and in this work we approach the problem from a theoretical perspective. Here, we develop a simple theory for the green photoluminescence of ZnO quantum dots (QDs) that allows us to understand and rationalize several experimental findings on fundamental grounds. We calculate the spectrum of light emitted in the radiative recombination of a conduction band electron with a deeply trapped hole and find that the experimental behavior of this emission band with particle size can be understood in terms of quantum size effects of the electronic states and their overlap with the deep hole. We focus the comparison of our results on detailed experiments performed for colloidal ZnO nanoparticles in ethanol and find that the experimental evolution of the luminescent signal with particle size at room temperature can be better reproduced by assuming the deep hole to be localized at the surface of the nanoparticles. However, the experimental behavior of the intensity and decay time of the signal with temperature can be rationalized in terms of holes predominantly trapped near the center of the nanoparticles at low temperatures being transferred to surface defects at room temperature. Furthermore, the calculated values of the radiative lifetimes are comparable to the experimental values of the decay time of the visible emission signal. We also study the visible emission band as a function of the number of electrons in the conduction band of the nanoparticle, finding a pronounced dependence of the radiative lifetime but a weak dependence of energetic position of the maximum intensity.
keywords:
Quantum dots, photoluminescence, zinc oxideIntroduction
ZnO has been known long since to be a highly efficient fluorescent material 1, 2 and as such proposed as an excellent candidate for light-emitting and optoelectronic devices 3. Many studies done in the past using single crystals and powders 4, 5 showed that when ZnO is excited with UV light across the bandgap, two emission bands appear. The narrow band, known as the exciton band, is at an energy close to the incident energy and originates from the radiative recombination of a photoexcited electron with a valence band hole. The broad band is in the visible and is called the green luminescence band because of its color. It is associated with the existence of intrinsic lattice defects, vacancies or impurities 2, 4, 6, 7 that can trap charge carriers and for this reason it is also called the defect luminescence band.
In the last years the luminescent properties of colloidal ZnO quantum dots (QDs) in the nanometer range of sizes have been investigated. The two bands also appear in this case and their relative intensity is extremely dependent on whether the nanoparticles are in an atmosphere with or without the presence of oxygen 8, 9, 10, 11, 12, 13, 14, 15, 16, 17. Under aerobic conditions the visible band is prominent while the exciton band is a weak feature. However, under anaerobic conditions and upon irradiation with UV light, the visible emission band quenches as the exciton band increases in intensity 8, 9, 10, 11, 12, 13, 14, 15. Furthermore, an infrared absorption band develops due to the accumulation of electrons in the conduction band that leads to the formation of a local surface plasmon resonance in the nanoparticle 16, 17, 18. Admission of oxygen provokes the opposite effect: the luminescent exciton emission disappears as the visible emission band recovers in intensity 12, 13 and the infrared absorption is also quenched 17.
There are few experiments analyzing in detail the size dependence of the luminescent properties of ZnO QDs 8, 9, 10, 11. Such dependence is interesting since for these nanocrystals the size-quantization of the energy levels of electrons and holes is expected to determine their emission properties. The most extensive experiments were conducted in air for suspensions of ZnO nanoparticles in 2-propanol or ethanol in 10, 11, where the intensity and the position of the visible band, as well as the decay time of the luminescent signal were monitored as a function of size at room temperature. It was found that, as the nanoparticle size increases, the intensity of the band decreases, its position red shifts and the decay time increases, in accordance with previous observations 8, 9. Also, the intensity and the decay time are very dependent on temperature: the intensity decreases by a factor of 5 and the decay time increases by approximately the same factor as the temperature increases from 4 K to room temperature 10. Up to our knowledge, the evolution of the visible luminescence signal with nanoparticle size has not yet been studied under anaerobic conditions with the same detail, probably because of its low intensity. Even for a given size, there are contradictory experiments concerning the shift of this band as the crystal becomes charged: while a blue shift is reported in 12, 14, 17, other Authors observed essentially no shift 13.
The current theoretical investigation of colloidal QDs is focused on calculations of the electronic band structure of clusters with sizes smaller than 3 nm in diameter, with and without ligands at the surface, and at different levels of sophistication (we refer the reader to references 19, 20 and references therein) but such calculations cannot be extended to larger systems nowadays. In this work we attack the problem from a different perspective and develop a simple theory for the defect photoluminescence of QDs that allows us to understand and rationalize several experimental findings on fundamental grounds. Using Fermi’s golden rule together with a simple model for the quantized electronic states, we analyze theoretically the characteristics of the visible emission band of ZnO QDs and their evolution with particle size. We focus on comparing our results with the detailed experiments of van Dijken et al. 10, 11 performed for ZnO nanoparticles in ethanol under aerobic conditions. The behavior of the spectral characteristics with particle size can be understood in terms of quantum size effects and the experiments at room temperature are reproduced more accurately by assuming the hole to be localized at the surface of the nanoparticle. Furthermore, the theoretical values of the radiative lifetime are comparable to the experimental values of the decay time. Based on our results, we suggest that the anomalous dependence of the decay time with temperature found by van Dijken et al. 10 can be the effect of an increasing probability for the holes to be trapped at the surface with increasing temperature. We also study the visible emission band as a function of the number of electrons in the nanoparticle finding a pronounced dependence of the radiative lifetime. We conclude that a better experimental characterization of the distribution of traps and the charge of the nanoparticles is essential to fully understand and control their emission properties.
Theory
Although there has been some controversy concerning the origin of the mechanism of the visible luminescence of ZnO, whether it is due to the radiative recombination of (i) a delocalized electron with a deeply trapped hole or (ii) a deeply trapped electron with a delocalized hole 10, 13, 21, it is now well established that mechanism (i) is dominant 11, 15, 17 and in this work we adhere to this picture.
Our system consists of ZnO spheres of radius is a medium characterized by its dielectric permittivity . When the sphere is illuminated with light of energy across the bandgap, a photon is absorbed exciting an electron to the conduction band and leaving a hole in the valence band. Some of the holes can be transferred very quickly to hole traps while some of the electrons can be scavenged by oxygen adsorbed at the nanoparticle surface, especially for particles in air, before light emission takes place. Therefore the number of electrons and the number of holes participating in the subsequent luminescent process are in general different. Since the charge and the number and distribution of hole traps are not well characterized experimentally, we need some simple but reasonable assumptions for and . Given that the exciton emission band is very weak when the nanoparticles are in air, we assume that all the created holes are transferred to hole traps. Then equals the number of absorbed photons (per photon incident onto the sphere): , where is the absorption cross section of a ZnO sphere of radius . With respect to the number of electrons in the conduction band we assume either of two cases in which (a) is independent of size or (b) the electronic density is independent of size. In all cases we consider the electronic system to be in its ground state in the conduction band when light emission occurs. We work at K but our results are also valid at room temperature since the excitation energies of the QDs are typically of eV and therefore larger than the thermal energy at room temperature.
To study steady-state luminescence, we calculate the probability per unit time that a conduction band electron fills a deep hole with emission of a photon of frequency using Fermi’s golden rule
| (1) |
where indicates summation over all possible photon states, indicates summation over all possible states of a conduction electron, is the Fermi factor giving the occupancy of state of energy , the final state is the trapped-hole state of energy and the -function expresses energy conservation. The matrix elements for the transition are
| (2) |
In eq. (2) and are the charge and effective mass, respectively, of a conduction band electron, is the speed of light, and are the electronic initial and the hole final states, respectively, is the momentum operator and is the vector potential of the electromagnetic field with polarization . In the Coulomb gauge , being the electric field vector, so that is rewritten as
| (3) |
The electric field is defined except for a normalization constant, , which is obtained with the condition of having one photon of energy in the quantization volume , so that . Next, we perform the sum over photon states as
| (4) |
where the factor of 2 comes from polarization, is the photon wave vector and the last identity is appropriate for the problem of full spherical symmetry (no preferential direction in space) in vacuum that we address in this work. Substituting eqs. (3-4) into eq. (1) and collecting all the prefactors we obtain
| (5) |
with the matrix elements given simply by
| (6) |
where in a time-reverse picture, the electric field is the total one inside the sphere corresponding to an outgoing electromagnetic plane wave of unit amplitude.
From eq. (5) we obtain the visible luminescence spectrum as the number of emitted photons with energies between and per unit time and per photon incident onto the sphere as
| (7) |
the first factor on the right hand side of eq. (7) being the number of holes per photon incident onto the nanosphere. Note here that the assumption that all holes are deeply trapped only affects the intensity of the signal but not its spectrum nor the value of the radiative decay time, both given by eq. (5). We next give details of how we calculate each of the terms in eqs. (6) and (7).
The normalized electric field inside the nanoparticle induced by an x-polarized plane wave, can be written in the dipole approximation, due to the small sizes of interest here, as
| (8) |
in spherical coordinates, with , and being the unitary vectors. The polarizability of the sphere enters into the evaluation of . We assume it is set by these electrons in the conduction band that can participate in the emission event (i.e. those not scavenged by oxygen) and, accordingly, it is given by 22, 23, 24
| (9) |
where is the local permittivity of ZnO,
| (10) |
is the permittivity of the medium surrounding the sphere (assumed to be frequency independent), is the high-frequency permittivity of ZnO, is the plasma frequency with . is the average distance between the conduction band levels defined as 25
| (11) |
where can be estimated from a simple model 26 as , with being the effective electron mass (in units of the electron mass), being the Bohr radius and . The the complex length takes into account the effects of diffuse surface scattering of the electrons23, 24, which is significant in low charge carrier density systems such as ZnO here considered.
The electronic states appearing in eq. (6) should be orthonormal because they should be eigenfunctions of the same Hamiltonian. We take care of this very important fact in an approximate way. We start by considering the conduction band electrons as free-electrons confined by an infinite potential well at the surface of the nanosphere. These states are orthonormal and described by for quantum numbers , where are the angular momentum quantum numbers and quantizes the energy for each (energies ). The corresponding wave functions, expressed in spherical coordinates, are
| (12) |
were is the normalization constant, is the n-order zero of the spherical Bessel function and is the spherical harmonic. The corresponding eigenenergies (measured with respect to the bottom of the conduction band) are
| (13) |
The nature of the trap is still under debate and several proposals can be found in the literature such as Cu impurities6, Zn vacancies 27 or oxygen vacancies 10 among others. In the case of colloidal QDs, the chemical nature of surface ligands is known to play a role in their luminescent properties 28. Therefore, in order to keep the problem as simple as possible, and since the energy of the deep hole is approximately in the middle of the band gap, we describe the deep hole state by the hydrogenic wave function
| (14) |
with , being the hole mass and being its binding energy. When is referred to the bottom of the conduction band, like , , being the band gap of ZnO. The deep hole is localized at a point inside the sphere that we will take as a parameter. Obviously, this hole state is not, in general, orthogonal to the conduction band states of eq. (12). Next, we proceed to construct an orthonormal set of orbitals from the non-orthogonal set by means of the symmetrical orthogonalization procedure proposed by Löwdin 29:
| (15) |
where is the overlap matrix with matrix elements . As a further approximation we assume all the off-diagonal matrix elements of to be small and expand in powers of the overlap integrals. Up to order we get
| (16) |
this approximation being especially useful for because it makes possible to obtain an analytical expression for eqs. (5) and (6). Using it, the matrix elements of eq. (6) between orthogonal orbitals can be easily expressed in terms of the corresponding ones for non-orthogonal orbitals as
| (17) |
with the superscript – indicating that eq. (6) is to be evaluated between the non-orthogonal states of eqs. (12) and (14). The details of this calculation are given in the Supplemental Information.
The derivation above strictly holds for ideally spherical nanoparticles. For real spheres, however, because of the unavoidable existence of imperfections in their shape and morphology, it is nearly impossible to calculate a detailed level distribution. A common approach has been to assume the level distribution to be completely random. 26, 30. On the other hand, the hole state has a large width. It is known that electron-hole recombination at a defect site results in large reorganization of the local charge and, consequently, strong vibronic transitions. We take care of these effects by making use of the identity
| (18) |
and then substituting the function by a gaussian distribution of probability function as 30
| (19) |
for the conduction band states and likewise for the deep hole state
| (20) |
An appropriate value for is , 30 being the average distance between the conduction band levels near their Fermi energy defined by eq. (11). We take eV, a typical value for vibrational energies. However, we assume for simplicity that the matrix elements can be calculated by means of eq. (17), which implies that matrix elements are not very sensitive to changes in nanoparticle radii by 30 or to changes in the wave function of the deeply trapped hole.
Results and discussion
We perform calculations for the case of ZnO nanospheres in ethanol using the values: eV, , 0.1 eV, and . The parameters for the deep hole are and eV (measured with respect to the bottom of the conduction band) taken from experiments 11. In all the calculations to be presented in this work, we include in eq. (17) states with for each of the quantum numbers and this is enough for obtaining converged results. In the following, states will be denoted according to the standard notation as for , for , for etc.
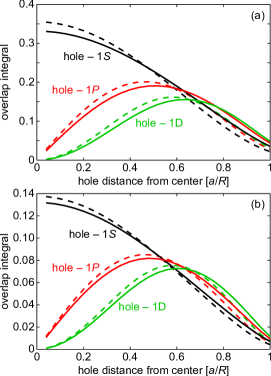
To check the accuracy of eq. (16) we present in Figure 1a,b the overlap integrals for , and , as a function of the distance of the deep hole to the sphere center, for nm and nm respectively. We note that the overlap of the deep hole with the states of the conduction band electrons is near the center and then decreases as approaches the sphere surface. Therefore, while the approximation of eq. (16) is a good one near the surface, it might not be so good near the sphere center, especially for the smallest size. For it is not difficult to obtain corrections to eq. (16) up to the order and we have checked that this does not change the order of magnitude of the results. Nevertheless, we restrict our calculations to . Figure 1 also shows a comparison of the overlap integrals assuming that the conduction electrons are confined by an infinite barrier (dashed lines) or by a step potential barrier of height eV (continuous lines) 30, 31. The small changes we see motivate our use of infinite barrier model, that is much simpler for analytical and computational purposes.

We first present results under the assumption (a) that the number of electrons in the conduction band is a small number independent of particle size. To demonstrate the importance of orthogonalization effects, Figure 2a,b shows calculations of the visible luminescence spectra, using orthogonal (continuous lines) and non-orthogonal (dashed lines) states, for (2 electrons in the state and 2 electrons in the state), and 4 nm, and for in Figure 2a and in Figure 2b. Note that the non-orthogonal calculation overestimates the spectra by roughly a factor of 4 and, consequently, the radiative lifetimes would be underestimated by the same factor. The peaks in Figure 2a originate from the radiative recombination of the electron in the state with the trapped hole of the same spin. The peak intensity decreases and its position shifts to lower energy with increasing size, as in the experiments. The shift to lower energy with increasing size is predicted by eq. (13) for the eigenenergies. The decrease in intensity is the consequence of the decrease in the overlap between electron and hole states with increasing size, compare Figure 1a and b, and the matrix elements appearing in eq. (17) behave in the same way. Hence this simple model reproduces the experimental behavior of the evolution of position and intensity of the steady-state green luminescence with particle size at room temperature 8, 9, 10, 11. The small shoulder to the left of the peak in Figure 2a originates from the radiative recombination of the electron in the state with the trapped hole of the same spin. This process, that is strictly forbidden if the hole is localized at , shows as a faint feature for small values of but gets important if the deep hole is localized near the nanoparticle surface, as can be appreciated in Figure 2b, where both peaks are of nearly the same intensity. Nevertheless the relative intensity of both peaks does not change much for
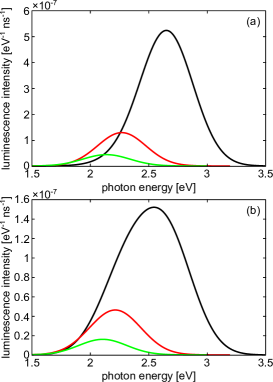
The calculations of Figure 2 are for a hole state having zero width. Figure 3 displays the photoluminescence spectra of eq. (7) for the same parameters as in Figure 2 but including an energy broadening of the deep hole of eV, where it can be observed how the atomic-like peaks merge and form a continuous broad band. Although the behavior with particle size of this band follows the experimental trends mentioned above, a more quantitative analysis shows that the relative changes are too quick in comparison with experiments. The same happens if we assume to have in the QDs (not shown here). Figure 3 of ref.10 shows a quick decrease of the peak intensity with increasing size for radii smaller than ca. 1.5 nm which can be modeled by the present approximation, but this quick decrease is followed by almost constant values of the intensity for radii increasing up to 3.5 nm, while a continuous decrease is obtained in the calculations. The quick decrease in peak energy with increasing radius is also not seen in the experiments10, where this energy decreases from ca. 2.4 eV for the smallest size to ca. 2.2 eV for the larger radius.

We then turn to our assumption (b) and consider that the density of conduction band electrons is independent of particle size. This is motivated by the fact that well characterized ZnO colloidal QDs in toluene, with sizes ranging from 2 to 6 nm in radii, can be charged, under anaerobic conditions, all to the same maximum electron density of cm-3 18 and in previous works we used the lower limit of this density to reproduce the IR absorption properties of these QDs 23, 24, 30. Guided by these maximum values, we consider the aerated QDs to have approximately one half of that density. Actually, since in our calculations we always have an even number of conduction electrons (half of each spin) and the minimum value of is 2, the minimum density we consider is cm-3 corresponding to 2 electrons in a sphere of nm. Under the assumption that all QDs have this same density of electrons in the conduction band, a sphere of nm has electrons and a sphere of nm has electrons.
The visible photoluminescence spectra for equal electron density are presented in Figure 4a,b, for and respectively. Looking at the results for (dots), we only see one small peak at eV for nm which originates from the electron in the level. As we said above, this transition would be strictly forbidden if the hole was localized at the sphere center. Consequently, this feature is small for but not for . For nm, the prominent peak at eV in Figure 4 originates from the radiative decay of electrons in the level while the shoulder at eV originates from electrons in the level. For nm the conduction band levels , and are populated with electrons and the corresponding features are seen in the photoluminesce spectra. Therefore, as size increases, the energy levels move down in energy but simultaneously higher energy levels become populated with electrons with the net effect being a slow variation of the position of the maximum with size. In fact, when we give a line broadening to the hole, the atomic-like features merge into broad bands with maxima at energy positions that decrease with increasing radius as before but at a pace more in accordance with experiments. The values of these maxima in Figure 4b are eV, eV, and eV, for , 3 and 4 nm, respectively. With respect to the dependence of the maximum intensity on size, we note in Figure 4a that the peak of the nm nanosphere is too small for , and the experimental characteristics of a weak dependence of intensity on size in the range of sizes 1.5 nm 3.5 nm is best reproduced if we assume the deeply trapped hole to be localized near the surface. This weak dependence is the net effect of the competition between decreasing overlap and increasing population of high energy levels with increasing size. Therefore, these calculations confirm the conclusions of van Dijken et al. 10 showing evidence of fast surface trapping of holes in the trap emission process. It is also experimentally known that passivation of surface defects quenches the visible photoluminescence 17, 28. The values of the radiative lifetimes for the cases in Figure 4b are s, 0.89 s and 0.98 s for , 3 and 4 nm respectively, increasing with increasing size as in the experiment, see Figure 4 of ref.10. Moreover, a value of s was measured for nm and s for nm at room temperature, both comparable to our calculation.
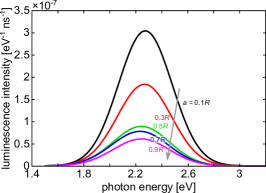
Based on the results presented above, we now give a possible reason for the experimentally observed behavior of the visible luminescence spectra and radiative lifetimes of the aerated QD with temperature presented in Figures 5B and 6 of van Dijken et al.10 for nanoparticles of nm. Figure 5 displays calculated spectra for nanospheres of nm for different values of the position of the hole within the particle. It is interesting to note the fast decrease of the maximum intensity as the hole moves from the center to the surface, the factor of 5 difference we find here being reminiscent of the same fast decrease of the experimental intensity with increasing temperature shown in Figure 5B of van Dijken et al.10 Furthermore, the decay of the visible emission signal is found to be single exponential at very low and at room temperatures with values of the decay time of 0.275 s and 1.34 s at K and room temperature, respectively. The theoretical values of the radiative lifetime are 0.24 s and 1.14 s for and , respectively, and are comparable to the experimental values. These results suggest that the holes are predominantly trapped in the bulk of the nanoparticle at low temperatures and at the surface at room temperature. So increasing the temperature increases the probability for the holes to be transferred to defects at the surface of the nanoparticles. It is interesting to note here that an exponential decay of the visible emission signal is also seen in single crystals at low temperatures (smaller than 20 K) with s 6, a value similar to the one seen for nm nanoparticles at K quoted above. The transition from low to room temperatures seen by van Dijken et al.10 is at K or eV. The binding energy of the hole can depend on whether it is trapped at the center or at the surface of the nanoparticle and a difference in binding energies on the order of 0.01 eV is enough to thermally populate/depopulate one or the other site at that transition temperature. In general, there would be a spatial distribution of traps within the nanoparticle leading to a multiexponential decay of the luminescent signal with exponents than depend on the site where the trap is localized. The calculations of Figure 5, however, differ from the experimental results in that the theoretical position of the maximum moves to lower energies by 0.05 eV at most while differences of ca. 0.1 eV are found in the experiment, see Figure 5B of van Dijken et al.10. It could be that the interaction of the localized hole with the vibronic modes, which is certainly temperature dependent, also affects its energetic position, an important effect not considered in the present work.
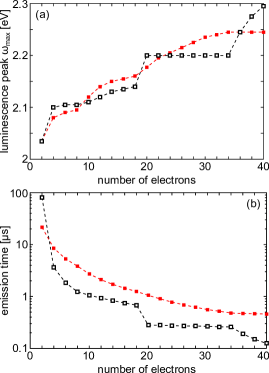
Very recently it has been verified experimentally that air-free QDs of different sizes that are photodopped to the same dopping level, all reach the same average value of their electronic density independent of size, at cm-3 32. The better agreement between theory and experiment, which we find under the assumption that the density of conduction band electrons is independent of size, implies that this is also the case in the presence of air. This is in accordance with other experimental observations such as, for example, Cohn et al. 15 who “conclude a surprisingly high probability of exciting unintentionally charged ZnO nanocrystals even under aerobic conditions and even without deliberate addition of hole scavengers” and other works 12, 13 which find that it is more easy to charge with electrons the biggest crystals than the smaller ones. Hence it is important to analyze the dependence of the visible emission characteristics with electron density and we do it by considering a system of ZnO nanoparticles in toluene (), where it is known that they can be charged up to a maximum electron density of cm-3 18. As in the work of Cohn et al. 15 we consider spheres of nm and present our results for and as a function of in Figure 6a,b, respectively. In this case, the maximum density is obtained for electrons. As the number of electrons increases, the maximum of the spectra in Figure 6a blue shifts by 0.20–0.25 eV, that is 10 at most, in accordance with other findings 12, 14, 17. The jumps in the value and/or slope of seen at and 36 occur when a new shell starts to be filled. In contrast to , the radiative time shows a pronounced decrease for small and tends to saturate for larger values. Experiments by Cohn et al. 15 for uncharged crystals report a multiexponential decay that is fitted reasonably well by two time constants, a fast one of s and a slow one of s, with the slow component constituting of the amplitude. Assigning this component to the radiative decay of holes localized near the surface, that value of is obtained in our calculation for electrons, or cm-3, a value of the electron density similar to the one found above for reproducing experiments of aerated ZnO QDs in ethanol. However, the calculated radiative lifetime decreases continuously when increasing above this value which seems to be in contradiction with the observation of Cohn et al.15 who report that the slow component is weakly affected by the addition of extra electrons, but the effect is not quantified. Nevertheless, it is known that the accumulation of electrons in the conduction band strongly perturbs the dynamics of the trapped holes 8, 9, 10, 11, 12, 13, 14, 15, 17 and, consequently, their decay time will be equally perturbed. Therefore, although our simple theoretical model is able to reproduce many experimental trends, we conclude that improvement of the theory as well as a better experimental characterization of the charge and distribution of defects in the nanocrystals is essential to fully understand and control the luminescent properties of ZnO QDs.
Conclusions
In this work we have developed a theory for the photoluminescence of ZnO QDs using Fermi’s golden rule together with a simple model for the electronic states. We assumed the green luminescence to be generated in the radiative recombination of a delocalized conduction band electron with a hole trapped within the particle and analyzed the dependence of the spectral characteristics on the particle size and spatial localization of the hole. The behavior of this band with particle size can be understood in terms of quantum size effects of the electronic states and their overlap with the localized hole. Focusing the comparison of our results with the detailed experiments performed for ZnO nanoparticles in ethanol under aerobic conditions10, 11, we conclude that the experimental trends found at room temperature can be accurately reproduced by assuming that the hole is located at the surface of the QD. Based on our results of the dependence of emission intensity on the location of the hole, we suggest that the anomalous dependence of the decay time with temperature found by van Dijken et al. 10 for nm can be the effect of an increasing probability for the holes to be trapped at the surface with increasing temperature. Furthermore, the calculated values of the radiative lifetimes are comparable to the experimental values of the decay time of the visible emission signal. We also studied the visible emission band as a function of the number of conduction band electrons in the nanoparticle finding a pronounced dependence of the radiative lifetime that does not seem to conform to experiment. We thus conclude that further improvement of the theoretical model, as well further experimental effort providing a better characterization of the distribution of traps and the charge of the nanoparticles, is essential to fully understand and control their emission properties.
RCM acknowledges financial support from the Spanish Ministry of Economy and Competitiveness through the María de Maeztu Programme for Units of Excellence in R&D (MDM-2014-0377) and the project MAT2014-53432-C5-5-R. TJA thanks the Polish Ministry of Science and Higher Education for support via the Iuventus Plus project IP2014 000473. TJA and SPA acknowledge financial support from the Swedish Foundation for Strategic Research via the Functional Electromagnetic Metamaterials for Optical Sensing project SSF RMA 11.
In the Supporting Information we present full derivations of the calculations of overlap integrals and matrix elements.
References
- Shrader and Leverenz 1947 Shrader, R. E.; Leverenz, H. W. Cathodoluminescence Emission Spectra of Zinc-Oxide Phosphors. J. Opt. Soc. Am. 1947, 37, 939–940
- Heiland et al. 1959 Heiland, G.; Mollwo, E.; Stöckmann, F. In Electronic Processes in Zinc Oxide; Seitz, F., Turnbull, D., Eds.; Solid State Physics Supplement C; Academic Press, 1959; Vol. 8; pp 191–323
- Look 2001 Look, D. Recent advances in ZnO materials and devices. Materials Science and Engineering: B 2001, 80, 383–387
- Anpo and Kubokawa 1984 Anpo, M.; Kubokawa, Y. Photoluminescence of zinc oxide powder as a probe of electron-hole surface processes. The Journal of Physical Chemistry 1984, 88, 5556–5560
- Vanheusden et al. 1996 Vanheusden, K.; Warren, W. L.; Seager, C. H.; Tallant, D. R.; Voigt, J. A.; Gnade, B. E. Mechanisms behind green photoluminescence in ZnO phosphor powders. Journal of Applied Physics 1996, 79, 7983–7990
- Dingle 1969 Dingle, R. Luminescent Transitions Associated With Divalent Copper Impurities and the Green Emission from Semiconducting Zinc Oxide. Phys. Rev. Lett. 1969, 23, 579–581
- Kröger and Vink 1954 Kröger, F. A.; Vink, H. J. The Origin of the Fluorescence in Self-Activated ZnS, CdS, and ZnO. The Journal of Chemical Physics 1954, 22, 250–252
- Koch et al. 1985 Koch, U.; Fojtik, A.; Weller, H.; Henglein, A. Photochemistry of semiconductor colloids. Preparation of extremely small ZnO particles, fluorescence phenomena and size quantization effects. Chemical Physics Letters 1985, 122, 507–510
- Bahnemann et al. 1987 Bahnemann, D. W.; Kormann, C.; Hoffmann, M. R. Preparation and characterization of quantum size zinc oxide: a detailed spectroscopic study. The Journal of Physical Chemistry 1987, 91, 3789–3798
- van Dijken et al. 2000 van Dijken, A.; Meulenkamp, E. A.; Vanmaekelbergh, D.; Meijerink, A. The Kinetics of the Radiative and Nonradiative Processes in Nanocrystalline ZnO Particles upon Photoexcitation. The Journal of Physical Chemistry B 2000, 104, 1715–1723
- van Dijken et al. 2000 van Dijken, A.; Meulenkamp, E. A.; Vanmaekelbergh, D.; Meijerink, A. Identification of the transition responsible for the visible emission in ZnO using quantum size effects. Journal of Luminescence 2000, 90, 123–128
- van Dijken et al. 2000 van Dijken, A.; Meulenkamp, E. A.; Vanmaekelbergh, D.; Meijerink, A. Influence of Adsorbed Oxygen on the Emission Properties of Nanocrystalline ZnO Particles. The Journal of Physical Chemistry B 2000, 104, 4355–4360
- Stroyuk et al. 2010 Stroyuk, O. L.; Dzhagan, V. M.; Shvalagin, V. V.; Kuchmiy, S. Y. Size-Dependent Optical Properties of Colloidal ZnO Nanoparticles Charged by Photoexcitation. The Journal of Physical Chemistry C 2010, 114, 220–225
- Yamamoto 2011 Yamamoto, S. Photoenhanced Band-Edge Luminescence in ZnO Nanocrystals Dispersed in Ethanol. The Journal of Physical Chemistry C 2011, 115, 21635–21640
- Cohn et al. 2012 Cohn, A. W.; Janßen, N.; Mayer, J. M.; Gamelin, D. R. Photocharging ZnO Nanocrystals: Picosecond Hole Capture, Electron Accumulation, and Auger Recombination. The Journal of Physical Chemistry C 2012, 116, 20633–20642
- Shim and Guyot-Sionnest 2001 Shim, M.; Guyot-Sionnest, P. Organic-Capped ZnO Nanocrystals: Synthesis and n-Type Character. Journal of the American Chemical Society 2001, 123, 11651–11654, PMID: 11716721
- Faucheaux and Jain 2013 Faucheaux, J. A.; Jain, P. K. Plasmons in Photocharged ZnO Nanocrystals Revealing the Nature of Charge Dynamics. The Journal of Physical Chemistry Letters 2013, 4, 3024–3030
- Schimpf et al. 2014 Schimpf, A. M.; Thakkar, N.; Gunthardt, C. E.; Masiello, D. J.; Gamelin, D. R. Charge-Tunable Quantum Plasmons in Colloidal Semiconductor Nanocrystals. ACS Nano 2014, 8, 1065–1072
- Kilina et al. 2016 Kilina, S. V.; Tamukong, P. K.; Kilin, D. S. Surface Chemistry of Semiconducting Quantum Dots: Theoretical Perspectives. Accounts of Chemical Research 2016, 49, 2127–2135, PMID: 27669357
- Giansante and Infante 2017 Giansante, C.; Infante, I. Surface Traps in Colloidal Quantum Dots: A Combined Experimental and Theoretical Perspective. The Journal of Physical Chemistry Letters 2017, 8, 5209–5215, PMID: 28972763
- Camarda et al. 2016 Camarda, P.; Messina, F.; Vaccaro, L.; Agnello, S.; Buscarion, G.; Schneider, R.; Popescu, R.; Gerthsen, D.; Lorenzi, R.; Gelardi, F. M.; Cannas, M. Luminescence Mechanisms of Defective ZnO Nanoparticles. Phys. Chem. Chem. Phys. 2016, 18, 16237–16244
- Apell and Ljungbert 1982 Apell, P.; Ljungbert, A. A General Non-Local Theory for the Electromagnetic Response of a Small Metal Particle. Physica Scripta 1982, 26, 113–118
- Monreal et al. 2015 Monreal, R. C.; Antosiewicz, T. J.; Apell, S. P. Diffuse Surface Scattering in the Plasmonic Resonances of Ultralow Electron Density Nanospheres. The Journal of Physical Chemistry Letters 2015, 6, 1847–1853
- Monreal et al. 2016 Monreal, R. C.; Antosiewicz, T. J.; Apell, S. P. Diffuse Surface Scattering and Quantum Size Effects in the Surface Plasmon Resonances of Low-Carrier-Density Nanocrystals. J. Phys. Chem. C 2016, 120, 5074–5082
- Monreal et al. 2013 Monreal, R. C.; Antosiewicz, T. J.; Apell, S. P. Competition between surface screening and size quantization for surface plasmons in nanoparticles. New J. Phys 2013, 15, 083044
- Gorkov and Eliashberg 1965 Gorkov, L. P.; Eliashberg, G. M. Minute metallic particles in an electromagnetic field. Sov. Phys. JETP 1965, 21, 940–947
- Janotti and Van de Walle 2007 Janotti, A.; Van de Walle, C. G. Native point defects in ZnO. Phys. Rev. B 2007, 76, 165202
- Norberg and Gamelin 2005 Norberg, N. S.; Gamelin, D. R. Influence of Surface Modification on the Luminescence of Colloidal ZnO Nanocrystals. The Journal of Physical Chemistry B 2005, 109, 20810–20816, PMID: 16853697
- Löwdin 1950 Löwdin, P.-O. On the Non-Orthogonality Problem Connected with the Use of Atomic Wave Functions in the Theory of Molecules and Crystals. The Journal of Chemical Physics 1950, 18, 365–375
- Monreal et al. 2017 Monreal, R. C.; Apell, S. P.; Antosiewicz, T. J. Infrared Absorption and Hot Electron Production in Low-Electron-Density Nanospheres: A Look at Real Systems. The Journal of Physical Chemistry Letters 2017, 8, 524–530, PMID: 28067530
- Schlesinger et al. 2013 Schlesinger, R.; Xu, Y.; Hofmann, O. T.; Winkler, S.; Frisch, J.; Niederhausen, J.; Vollmer, A.; Blumstengel, S.; Henneberger, F.; Rinke, P.; Scheffler, M.; Koch, N. Controlling the work function of ZnO and the energy-level alignment at the interface to organic semiconductors with a molecular electron acceptor. Phys. Rev. B 2013, 87, 155311
- Carroll et al. 2015 Carroll, G. M.; Schimpf, A. M.; Tsui, E. Y.; Gamelin, D. R. Redox Potentials of Colloidal n-Type ZnO Nanocrystals: Effects of Confinement, Electron Density, and Fermi-Level Pinning by Aldehyde Hydrogenation. Journal of the American Chemical Society 2015, 137, 11163–11169, PMID: 26263400