Dynamics and ordering of weakly Brownian particles in directional drying
Abstract
Drying of particle suspensions is an ubiquitous phenomenon with many natural and practical applications. In particular, in unidirectional drying, the evaporation of the solvent induces flows which accumulate particles at the liquid/air interface. The progressive build-up of a dense region of particles can be used, in particular, in the processing of advanced materials and architectures while the development of heterogeneities and defects in such systems is critical to their function.
A lot of attention has thus been paid to correlate the flow and particles dynamics to the ordering of particles. However, dynamic observation at the particle scale and its correlation with local particle ordering are still missing. Here we show by measuring the particle velocities with high frame rate laser scanning confocal microscopy that the ordering of weakly Brownian particles during unidirectional drying in a Hele-Shaw cell opened on one side depends on the velocity of particles that impinge at the pinned liquid/solid interface. Under the ambient and experimental conditions presented in the following, the particle velocities accumulate in two branches. A higher degree of ordering is found for the branch of faster particle velocity which we explain by an increase in the pressure drop which drags the particles into a denser packing as the flow velocity increases. This counter-intuitive behaviour is the opposite to what is found with Brownian particles, which can reorganize by Brownian motion into denser packing during drying, as long as the flow velocity is not too high. These results show that different kinetic conditions can be used to obtain dense, defect-free regions of particles after drying. In particular, it suggests that rapid, directional drying could be used to control the crystallinity of particle deposits.
I Introduction
The drying of colloidal or non-colloidal suspensions is a very common phenomenon with many natural and technological occurrences. Drying and its results are of interest in geophysics (drying of soils), Benson and Albrecht (2001) food engineering, Sadek et al. (2014) paints, van der Kooij and Sprakel (2015); Goehring et al. (2017) and ceramic materials science. Scherer (1990) In the latter, drying is a critical step of many processing and shaping routes for advanced materials. The structural evolution of a typical suspension during drying is the result of the interplay between many parameters, which makes investigations difficult. Of particular interest are the drying patterns and the organisation of particles in the dried deposit, as the development of heterogeneities and cracks in these deposits is critical for many applications. The processing of defect-free colloidal crystals – which could be achieved by drying – is of interest for photonic applications, with a band gap in the visible. Blanco et al. (2000) Lattice defects, such as planar stacking faults or other heterogeneities, have nevertheless a critical impact on the optical properties of such materials. Vlasov et al. (2000) Understanding the formation mechanism of these structures and their defects during drying is therefore essential.
Various model experiments have thus been developed to understand the fundamentals of drying. In films or sessile droplets, curved fronts are formed and the control of the evaporation conditions is difficult, which result in a variety of drying and crack patterns. Allain and Limat (1995); Lidon and Salmon (2014) Loussert et al. Loussert et al. (2016) developed a method to observe convection and diffusion by using Raman microspectroscopy while drying charged nanoparticles dispersions in thin-film droplet confined between two circular plates. Moreover, in this work the authors provide spatially resolved measurements of the colloid concentration during the drying. Unidirectional drying has been developed as a well-controlled method to investigate the underlying phenomena. In unidirectional drying experiments, the evaporation of the solvent occurs at the open-end of the sample. The solvent flow carries the particles towards the opened solvent/air interface, where they organize into a dense packing Deegan et al. (1997); Deegan (2000); Routh (2013); Ziane and Salmon (2015); Ziane et al. (2015); Laval et al. (2016) as the progressive accumulation of particles continues.
Two competing phenomena control the drying: the difference of chemical potentials of water at the drying interface and the external humidity, and the removal mechanism of vapour from the drying interface. The latter is almost never precisely controlled. Local fluctuations of humidity in the air at the sample scale – which can hardly be avoided – can have a great impact on the drying behaviour of the system.
The mechanism that builds up the order/disorder deposit at the evaporation interface of drops has been previously identified in the velocity with which the particles impinge on to the pinned interface, Marín et al. (2011) and the evaporation rate. Piroird et al. (2016) The common hypothesis is that particles form polycrystalline (colloidal) crystals for slow evaporation rate, where particles have enough time to reorganize by Brownian motion after hitting the solid region. The same behavior was observed in sessile drops with large (micron-size) particles: disordered structures were obtained for rapid particle velocity. Askounis et al. (2013) Nevertheless, as it has been shown by Schöpe et al., Schöpe et al. (2006, 2007) the polydispersity of particles can influence kinetics and structure of the obtained deposits by changing the volume fraction at the order/disorder transition.
The rise of microfluidic chips allows to observe the drying of confined droplets and colloidal dispersions: Ziane et al., in two different works, show that homogeneous drying can be achieved by pervaporation of water through a water-permeable membrane, such that colloidal particles can be concentrated up to the growth of a colloidal crystal in the micro-channels. Ziane et al. (2015); Ziane and Salmon (2015) We anticipate that although the size of particles is two orders of magnitude smaller than ours and the geometry completely different, these works show that drying colloidal dispersions of charged hard-spheres in microchannels reveals two different regimes of solidification along the channel. In brief, one can observe a homogeneous concentration dampening crossing the liquid-solid transition toward the close-packing, and the classical growth, observed classically in directional drying, of a water-saturated solid of close-packed particles. Divry et al. (2016) In a successive work, Laval et al., Laval et al. (2016) by using similar microfluidic device, microfabricated in-situ material with predetermined composition. The process strength of the authors’ approach relies on the control of the pervaporation process at the microfluidic scale to build materials ranging from colloidal packed beds to polymer composites. In particular Laval et al. present results of how colloidal crystals embedded with gradients and fluorescent barcodes can be fabricated from a dilute dispersion of monodisperse colloids and fluorescent particles. These recent works show that directional drying is a powerful way to build materials with predetermined specifications.
Despite much progress in the understanding of drying, many questions must still be answered. What is the role of the particle size? Does the solid region remains wet during growth? What is the water concentration in the solid region uniform? What are the local drying dynamics? How do particles organize at the interface? And which factors control the dynamics and ordering of particles? Dynamic, particle-scale observations are required to answer some of these questions and in the following we will answer to a few of them.
The organisation of particles is almost always observed by looking at the dried sample, with optical, Goehring et al. (2010) confocal, Bodiguel and Leng (2010); Monteux and Lequeux (2011) atomic force, Piroird et al. (2016) or electron microscopy. Inasawa et al. (2016) The particle velocities were previously measured using markers (large particles), which is not ideal Bodiguel and Leng (2010) as it only provides an indirect measurement. The dynamics were also assessed indirectly by SANS/SAXS, Li et al. (2012); Boulogne et al. (2014) which only provide an average measurement of the particle behaviour.
To progress in the understanding of drying of particle suspensions, we investigate unidirectional drying of weakly Brownian particle suspensions by laser scanning confocal microscopy. Yoshida et al. (1991) Using a high imaging rate (up to 20 Hz) we can follow in situ individual particles dynamics followed by their ordering at the liquid/solid limit. We correlate the particle dynamics to their short/long range ordering organization and find that faster particles velocities yield better ordering and denser packings.
II Material and methods
II.1 Sample preparation
Monodisperse spherical PtBMA/PFEMA particles, 1.1 m in radius, as measured by microscopy image, were synthesized by dispersion polymerisation with a final density g/cm3, and fluorescently tagged with BODIPY 545. Kodger et al. (2015) The polydispersity index was about 0.1 as measured by Dynamic Light Scattering. They were dispersed in 0.1 mM aqueous solution of Sulforhodamine B (Fluotechnik, France), a fluorescent dye whose absorption/emission peaks are at 566/584 nm in water. The use of this secondary fluorescent dye allows us to follow the receding front of the solvent. The particle concentration of the suspension was =10 vol%. Zeta-potential measurements showed that particles are negatively charged (-30 mV), thus the repulsive force hinders aggregation, and the suspensions are readily and properly dispersed. To ensure an optimal dispersion of particles prior to measurement, the suspensions were sonicated for 1 hour in an ultrasound bath. Because of their density and size, particles settle within a few minutes in the thin sample. The diffusion of particles in the suspension is very limited, thus we define them as weakly-Brownian particles.
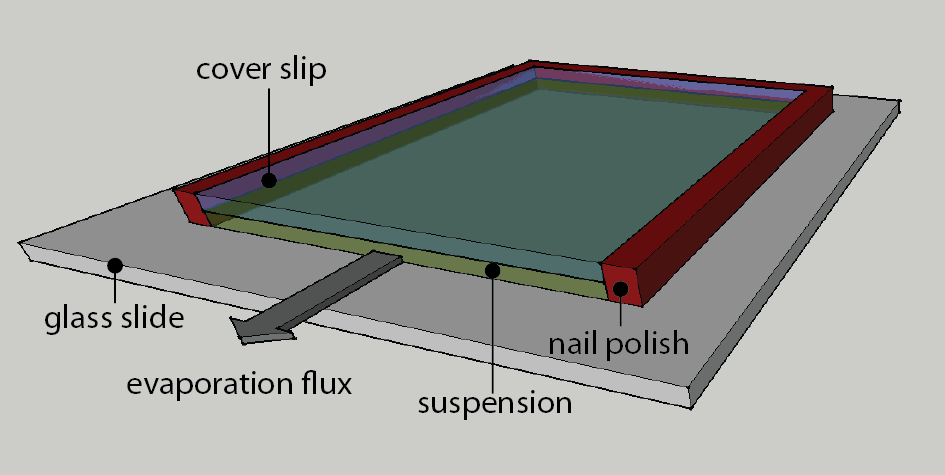
To observe the drying process, thin Hele-Shaw cells were prepared as follows: a 8 L droplet of suspension was placed onto a microscope glass slide (VWR). A square cover slip (22 cm2 and thickness 170 m, VWR) was carefully deposited on top of the droplet. The Hele-Shaw cell was sealed on three sides with nail polish. One side of the cell is opened, inducing directional drying (Figure 1). Within the series of measured samples, the apparent as-prepared thicknesses of all the Hele-Shaw cells were in the 10–20 m range. The thickness within the single Hele-Shaw cell was uniform as we measured the cell thickness in different points of each cell. These values were measured by microscopic images of the vertical cross-section of the samples. Drying occurs at ambient air condition without any control of humidity and temperature. The typical drying time of an entire cell is of several hours, but the formation of the dense zone at the open-end takes about 30 minutes. When air starts to invade the cell and the dense zone stops growing, we observe the formation of labyrinthine structures followed by the appearance of cracks (such events will not be discussed here).
II.2 Confocal microscopy
To follow in situ and in real-time the dynamic and organization of particles during drying, we used a Leica TCS SP8 (Leica-Microsystems, Mannheim, Germany) confocal laser scanning microscope. We used an external continuous laser source at 488 nm (blue) to scan the sample and a Leica HCX PL APO CS dry objective. The light is collected by a photomultiplier.
The 488 nm laser beam excites the dye (BODIPY) within the particles. The fluorescence is integrated in the 495-520 nm range. A high-speed scanner allows to record up to 20 frames per second at a 512512 pixels2 resolution, equivalent to 290290 m2 at the optical magnification 2. The microscope is controlled in remote by the proprietary Leica LAS-AF software. Due to the time needed to prepare the sample and launch the acquisition, the first images were taken approximately one minute after sealing the sample.
II.3 Image analysis
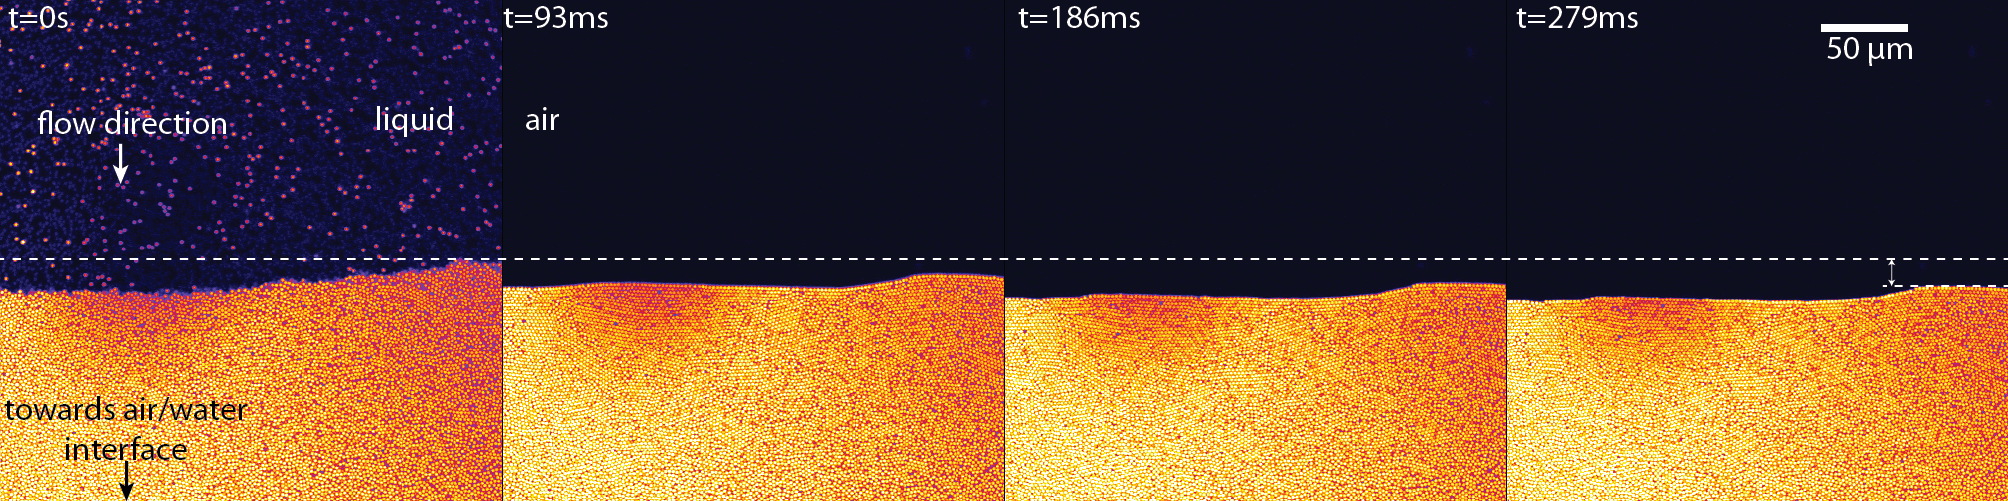
The collected series of images were post-processed with Fiji. Schindelin et al. (2012) The only digital manipulation, before any further analysis, was a linear contrast adjustment to distribute the signal in the entire dynamic range. The images were then converted to tiff files for numerical analysis. The velocity of the solid/liquid interface was determined by automated measurement of the interface position, based on the sudden change of fluorescent signal at the interface (Figure 2). The velocities of particles was measured using the TrackPy Python package. Dan Allan et al. (2014) We also used a Python code to compute the radial distribution functions, based on the analysis of the particles position obtained with TrackPy.
III Results and Discussion
We first describe the sequence of drying events, and how a dense region is formed and grows before air invasion. We then identify the existence of regions with different ordering, and measure the particle dynamics during drying.
III.1 Drying events
In confined and unidirectional drying, the flow of water towards the open-end of the cell carries particles towards the pinned air/water interface where evaporation occurs. Particles progressively accumulate, building a dense region. We observe a time-delay (on the order of half a hour) between the onset of drying of the dense zone and the dense zone formation, that remains wet as the water flows through it. This phenomenon was already observed by Divry et al. Divry et al. (2016) in drying a suspension of latex hard spheres: as these authors, we define the observation of crack as the onset of complete drying.
In particular, while the air/water interface is pinned in constant position, at the open-end of the sample, our observations reveal that the dense zone remains wet as it grows: water flows through it, dragging always more particles. As water flows out of the cell, the same volume should be replaced by, for example, air bubbles or change in thickness: we cannot observe these two phenomena because they would appear far from the point where we observe the flux of particles and the growth of the dense zone.
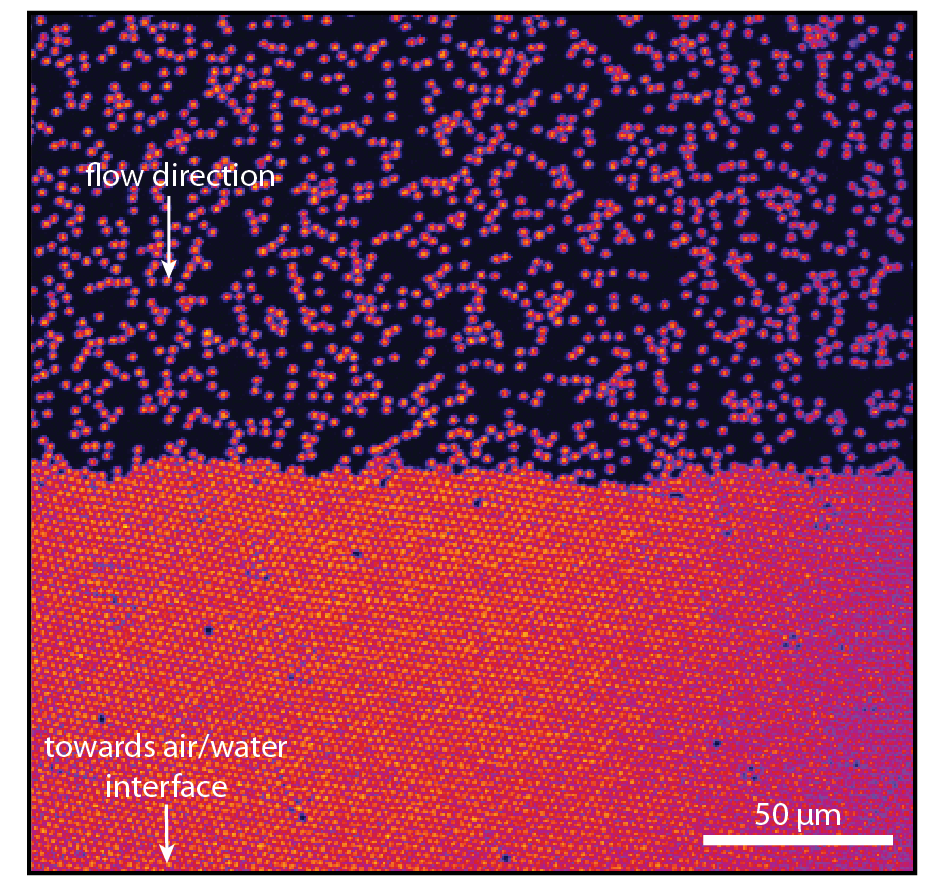
Particles, driven by the flow, accumulate in close-contact into a dense region (Figure 2(a)). The interface between the dense region and suspension is sharp (Figure 2(b)). The particle concentration goes from the nominal suspension concentration to a nearly dense packing over a distance of only 2-3 particles. The diffusion of particles in the suspension is very limited compared to the induced advection, which is why we defined them weakly-Brownian.
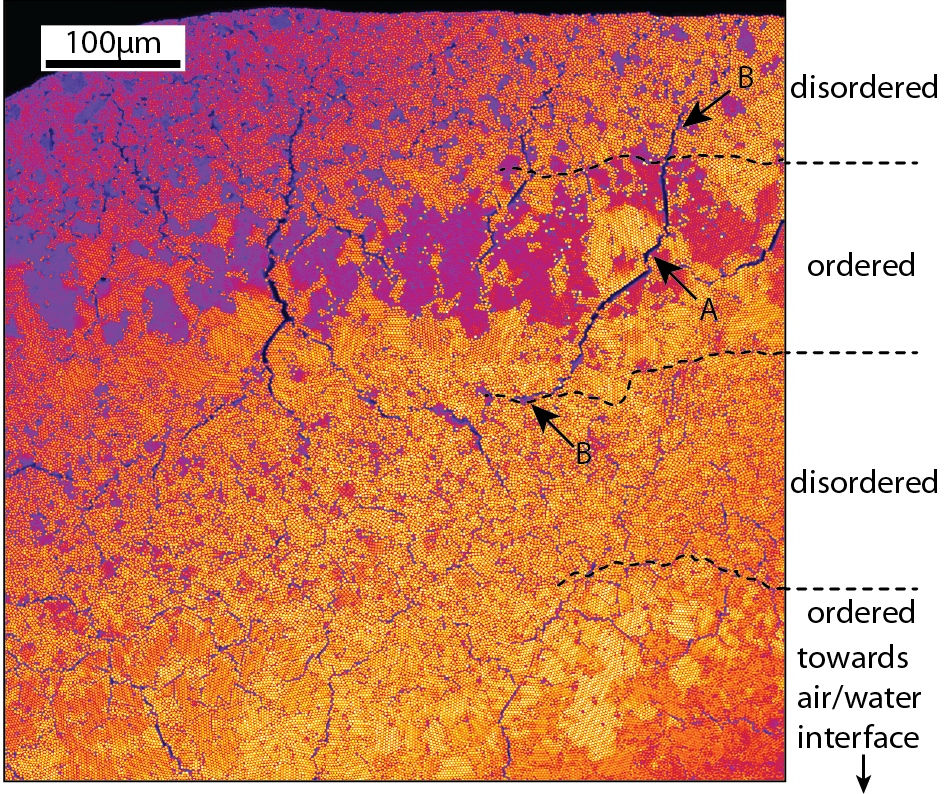
We can already observe in Figure 2(a) that the particle organisation in the dense region is not constant: ordered (hexagonal) and disordered domains can be observed. We outline that the horizontal intensity change is an artifact due to a small tilt of the sample. As the thickness of the optical slice we look at is very thin ( nm), a tiny tilt is sufficient to induce a linear gradient of intensity over the entire image. The discontinuity in intensity, assigned to the change in ordering, is instead visible through the vertical lines, which are averaged to yield Figure 2(b). Albeit it is subtle, it is yet visible. Indeed, on Figure 2(b), we observe, at about 100 , that the slope changes. We assign this event to the change in ordering. We can rule out that the change in intensity is an artifact of illumination on the sample because we operated the microscope in confocal mode.
The sample is a closed system with limited supply of suspension. At some point of the drying stage, the pressure drop inside the sample is too high: the air invades the dense deposit (Figure 3). Air invasion occurs too rapidly to be captured in the images. The capillary forces developed during the air invasion pull the particles together in the dense deposit. This locally results in an increase of the crystallinity. In particular, we only observed this behaviour at the liquid/solid interface. In the bulk of the dense deposit, particle ordering is not affected by the air invasion. The structure is probably too compact to further densify, unlike at the edge.
The air invasion also marks the onset of crack growth in the dense deposit (Figure 4). This feature has also been observed during the condensation, by water pervaporation, of charged colloidal particles in microchannels. Ziane and Salmon (2015) Cracks propagate well in ordered domains whereas they are deflected and stopped when they reach the disordered ones. Indeed, in the ordered zone, cracks propagate along the grain boundaries that are defects in the crystal. In the disordered zone, we cannot define neither a defect in the crystal structure nor a grain boundary through which the cracks can start and propagate easily. To make easier to understand the picture, we can say that the cracks become indiscernible in the disordered domains.
III.2 Evidence of alternate order in the dense deposit
At the end of drying and particles flow, the deposit is made of alternating ordered (hexagonal) and disordered (glassy) domains. In the observation plane, the particle density is apparently greater in the ordered domains than in the disordered ones.
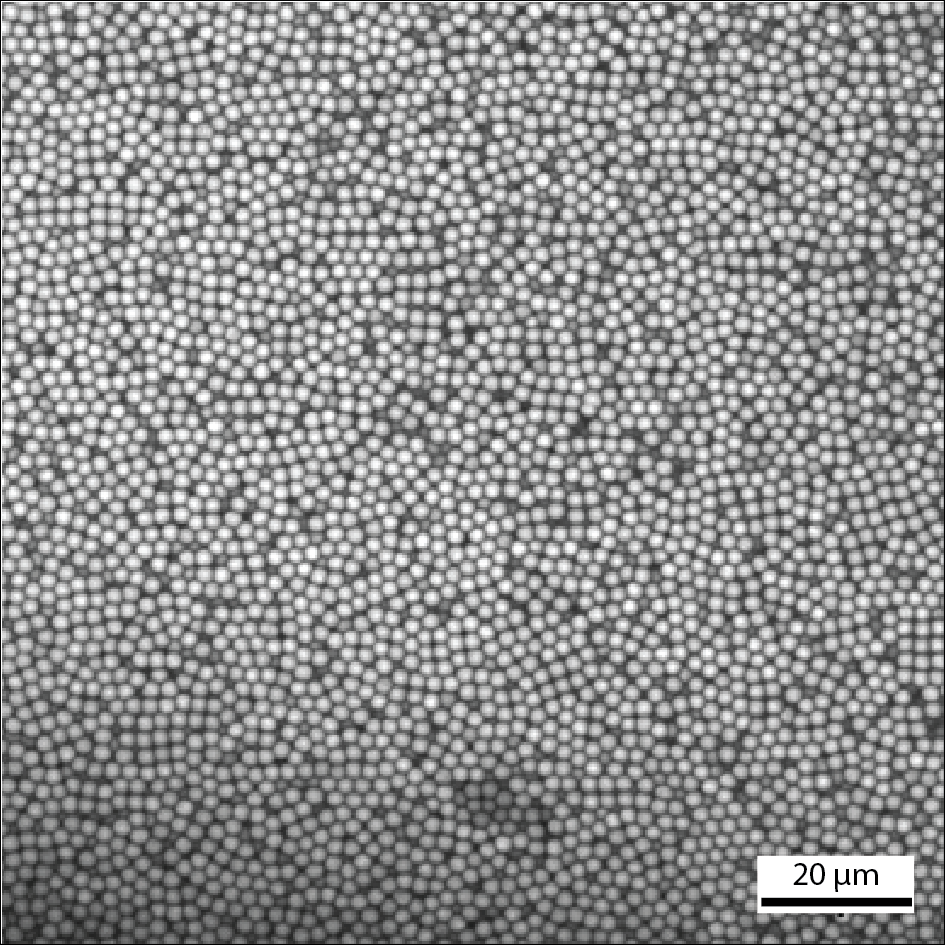
Close-up views of the particle organization in the ordered and disordered domains are shown in Figures 5 and 6. From these two figures, we estimate the 2D density of particles to be 77% in ordered domains and 62% in disordered ones.
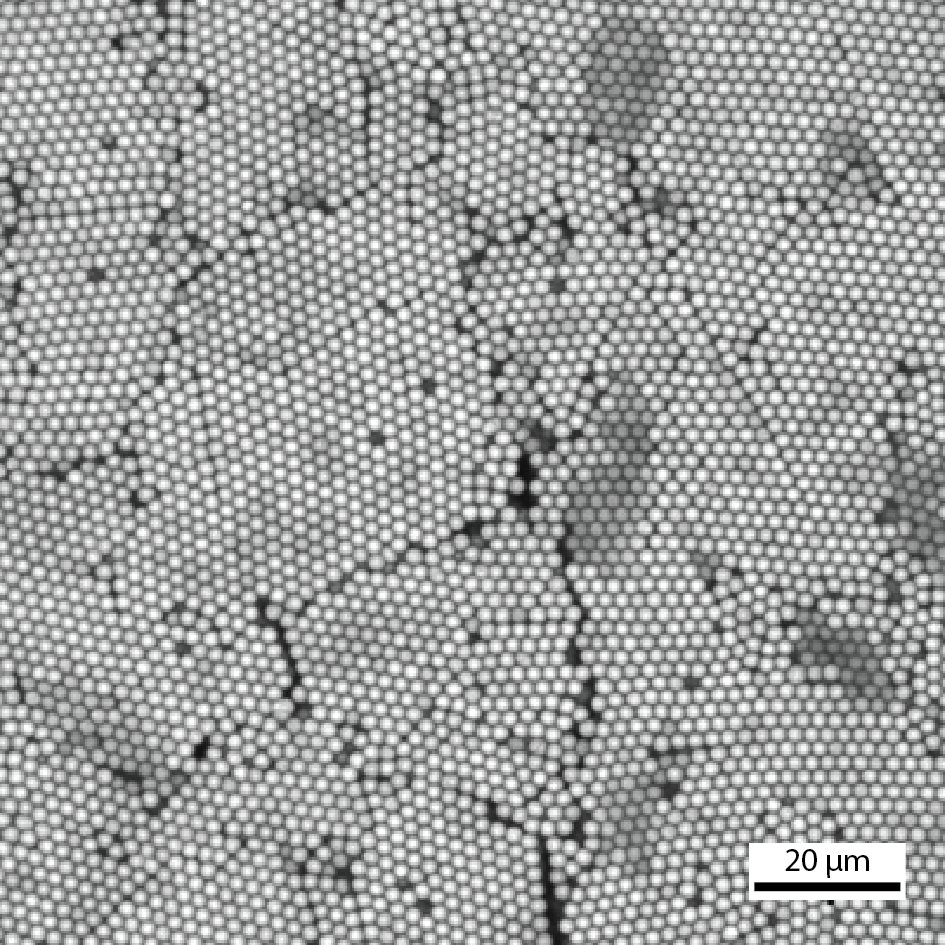
The ordered domain, Figure 5, is made of 2-dimensional, long-range ordered, colloidal crystal grains. Defects typical of colloidal crystals can also be observed, such as vacancies, stacking faults, or dislocations. Owing to the well ordered domains, we argue that the ordering should continue in the interior of the domains, in a three-dimensional fashion. This fact was already observed in rather similar experiment by post-mortem electron microscope images. Inasawa et al. (2016)
We observe that the ordered structure is formed as soon as the particles reach the dense zone. The particles carried by the flow settle in a crystalline, hexagonal organisation at the solid/liquid interface. No further particles reorganization is observable at the current level of magnification () and resolution.
The disordered domains, shown in Figure 6, are free from long-range cracks, as it is expected for a disorder colloidal packing. Both disordered and ordered features were also observe by Ziane et al. Ziane and Salmon (2015) in colloidal crystals growth by pervaporations in microfluidic channels.
To better quantify the particle order in the dense deposit, we computed the radial distribution function , which represents the probability to find a particle at a distance from a reference one, at several positions close to the cell edge. Typical radial distribution functions of both phases are shown in Figure 7.
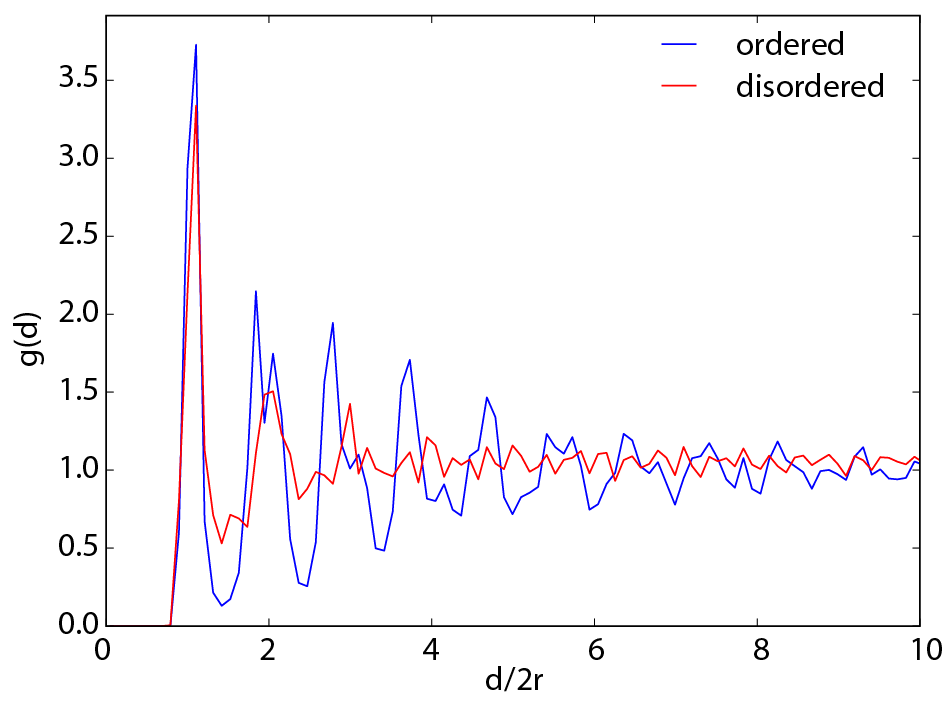
We find the confirms, for the ordered case, long-range order extending to several neighbours. The order is limited to the first two neighbours for the disordered case. The of the ordered domain strengthens the thesis of readily made hexagonal 2-dimensional lattice (made of several grains), whereas the for the disordered domain is the expected for a randomly packed structure. From these results we cannot infer the actual numerical value of the particle density that is a measure of the three-dimensional packing.
We have shown that directional drying causes the formation of hexagonally ordered domains, and large, dense, and disordered domains. The presence of these two different organizations implies that at least two different mechanisms cause the ordered/disordered arrangements. We hypothesize that the particle collision velocity at the solid/liquid interface is the origin of the mechanism of ordering.
III.3 Dynamic study of the formation of the dense deposit
The rapid imaging mode of the microscope allows us to individually follow the trajectory of particles during the formation of the dense deposit. From the trajectories we measure individual particles velocities so that we may identify the ordering mechanism during the formation of the dense deposit. was measured with the particle tracking package TrackPy, Dan Allan et al. (2014) which detects the particles, track their position, and compute their velocity. Particles are tracked from about m from the interface until they reach the interface. As particles are weakly-Brownian, their velocity directly results from the velocity of the water flow towards the interface. There are therefore little variations in their velocity as the interface is approached.
In the same series of images, we can also determine the interface velocity of the packed/dilute interface. is computed by measuring the interface position in each sequence of images. The results of V versus are shown in Figure 8 for the ordered domains (colloidal crystal) and in Figure 9 for the disordered domains. Each point drawn in these two figures is represented by at least hundreds of tracked particles: in particular each red point is represented by a population of thousands of particles.
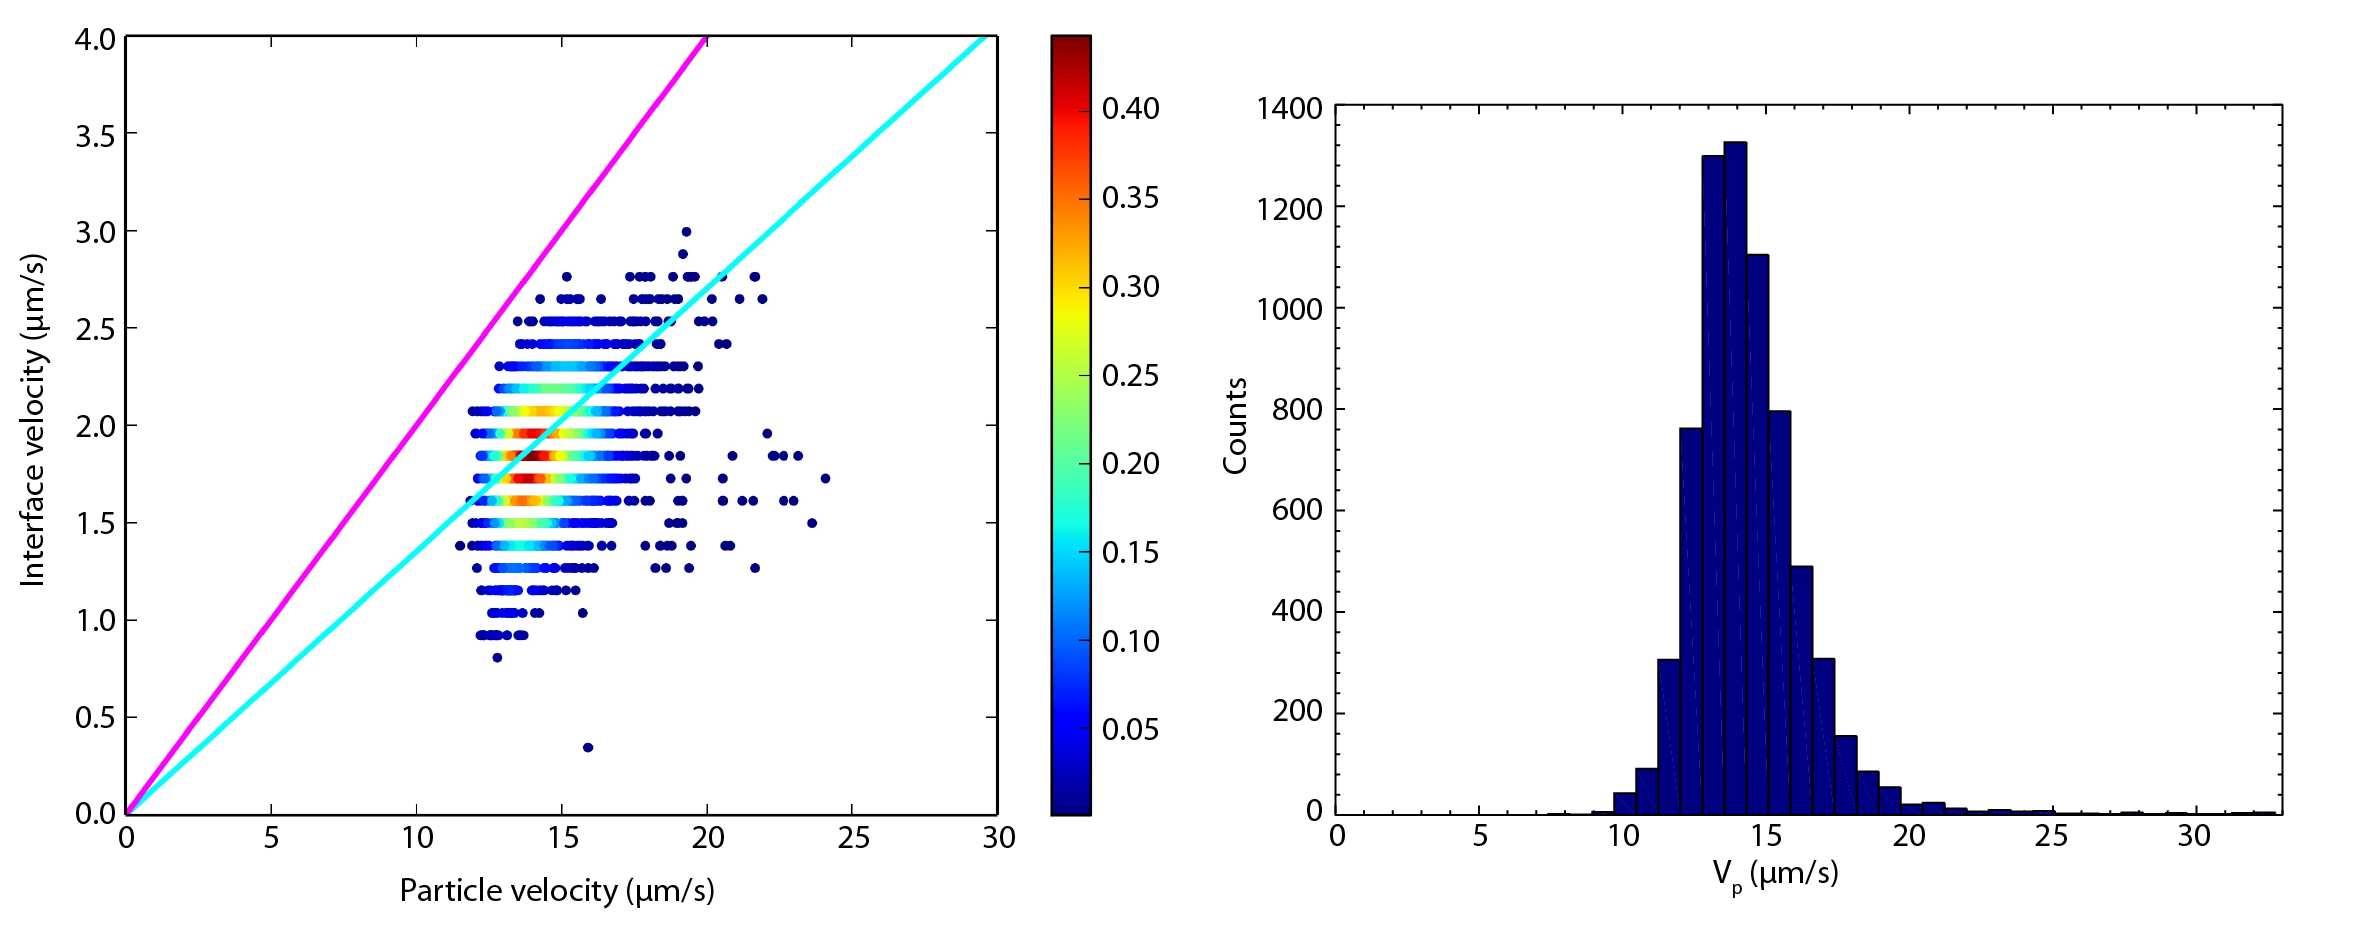
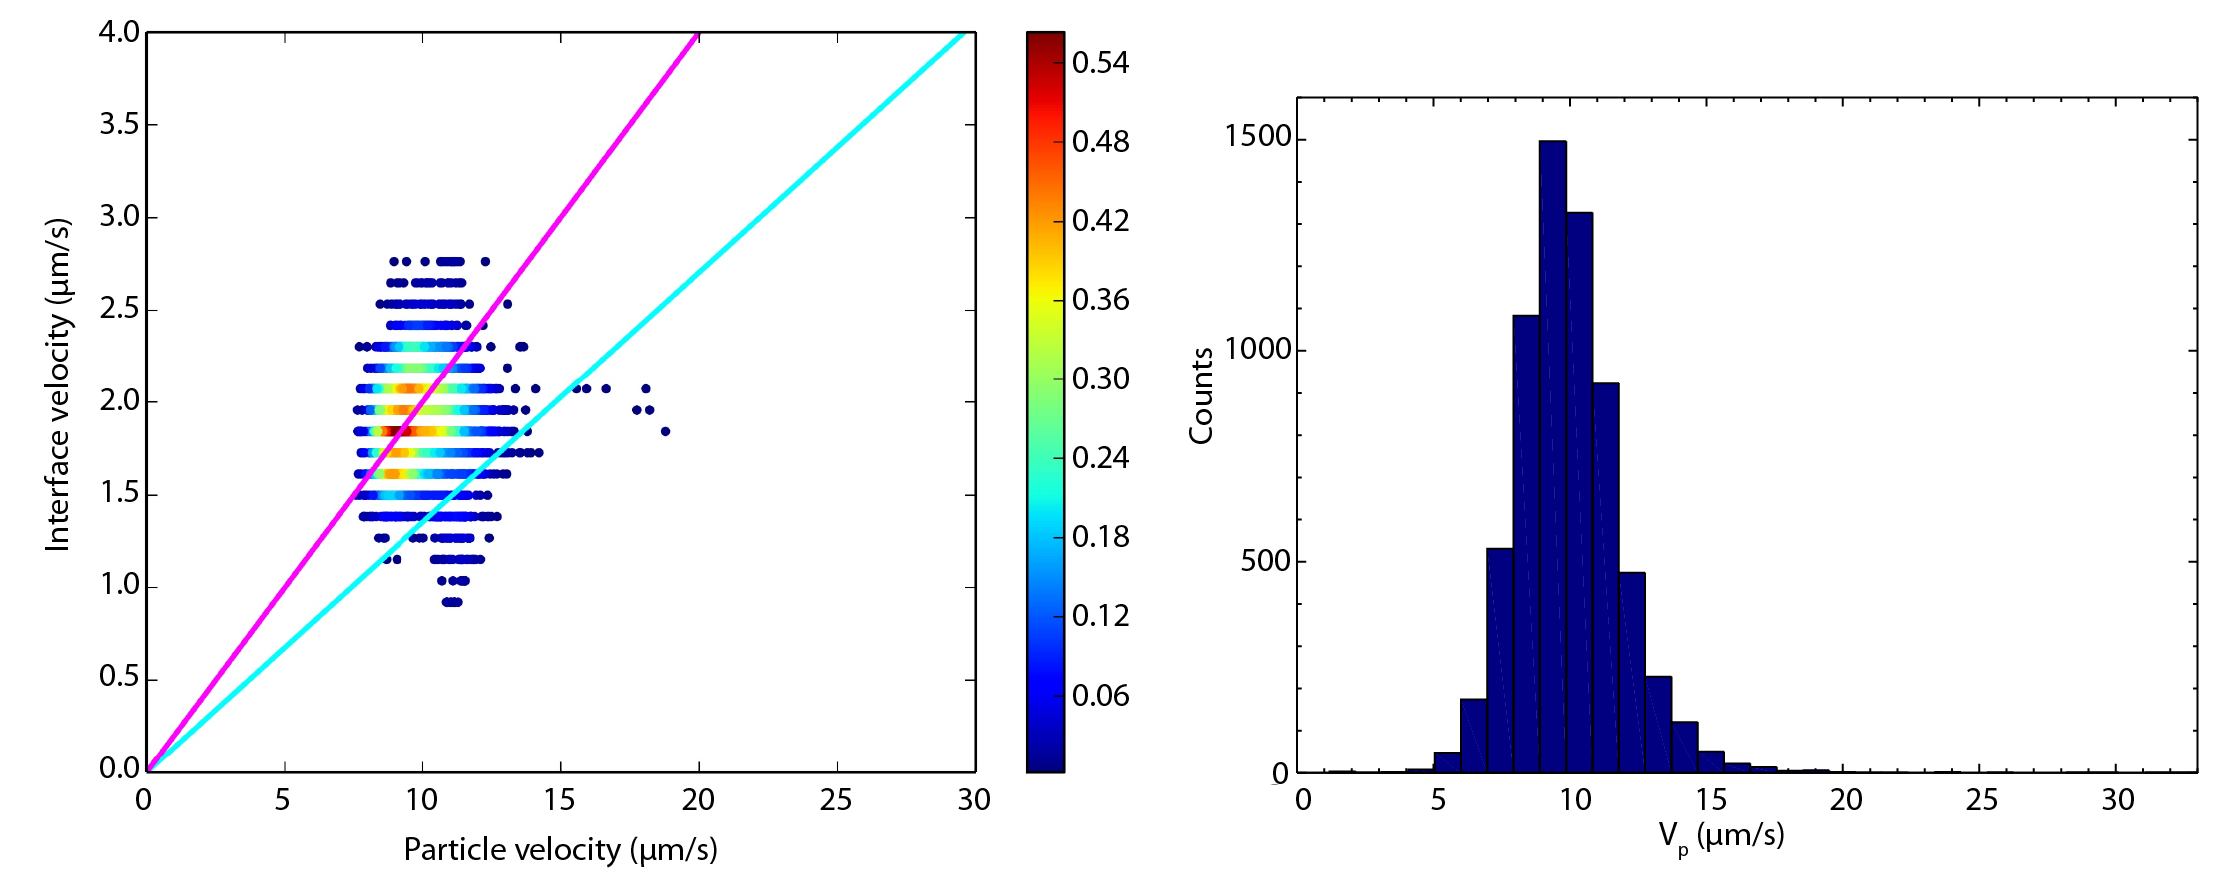
We measured an average m/s for the ordered packing and similarly m/s for the disordered domains. In Figures 8 and 9 we represented the distributions of that were used to build the versus . We can observe that the distribution are clearly non-gaussian. The interface velocity is accidentally the same (m/s) for the two types of ordering.
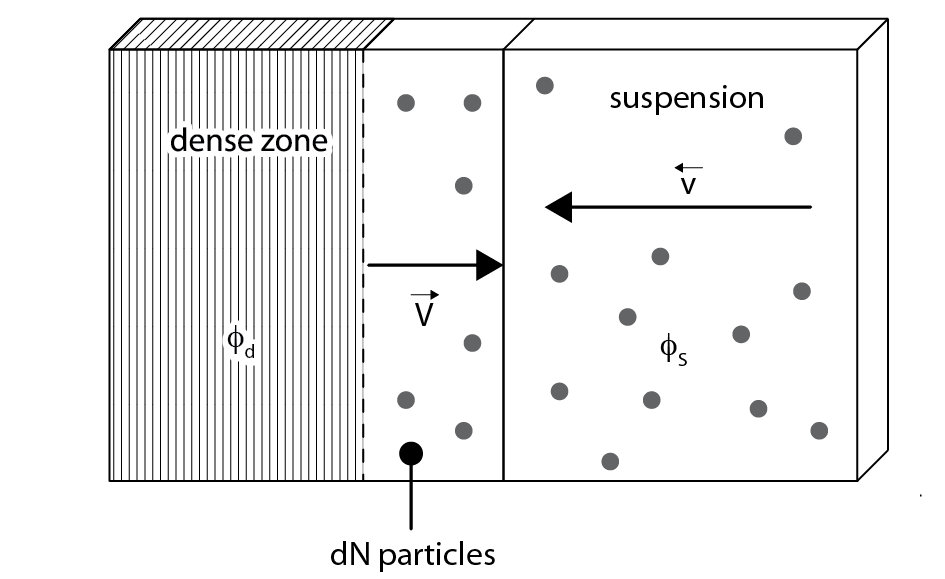
To assess a possible correlation between the , , and order/disorder we propose a simple mass-conservation model, schematically represented in Figure 10.
We suppose that the number d of particles in the newly formed region of the dense deposit during the time d is equal to the number of particles arriving from the suspension at the same time, that is:
| (1) |
where and are respectively the volume fraction of particles in the dense deposit and in the suspension, and is the cross-section of the cell, see Figure 10.
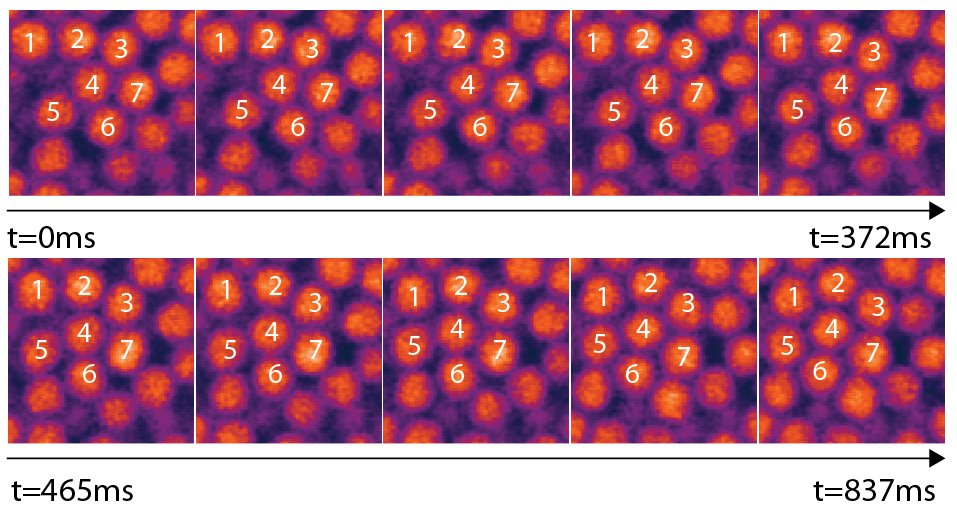
Using our model with in the suspension and characteristic of a dense crystalline structure, we have drawn the continuous blue lines in Figures 8 and 9. Although we cannot really determine the real three-dimensional structure of the dense deposit (unless by breaking the dry sample to image the transversal section), the 2D-image clearly shows the characteristic pattern of a two-dimensional hcp or fcc organization, both of which have the same particle density . The prediction of the model (blue line) crosses the largest fraction of data points (red area) of Figure 8. At the spatial length scale of Figure 11 (one hundred of particles per horizontal line) and time-scale, we observe that the particles, once they have reached the densification front, freeze at the contact point and do not locally reorganize or move. This remarkable coincidence might imply that this region forms instantaneously (within a time interval between two frames, which is 0.05 s) as a dense crystalline lattice and it does not become packed afterwards. The precise crystalline nature of the dense packing in 3D is still to identify.
We draw the pink lines in Figure 9 such that it crosses the area with the largest fraction of points (red areas). Within our model, the volume fraction measured by this qualitative approach is . This value approaches the onset of glassy behaviour (). We note that the phase diagram for hard-sphere particles is quite complex with crystal/liquid coexistance starting at a volume fraction of 0.494 Schöpe et al. (2007) continuing to 0.545, and then from 0.545 to 0.74 being crystalline. Additionally, the glass transition occurs at 0.58 and continues to 0.64 which is generally accepted as randomly close packed. To simplify the phase identification in our visual observations, we will consider a phase diagram consisting of either glass or hexagonal lattice. For clarity, the same pink line is replicated in Figure 8. The difference between the measured particle fraction and the onset of glassy behaviour might be due to a different ordering induced by the glass wall. We note in Figure 6 an unfocused bottom layer of particles that allow us to confirm the three-dimensionality of the lattice. However, due to the dense packing, the imaging depth is limited to two layers of particles and we are unable to investigate the particle organization within the bulk volume.
The correlation between particles velocities and order is a counter-intuitive observation after the work of Marín et al. Marín et al. (2011) about the drying of water-based suspensions in sessile drops (particle radius in the range of m). The authors elegantly showed that ordering (hcp or bcc/fcc colloidal lattice) is caused by particles slowly colliding with the solid/liquid interface. These colloidal particles, due to their Brownian motion, can rearrange into an ordered structures. The colloidal particles that arrive rapidly hamper the rearrangement of the neighbours because they quickly form aggregates.
A phenomenon similar to what we observe has been recently described by Piroird et al. Piroird et al. (2016) The authors’ explanation on how order takes place while drying colloidal silica nanospheres (12 nm radius) in controlled atmosphere, is based on the rate of evaporation of the solvent. For small evaporation rate, particles aggregates form in the suspension that can not order as they reach the interface. During fast drying, the particles have no time to form intermediate aggregates, and impinging singularly onto the solid/liquid interface, they can order in closely packed structures. In our conditions, we never observed any particles aggregation.
We observe that these two reports are apparently in contradiction and predict that particles size is one of the key conditions to observe ordered/disordered particles arrangements in drying experiments. Despite the similarities between the reported works and ours, we reiterate that our samples are unidirectionally dried in a confined Hele-Shaw cell with a single open-end. We believe that the formation of quasi-organized structures is more likely due to the energy necessary to reorganize the particles as they arrive at the interface.
The counter intuitive result that we observe is related to particles that are only weakly Brownian. The Peclet number , which is the ratio of diffusion time to hydrodynamic time, (m , radius of the colloidal sphere, the water viscosity) is 51 and 79 for equal to 9 and 14 m/s respectively. In our system, the particles do not have time to explore configurations by diffusion as they reach the dense deposit. Their motion is controlled by the hydrodynamic flow which drags them to the open end because of the solvent evaporation.
The flow of water through the packed particle deposit generates a pressure gradient that can be estimated using Darcy’s law and Kozeny-Carman’s equation:
| (2) |
where is the length of the deposit, the particle volume fraction, the viscosity, the ratio of surface to volume of the particles for ideal spheres, and a constant whose value is generally 5. Inasawa et al. (2016) This equation shows that a higher velocity leads to a higher pressure gradient and consequently to a higher packing of the particles. It was confirmed experimentally by Inasawa et al. Inasawa et al. (2016) that higher impinging velocities lead to higher volume fraction in the deposit in unidirectional packing. Moreover the pressure acting on the particles may help to overcome the electrostatic repulsions between the particles, leading to short range attraction between the particles. Consequently the authors observe a saturation of the volume fraction in the deposit around corresponding to a disordered deposit as attractive particles cannot rearrange as they reach the deposit.
In our case, we find experimentally and m/s in the ordered domains while for the disordered domains and m/s . Taking these two sets of values and m, we find kPa for the ordered domains and kPa for the disordered domains. The stress pushing on each particle is of the order of 120 nN for the ordered domains and 5 nN for the disordered domains. We then calculate the DLVO potential taking into account the Van der Waals attraction and electrostatic repulsion. We find that the DLVO barrier is of the order of 12 nN. Therefore the Darcy’s stress is sufficient to overcome this barrier in the case of the ordered domains but not for the disordered domains. Consistently, very little particle reorganization occurs in the dense region after its formation (Figure 11) while we show in Figure 12 that once the particles are embedded in the disordered zone they can undergo some Brownian motion but this local motion is insufficient to result in disordered domains rearranging into ordered ones. Water still flows directionally through the dense region, which limits the free movement of the particles and drags them.
The disordered to ordered settlement transition as the particle velocities increase is similar to what has been observed in the formation of crystals with non-colloidal particles. In these cases, an external source of energy, for example ultrasound or mechanical agitation, is necessary to organize grains in a crystal form. Pouliquen et al. (1997); Lash et al. (2015) Likewise, the pressure gradient on the particles due to the solvent flow toward the open side of the cell can then be considered as the source of energy necessary to induce particle organization.
IV Conclusions
The drying of particle suspensions is a complex phenomenon where evaporation rate, difference in chemical potential of solvent and environment, and size of colloidal particles play interconnected roles. From our observations we find that confined drying by directional flow behaves differently to drying of colloidal suspension of sessile drop.
By tracking in-situ and in real time the evaporation-induced motion of weakly-Brownian particles close to the open end of a Hele-Shaw cell, we found that the structure of the solid deposit is controlled by the velocity of the particles impinging on the pinned dense zone. In our actual ambient and experimental conditions, we found two particle velocity regimes that allow us to define a particle velocity threshold, only valid for the current experiment. Particles form disordered domains without aggregation on their way to the dense deposit when travelling below this threshold (slow regime). Ordered domains, for which we cannot infer the actual three-dimensional crystalline nature, are formed when the particle velocities are above this threshold (fast velocity branch). Albeit we defined this kinetic threshold about m/s, we cannot rule out if other factors contribute to the order/disorder organization. It should be stressed that the velocity of the solid/liquid interface does not significantly change for ordered or disordered accretion. A better control of both the evaporation rate in constrained experimental conditions and the Hele-Shaw cell will give a strong impulse to understand the mechanism of densification by drying of colloidal suspensions with strong benefit in material processing routes.
Acknowledgements.
The authors acknowledge F. Gobeaux (IRAMIS/NIMBE/LIONS, CEA Saclay) for zeta potential measurements.Funding
The research leading to these results has received funding from the European Research Council under the European Community’s Seventh Framework Programme (FP7/2007-2013) Grant Agreement no. 278004 (project FreeCo).
References
- Benson and Albrecht (2001) C. H. Benson and B. A. Albrecht, Journal of Geotechnical and Geoenvironmental Engineering 127, 67 (2001).
- Sadek et al. (2014) C. Sadek, H. Li, P. Schuck, Y. Fallourd, N. Pradeau, C. L. Floch-Fouéré, and R. Jeantet, Drying Technology 32, 1540 (2014).
- van der Kooij and Sprakel (2015) H. M. van der Kooij and J. Sprakel, Soft Matter 11, 6353 (2015).
- Goehring et al. (2017) L. Goehring, J. Li, and P.-C. Kiatkirakajorn, Philos Transact A Math Phys Eng Sci 375 (2017).
- Scherer (1990) G. W. Scherer, Journal of the American Ceramic Society 73, 3 (1990).
- Blanco et al. (2000) A. Blanco, E. Chomski, S. Grabtchak, M. Ibisate, S. John, S. W. Leonard, C. Lopez, F. Meseguer, H. Miguez, J. P. Mondia, G. A. Ozin, O. Toader, and H. M. van Driel, Nature 405, 437 (2000).
- Vlasov et al. (2000) Y. A. Vlasov, V. N. Astratov, A. V. Baryshev, A. A. Kaplyanskii, O. Z. Karimov, and M. F. Limonov, Phys. Rev. E 61, 5784 (2000).
- Allain and Limat (1995) C. Allain and L. Limat, Phys. Rev. Lett. 74, 2981 (1995).
- Lidon and Salmon (2014) P. Lidon and J.-B. Salmon, Soft Matter 10, 4151 (2014).
- Loussert et al. (2016) C. Loussert, A. Bouchaudy, and J.-B. Salmon, Phys. Rev. Fluids 1, 084201 (2016).
- Deegan et al. (1997) R. D. Deegan, O. Bakajin, T. F. Dupont, G. Huber, S. R. Nagel, and T. A. Witten, Nature 389, 827 (1997).
- Deegan (2000) R. D. Deegan, Phys. Rev. E 61, 475 (2000).
- Routh (2013) A. F. Routh, Reports on Progress in Physics 76, 046603 (2013).
- Ziane and Salmon (2015) N. Ziane and J.-B. Salmon, Langmuir 31, 7943 (2015).
- Ziane et al. (2015) N. Ziane, M. Guirardel, J. Leng, and J.-B. Salmon, Soft Matter 11, 3637 (2015).
- Laval et al. (2016) C. Laval, A. Bouchaudy, and J.-B. Salmon, Lab Chip 16, 1234 (2016).
- Marín et al. (2011) A. G. Marín, H. Gelderblom, D. Lohse, and J. H. Snoeijer, Physical Review Letters 107, 085502 (2011).
- Piroird et al. (2016) K. Piroird, V. Lazarus, G. Gauthier, A. Lesaine, D. Bonamy, and C. L. Rountree, EPL (Europhysics Letters) 113, 38002 (2016).
- Askounis et al. (2013) A. Askounis, K. Sefiane, V. Koutsos, and M. E. R. Shanahan, Phys. Rev. E 87, 012301 (2013).
- Schöpe et al. (2006) H. J. Schöpe, G. Bryant, and W. van Megen, Phys. Rev. E 74, 060401 (2006).
- Schöpe et al. (2007) H. J. Schöpe, G. Bryant, and W. van Megen, The Journal of Chemical Physics 127, 084505 (2007).
- Divry et al. (2016) V. Divry, A. Gromer, M. Nassar, C. Lambour, D. Collin, and Y. Holl, The Journal of Physical Chemistry B 120, 6791 (2016).
- Goehring et al. (2010) L. Goehring, W. J. Clegg, and A. F. Routh, Langmuir 26, 9269 (2010).
- Bodiguel and Leng (2010) H. Bodiguel and J. Leng, Soft Matter 6, 5451 (2010).
- Monteux and Lequeux (2011) C. Monteux and F. Lequeux, Langmuir 27, 2917 (2011).
- Inasawa et al. (2016) S. Inasawa, Y. Oshimi, and H. Kamiya, Soft Matter 12, 6851 (2016).
- Li et al. (2012) J. Li, B. Cabane, M. Sztucki, J. Gummel, and L. Goehring, Langmuir 28, 200 (2012).
- Boulogne et al. (2014) F. Boulogne, L. Pauchard, F. Giorgiutti-Dauphiné, R. Botet, R. Schweins, M. Sztucki, J. Li, B. Cabane, and L. Goehring, EPL (Europhysics Letters) 105, 38005 (2014).
- Yoshida et al. (1991) H. Yoshida, K. Ito, and N. Ise, Phys. Rev. B 44, 435 (1991).
- Kodger et al. (2015) T. E. Kodger, R. E. Guerra, and J. Sprakel, Scientific reports 5, 14635 (2015).
- Schindelin et al. (2012) J. Schindelin, I. Arganda-Carreras, E. Frise, V. Kaynig, M. Longair, T. Pietzsch, S. Preibisch, C. Rueden, S. Saalfeld, B. Schmid, J.-Y. Tinevez, D. J. White, V. Hartenstein, K. Eliceiri, P. Tomancak, and A. Cardona, Nature Methods 9, 676 (2012).
- Dan Allan et al. (2014) Dan Allan, Thomas A Caswell, Nathan Keim, François Boulogne, Rebecca W Perry, and Leonardo Uieda, (2014), 10.5281/zenodo.12255.
- Sandnes et al. (2007) B. Sandnes, H. Knudsen, K. Måløy, and E. Flekkøy, Physical Review Letters 99, 038001 (2007).
- Knudsen et al. (2008) H. A. Knudsen, B. Sandnes, E. G. Flekkøy, and K. J. Måløy, Phys. Rev. E 77, 021301 (2008).
- Sandnes et al. (2011) B. Sandnes, E. G. Flekkøy, H. A. Knudsen, K. J. Måløy, and H. See, Nature Communications 2, 288 (2011).
- Pouliquen et al. (1997) O. Pouliquen, M. Nicolas, and P. D. Weidman, Physical Review Letters 79, 3640 (1997).
- Lash et al. (2015) M. H. Lash, M. V. Fedorchak, J. J. McCarthy, and S. R. Little, Soft Matter 11, 5597 (2015).