Effect of inverse magnetic catalysis on conserved charge fluctuations in hadron resonance gas model
Abstract
The effect of inverse magnetic catalysis (IMC) has been observed on the conserved charge fluctuations and the correlations along the chemical freeze-out curve in a hadron resonance gas model. The fluctuations and the correlations have been compared with and without charge conservations. The charge conservation plays an important role in the calculation of the fluctuations at nonzero magnetic field and for the fluctuations in the strange charge at zero magnetic field. The charge conservation diminishes the correlations and , but enhances the correlation . The baryonic fluctuations (2nd order) at increases more than two times compared to at higher . The fluctuations have been compared at nonzero magnetic field along the freeze-out curve i.e along fitted parameters of the chemical freeze-out temperature and chemical potentials, with the fluctuations at nonzero magnetic field along the freeze-out curve with the IMC effect, and the results are very different with the IMC effect. This is clearly seen in the products of different moments and of net-kaon distribution.
pacs:
25.75.-q, 12.38.MhI INTRODUCTION
The ultimate goal of ultra relativistic heavy ion collisions is to study the phase structure of a strongly interacting system in QCD at finite temperature and finite baryon chemical potential . Lattice QCD shows a crossover from the confined phase to the quark gluon plasma (QGP) phase at high temperature and low baryon chemical potential aoki . However, the system exhibits a first order phase transition from the confined phase to the QGP phase at low temperature and high baryon chemical potential yazaki ; ejiri . It is believed that there exists a QCD critical point when the first order transition line ends and this is a very challenging task to find the critical point in lattice QCD as well as from the experimental results on fluctuations of conserved quantities.
The basic features of the physical system created at the time of chemical freeze-out in heavy ion collisions are well described in terms of the hadron resonance gas (HRG) model munzi1 ; munzi2 . There is an excellent agreement between experimental data on particle ratios in heavy ion collisions with corresponding thermal abundances calculated in the HRG model at appropriately chosen temperature and baryon chemical potential with different conserved charges taken into account munzi3 . The universal chemical freeze-out curve in the plane is determined by the condition 1 GeV, where is the internal energy (density) and is the particle number (density) cleymans . It has been already proposed that event-by-event fluctuations of conserved quantities such as net baryon number, net electric charge, and net strangeness as a possible signal of the QGP formation and quark-hadron phase transition asakawa ; koch . The fluctuations in net electric charge are suppressed in the QGP phase compared to the hadronic gas phase due to the fractional charge carriers in the QGP phase compared to unit charge carriers in the hadronic gas phase. The fluctuations originated in the QGP phase may survive until the freeze-out due to the rapid expansion of the fireball and can be exploited as a signal of the QGP formation in the early stages of the relativistic heavy ion collisions asakawa ; koch .
Moreover, higher order moments of conserved charge fluctuations are more sensitive to the large correlation lengths in the QGP phase and relax slowly to their equilibrium values at the freeze-out stephanov . The divergence of correlation length or higher order fluctuations will hint towards the existence of a critical point in QCD phase diagram. So, higher moments, different ratios and skewness and kurtosis of conserved charges have been measured experimentally and compared with the HRG model predictions along the freeze-out curve redlich . The deviation of experimental results from the HRG model predictions may conclude the presence of non hadronic constituents or non thermal physics in the primordial medium alice1 . Ratios of susceptibilities in lattice QCD have been shown to be consistent with the HRG model predictions near zero chemical potential gavai ; cheng .
However, it is very important to study these fluctuations in the presence of magnetic field because of the huge magnetic field produced in non central relativistic heavy ions collision due to the valence charges of colliding nuclei skokov . The study of chiral magnetic effect (CME) also has drawn a lot of attention in heavy ion community due to the presence of the huge magnetic field in the QGP phase fuku3 . One would expect electric charge separation with respect to the reaction plane due to CME. This magnetic field decreases with the time given by , where is the maximum magnetic field produced and varies as kharzeev ; fuku . Here b is the impact parameter, Z is the atomic number of nuclei and the beam rapidity is approximated as . As the center of mass collision energy increases, the initial value of the magnetic field increases and becomes Gauss for LHC energies. The life time parameter decreases with increasing energy as . So, the magnetic field decreases with time as and the effect of this magnetic field may not play an important role on the fluctuation of conserved charges along the freeze-out curve. However, it has been shown that magnetic fields of similar magnitude, as the maximum value of the field can arise from induced currents due to rapidly decreasing external field and may sustain for longer time tuchin . The effect of magnetic field on the conserved charge fluctuations have been studied in the HRG model along the universal freeze-out curve and compared with the available experimental data rajarshi .
However, it has been shown that the IMC effect arises in the presence of an external magnetic field in lattice QCD, in which the chiral transition temperature decreases bali1 . But the system exhibits magnetic catalysis at zero temperature where the chiral condensate increases in an external magnetic field. The IMC effect might be due to the decrease in interaction strength in the presence of the magnetic field gatto . This decrease of interaction strength is consistent with asymptotic freedom of QCD if the relevant scale mian ; pawl . Since the chiral transition temperature decreases in the presence of the magnetic field, the freeze-out curve in the plane will correspond to a lower temperature fuku2 in the HRG model. It has been shown that electric charge conservation and strangeness conservation play an important role at higher baryon chemical potential in nonzero magnetic field. Electric charge susceptibility along the freeze-out curve is very large without charge conservation at higher , but it decreases significantly when the charge conservation is taken into account fuku2 . So, it is very important to consider electric charge conservation and strangeness conservation at higher in the presence of the magnetic field.
In this work, one considers the IMC effect to lower the freeze-out temperature in HRG model in the presence of the external magnetic field. Then fluctuations and correlations are measured at that temperature with and without charge conservation at nonzero magnetic field.
This paper is organized as follows. The essential aspects of the HRG model have been discussed in the presence of external magnetic field in section II. Section III describes the different universal freeze-out conditions. Section IV describes the conserved charge densities and the fluctuations along the freeze-out curve. I also discuss beam energy dependence of the products of moments along the freeze-out curve and compare it with the available STAR data. Then the conclusions have been presented in Section V.
II HRG MODEL IN THE PRESENCE OF THE MAGNETIC FIELD
The HRG model in the presence of the magnetic field has been studied and the thermodynamic quantities like the pressure, the energy density, the entropy density, the magnetization and the speed of sound are presented as functions of the temperature and the magnetic field endrodi . The basic quantity in the HRG model is the grand partition function defined for each hadron species i as
| (1) |
Here corresponds to fermions and bosons respectively. Here V is the volume of the system, is the spin degeneracy factor, is the single particle energy and is the chemical potential. Here , and are the baryon number, the strange and the electric charge of the particle and , and are the corresponding chemical potentials. The strangeness and the electric charge chemical potentials have been introduced to implement the conservation laws of strangeness and electric charge for the entire system. and have finite value to obtain total strangeness and . I have incorporated all the hadrons listed in the particle data book upto mass 3 GeV pdg2012 . All the thermodynamic quantities like the pressure, the energy density and the entropy density etc. can be derived from this partition function.
For a constant magnetic field along the Z-axis, the well known phenomena of Landau quantization of energy levels for a charged particle takes place along the plane perpendicular to the magnetic field landau . The single particle energy for a charged particle in the presence of the magnetic field is given by . Here n is the Landau level and is the z component of the spin of the hadron.
The grand partition function in the presence of magnetic field is given by
| (2) |
The vacuum part is in general divergent and it needs to be regularised and renormilised endrodi . Since one is interested in the fluctuations and the correlations at the time of freeze-out, one can safely ignore the vacuum part.
III UNIVERSAL FREEZE-OUT CURVE
Certain properties of the thermal fireball are same at the chemical freeze-out at all collision energies. These common properties provide the unified chemical freeze-out conditions in heavy ion collisions. The first unified condition for the chemical freeze-out is given by 1 GeV. This makes sense because the freeze-out occurs when the average energy per particle crosses 1 GeV for the non-relativistic particles. The second condition for the unified chemical freeze-out is given by a fixed value for the sum of baryon and anti-baryon densities i,e stachel and the third unified chemical freeze-out is given by a fixed value of entropy density i.e cleyman2 .
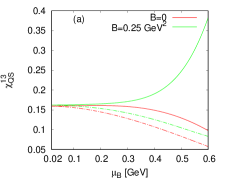
The magnetic field produced in the relativistic heavy ion collisions at LHC energies can reach of the order of 0.25 . Keeping this in mind, I have shown the effect of the inverse magnetic catalysis on the freeze-out curve in the HRG model at in Fig.1. I have compared the freeze-out curve determined by the condition 1 GeV for zero and nonzero magnetic field with charge conservation and without charge conservation in Fig.1a. A similar plot is already shown in fuku2 , since this is an important part of the analysis presented here, Fig.1a has been shown for completeness. The solid line in Fig.1a represents the freeze-out curve without charge conservation and the dashed line represents the freeze-out curve with charge conservation. One can clearly see the freeze-out temperature is lowered at nonzero B due to the effect of the inverse magnetic catalysis with charge conservation. However, the freeze-out temperature at nonzero B increases at higher without charge conservation. This is due to the fact that at higher there are more baryons, particularly more protons at nonzero B. If there is no charge conservation, then number density increases due to more protons produced at nonzero B. So, the freeze-out curve determined by the constant 1 GeV should be pushed to higher temperature fuku2 .
Fig.1b represents the freeze-out curve determined from the condition . The freeze-out temperature is lowered at nonzero magnetic field with and without charge conservation. However, the freeze-out temperature decreases sufficiently at nonzero B without charge conservation at higher . This is due to the fact that the proton density increases sufficiently at nonzero B and higher when there is no charge conservation. So, to keep fixed, the temperature will be pushed to downwards.
Fig.1c represents the freeze-out curve determined from the condition . The freeze-out temperature is also lowered at nonzero B with this freeze-out condition. However, the freeze-out temperature is very low ( ) at nonzero B without charge conservation at higher . At higher , the entropy density decreases sufficiently due to the increase in baryon density (proton density) at nonzero B. To keep the ratio fixed, temperature should decrease sufficiently. The chemical freeze-out parameters determined from the different universal conditions are almost same at zero B. But, they are very different at nonzero B at higher without charge conservation. From all these plots, it is clear that it is very important to use charge conservation at nonzero B to determine the chemical freeze-out parameters from different freeze-out condition.
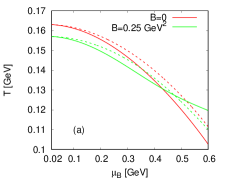
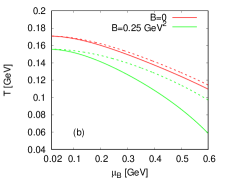
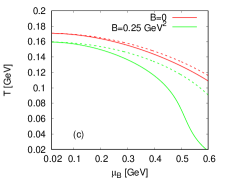
Chemical freeze-out curve determined by (a) 1 GeV, (b) and (c) with (dashed line) and without (solid line) charge conservation.
IV RESULTS AND DISCUSSION
IV.1 Quantities related to the conserved charges along the freeze-out curve
Strangeness and electric charge chemical potential along the freeze-out curve 1 GeV
Fig.2 represents and as a function along the freeze-out curve described in Fig.1a. The solid line in Fig.2 shows the variation of and the dashed line shows the variation of along the freeze-out curve. at nonzero is always larger than without magnetic field. At higher there are more baryons ( protons and neutrons) in the system. Imposing charge conservation, i.e , one needs negative . is of the order 0.1 GeV at higher at and it is of the order 0.01 GeV at zero magnetic field.
The variation of the normalized conserved net charge density with has been shown along the freeze-out curve (Fig.1a) in Fig.3. Fig.3a shows the variation of with along the freeze-out curve. The solid curve represents the normalized net electric charge density without charge conservation and the dash-dotted curve represents the normalized net electric charge density with charge conservation. At zero B and without charge conservation, for mesons . So the contribution towards the net electric charge density is exactly canceled due to the charged meson and its anti-particle. But is nonzero for baryons, so the contribution towards the net electric charge density comes from the electrically charged baryons and anti-baryons. The most dominant positive contribution comes from the lowest mass charged baryon i.e proton and negative contribution comes from anti-proton. As increases, the number density of proton (baryons) increases and the number density of anti protons (anti-baryons) decreases, so the net electric charge density increases. At zero B and with charge conservation, the contribution coming from the electrically charged meson and its anti-particle don’t cancel due to nonzero and/or . Hence there is extra contribution from mesons with charge conservation at . Also, the freeze-out temperature is higher with charge conservation compared to without charge conservation at zero B. So, the number density increases at higher temperature. So, the net electric charge density with charge conservation increases slightly compared to without charge conservation at . At nonzero B and without charge conservation, the meson and its anti-particle densities are same and hence net electric charge density due to mesons and their anti-particles is zero. However, the number density of electrically charged baryons and anti baryons increases at nonzero magnetic field and the net electric charge density is large at nonzero B compared to zero B. But, with charge conservation at nonzero B, the number density of protons decreases, hence the net electric charge density decreases. However, the net electric charge density with charge conservation is two times larger at compared to at higher .
The chemical freeze-out temperature decreases due to the IMC effect at nonzero B. However, if one assumes the freeze-out parameters at nonzero B are same as at , then one could use the fitted freeze-out parameters of , , and obtained in Eq.3 and Eq.4 as given below redlich at nonzero B.
| (3) |
where GeV, and
| (4) |
Here X is the chemical potential for the different conserved charges and the corresponding values of d and e are given in the table below.
| X | d[GeV] | e[] |
|---|---|---|
| B | 1.308(28) | 0.273(8) |
| S | 0.214 | 0.161 |
| Q | 0.0211 | 0.106 |
It is clear that the normalized electric charge density at with charge conservation (dash-dotted line with the IMC effect) is far away from the charge density obtained using the fitted fixed chemical freeze-out (CF) parameters (dotted line).
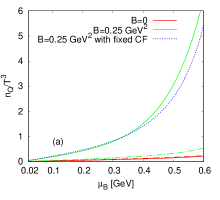
Normalized conserved net charge density along the freeze-out curve 1 GeV at , and with fixed chemical freeze-out (CF) parameters obtained at zero B (dotted line). Here the solid line corresponds to the net charge density without charge conservation and the dash-dotted line corresponds to the net charge density with charge conservation.
Fig.3b shows the variation of with along the freeze-out curve. The solid curve shows without charge conservation and the dash-dotted curve represents with charge conservation. The normalized net strange charge density is zero when the charge conservation is taken into account, i.e net for zero and nonzero B. At and without charge conservation, the contribution towards the net strange density is zero due to the strange mesons and their anti-particles. So the only strange baryons and their anti-particles contribute towards the net strange density. Here one shows the difference between anti-strange and strange particle contribution in the figure. The normalized net strange charge density is larger at nonzero B compared to zero B at higher without charge conservation. However, they are almost same at lower . This is due to the fact that the dominant contribution towards the strange density comes from particle and their anti particles which is electrically neutral and magnetic field does not affect neutral particle production. But at higher , the production of electrically charged strange baryons like and increases in the presence of the magnetic field. So, the normalized net strange charge density is larger at nonzero B compared to zero B at higher . The net strangeness density for the fitted chemical freeze-out parameters ( dotted line) at does not match with the strangeness density with charge conservation (dash-dotted line with the IMC effect).
Fig.3c shows the variation of with along the freeze-out curve. One can see at , is almost the same with and without charge conservation. However, at nonzero B, this is not the same with and without charge conservation. is always larger at nonzero B compared to zero B, because more electrically charged baryons ( particles and protons) are produced in nonzero magnetic field. The production of particles increases compared to proton in nonzero B due to higher spin 3/2 of and also higher electric charge. The net baryon density with charge conservation decreases compared to no charge conservation in nonzero B. However, the conservation law demands or in other words . As one can see, from Fig.3a and Fig.3c, this relation always holds good at any with charge conservation. I have also compared from the fitted chemical freeze-out parameters at (dotted line), but this is away from the curve at with charge conservation (dash-dotted line with the IMC effect).
IV.2 Fluctuations and correlations along the freeze-out curve
The fluctuations and the correlations are given by the diagonal and off diagonal components of susceptibility. These are defined by
| (5) |
These are important characteristics of any physical system. They provide essential information about the effective degrees of freedom and their possible quasi-particle nature. They determine the response of the system to small external forces. The fluctuations are related to the phase transitions and the fluctuations of all length scales are relevant at a critical point. The study of the fluctuations in heavy-ion collision should lead to a rich set of phenomena and is an essential tool for the experimental exploration of the QCD critical point and the first order phase transition. In relativistic heavy ion collisions, the bulk fluctuations are observed by the event-by-event analyses. Here, a given observable is measured on an event-by-event basis and the fluctuations are studied over the ensemble of the events. The fluctuations should diverge around a critical point (here finite due to finite size of the system created in heavy-ion collisions). The fluctuations of the conserved charges in heavy-ion collisions was discussed in the context of the net electric charge fluctuations asakawa ; koch . The fluctuations in the net electric charge are suppressed in the QGP phase compared to the hadronic gas phase since the quarks carry fractional electric charges. It also has been pointed out that the correlation between baryon number and strangeness is stronger in the QGP phase compared to the hadronic gas phase since the strange quarks have nonzero baryon number in the QGP phase koch2 . But, in the hadronic gas phase, this correlation decreases since strange mesons don’t carry the baryonic charge.
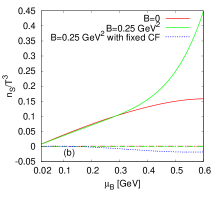
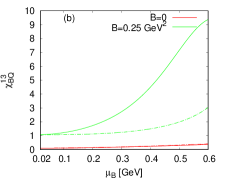
The electric charge susceptibility (2nd order) along the freeze-out curve is already shown in fuku2 . It has been shown that the electric charge susceptibility increases in nonzero B compared to zero B. Here I have presented all the fluctuations and the correlations along the freeze-out curve 1 GeV mentioned in Fig.1a. One presents the strange susceptibility and the baryon susceptibility (2nd order) along the freeze-out curve at and in Fig.4a and Fig.4b respectively. I also have compared the results from fitted chemical freeze-out parameters at .
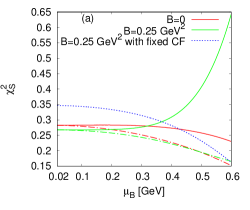
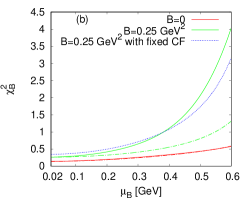
(a) and (b) along the freeze-out curve at , and with fixed chemical freeze-out (CF) parameters obtained at zero B (dotted line). Here the solid line corresponds to the charge susceptibility without charge conservation and the dash-dotted line corresponds to the charge susceptibility with charge conservation.
The most dominant contribution towards the strange susceptibility comes from the lowest mass strange particle i.e kaons. At , is large without charge conservation (solid line) compared with charge conservation (dash-dotted line) along the freeze-out curve (Fig.4a). This is also true for nonzero B. So, the charge conservation diminishes the strangeness fluctuations along the freeze-out curve for zero and nonzero B. One can see with charge conservation at nonzero B is slightly below the curve at zero B because the effective mass of kaon increases at nonzero B. at from the fitted parameters (dotted line) is very different than the results at nonzero B with charge conservation.
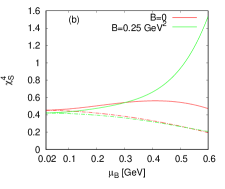
At , is almost the same with (dash-dotted line) and without charge conservation ( solid line) as shown in Fig.4b. At , the second order baryon susceptibility (the baryon fluctuations) is very large when there is no charge conservation (due to more protons production). However, when the charge conservation is taken into account, the baryon fluctuations decrease at nonzero B. at from the fitted parameters (dotted line) is very different than the results at nonzero B with the charge conservation. From above discussions, it is clear that if the freeze-out parameters at nonzero B are same as at zero B (i.e using zero B fitted parameters at nonzero B), the fluctuations in the conserved charges are different compared to the fluctuations at nonzero B with the charge conservation. So it is always important to fix the strange and the electric charge chemical potentials using the conservation laws at nonzero B, rather than using zero B fitted parameters at nonzero B. This is also true for all the higher order fluctuations. From here onwards, I will not compare the results from the fitted parameters.
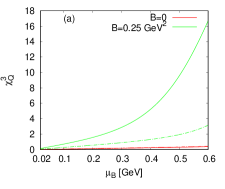
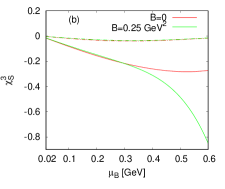
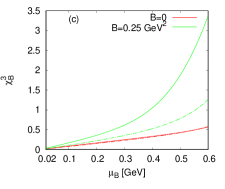
(a) , (b) and (c) along the freeze-out curve with and without B. Here the solid line corresponds to the charge susceptibility without charge conservation and the dash-dotted line corresponds to the charge susceptibility with charge conservation.
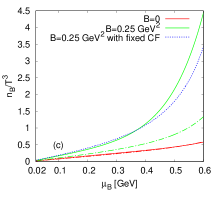
Fig.5 presents the variation of the third order susceptibilities corresponding to the conserved charges as a function of along the freeze-out curve. One can see the variation of the second and the third order susceptibilities are similar for the electric charge and the baryonic charge. However, the susceptibility (3rd order) corresponding to the strange charge change in sign. (modulus value) at zero and nonzero B decreases when the charge conservation is taken into account.
Fig.6 shows the variation of the fourth order susceptibilities corresponding to the conserved charges as a function of along the freeze-out curve. The variation of even order susceptibilities (2nd and 4th order) corresponding to the conserved charges are similar. However, the values of the 4th order susceptibility are generally larger compared to the 2nd order susceptibilities due to the larger weight for higher order. Since all baryons have baryon number 1, for zero B. At nonzero B and with charge conservation, this relation approximately holds good. However, is less than at nonzero B and without charge conservation.
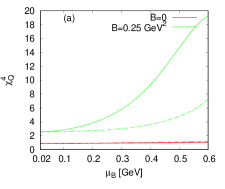
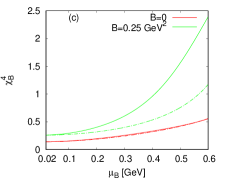
(a) , (b) and (c) along the freeze-out curve with and without B. Here the solid line corresponds to the charge susceptibility without charge conservation and the dash-dotted line corresponds to the charge susceptibility with charge conservation.
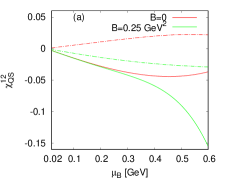
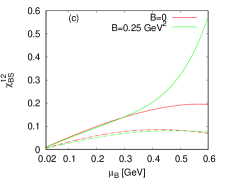
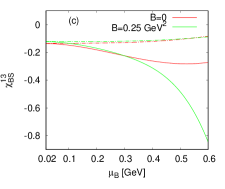
The conserved charge correlations have been shown along the freeze-out curve in Fig.7. Fig.7a presents as a function of along the freeze-out curve. The dominant contribution towards the strangeness and the electric charge correlation comes from kaons (same nature of corresponding charge). At zero B, the correlation decreases towards higher , because higher corresponds to lower freeze-out temperature and the number of kaons decreases due to decrease in temperature. The most important thing here to note that the correlation increases with charge conservation compared to no charge conservation at zero B. This is due to the fact that kaon density increases with charge conservation due to the increase in chemical freeze-out temperature compared to no charge conservation. The correlation increases at nonzero B compared to zero B due to more production of the electric charges with nonzero strangeness (kaons) in nonzero magnetic field. The correlation also increases with charge conservation at nonzero B due to the increase in chemical freeze-out temperature. At nonzero B and higher , one can see the correlation increases without charge conservation due to the increase of chemical freeze-out temperature as shown in Fig.1a.
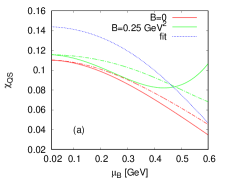
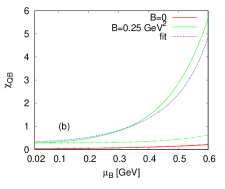
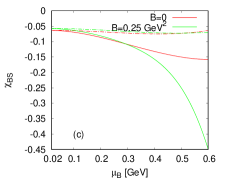
(a) , (b) and (c) along the freeze-out curve with and without B. Here the solid line corresponds to the conserved charge correlations without charge conservation and the dash-dotted line corresponds to the conserved charge correlations with charge conservation.
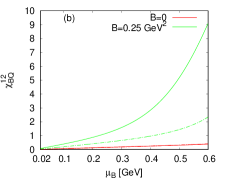
I have shown the variation as a function of along the freeze-out curve in Fig.7b. At zero B, the electric and the baryonic charge correlation is same with and without charge conservation. The correlation increases at nonzero B due to more production of protons and without charge conservation. This correlation decreases when the charge conservation is taken into account.
Fig.7c presents the variation of along the freeze-out curve. The correlation is always negative because of the opposite nature of the corresponding charges. The dominant contribution comes from baryons. The correlation (modulus value) is larger without charge conservation than with charge conservation at zero and nonzero B. This is mainly due to more baryons production with nonzero strangeness when there is no charge conservation.
(a) , (b) and (c) along the freeze-out curve with and without B. Here the solid line corresponds to the conserved charge correlations without charge conservation and the dash-dotted line corresponds to the conserved charge correlations with charge conservation.
, and along the freeze-out curve with and without B. Here the solid line corresponds to the conserved charge correlations without charge conservation and the dash-dotted line corresponds to the conserved charge correlations with charge conservation.
The higher order mixed correlations are presented in Fig.8 and Fig.9 respectively. The charge conservation always diminishes the absolute value of the correlations. The higher order mixed correlations (absolute value) are always larger compared to the lower order mixed correlations.
IV.3 Beam energy dependence of the products of moments
Different moments such as mean (M), standard deviation (), skewness (S) and kurtosis (k) of the conserved charges are measured experimentally to characterize the shape of the charge distributions. The products of moments are related to the susceptibilities by the following relation
| (6) |
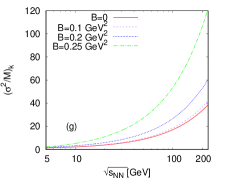
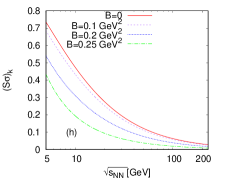
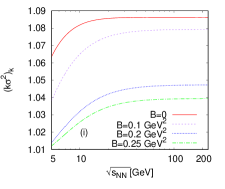
Fig.10 shows the products of different moments for net-proton, net-charge and net-kaon as a function of center of mass energy . Here the net-proton and the net-kaon acts as a proxy for the conserved charges of the net baryon and the net strangeness respectively. I also have compared the moments of the net-proton and the net charge with the available experimental data star1 ; star2 . Here, three different values of the magnetic field have been considered which is achieved at different center of mass collision energies.
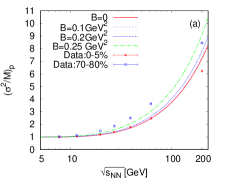
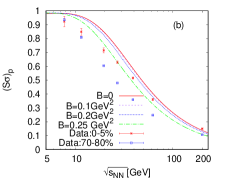
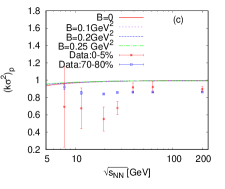
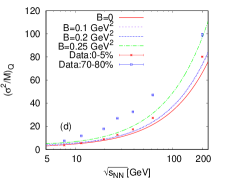
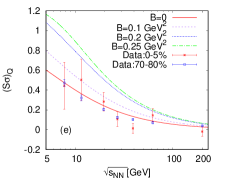
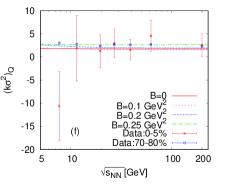
These quantities have been measured at nonzero magnetic field in rajarshi with fixed zero B freeze-out parameters. In ref.rajarshi , these quantities have been measured in HRG model at nonzero magnetic field along the freeze-out curve where the freeze-out parameters are obtained from Eq.3 and Eq.4 at zero B. Here, one can see the results are very different with the IMC effect. The parameterization used in Eq.3 and Eq.4 to convert the freeze-out chemical potential and the temperature to center of mass collision energy only exists for central collisions and zero magnetic field. Since there is no parameterization to convert to center of mass energy for nonzero magnetic field and non-central collisions, I have used the same parameterization discussed in Eq.4 to convert to the center of mass energy . However, I have used the temperature, the strange and the electric charge chemical potential corresponding to obtained with charge conservation. So, with this kind of parameterization, a one-to-one comparison with the experimental data is not expected to be perfect as the system at different centralities and magnetic fields have different temperature, chemical potential and volume.
increases with the increase in for zero and nonzero B. It increases slightly with increase in magnetic field at a particular center of mass energy. But, it decreases with magnetic field at at a particular center of mass energy with fitted freeze-out parameters rajarshi . increases with increase in magnetic field at a particular collision energy with the IMC effect. But, it decreases with the increase in magnetic field at a particular collision energy with the fitted freeze-out parameters rajarshi . is of the order 1 because net proton (net baryon) distribution is a skellam one. It does not depend on the magnetic field.
increases with respect to the center of mass energy. At a fixed energy, increases slowly with the increase in the magnetic field. This is in contrast to the results obtained from the fitted parameters where this value decreases when the magnetic field increases rajarshi . increases with the increase in the magnetic field. increases slowly with the magnetic field. I have compared these quantities with data 0-5% and 70-80% centrality class. A one to one correspondence is not possible under this study, because for this one has to calculate the amount of magnetic field produced at different center of mass energies and its centrality dependence. The magnetic field increases with center of mass collision energy, so its effect on different products of moments are usually large at large .
The most visualizing effect of the IMC appears in the net-kaon sector. increases with the increase in the magnetic field at a particular center of mass energy. However, it does not depend on the magnetic field when it is calculated from the fitted parameters rajarshi . decreases with the increase in the magnetic field. But it does not depend on the magnetic field when it is calculated from the fitted parameters rajarshi . This is because kaon being a spin zero particle, its production is not enhanced significantly at nonzero B. So, when one uses fitted parameters ( same freeze-out temperature) to calculate the ratios at different magnetic fields, the ratios are almost the same ( the ratio between two successive susceptibilities). However, when one uses the IMC effect i.e lower freeze-out temperature at nonzero B compared to zero B, these ratios become different for different magnetic field. decreases with the increase in magnetic field. This is same as the results obtained from the fitted parameters.
V CONCLUSIONS
I have studied the IMC effect on the conserved charge fluctuations and the correlations along the freeze-out curve in the HRG model. The fluctuations and the correlations have been obtained with and without charge conservation. At , the charge conservation does not play a role in the fluctuations (2nd and higher order) along the freeze-out curve for the conserved charges of electric charge and baryon number. But the charge conservation plays an important role for the strange charge at . The charge conservation diminishes the fluctuations in the strange charge at compared to the fluctuations without charge conservation. For nonzero B, the charge conservation plays a very important role. If there is no charge conservation at nonzero B, then the fluctuations increase by a huge amount compared to zero B at higher . This is because at higher , there are more protons and charged baryons production at nonzero B. The charge conservation diminishes the fluctuations along the freeze-out curve at nonzero B. I have compared these results taking zero B fitted parameters at nonzero B and this is very different from the results obtained for nonzero B with and without charge conservation.
The correlations between different conserved charges also depend whether the charge conservation is taken into account or not. The correlations also should decrease when charge conservation is taken because different charges production are restricted due to this. At , the correlation between electric charge and baryonic charge is almost the same with and without charge conservation. But this is not true for the other charge correlations like baryon and strangeness or electric charge and strangeness. The correlation (modulus value) between the baryon and the strangeness increases without charge conservation compared to charge conservation at zero B. However, the correlation between the electric charge and the strangeness decreases without charge conservation compared to charge conservation at zero B. At nonzero B, the correlation increases at higher without charge conservation. But when the charge conservation is taken into account, this decreases. The correlation between the electric charge and the strangeness decreases without charge conservation compared to charge conservation at nonzero B. However, at higher , this correlation increases at nonzero B.
I also have obtained the products of moments for net-proton, net-charge and net-kaon for three different magnetic fields and compared with the available experimental data. Here one can see the results are different from the zero B fitted parameters at nonzero B, this is clearly seen in net-kaon moments. Here one assumes hadrons as point particles, but considering finite size of hadrons as in an excluded volume model, these results will be almost invariant. This is because the freeze-out parameters are obtained from the universal freeze-out condition 1 GeV and the energy and the number of particles are extensive quantities, and the ratio is not affected by the excluded volume corrections.
Acknowledgements.
I would like to thank Ajay K Dash and Rajarshi Ray for very useful discussions and suggestions.References
- (1) Y. Aoki, G. Endrodi, Z. Fodor, S. D. Katz and K. K. Szabo, Nature, 443, 675 (2006).
- (2) M. Asakawa and K. Yazaki, Nucl. Phys. A 504, 668 (1989).
- (3) S. Ejiri, Phys. Rev. D 78, 074507 (2008).
- (4) P. Braun-Munzinger, K. Redlich, J. Stachel, nucl-th/0304013.
- (5) A. Andronic, P. Braun-Munzinger, J. Stachel, Nucl. Phys. A 772, 167 (2006).
- (6) P. Braun-Munzinger, D. Magestro, K. Redlich, J. Stachel, Phys. Lett. B 518, 41 (2001); J. Cleymans, K. Redlich, Phys. Rev. C 60, 054908 (1999); F. Becattini, et al., Phys. Rev. C 64, 024901 (2001); J. Cleymans, B. Kampfer, M. Kaneta, S. Wheaton, N. Xu, Phys. Rev. C 71, 054901 (2005); A. Andronic, P. Braun-Munzinger, J. Stachel, Phys. Lett. B 673, 14 (2009).
- (7) J. Cleymans and K. Redlich, Phys. Rev. Lett.81, 5284 (1998).
- (8) M. Asakawa, U. W. Heinz, and B. Muller, Phys. Rev. Lett. 85, 2072 (2000).
- (9) S. Jeon and V. Koch, Phys. Rev. Lett. 83, 5435 (1999).
- (10) M. A. Stephanov, Phys. Rev. Lett. 102, 032301 (2009).
- (11) F. Karsch and K. Redlich, Phys. Lett. B 695, 136 (2011).
- (12) B. Abelev, et al. [ALICE Collaboration], Phys. Rev. Lett. 110, 152301 (2013).
- (13) R.V. Gavai, S. Gupta, Phys. Lett. B 696, 459 (2011).
- (14) M. Cheng, et al., Phys. Rev. D 79, 074505 (2009).
- (15) V. Skokov, A. Illarionov, and V. Toneev, Int. J. Mod. Phys. A 24, 5925 (2009); W.-T. Deng and X.-G. Huang, Phys. Rev. C 85, 044907 (2012).
- (16) K. Fukushima, D. E. Kharzeev and H. J. Warringa, Phys. Rev. D 78, 074033 (2008).
- (17) D. E. Kharzeev and H. J.Warringa, Phys. Rev. D 80, 034028 (2009).
- (18) K. Fukushima, J. Phys. G 39, 013101 (2012).
- (19) K. Tuchin, Phys. Rev. C 88, 024911 (2013).
- (20) A. Bhattacharyya, S. K. Ghosh, R. Ray and S. Samanta, Europhys. Lett. 115, 62003 (2016).
- (21) G. Bali, F. Bruckmann, G. Endrodi, Z. Fodor, S. Katz, S. Krieg, A. Schäfer, and K. K. Szabó, J. High Energy Phys. 02, 044 (2012); G. S. Bali, F. Bruckmann, G. Endrodi, Z. Fodor, S. D. Katz, and A. Schafer, Phys. Rev. D 86, 071502 (2012); G. S. Bali, F. Bruckmann, G. Endrodi, S. D. Katz, and A. Schafer, J. High Energy Phys. 08, 177 (2014).
- (22) R. Gatto and M. Ruggieri, Lect. Notes Phys. 871, 87 (2013).
- (23) J. Braun, W. A. Mian, and S. Rechenberger, Phys. Lett. B 755, 265 (2016).
- (24) N. Mueller and J. M. Pawlowski, Phys. Rev. D 91, 116010 (2015).
- (25) K. Fukushima and Y. Hidaka, Phys. Rev. Lett. 117, 102301 (2016).
- (26) G. Endrodi, J. High Energy Phys. 04, 023 (2013).
- (27) Particle Data Group, J. Beringer et al., Phys. Rev. D 86, 010001 (2012).
- (28) L. Landau and E. Lifshits, Quantum Mechanics: Non-Relativistic Theory. Course of theoretical physics (Vol 3.) (Landau, L. D, 1908-1968). Pergamon Press, 1977.
- (29) P. Braun-Munzinger and J. Stachel, J. Phys. G: Nucl. Part. Phys. 28, 1971 (2002).
- (30) J. Cleymans, H. Oeschler, K. Redlich, and S. Wheaton, Phys. Lett. B 615, 50 (2005).
- (31) V. Koch, A. Majumder, and J. Randrup, Phys. Rev. Lett. 95, 182301 (2005).
- (32) L. Adamczyk, et al. [STAR Collaboration], Phys. Rev. Lett. 112, 032302 (2014).
- (33) L. Adamczyk, et al. [STAR Collaboration], Phys. Rev. Lett. 113, 092301 (2014).