Occurrence of LINER galaxies within the galaxy group environment
Abstract
We study the properties of a sample of 3967 LINER galaxies selected from SDSS-DR7, respect to their proximity to galaxy groups. The host galaxies of LINER have been analysed and compared with a well defined control sample of 3841 non-LINER galaxies matched in redshift, luminosity, colour, morphology, age and stellar mass content. We find no difference between LINER and control galaxies in terms of colour and age of stellar population as function of the virial mass and distance to the geometric centre of the group. However, we find that LINER are more likely to populate low density environments in spite of their morphology, which is typical of high density regions such as rich galaxy clusters. For rich (poor) galaxy groups, the occurrence of LINER is 2 times lower (higher) than the occurrence of matched, non-LINER galaxies. Moreover, LINER hosts do not seem to follow the expected morphology-density relation in groups of high virial mass. The high frequency of LINERS in low density regions could be due to the combination of a sufficiently ample gas reservoir to power the low ionization emission and/or enhanced galaxy interaction rates benefiting the gas flow toward their central regions.
keywords:
active galaxies : statistics– distribution – galaxies: general –1 Introduction
Many features present in galaxy spectra, usually characterized by the intensity of absorption or emission lines, shape of continuum, etc., can provide important information about their formation and evolution. In particular, emission lines probe the gaseous and chemical components of galaxies. The low-ionization nuclear emission-line regions (LINER) were described by (Heckman, 1980) as a class of extragalactic objects with optical spectra dominated by enhanced low-ionization OI() and NII() lines. Thus, LINER were defined by intensity ratios of optical emission lines, namely: (1) I([O II] 3727)/I([O III] 5007) 1 where [O II] 3727 is used to designate the [O II] 3726, 3729 doublet, and (2) I([O I] 6300) /I([O III] 5007) 1/3.
The nature of the ionization source that powers emission lines has not been determined. In the last three decades different scenarios for the LINER excitation mechanism have been proposed. The most feasible are: (1) ionization by shock-heated gas due to direct mechanical energy input of turbulent gas motions, jets or bubbles (Heckman, 1980; Dopita & Sutherland, 1995); (2) stellar photo-ionization by hot O stars (Filipenko & Terlevich, 1992) or by old post-asymptotic giant branch (AGB) stars (Binette et al., 1994; Stasínska et al., 2008); and (3) photo-ionization by an active central black hole (Groves et al., 2004), such as an Active Galactic Nuclei (AGN).
The first mechanism, i.e. gas heated by fast shock waves, is probably the less favoured scenario because the velocity dispersion of nuclear gas commonly falls below the value required to explain the observed level of spectral ionization (Ho, Filippenko & Sargent, 2003). However, there is further controversy related to the last two mechanisms proposed. Observations at radio (Nagar, Falcke & Wilson, 2005) and X-ray wavelengths (González-Martín et al., 2009a) provide strong support for an AGN as the origin of LINER emission. LINER seem to populate the low luminosity end of the AGN distribution (Kewley et al., 2006), where radiatively inefficient accretion flows and external obscuring matter (González-Martín et al., 2009b; Dudik, Satyapal & Marcu, 2009) may cause the optical extinction. Thus, LINER are less luminous than Seyfert galaxies and share similar spectral characteristics, with the notable exception that LINER show enhanced low-ionization OI() and NII() lines (Heckman, 1980). Furthermore, there is new evidence supporting the hypothesis of stellar photo-ionization, as some authors suggest that hot post-AGB stars and white dwarfs could provide enough ionization to explain the LINER emission (Binette et al., 1994; Sodré & Stasińska, 1999; Stasínska et al., 2008). These stellar ionization sources are located in spatially extended regions around the nucleus as the and brightness profiles do not decrease with , i.e. the radial dependency expected for a central ionization source such as an AGN (Sarzi et al., 2010; Yan & Blanton, 2012).
LINER seems to be a common phenomena and they have been found in about 30% of nearby galaxies (Heckman, 1980; Ho, Filippenko & Sargent, 1997). This percentage increases for galaxies with early type morphology, reaching 50% in elliptical passive galaxies (Phillips et al., 1986; Goudfrooij et al., 1994; Yan et al., 2006; Capetti & Baldi, 2011). This early galaxy type is consistent with that residing in dense galaxy environments. The well known morphology-age-density relation (Dressler, 1980; Domínguez, Muriel & Lambas, 2001) shows that red and massive early-type galaxies are associated to rich galaxy structures preferably located in the cores of groups or clusters of galaxies. On the other hand, late-type and blue galaxies are typically found in the outer regions of galaxy groups or in the field.
Since galaxy evolution correlates with different environmental factors, the study of the neighbourhood of LINER could provide important clues about the nature of their low ionization emission. If LINER are dominated by star-forming HII regions we would expect them to follow the morphology-density segregation (Dressler, 1980). Instead, several recent studies have found that AGN environment do not seem to follow this relation (Popesso & Biviano, 2006; Coldwell et al., 2009; Padilla, Lambas & González, 2010; Coldwell et al., 2014). Then, if the presence of an AGN is the main cause of the LINER emission we could assume that LINER will follow a similar trend that, for example, Seyfert 2 galaxies.
In addition, it is not clear that LINER constitute a homogeneous class of objects. Unlike galaxies dominated by star-forming HII regions or Seyferts, whose ionization sources are clearly identified as young massive stars and AGN, respectively, LINER can be produced by a wide array of ionization mechanisms. For example, HST observations have found that both unresolved nuclear and extended H emission are present in the majority of nearby LINER (Masegosa et al., 2011), and LINER-like ratios have long been observed in extended emission line regions (Heckman, 1989; Sarzi et al., 2010). In addition, Graves et al. (2007) found that red-sequence galaxies with LINER emission are younger than their quiescent counterparts, suggesting a connection between the star formation history and the mechanism generating the low ionization emission. But, there is no certainty about which mechanism prevails in LINER galaxies. So the true power source of LINER emission is still under debate and most observations do not have resolution high enough to detect if the this emission comes from extended or nuclear regions of the galaxies.
The aim of this paper is to study the relation between LINER objects and their local density environment in order to shed light on the origin of their main emission mechanism. The layout of this paper is as follows: in Section 2 we briefly describe the data selection and LINER classification scheme; in Section 3 we describe the properties of galaxies hosting LINER, the procedure used to construct the control sample and their correlation with galaxy group parameters. In Section 4 we investigate the occurrence of LINER in galaxy group and its dependency with group proximity. Finally, in Section 5 we discuss the results and draw our conclusions. Throughout this paper, we have assumed a -dominated cosmology, with , and .
2 Data and Sample Selection
In this paper we used galaxy samples selected from the spectroscopic Sloan Digital Sky Survey, Data Release 7 (SDSS-DR7, Abazajian et al. (2009)). The SDSS-DR7 main galaxy sample is essentially a magnitude limited catalog (Petrosian, 1976) with , consisting of galaxies with measured spectra and photometry in five optical bands (u,g,r,i,z), and with a median redshift of (Strauss et al., 2002).
The procedures to estimate the physical properties of galaxies used in this analysis are described by Brinchmann et al. (2004),Tremonti et al. (2004) and Blanton et al. (2005). This data is available from MPA/JHU111http://www.mpa-garching.mpg.de/SDSS/DR7/ and NYU222http://sdss.physics.nyu.edu/vagc/, including gas-phase metallicities, stellar masses, indicators of recent major star-bursts, current total and specific star-formation rates, emission-line fluxes and Sérsic indices among others.
2.1 LINER Selection
For the AGN selection we use the publicly available emission-line fluxes, whose measurement is detailed in Tremonti et al. (2004). Additionally, we have corrected for optical reddening using the Balmer decrement and the Calzetti et al. (2000) dust curve. We assume an and an intrinsic Balmer decrement (Osterbrock & Miller, 1989). Since the true uncertainties of the emission-line measurements were underestimated, the signal-to-noise () of every line was calculated with the flux errors adjusted as suggested by the MPA/JHU team333http://www.mpa-garching.mpg.de/SDSS/DR7/rawdata.html.
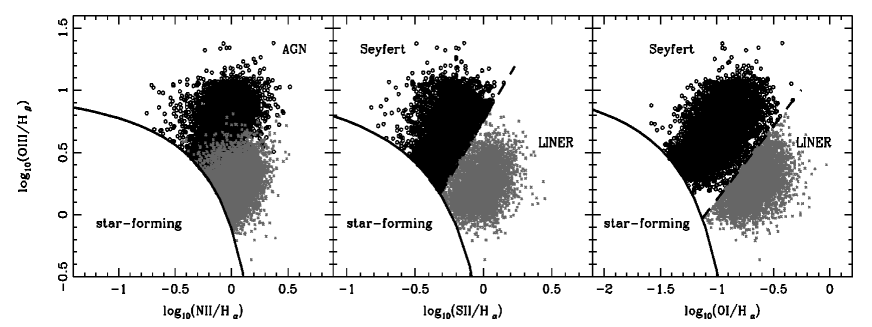
The emission-line galaxy sample was restricted to have a redshift range of . The lower limit prevents that small fixed-size apertures affect galaxy properties derived from the fibre spectra, and the upper limit corresponds to the luminosity completeness limit for the SDSS sample. Furthermore, we only include galaxies with for all the lines involved in the three diagnostic diagrams used to discriminate Seyfert 2 from star-forming and LINER galaxies. This conservative criteria only moderately reduces the effective sample size, yet assures a more reliable selection of LINER objects. Thus, from this refined sample, we separate Seyfert 2, LINER and star-forming galaxies using the three standard (Baldwin, Phillips & Terlevich, 1981, : BPT) line-ratio diagrams. The AGN/starburst separation, as suggested by Kewley et al. (2001, 2006), depends on the relative source location within BPT diagnostic diagrams, and follows the equations
| (1) |
| (2) |
| (3) |
LINER are located below the Seyfert/LINER division line as indicated by equations
| (4) |
| (5) |
On the grounds of internal consistency, we exclude from analysis ambiguous galaxies classified as one type of object in one BPT and another in the remaining two diagrams. Bearing this in mind, we obtain an effective sample of 4778 LINER objects. The discriminated samples and the selection criteria are shown in the three BPT diagrams of Figure 1.
2.2 Galaxy Group Catalogue
In this work we use the group catalogue constructed by Zapata et al. (2009), which were identified by an improved version of the Huchra & Geller (1982) friends-of-friends algorithm, with variable linking lengths of and . These linking lengths are taken in the direction perpendicular and parallel to the line-of-sight, respectively. The spatial scaling takes into account the variation in the space density of galaxies in a flux-limited catalogue, and is calculated from the ratio of the density of galaxies brighter than the minimum required to enter the catalogue at the mean distance of the galaxies being linked, to a characteristic survey depth. As found by Merchán & Zandivarez (2005), the algorithm parameters h-1Mpc and kms-1, are selected to produce a reasonably complete sample (95%) with low contamination ( 8%).
In addition, the virial mass of galaxy groups are computed by means of the virial theorem, given by
| (6) |
where is the line-of-sight velocity dispersion and is estimated as in Merchán & Zandivarez (2005), i.e.
| (7) |
where is the number of galaxy members and are the relative projected distances between galaxies.
3 Host galaxy properties
The morphology of a galaxy can be indicative of evolutionary processes it has been subject to, and therefore an indicate of its environment. Spiral galaxies are known to be relatively unevolved galaxies residing typically in low density environments. In the other hand, elliptical galaxies are known to be more evolved sources, as a result of dynamical processes such as mergers, and known to inhabit high density environments like galaxy groups or clusters (Toomre & Toomre, 1972; Dressler, 1997), where they are subject to different effects such as strangulation, ram-pressure and close-encounters.
The LINER host galaxies have particular characteristics which could give clues about their history. Figure 2 shows the normalized distributions of: Redshift, (Petrosian) r-band absolute magnitude (Blanton et al., 2003), extinction and k-corrected bandshifted to , using the software k-correct_v4.2 of Blanton & Roweis (2007). stellar mass in logarithmic scale, , previously determined by Kauffmann et al. (2003b) 444The method relies on spectral indicators relating to the stellar age and the fraction of stars formed in recent bursts., break index (Kauffmann & Haehnelt, 2002) Sérsic index (Sérsic, 1963), and colour ().
The break index is defined as the ratio of the average flux density in the narrow continuum bands ( and ) and is suitably correlated to the mean age of the stellar population in a galaxy and can be used to estimate the star formation rate (Brinchmann et al., 2004). The majority of star formation takes place preferentially in galaxies with low values.
The change of surface brightness with distance from the galaxy centre can be well described by the Sérsic Law, which has a the form . Here, is the intensity at the centre and the Sérsic index controls the degree of curvature of the profile. Setting recovers a de Vaucouleurs profile, i.e. a good description of giant elliptical galaxies; while setting recovers the Freeman exponential profile, which is a good description of the light distribution in disk galaxies and dwarf ellipticals. Most galaxies are well fit by Sérsic indices in the range .

Figure 2 also shows the distributions corresponding to the SDSS-DR7 main galaxy sample (within the same redshift range). The bi-modality in the distribution of and colour for the main galaxy sample is significantly noticeable. This effect is explained by the presence of two populations of galaxies in different stages of evolution: a population of young and blue galaxies, and another composed of old and red galaxies. It is expected that the mean and variance of both colour distributions are dependent of the luminosity function and stellar mass (Bernardi et al., 2003; Blanton et al., 2003b; Hogg et al., 2004) of the population considered. Moreover, Fig.2 shows that most LINER are hosted by a single population of red and old galaxies. Consistently, these LINER hosts are significantly more massive and luminous than the general galaxy sample and have a bulge-type morphology.
These characteristics of LINER are in agreement with the results of Kewley et al. (2006) and Capetti & Baldi (2011), and are consistent with very well known features of galaxy groups and cluster galaxy members (Dressler, 1980, 1984). We include in Figure 2 the distributions of SDSS-DR7 galaxy groups as constructed by Zapata et al. (2009), noting that galaxy group members show similar trends as the SDSS main sample, but with a higher percentage of red and old galaxies. This means that galaxy groups have a population of blue and young spiral galaxies, probably located in their outer regions, and another population of bright, red and bulge-type galaxies found in the centre of the systems. This is clear consequence of the morphological segregation (Domínguez, Muriel & Lambas, 2001) of galaxies in clusters.
In this scenario, LINER galaxies can be thought as galaxies lying in the central area of rich galaxy groups and clusters. However, after cross-correlating the LINER catalogue with the catalogue of galaxy groups we found that only 12.4% (592 objects) are members of galaxy groups with more than 10 members, within the redshift interval considered. Instead of that, 20.4% of LINER (974 objects) have been found to be a member of galaxy groups with a range of 4 to 9 members. This low percentage of LINER belonging to galaxy groups richer than 10 members motivates us to explore the relation between LINER properties and the group density environment.

3.1 LINER close to Galaxy Groups and Construction of a control sample
Galaxy groups are the most common structures in the universe and the connection between LINER and high density environments could provide valuable information about the mechanisms responsible of their low-ionization emission.
Considering the low occurrence rate of LINER in groups, we adopted as LINERS belonging to galaxy groups as those objects with projected distances , where is the virial radius, and radial velocity difference , with respect to the geometric centre of the group. Thus, with this more relaxed criteria than only to be a galaxy group member we are considering galaxies within the dark matter halo of the groups and, also, increasing the sample to obtain more confident statistical results. In this way finally we obtained a sample of 3967 LINER galaxies (83% of the total sample) hosted by galaxy groups with more than 4 members.
To study the true environmental dependence of LINER properties it is very important to select an appropriate control sample of galaxies without low-ionization emission lines that belong to galaxy groups and fulfils the selection criteria as mentioned before. The type of control samples have been used in a series of papers Coldwell & Lambas (2003, 2006) and Coldwell et al. (2009, 2014) to understand the behaviour of AGN with respect to non-active galaxies. In addition, by using SDSS mock galaxy catalogues built from the Millennium Simulation, Perez, Tissera & Blaizot (2009) showed that a suitable control sample for galaxies in pairs should be selected (at least) with matched distributions of redshift, morphology, stellar mass, and local density environment. This criteria is also applicable to the case of control galaxies for LINER. Thus, we construct our control sample by selecting galaxies without low-ionization emission features from SDSS with matched distributions of those five parameters.
It is important to mention that the control sample has been taken from a galaxy sample satisfying the criteria to be closer than and with respect to the galaxy group centre. Moreover, any galaxy classified as AGN or LINER has not been included in the control sample, which comprises 3841 galaxies. Figure 3 shows the normalized distribution of properties for LINER host galaxies within the dark matter halos of galaxy groups, and their respective control sample. We can appreciate that the control sample suitably reproduces the properties of LINER objects. Both samples are redder, older and more massive than the rest of the galaxies in the SDSS catalogue, and have a Sérsic index arithmetic mean of .
In addition, we analysed the fraction of both LINER and control samples which correspond to the central galaxy of groups, identified as the brightest member galaxy. We found a similar percentage of central galaxies for control () and LINER () samples. The inner box in Figure 3(b) shows that the luminosity distribution of the central galaxies in both samples is very similar. Moreover, in Figure 4 we also compare the virial mass distribution of groups close ( and ) to galaxies of our LINER and control samples. The agreement between both distributions shows that, on average, LINER and control galaxies belong to galaxy groups of similar virial mass. As we will see in Section 4, this supports the idea that the difference in their fractions (Fig. 6 and 7) could be driven mainly by the presence of low-ionization emission in LINER hosts.

3.2 Host galaxy properties: Dependency with the galaxy group proximity

The similarity between LINER and control sample properties is what enables to explore how these are related with the galaxy group parameters with the aim to detect some distinctive feature for LINER. Particularly, the galaxy colours provide an indirect constraint on the evolutionary history of galaxies since other galaxy parameters for example morphology, age, affect galaxy colours, resulting very appropriated for this study.
As in previous works (Coldwell & Lambas, 2006; Coldwell et al., 2009, 2014), we use colours and the age indicator to study the fraction of host galaxies redder than and , as a function of the galaxy group centre distance and the virial mass. These thresholds for the fractions correspond to mean values of and for the LINER and control samples (see the distributions in Figure 3). The error bars are calculated with the bootstrap error resampling technique (Barrow, Bhavsar & Sonoda, 1984).
It is possible to observe a slightly higher fraction of red and old galaxies closer to the geometric group centre, as shown in Figure 5. In addition, the trends of LINER and control samples are nearly indistinguishable. Moreover, other than a weak excess of red galaxies (still within the error bars), we do not find any significant difference with respect to the group virial mass. The conclusion is that the properties of LINER host galaxies at a given distance or virial mass do not vary respect to control non-active galaxies, so the location within the galaxy group environment does not seem to affect colours and/or ages of LINER.
4 Occurrence of LINER in galaxy groups
In this section we explore the probability to find LINER respect to the control sample and the dependence with galaxy groups properties such as the virial mass, (as derived from the virial theorem using the virial radius and velocity dispersion of group members). We also considered the group luminosity, , calculated by adding the r-band luminosities of the 4 brightest galaxy members in each group. This quantity, , is a better proxy for the true underlying group mass than the virial estimate (Eke et al., 2004; Padilla et al., 2004). In this way, we have considered two independent estimates of the group richness for this analysis.
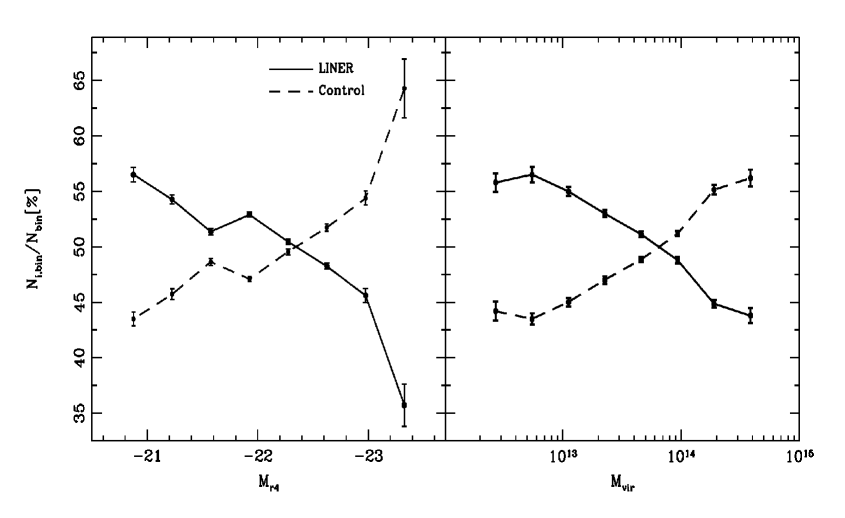
Figure 6 shows the fraction of both samples with respect to the total number of objects for a given bin of virial mass in logarithmic scale and group luminosity. We observe that the fraction of LINER drops with the group virial mass and luminosity, while the fraction of control galaxies increases with these parameters. Precisely for control sample, this is expected due to the morphology-density relation and the sample distributions shown in Figure 3. Yet somewhat surprisingly, the relation for LINER galaxies is in fact the opposite, even when their hosts galaxies are matched to the control sample.
This tendency is more significant in the left panel of Figure 6, where the fraction of galaxies in the brightest groups in the control sample is approximately 2 times the LINER fraction. At low luminosities, the effect is is reversed as the proportion of LINER reaches its maximum value (56%) and the difference respect to control falls to 13%. A comparable trend is observed in the right panel of Fig. 6, with respect to , although the excess of control galaxies respect to LINER at higher values of is somewhat lower than that shown for the group luminosity, . These results indicate that LINER galaxies have a preference to populate low mass, low luminosity environments formed by a higher proportion of blue galaxies with high gas content.
Bearing in mind the fact that several authors have found that the association between active galaxies and environment do not agree with the expected morphology-density relation (Popesso & Biviano, 2006; Coldwell et al., 2009; Padilla, Lambas & González, 2010; Coldwell et al., 2014), these results suggest that the accretion of material inside the black hole should not be neglected as the main mechanism responsible of the low-ionization emission.
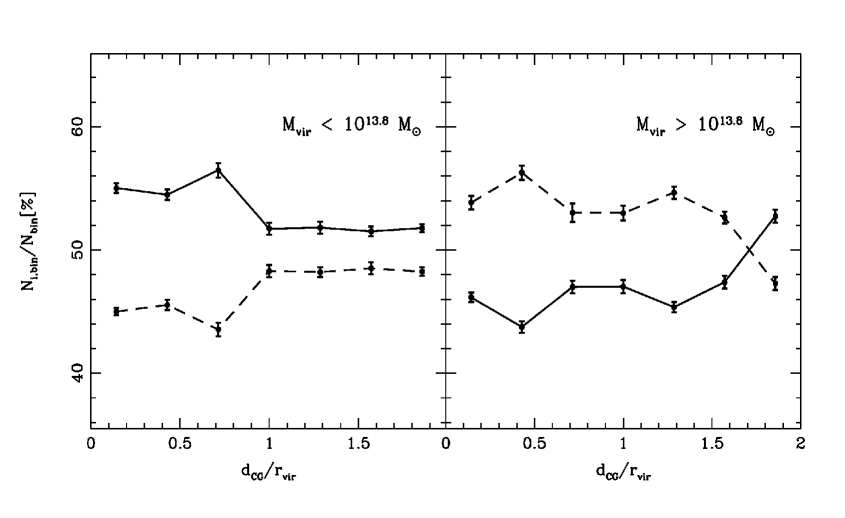
Additionally, it is useful to perform this analysis by discriminating groups with a group mass indicator. Figure 7 shows the fraction of LINER and control galaxies as a function of the distance to the galaxy group centre, normalized to the virial radius, , for rich groups () and for poor groups (). In poor groups we observe a higher fraction of LINER respect to the control sample, which is not unexpected given Figure 6. This effect is almost independent of scale with only a weak increase in the fraction of LINER galaxies toward the inner regions of poor galaxy groups. In rich groups, we find that the fraction of LINER increases significantly toward the outer limits of these systems and that the fraction of LINER objects is lower that in control galaxies. Therefore, this reinforces the hypothesis suggested, that LINER galaxies prefer to populate low density environments, where the probability of major mergers rises due to low galaxy velocity dispersions favouring this type of interactions. This seems to be in agreement with previous results for AGN found in the literature (Popesso & Biviano, 2006; Alonso et al., 2007; Coldwell et al., 2009).
5 Discussion
From SDSS-DR7 data we derived a large LINER catalogue at redshifts . As only a small fraction of LINER are hosted in groups of galaxies, we adopted LINER objects with and as belonging to galaxy groups. In this way, our effective LINER sample comprises 3967 objects, distributed in 2879 groups. The mean number of LINER per group is . In order to uncover the true environmental dependence of the characteristics of galaxies hosting LINER and get a hint on the process responsible for generating low-ionization emission lines, we constructed a control sample of non-active galaxies matched in redshift, luminosity, age, stellar mass, morphology and colour. We also verified that : (1) the percentage of LINER and control galaxies corresponding to the central members of groups is quite similar between both samples; (2) galaxy groups nearby both samples have similar virial masses.
Following previous work, we have explored how host properties depend on mass and the proximity to galaxy groups. We have calculated the fraction of red () and old () galaxies respect to the normalized projected distance, , to the geometric group centre, and to the virial mass, . We find no significant difference in the tendencies of LINER and control samples. Therefore, the properties of hosts in both samples do not seem to vary respect to the location or mass of the galaxy groups.
In addition, we have carried out a detailed analysis the LINER occurrence within galaxy group halos and quantified the colour and age dependency with respect to representative galaxy group parameters such as radius, virial mass and group luminosity. We study the fraction of LINER with respect to two independent parameters representative of the galaxy group mass ( and ). The results show a strong difference between LINER and control galaxies. While the latter fraction increases for rich groups, the fraction of LINER drops drastically. This effect is more significant for the highest luminosity groups, where we find about 2 times more control than LINER galaxies, indicating an evident preference of LINER to inhabit low mass galaxy groups. Besides, LINER galaxies do not seem to follow the expected morphology-density relation in the proximity of rich galaxy groups. Such a behaviour of LINER agrees with that corresponding to active objects (Seyfert 2, quasars, etc.) analysed in previous works. So, although we have no certainty about the degree at which the mechanisms are responsible of the low-ionization emission, the presence of nuclear activity is certainly involved and should not be discarded.
In conclusion, we have shown the higher probability of LINER to be found in lower density environment, such as poor groups, where the galaxy interactions and content of gas are more abundant. Thus, the global conditions of these environments could favour the presence the LINER emission.
6 Acknowledgments
We would like to thanks to anonymous referee for the comments that helped to improve the paper. This work was supported in part by the Consejo Nacional de Investigaciones Científicas y Técnicas de la República Argentina (CONICET), the Consejo Nacional de Investigaciones Científicas, Técnicas y de Creación Artística de la Universidad Nacional de San Juan (CICITCA) and the Secretaría de Estado de Ciencia, Tecnología e Innovación del Gobierno de San Juan (SECITI).
Funding for the SDSS and SDSS-II has been provided by the Alfred P. Sloan Foundation, the Participating Institutions, the National Science Foundation, the U.S. Department of Energy, the National Aeronautics and Space Administration, the Japanese Monbukagakusho, the Max Planck Society, and the Higher Education Funding Council for England. The SDSS Web Site is http://www.sdss.org/. The SDSS is managed by the Astrophysical Research Consortium for the Participating Institutions. The Participating Institutions are the American Museum of Natural History, Astrophysical Institute Potsdam, University of Basel, University of Cambridge, Case Western Reserve University, University of Chicago, Drexel University, Fermilab, the Institute for Advanced Study, the Japan Participation Group, Johns Hopkins University, the Joint Institute for Nuclear Astrophysics, the Kavli Institute for Particle Astrophysics and Cosmology, the Korean Scientist Group, the Chinese Academy of Sciences (LAMOST), Los Alamos National Laboratory, the Max-Planck-Institute for Astronomy (MPIA), the Max-Planck-Institute for Astrophysics (MPA), New Mexico State University, Ohio State University, University of Pittsburgh, University of Portsmouth, Princeton University, the United States Naval Observatory, and the University of Washington.
References
- Abazajian et al. (2009) Abazajian K.N. et al. , 2009, ApJS, 182, 543.
- Alonso et al. (2007) Alonso M.S., Lambas D.G., Tissera P. & Coldwell G., 2007, MNRAS, 375, 1017.
- Baldwin, Phillips & Terlevich (1981) Baldwin J. A., Phillips M. M. & Terlevich R., 1981, PASP, 93, 5.
- Barrow, Bhavsar & Sonoda (1984) Barrow J.D., Bhavsar S.P. & Sonoda B.H., 1984, MNRAS, 210, 19.
- Bernardi et al. (2003) Bernardi M., Sheth R.K., Annis J. et al. , 2003, AJ, 125, 1882.
- Binette et al. (1994) Binette L., Magris C.G., Stasinska G. & Bruzual A.G., 1994, A&A, 292, 13.
- Blanton et al. (2003) Blanton M.R., Hogg D.W., Bahcall N.A. et al. , 2003, ApJ, 594, 186.
- Blanton et al. (2003b) Blanton M.R., Hogg D.W., Bahcall N.A. et al. , 2003, ApJ, 592, 819.
- Blanton et al. (2005) Blanton M.R., Eisenstein D., Hogg D.W., Schlegel D.J & Brinkmann J., 2005, ApJ, 629, 143.
- Blanton & Roweis (2007) Blanton M.R. & Roweis S., 2007, AJ, 133, 734.
- Brinchmann et al. (2004) Brinchmann J., Charlot S., White S.D.M., Tremonti C., Kauffmann G., Heckman T. & Brinkmann J., 2004, MNRAS, 351, 1151.
- Calzetti et al. (2000) Calzetti D., Armus L., Bohlin R.C., Kinney A.L., Koornneef J. & Storchi-Bergmann T., 2000, ApJ, 533, 682.
- Capetti & Baldi (2011) Capetti A. & Baldi R.D., 2011, A&A, 529, 126.
- Coldwell & Lambas (2003) Coldwell G.V. & Lambas D.G., 2003, MNRAS, 344, 156.
- Coldwell & Lambas (2006) Coldwell G.V. & Lambas D.G., 2006, MNRAS, 371, 786.
- Coldwell et al. (2009) Coldwell G.V., Lambas D.G., Söchting I.K. & Gurovich S., 2009, MNRAS, 399, 88.
- Coldwell et al. (2014) Coldwell G.V., Gurovich S., Diaz Tello J., Söchting I.K. & Lambas D.G., 2014, MNRAS, 437, 1199.
- Domínguez, Muriel & Lambas (2001) Domínguez M., Muriel H. & Lambas D.G., 2001, AJ, 121, 1266.
- Dressler (1980) Dressler A., 1980, ApJ, 236, 351.
- Dressler (1984) Dressler A., 1984, ARA&A, 22, 185.
- Dressler (1997) Dressler A., Oemler A., Couch W.J., Smail I., Ellis R.S., Barger A., Butcher H., Poggianti B.M., Sharples R.M., 1997, ApJ, 490, 577
- Dopita & Sutherland (1995) Dopita M.A. & Sutherland R.S., 1995, ApJ, 455, 468.
- Dudik, Satyapal & Marcu (2009) Dudik R.P., Satyapal S. & Marcu D., 2009, ApJ, 691, 1501.
- Eke et al. (2004) Eke V.R. et al. (The 2dFGRS Team), 2004, MNRAS, 355, 769.
- Filipenko & Terlevich (1992) Filippenko A.V., & Terlevich R., 1992, ApJ, 397, L79.
- González-Martín et al. (2009a) González-Martín O., Masegosa J., Márquez I., Guainazzi M. & Jiménez-Bailón E., 2009,A&A, 506, 1407.
- González-Martín et al. (2009b) González-Martín O., Masegosa J., Márquez I. & Guainazzi M., 2009, ApJ, 704, 1570.
- Goudfrooij et al. (1994) Goudfrooij P., Hansen L., Jorgensen H. & Norgaard-Nielsen H., 1994, A&AS, 105, 341.
- Graves et al. (2007) Graves G.J., Faber S.M., Schiavon R.P., & Yan R., 2004, ApJS, 671, 243.
- Groves et al. (2004) Groves B.A., Dopita M.A., & Sutherland R.S., 2004b, ApJS, 153, 75.
- Heckman (1980) Heckman T.M., 1980, A&A, 87, 152.
- Heckman (1989) Heckman T.M., Baum S.A., van Breugel W.J.M & McCarthy P., 1989, ApJ, 338, 48.
- Ho, Filippenko & Sargent (1997) Ho L.C., Filippenko A.V. & Sargent W.L.W., 1997d, ApJS, 112, 391.
- Ho, Filippenko & Sargent (2003) Ho L.C., Filippenko A.V. & Sargent W.L.W., 2003, ApJ, 583, 159.
- Hogg et al. (2004) Hogg D.W., Blanton M.R., Brinchmann J. et al. , 2004, ApJ, 601, 29.
- Kauffmann & Haehnelt (2002) Kauffmann G. & Haehnelt M.G., 2002, MNRAS, 332, 529.
- Kauffmann et al. (2003b) Kauffmann G., Heckman T.M., White S.D.M. et al. , 2003, MNRAS, 341, 33.
- Kewley et al. (2001) Kewley L.J., Dopita M.A., Sutherland R.S., Heisler C.A. & Trevena J., 2001, ApJ, 556, 121.
- Kewley et al. (2006) Kewley L.J., Groves B., Kauffmann G. & Heckman T.M., 2006, MNRAS, 372, 961.
- Masegosa et al. (2011) Masegosa J., Márquez I., Ramirez A. & González-Martín O., 2011, A&A, 527, 23.
- Merchán & Zandivarez (2005) Merchán M., Zandivarez A., 2005, ApJ, 630, 759.
- Nagar, Falcke & Wilson (2005) Nagar N.M., Falcke H. & Wilson A.S., 2005, A&A, 435, 521.
- Osterbrock & Miller (1989) Osterbrock D.E. & Miller J.S., 1989, Active Galactic Nuclei. Proc. IAU Symposium 134.
- Padilla et al. (2004) Padilla N. et al. (The 2dFGRS Team), 2004, MNRAS, 352, 211.
- Padilla, Lambas & González (2010) Padilla N., Lambas D.G., & González R., 2010, MNRAS, 409, 936.
- Perez, Tissera & Blaizot (2009) Perez J., Tissera P., & Blaizot J., 2009, MNRAS, 397, 748.
- Petrosian (1976) Petrosian V., 1976, ApJ, 209, 1.
- Phillips et al. (1986) Phillip M.M., Jenkins C.R., Dopita M.A., Sadler E.M. & Binette L., 1986, AJ, 91, 1062.
- Popesso & Biviano (2006) Popesso P. & Biviano A., 2006, A&A, 460, L23.
- Sarzi et al. (2010) Sarzi M., Shields J.C., Schawinski K. et al. , 2010, MNRAS, 402, 2187.
- Sérsic (1963) Sérsic J. L., 1963, BAAA, 6, 41.
- Sodré & Stasińska (1999) Sodré L. & Stasińska G., 1999, A&A, 345, 391.
- Stasínska et al. (2008) Stasínska G., Vale Asari N., Cid Fernandes R., Gomes J.M., Schlickmann M., Mateus A., Schoenell W. & Sodré Jr.L. 2008, MNRAS, 391, 29.
- Strauss et al. (2002) Strauss M., Weinberg D.H., Lupton, R.H. et al. , 2002, AJ, 124, 1810.
- Tremonti et al. (2004) Tremonti C., Heckman T.M., Kauffmann G. et al. , 2004, ApJ, 613, 898.
- Toomre & Toomre (1972) Toomre A. & Toomre J., 1972, ApJ, 178, 623.
- Yan et al. (2006) Yan R., Newman J.A., Faber S.M. et al. , 2006, ApJ, 648, 821.
- Yan & Blanton (2012) Yan R. & Blanton M.R, 2012, ApJ, 747, 61.
- Zapata et al. (2009) Zapata T., Pérez J., Padilla N., & Tissera P., 2009, MNRAS, 394, 2229.