First analysis of solar structures in 1.21 mm full-disc ALMA image of the Sun
Abstract
Context. Various solar features can be seen in emission or absorption on maps of the Sun in the millimeter and submillimeter wavelength range. The recently installed Atacama Large Millimeter/submillimeter Array (ALMA) is capable of observing the Sun in that wavelength range with an unprecedented spatial, temporal and spectral resolution. To interpret solar observations with ALMA the first important step is to compare solar ALMA maps with simultaneous images of the Sun recorded in other spectral ranges.
Aims. The first aim of the present work is to identify different structures in the solar atmosphere seen in the optical, infrared and EUV parts of the spectrum (quiet Sun, active regions, prominences on the disc, magnetic inversion lines, coronal holes and coronal bright points) in a full disc solar ALMA image. The second aim is to measure the intensities (brightness temperatures) of those structures and to compare them with the corresponding quiet Sun level.
Methods. A full disc solar image at 1.21 mm obtained on December 18, 2015 during a CSV-EOC campaign with ALMA is calibrated and compared with full disc solar images from the same day in H line, in He I 1083 nm line core, and with various SDO images (AIA at 170 nm, 30.4 nm, 21.1 nm, 19.3 nm, and 17.1 nm and HMI magnetogram). The brightness temperatures of various structures are determined by averaging over corresponding regions of interest in the calibrated ALMA image.
Results. Positions of the quiet Sun, active regions, prominences on the disc, magnetic inversion lines, coronal holes and coronal bright points are identified in the ALMA image. At the wavelength of 1.21 mm active regions appear as bright areas (but sunspots are dark), while prominences on the disc and coronal holes are not discernible from the quiet Sun background, although having slightly less intensity than surrounding quiet Sun regions. Magnetic inversion lines appear as large, elongated dark structures and coronal bright points correspond to ALMA bright points.
Conclusions. These observational results are in general agreement with sparse earlier measurements at similar wavelengths. The identification of coronal bright points represents the most important new result. By comparing ALMA and other maps, it was found that the ALMA image was oriented properly and that the procedure of overlaying the ALMA image with other images is accurate at the 5 arc sec level. The potential of ALMA for physics of the solar chromosphere is emphasized.
Key Words.:
Sun: radio radiation – Sun: chromosphere – Sun: transition region – Sun: corona1 Introduction
The Atacama Large Millimeter/submillimeter Array (ALMA)111http://www.almaobservatory.org 222https://www.eso.org/sci/facilities/alma.html is currently the world largest ground based astronomical facility, capable of observing almost all types of celestial objects including the Sun. The main advantage of solar observations with ALMA is mapping of the solar chromosphere with an unprecedented spatial, temporal and spectral resolution in the wavelength range between 0.3 mm and 8.6 mm. Solar measurements are currently limited to two observing bands at 1.3 mm and 3 mm.
An important characteristic of ALMA is its capability to be used as an approximately linear thermometer of the gas in the solar atmosphere (Wedemeyer et al. 2016). So, the measured brightness temperature is directly proportional to the gas temperature of the observed structure or layer in the solar atmosphere. Therefore, it is very important to develop numerical simulations of various solar atmosphere types as a priori and a posteriori supporting tools for solar observations with ALMA (Wedemeyer et al. 2015) and to compare results with available measurements. It was clear from the initial phase that ALMA can be pointed at the Sun and that it will become an important tool if it could be made available for solar physics. Various applications were described by Bastian (2002), Wedemeyer-Böhm et al. (2007), Loukitcheva et al. (2008), Karlický et al. (2011), and Loukitcheva et al. (2015). An extensive review of solar scientific topics to be addressed with ALMA, including quiet Sun, active regions and prominences, was prepared by Wedemeyer et al. (2016).
We briefly describe some of the earlier solar measurements in the ALMA wavelength range (from mm to mm). Brightness temperature measurements of the quiet Sun were reviewed and compared with results of theoretical models by Gary (1996), by Loukitcheva et al. (2004, 2015), and by Benz (2009). Further, the quiet Sun emission in the wavelength range from mm to mm was measured by Bastian et al. (1993b), White et al. (2006), Brajša et al. (2007a, b), and Iwai et al. (2017). In the wavelength range 0.7 mm to 5 mm various measurements give the quiet Sun brightness temperature in the range from 5000 K to 8000 K, as summarized by White et al. (2017). In spite of scattered results and measurement uncertainties, there is an average trend of the brightness temperature increase with wavelength, as expected.
Solar active regions were observed in the wavelength range from mm to mm by Kundu & McCullough (1972), Pohjolainen et al. (1991), Bastian et al. (1993b), Lindsey & Kopp (1995), Silva et al. (2005), White et al. (2006), Iwai & Shimojo (2015), Iwai et al. (2016), and Kallunki & Uunila (2017). As expected, active regions at mm and sub-mm wavelengths generally appear as bright areas, although sunspot umbrae, if resolved, have lower brightness temperatures than the quiet Sun level at mm (Lindsey & Kopp 1995; Loukitcheva et al. 2014; Iwai & Shimojo 2015) or have almost equal brightness temperature as the quiet Sun at mm (Iwai et al. 2016).
Solar prominences, observed as filaments on the disc, are generally seen as structures of lower brightness temperature than the quiet Sun at mm wavelengths. Such results were obtained by measurements in the wavelength range from mm to mm (Kundu et al. 1978; Schmahl et al. 1981; Vršnak et al. 1992). According to the list of radio observations of filaments compiled and corrected by Raoult et al. (1979), the intensity contrast (lower brightness temperatures of filaments) with respect to the quiet Sun decreases with frequency, being 5% at 3.5 mm. Hiei et al. (1986) performed measurements of filaments on the disc at mm and at mm and further improved results of Raoult et al. (1979) taking into account observational beam/convolution effects. In this way larger brightness temperature differences between filaments and quiet Sun were measured. At higher frequencies, Bastian et al. (1993a) found negligible contrast (but still a lower brightness temperature than the quiet Sun level) at and near the location of H filaments at mm.
At mm wavelengths coronal holes are mostly observed as regions having brightness temperatures slightly below the quiet Sun level, but local enhancements of radiation within their borders can also be seen. Measurements which support this general result were performed in the wavelength range from mm to mm by Kundu & Liu (1976), Kosugi et al. (1986), Pohjolainen & Urpo (1997), Gopalswamy et al. (1999), Pohjolainen et al. (2000), White et al. (2006), and Brajša et al. (2007a, b). Moreover, local enhancements of radio emission in polar regions were measured by Urpo & Pohjolainen (1987), Riehokainen et al. (1998), and Pohjolainen (2000) in the wavelength range from mm to mm.
As we have seen, there is a relatively large number of previous solar studies at mm and to a lesser extent at sub-mm wavelengths. However, the main problem/deficiency of these works are too low spatial resolution and poor calibration. With ALMA it is now possible to substantially improve observations of the Sun at mm and sub-mm wavelengths.
Thermal bremsstrahlung can be considered as the dominant radiation mechanism of the quiet solar radio emission at mm and sub-mm wavelengths (e.g. Tapping & Harvey 1994; Bastian 1995; Benz et al. 1997). A strong magnetic field would be necessary (in the range 3300 Gauss 6600 Gauss, for mm and 28000 Gauss and more for mm), for thermal gyromagnetic (cyclotron) radiation (e.g. Brajša et al. 2009). Such a large magnetic field needed for the short-mm wavelength gyromagnetic emission is highly improbable.
Calculations of the brightness temperatures of the quiet Sun and chromospheric network (e.g. Chiuderi Drago et al. 1983; Loukitcheva et al. 2004, 2006) are usually based on the VAL (Vernazza et al. 1981), FAL (Fontenla et al. 1993), and CS (Carlsson & Stein 1992, 1995, 1997, 2002) models. Modeling of filaments radio emission (or absorption) is not straightforward, since the results are strongly frequency dependent, especially in the mm and sub-mm wavelength range (Chiuderi Drago 1990; Chiuderi & Chiuderi Drago 1991; Chuideri Drago et al. 1992; Engvold 1994; Tandberg-Hanssen 1995). Moreover, many subtle effects should be taken into account, e.g., the influence of the prominence-corona transition region, or the visibility of filament channels and coronal condensations. Coronal condensations are structures lying over magnetic inversion lines which could be discernible at mm wavelengths, but remain invisible in the H filtergrams (Kundu et al. 1978; Vršnak et al. 1992).
Our analysis is divided in two parts: the observational part (present work, Paper I) and the modeling part (subsequent paper, Paper II). In present paper we first describe measurements and methods of data reduction (Sect. 2), then present the results of the observational analysis of the ALMA image and compare them with other data (Sect. 3) and finally discuss the most important results and summarize conclusions (Sect. 4).
2 Measurements and data reduction
In the period 2011 – 2015 Commissioning and Science Verification (CSV) phase of solar observations with ALMA took place (Bastian et al. 2015; Kobelski & ALMA Solar Development Team 2016). In this frame several solar campaigns were performed, lasting typically between one day and one week. Test observational material, both single dish and interferometric, was collected and analyzed from which solar images were compiled. A first part of the CSV data was recently released to the scientific community333https://almascience.eso.org/alma-data/science-verification.
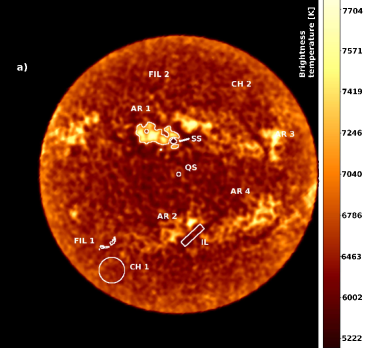
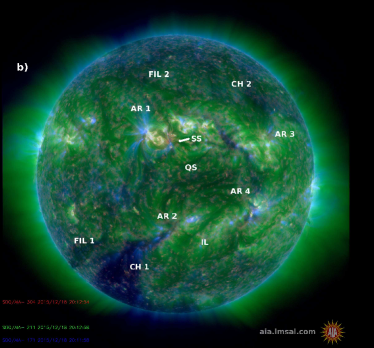
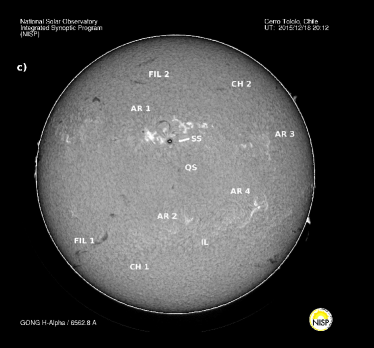
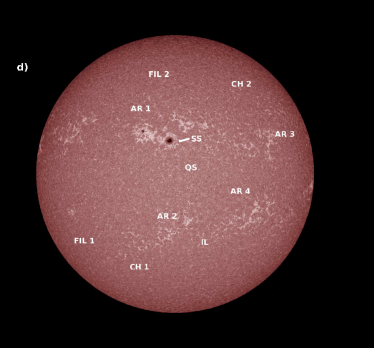
An image of the whole solar disc from the December 2015 CSV campaign is used in current analysis. In Fig. 1 we present the December 18th, 2015 ALMA image taken with a single dish antenna together with the Cerro Tololo444http://halpha.nso.edu H and several SDO555http://sdo.gsfc.nasa.gov full-disc solar images obtained at the same time. Besides the SDO/AIA composite image, the SDO/AIA 170 nm filtergram, the SDO/AIA 30.4 nm filtergram and the SDO/HMI magnetogram are presented.
The full disc solar map was obtained by scanning the solar disc with a 12 m single dish total power ALMA antenna (PM03) at a frequency of 248 GHz corresponding to mm in a double circle pattern (Phillips et al. 2015). The measurement frequency/wavelength belongs to Band 6, which is one of the ten ALMA observing bands. We restricted our analysis to Band 6, because on December 18th, 2015 no full disc image in the other observing band (Band 3) was available. The observing day December 18, 2015 was chosen because of availability of images in other wavelength ranges, especially He I 1083 nm, which was not accessible for the other observing days. The measurement started at 20:12:21 UT on December 18, 2015 and lasted for about 13 minutes. The beam size amounts to 26 arcsec.
A two-load method was used to calibrate the data where measurements of the known ambient and hot load are used to determine the source brightness temperature, together with measurements of zero reference and received power on and off the source. Also, a correction (multiplication) factor was applied to account for the antenna efficiency: for Band 6 (White et al. 2017). Data reduction was performed using the Common Astronomy Software Applications (CASA) package666http://casa.nrao.edu. The final uncertainty in the brightness temperature is about 5 % (White et al. 2017).
More information about the measurements, calibration and imaging of the solar observations with ALMA for the single dish/total power mode can be found in the paper by White et al. (2017).
In present work we compare the full disc solar image at 1.21 mm obtained on December 18, 2015 with ALMA with full disc solar images from the same day in H line (Cerro Tololo Observatory, NISP), in He I 1083 nm line core (NSO SOLIS)777https://solis.nso.edu/0/index.html, and with various SDO images (a composite AIA image at 30.4 nm, 21.1 nm, and 17.1 nm; AIA filtergrams at 170 nm, at 30.4 nm, and at 19.3 nm; and a HMI magnetogram).
3 An analysis of the ALMA image and comparison with other data
A comparison of full-disc solar images taken at different wavelengths (Fig. 1) reveals many interesting characteristics. Active regions, which appear bright in H and in EUV, appear also bright at 1.21 mm. Filaments on the disc, clearly seen in H can not easily be identified at 1.21 mm; their brightness temperature is obviously rather close to the quiet Sun background. Finally, coronal holes which are identified as dark regions in EUV have no visible counterparts at 1.21 mm (no significant change of the brightness temperature compared to the quiet Sun background).
In the solar ALMA image (Fig. 1a) several regions of interest are indicated. The brightness temperature levels, measured for these regions of interest, are presented in Table 1. Brightness temperatures of various structures are calculated as the mean values of all pixels within regions of interest denoted in Fig. 1a. The quiet Sun levels are determined from circles centered at various distances, , from the solar disc center. At the solar disc center radius of the circle is 5 pixels, while for all other quiet Sun measurements it is 30 pixels. The size of a pixel is about 3 arc sec. The coronal hole level is measured within the circle of a radius of 30 pixels located within the CH1. The contours of active region are defined using a numerical criterion: all pixels having brightness temperature K in the area of the AR1 are included in the region of interest. With this criterion the bright area associated with active region is included in the region of interest and sunspots are automatically excluded from the active region area. The sunspot is also defined with the numerical criterion: all pixels with K at the position denoted with SS. We note that this selection criteria (for AR1 and SS) are crude and to some extent arbitrary. The level of magnetic inversion line is defined as the mean value within the rectangle within the inversion line area (IL), while the prominence level was taken from the shape of the H image put over. The number of pixels used in the averaging process depends on the size of a structure and varies from in the central quiet Sun region to in the active region.
To quantitatively measure the brightness temperature of the above mentioned structures the center-to-limb function should be taken into account. As we can see from Table 1, there is a clear limb brightening at 1.21 mm (compare the brightness temperatures of the quiet Sun at different radial distances from the solar disc center). The brightness temperature values of various solar structures are compared with the quiet Sun levels measured at the same radial distances from the solar disc center as the respective structures but along the solar equator in the east direction (Table 1). Finally, the relative brightness temperatures are given in Table 1: a positive (negative) sign indicates that the feature is brighter (darker) than the surroundings.
| Structure | (QS) | (structure) | ||||
|---|---|---|---|---|---|---|
| (pixels) | (K) | (pixels) | (K) | (pixels) | (K) | |
| QS | 0 | 78 | 78 | |||
| SS | 77 | 2833 | 136 | |||
| AR1 | 105 | 2832 | 3048 | |||
| IL | 147 | 2833 | 897 | |||
| PR (FIL1) | 229 | 2824 | 154 | |||
| CH1 | 273 | 2833 | 2804 |
3.1 Quiet Sun
It is not easy to define and observationally identify the quiet Sun regions at mm wavelengths because of highly complex fine structure chromosphere seen (Fig. 1a). However, we have chosen 6 regions of interest representing the quiet Sun areas at different radial distances from the solar disc center, see Table 1. The quiet Sun brightness temperature increases steadily with increasing radial distance from the disc center consistent with a pronounced limb brightening. The amount of this limb brightening is in the order of 10 % in agreement with recent results of Alissandrakis et al. (2017). The central brightness temperature of the quiet Sun is measured as the average value of all intensities within the small circle located at the center of the solar disc in Fig. 1a. This value is 6040 K (Table 1) fully consistent with the central quiet Sun brightness temperature measured at 1.21 mm for the December 2015 data (White et al. 2017).
3.2 Active regions and sunspots
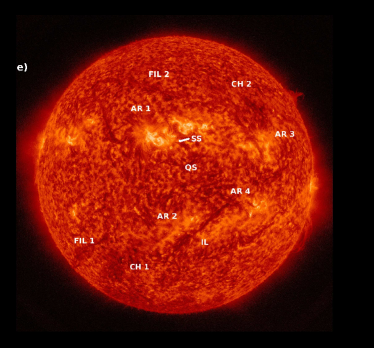
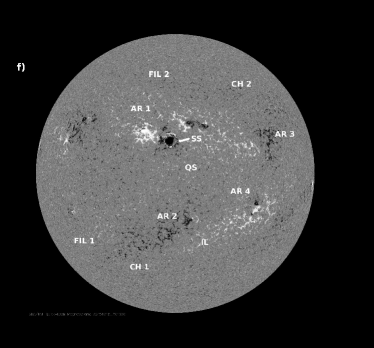
Active regions are clearly bright at the wavelength of 1.21 mm (Fig. 1a). They are also bright in other images of the solar chromosphere and corona: SDO AIA composite image (Fig. 1b), H (Fig. 1c), SDO AIA 170 nm (Fig. 1d), and SDO AIA He I 30.4 nm (Fig. 1e). As it is well known they lie over strong magnetic field regions in the solar photosphere (Fig. 1f). We now analyze in more detail the most prominent active region, denoted as AR1 in Fig. 1. This active region (AR1) has an average magnetic field strength of about 1000 Gauss (as measured in the magnetogram, Fig. 1f) and the average measured brightness temperature (Fig. 1a) is given in Table 1. In defining the contours of the AR1 the sunspots are excluded, because the sunspot umbras have a lower brightness temperature then the rest of the AR. When compared with the average brightness temperature of a quiet Sun region at the corresponding radial distance from the disc center (Table 1), the AR1 has an average surplus emission of more than 1000 K.
Although active regions are bright at 1.21 mm, sunspots are clearly dark, especially when compared with active region environment (Fig. 1). We measured the average brightness temperature of the large sunspot in AR1 (Fig. 1a) and its intensity (6080 K) is lower not only than the intensity of the surrounding active region, but also than the average brightness temperature of the quiet Sun at the corresponding radial distance from the solar disc center (Table 1). Finally we note that the large sunspot SS (Fig. 1a) clearly corresponds to the area of a strong magnetic field (Fig. 1f) in the order of 1500 - 2500 Gauss.
3.3 Prominences on the solar disc
On the ALMA observing day, December 18, 2015, several prominences on the solar disc were observed. They can be identified as dark filaments seen in the H filtergram presented in Fig. 1c. We now search for their counterparts in the ALMA map (Fig. 1a) and find that no distinctive structures are present at the places of H filaments in the 1.21 mm map. To quantitatively analyze the radiation intensity of filaments on the disc the brightness temperature of a part of the ALMA map (Fig. 1a) at the position of the filament FIL1 (Fig. 1c) was measured. The result is presented in Table 1 together with the brightness temperature of a quiet Sun regions measured at the same radial distance from the solar disc center as the FIL1. At the wavelength of 1.21 mm the prominence on the disc has a brightness temperature lower than the quiet Sun level by slightly more than 100 K. The reliability of this result depends on the overlying precision (in the order of 5 arc sec) and the deviations from the measured mean intensity value (Table 1).
3.4 Magnetic inversion lines
We now turn to the following question: In the 1.21 mm map, what are the dark, large, elongated structures lying between active regions (Fig. 1a)? By comparison with the SDO HMI magnetogram (Fig. 1f), it can be seen that all of these ALMA structures are cospatial with the inversion lines of the large scale magnetic field on the Sun. For a quantitative analysis a part of the magnetic inversion line was chosen (Fig. 1a) and its brightness temperature was measured and compared with the corresponding quiet Sun region (Table 1). The net deficit of brightness temperature of the measured portion of the magnetic inversion line is 170 K. Finally, it is also noteworthy that all these large dark ALMA structures are cospatial with dark structures visible in He 30.4 filtergram (Fig. 1e).
3.5 Coronal holes
Coronal holes can be most easily identified in the EUV images of the Sun (Fig. 1b and Fig. 2a). On the observing day, December 15, 2015, two large coronal holes were present on the Sun, denoted by CH1 and CH2. By comparing the EUV images with the ALMA map (Fig. 1a) it is easily seen that coronal holes have no distinctive counterparts at 1.21 mm. Indeed, the average brightness temperature measured for a region of interest within the coronal hole CH1 (Fig. 1a) is only 50 K below the adjacent quiet Sun region identified at the same radial distance from the solar disc center (Table 1). The CH1 is the most prominent solar coronal hole on the observing day, so only it was measured as a representative example.
3.6 Coronal bright points
Coronal bright points are small bright structures belonging to the low corona which can be clearly identified in X-ray and EUV images of the Sun. These structures have dimensions in the order of 15 - 30 arc sec and are closely related to the underlying small-scale magnetic elements and He I 1083 nm dark points (Harvey-Angle 1993; Brajša et al. 2002). Their visual classification put them into one of the three classes: point-like structures, small loops and small active regions (Brajša et al. 2002). Several dozens of identified coronal bright points can be seen in Fig. 1 in the paper by Sudar et al. (2015). Coronal bright points are most easily observed outside active regions.
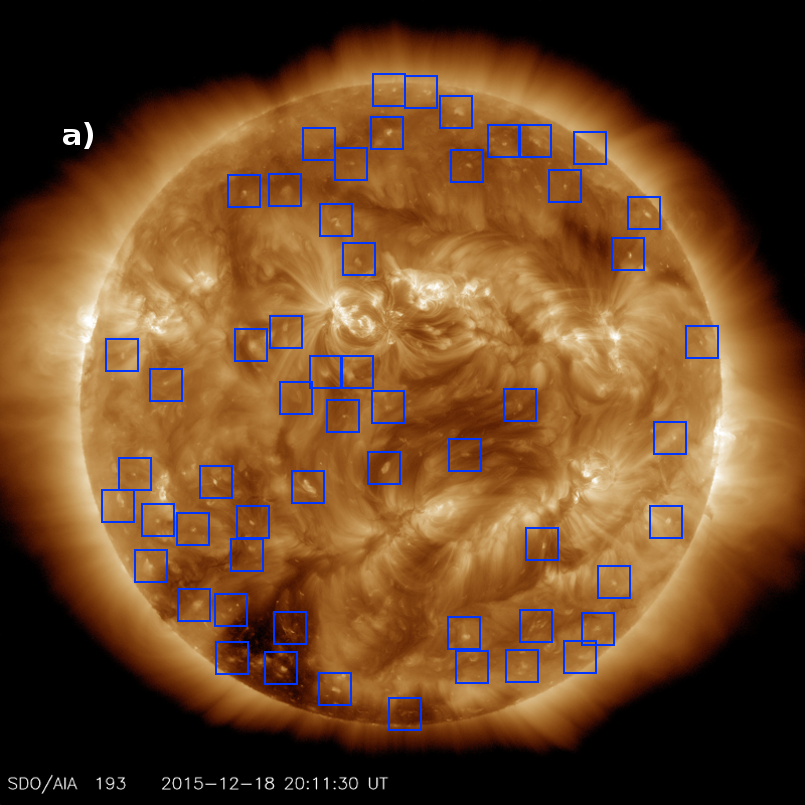
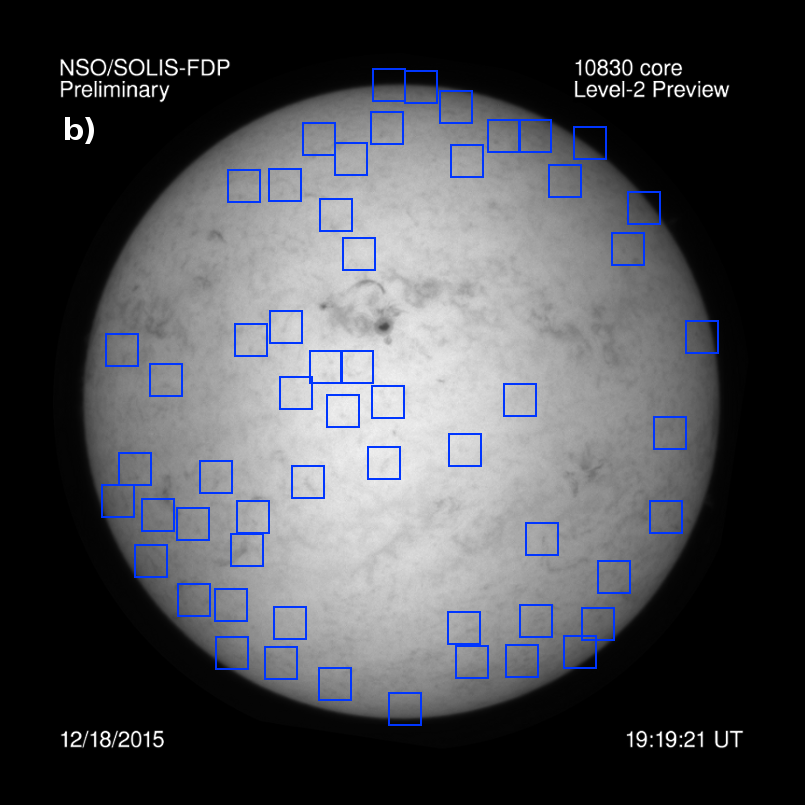
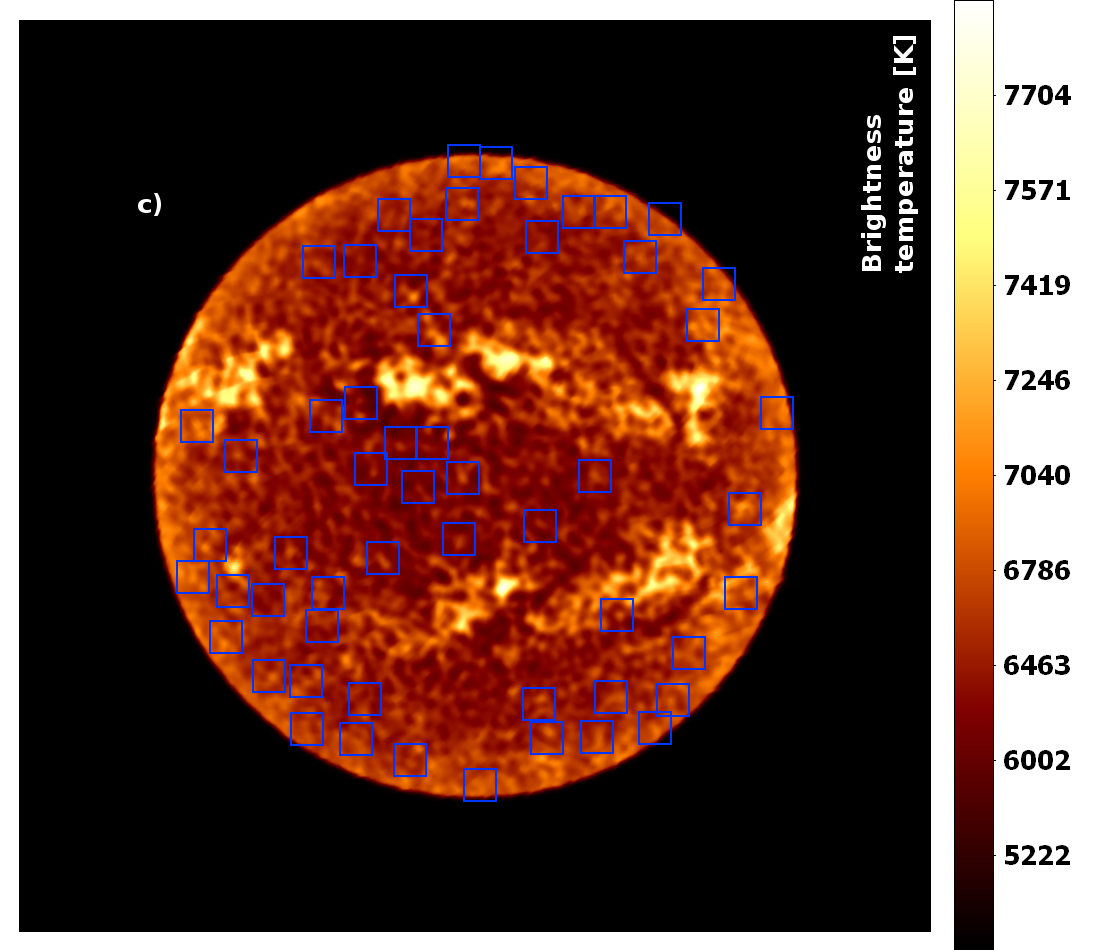
A solar filtergram recorded with SDO/AIA at 19.3 nm is presented in Fig. 2a and 56 coronal bright points (only point-like structures and small loops) are identified and denoted with blue boxes. In Fig. 2b and Fig. 2c the He I 1083 nm filtergram and the ALMA 1.21 mm map are presented, respectively, with the above mentioned 56 blue boxes placed in the same positions as in the SDO/AIA image in Fig. 2a. By a careful and detailed comparison of the three images we can conclude: (i) the great majority (75 %) of all coronal bright points from the EUV image corresponds to He I 1083 nm dark points, (ii) the great majority (82 %) of all coronal bright points from the EUV image corresponds to the ALMA 1.21 mm bright points, and (iii) the shape and orientation of the structures is preserved and reproduced in all three spectral ranges. These inferences have two important implications: (a) coronal bright points have almost a one to one correspondence with the ALMA 1.21 mm bright points and (b) this is an important and conclusive proof that the precision of ALMA can be best tested with coronal bright points and this spatial precision is in the order of 5 arc sec.
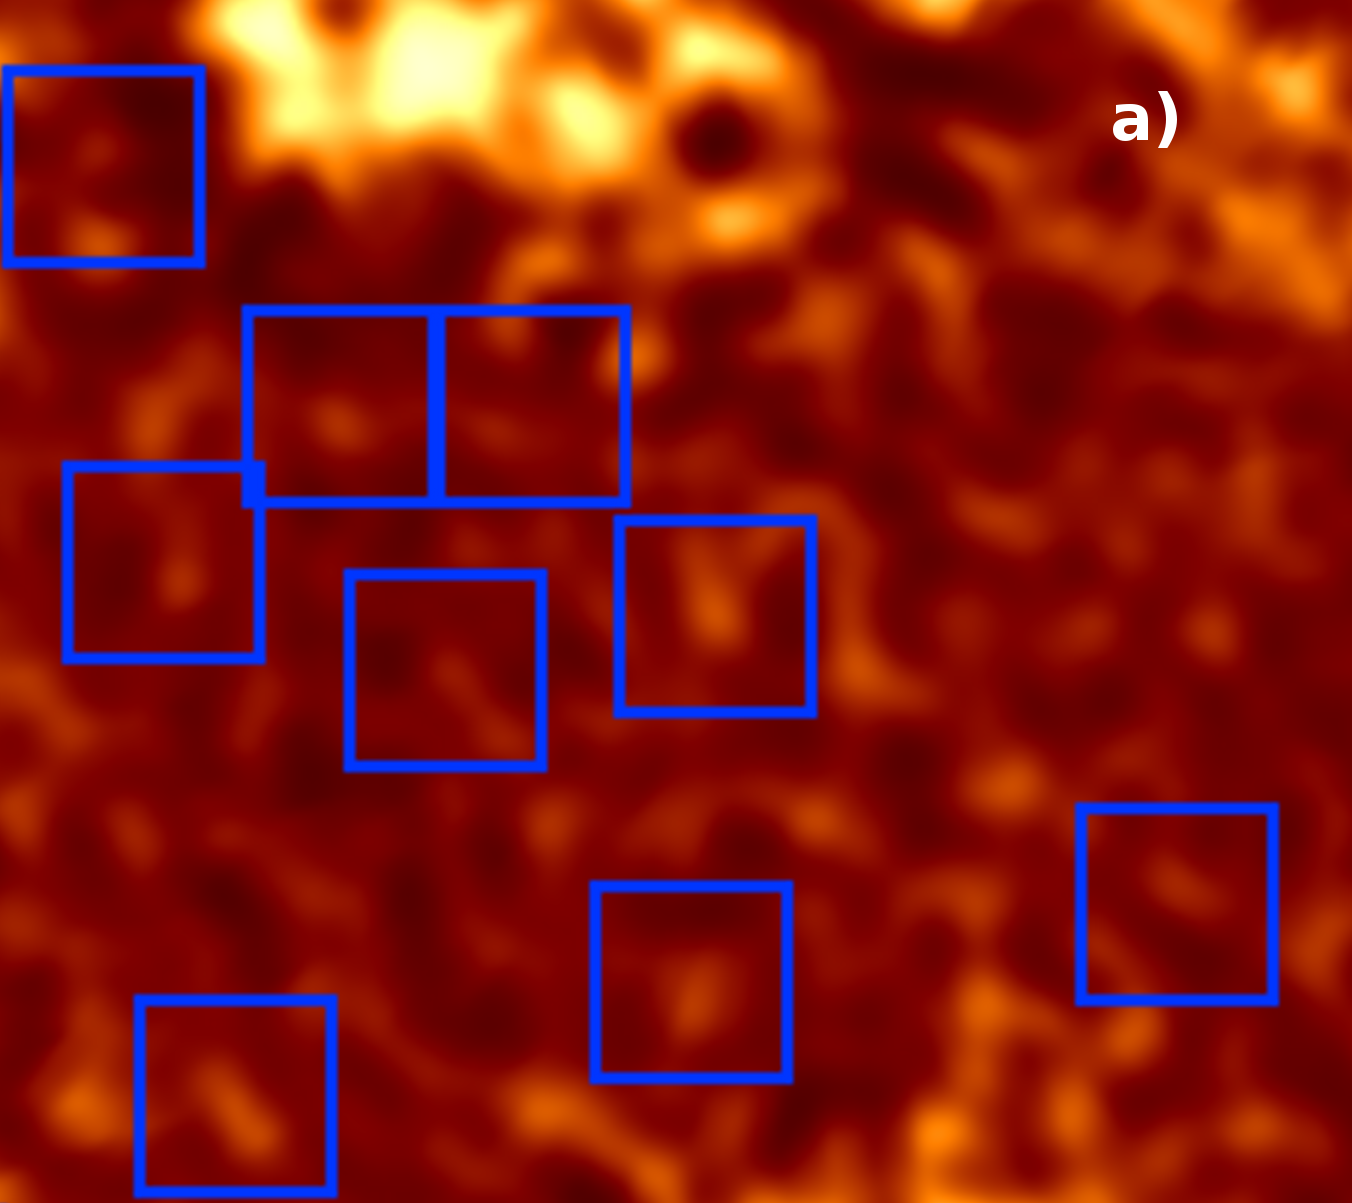
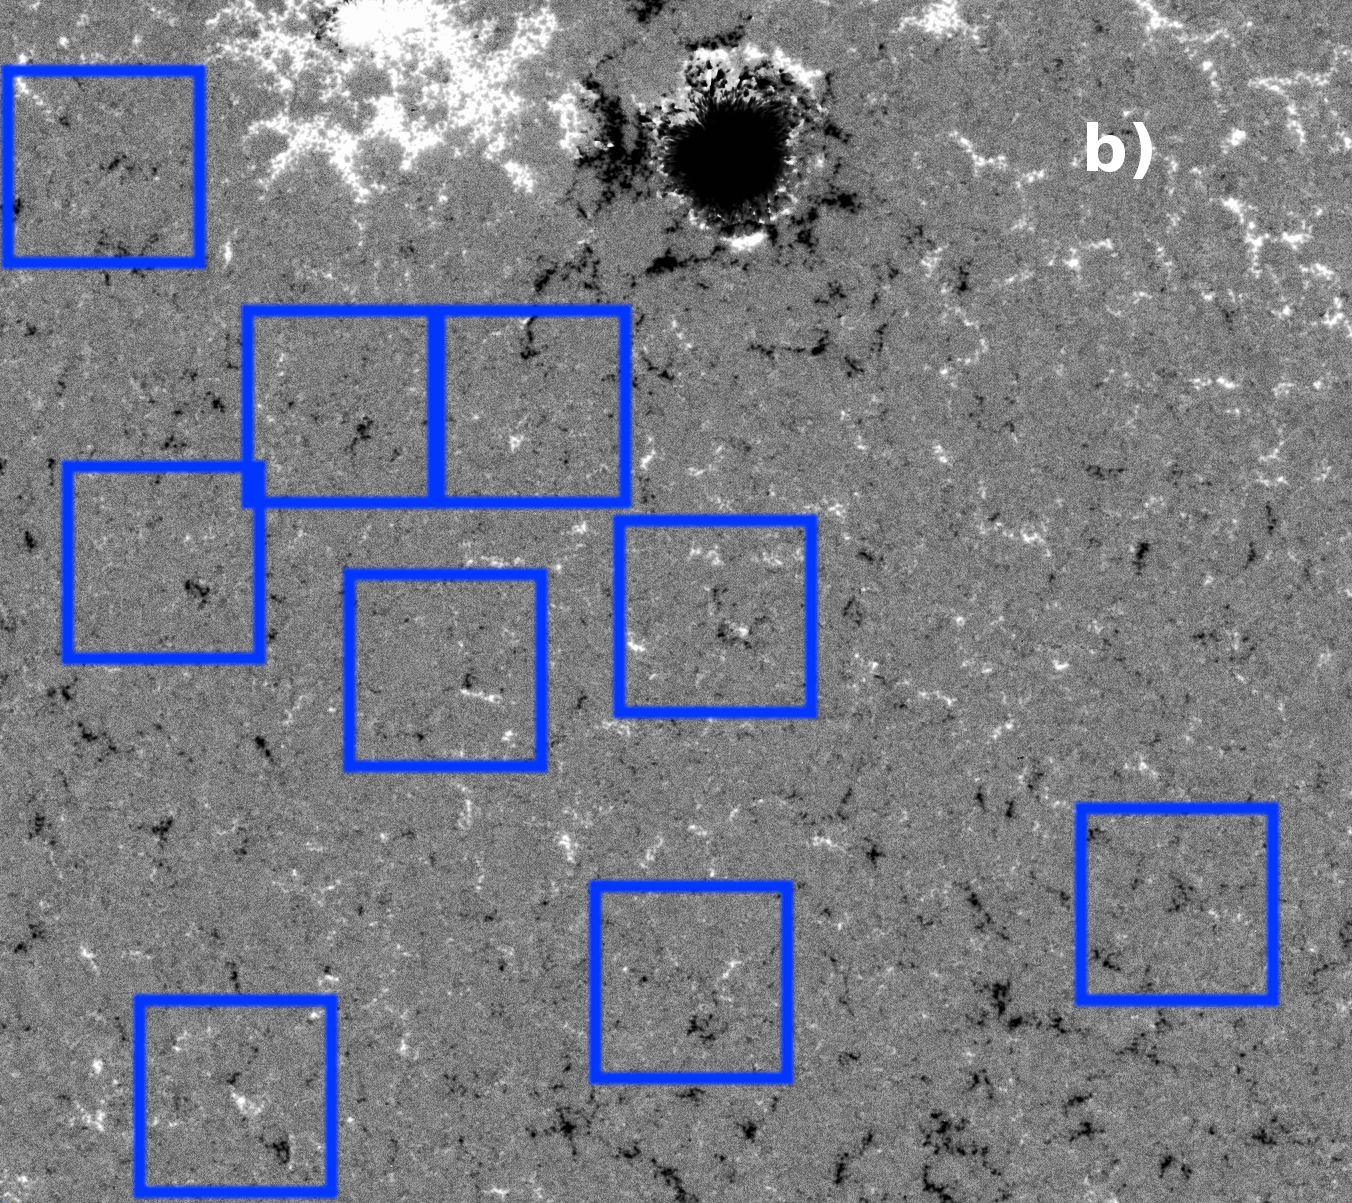
Finally, to investigate in more detail coronal bright points, which we can now also call ALMA bright points, we present a zoomed in portion of the ALMA image together with a corresponding magnetogram in Fig. 3. By comparing these two images following important conclusion can be made: (i) ALMA bright points are clearly related to small-scale bipolar magnetic regions (also one polarity is prevailing in some cases) and (ii) following the shape of magnetic fine structure the pattern is preserved and reproduced in the ALMA image: small bright structures identified in the ALMA image (Fig. 3a) are co-spatial with small-scale magnetic features (Fig. 3b) and the mm brightness is clearly proportional to the magnetic field strength (for places on solar surface outside sunspots).
4 Summary, discussion and conclusions
We now summarize observational results for the solar objects analyzed in previous Sect., compare them with other existing studies and list the most important conclusions of the present study.
Quiet Sun. The definition and identification of the quiet Sun regions and the determination of the brightness temperature of the quiet Sun level is not easy, which is primarily due to the highly complex fine structure of the solar chromosphere (Wedemeyer et al. 2016) and a frequency dependent center to limb intensity function with a pronounced limb brightening at mm wavelengths (Bastian et al. 1993b; Brajša et al. 1994; White et al. 2017; Alissandrakis et al. 2017). In present analysis we have determined the brightness temperature of the quiet Sun region at the disc center to be 6040 K at 1.21 mm, which is fully consistent with the central brightness temperature determined by White et al. (2017) for the 2015 data (6040 250 K). Also the estimated limb brightening at 1.21 mm is up to 10 %, consistent with the results of Alissandrakis et al. (2017).
Active regions and sunspots. At the wavelength of 1.21 mm active regions are clearly bright, as expected and in accordance with all previous studies for the mm wavelength range. The strong excess emission measured in this work amounts to more than 1000 K for the analyzed active region. However, sunspots are seen in absorption, as localized dark areas, in agreement with some earlier studies for the wavelengths mm (Lindsey & Kopp 1995; Loukitcheva et al. 2014; Iwai & Shimojo 2015). As present analysis shows, the analyzed sunspot has brightness temperature lower by 90 K than a quiet Sun region at the same radial distance from the solar disc center allowing us to conclude that sunspots are darker not only in comparison with ambient active regions, but also to the quiet Sun regions.
Prominences on the solar disc. As we have seen, prominences on the solar disc can not be easily identified against the surrounding quiet Sun background. However, the quantitative analysis reveals that prominences have brightness temperatures lower in the order of 100 K than the quiet Sun regions at the same radial distances from the disc center at the observing wavelength of 1.21 mm. This is in agreement with a previous study (Bastian et al. 1993a) in which a negligible contrast, but still a lower brightness temperature than the quiet Sun level, was measured for prominences on solar disc at the wavelength near 1 mm. The appearance (emission vs. absorption) of prominences on the solar disc at mm and sub-mm wavelengths is rather frequency dependent and further multifrequency ALMA observations are needed to bring more insight into this interesting topic.
Magnetic inversion lines. In the ALMA map taken at 1.21 mm the inversion lines of the large scale magnetic field on the Sun are clearly visible as large elongated dark structures. The average brightness temperature of the measured part of the inversion line has a brightness temperature 170 K below the quiet Sun level. This is in agreement with earlier studies performed at mm wavelengths. Brajša et al. (1992) and Vršnak et al. (1992) performed an extensive statistical analysis of full disc solar maps at the wavelength of 8 mm and concluded that 99 of all dark structures lie over the inversion lines of the large scale magnetic field. Bastian et al. (1993a) analyzed full disc solar maps at the wavelength near 1 mm and also found a lower brightness temperature at the places of magnetic inversion lines. A clear association between large scale dark structures and magnetic inversion lines can also be found in the recently published solar ALMA maps (White et al. 2017). This observationally found correlation between regions of lower brightness temperature at mm wavelengths and magnetic inversion lines can be interpreted in terms of reduced heating and a smaller density scale height in the chromosphere along the inversion lines of the large scale magnetic field where the magnetic field vector is horizontal (Vršnak et al. 1992; Bastian et al. 1993a; Brajša 1993).
Coronal holes. Similarly as prominences on the disc, coronal holes have no discernible contrasts against the quiet Sun background at the observing wavelength of 1.21 mm. The net intensity depression measured in present work is only 50 K. This is in general agreement with previous studies mentioned in Sect. 1, but there is an obvious lack of other coronal holes observations at the wavelength around 1 mm. So, further multifrequency observations with ALMA are desirable, taking into account that coronal contribution, which is dominantly responsible for the radiation of coronal holes, is becoming less and less important for shorter wavelengths.
Coronal bright points. In this work we presented clear observational evidence that the great majority of all coronal bright points from the EUV image corresponds to the He I 1083 nm dark points (75 %) and to the ALMA 1.21 mm bright points (82 %). Moreover, all ALMA 1.21 mm bright points show well-defined relationship with magnetic structures (100 % correspondence), mostly with small scale bipolar magnetic regions and in some cases with small unipolar magnetic regions. A correlation in position of up to 50 between 20 cm bright points and coronal bright points was found by Habbal & Harvey (1988) and by Nitta et al. (1992). A similar result for the wavelength of 17.6 mm was reported by Kundu et al. (1994).These results are very interesting, but we note that the observing wavelength of 20 cm is two orders of magnitude and the observing wavelength of 17.6 mm is one order of magnitude larger than the one used here (1.21 mm). It is also important to note that the 20 cm emission comes from the solar corona and the 1.21 mm radiation originates in the solar chromosphere: these are two different layers in the solar atmosphere having rather different temperatures. An attempt to identify a coronal bright point in a 8 mm solar map failed due to the poor spatial resolution (Brajša et al. 2007b). Coronal bright points are magnetic structures associated with bipolar magnetic elements: ephemeral (emerging) regions or cancelling magnetic features (Brajša et al. 2004; Sudar et al. 2015). Best identification of coronal bright points is in EUV images of the Sun (e.g. with the SDO) and, when the spatial resolution permits, it can be seen that they consist of small loops in almost all cases. The observed higher brightness temperatures of coronal bright points in the ALMA map at 1.21 mm is due to the locally increased temperature and density in these loops.
In present work we analyzed a full disc solar ALMA map and performed a detailed comparison of this map with solar images obtained in other relevant wavelength ranges. The detectability of various solar features was checked in both directions (an identification of solar structures known at other wavelengths in the ALMA image and an identification of prominent ALMA structures in images at other wavelengths). It was found that the ALMA image was oriented correctly and that the procedure of overlay and co-align the ALMA image with other images was performed properly. In subsequent papers we compare the observational results from this paper with the theoretical models (Paper II) and later investigate chromospheric fine structure in more detail using ALMA interferometric measurements.
Acknowledgements.
Research leading to this work was performed within ESO Development Plan Study: Solar Research with ALMA (2014 - 2017). This work has been supported in part by Croatian Science Foundation under the project 6212 ”Solar and Stellar Variability” and by the European Commission FP7 project SOLARNET (312495, 2013 - 2017), which is an Integrated Infrastructure Initiative (I3) supported by FP7 Capacities Programme. This paper makes use of the following ALMA data: ADS/JAO.ALMA#2011.0.00020.SV. ALMA is a partnership of ESO (representing its member states), NSF (USA) and NINS (Japan), together with NRC (Canada) and NSC and ASIAA (Taiwan), and KASI (Republic of Korea), in cooperation with the Republic of Chile. The Joint ALMA Observatory is operated by ESO, AUI/NRAO and NAOJ. We are grateful to the ALMA project for making solar observing with ALMA possible. SDO is the first mission launched for NASA´s Living With a Star (LWS) Program. This work utilizes GONG data obtained by the NSO Integrated Synoptic Program (NISP), managed by the National Solar Observatory, the Association of Universities for Research in Astronomy (AURA), Inc. under a cooperative agreement with the National Science Foundation. The data were acquired by instrument operated by the Cerro Tololo Interamerican Observatory. The National Radio Astronomy Observatory is a facility of the National Science Foundation operated under cooperative agreement by Associated Universities, Inc. The authors would like to thank T. Bastian, the PI of the North American ALMA Solar Development Plan under which much of the testing and commissioning work was coordinated. SW acknowledges support by the SolarALMA project. This project has received funding from the European Research Council (ERC) under the European Union´s Horizon 2020 research and innovation programme (grant agreement No. 682462). The trip of YY to 2015 ALMA Solar Campaign was partially supported by NSFC grant 11433006. MS was supported by JSPS KAKENHI Grant Number JP17K05397. Finally, the authors would like to thank R. Hills, K. Iwai, and M. Loukitcheva for helpful comments and suggestions.References
- Alissandrakis et al. (2017) Alissandrakis, C. E., Patsourakos, S., Nindos, A., & Bastian, T. S. 2017, A&A, 605, A78
- Bastian (1995) Bastian, T. S. 1995, in Infrared tools for solar astrophysics: What’s next?, ed. J. R. Kuhn & M. J. Penn, 115
- Bastian (2002) Bastian, T. S. 2002, Astronomische Nachrichten, 323, 271
- Bastian et al. (2015) Bastian, T. S., Barta, M., Brajša, R., et al. 2015, IAU General Assembly, 22, 2257295
- Bastian et al. (1993a) Bastian, T. S., Ewell, Jr., M. W., & Zirin, H. 1993a, ApJ, 418, 510
- Bastian et al. (1993b) Bastian, T. S., Ewell, Jr., M. W., & Zirin, H. 1993b, ApJ, 415, 364
- Benz (2009) Benz, A. O. 2009, Landolt Börnstein, 4116
- Benz et al. (1997) Benz, A. O., Krucker, S., Acton, L. W., & Bastian, T. S. 1997, A&A, 320, 993
- Brajša (1993) Brajša, R. 1993, Sol. Phys., 144, 199
- Brajša et al. (2007a) Brajša, R., Benz, A. O., Temmer, M., et al. 2007a, Sol. Phys., 245, 167
- Brajša et al. (2007b) Brajša, R., Benz, A. O., Temmer, M., et al. 2007b, Central European Astrophysical Bulletin, 31, 219
- Brajša et al. (2009) Brajša, R., Romštajn, I., Wöhl, H., et al. 2009, A&A, 493, 613
- Brajša et al. (1994) Brajša, R., Ruždjak, V., Vršnak, B., et al. 1994, Hvar Observatory Bulletin, 18, 9
- Brajša et al. (1992) Brajša, R., Vršnak, B., Ruždjak, V., et al. 1992, Hvar Observatory Bulletin, 16, 1
- Brajša et al. (2002) Brajša, R., Wöhl, H., Vršnak, B., et al. 2002, A&A, 392, 329
- Brajša et al. (2004) Brajša, R., Wöhl, H., Vršnak, B., et al. 2004, A&A, 414, 707
- Carlsson & Stein (1992) Carlsson, M. & Stein, R. F. 1992, ApJ, 397, L59
- Carlsson & Stein (1995) Carlsson, M. & Stein, R. F. 1995, ApJ, 440, L29
- Carlsson & Stein (1997) Carlsson, M. & Stein, R. F. 1997, ApJ, 481, 500
- Carlsson & Stein (2002) Carlsson, M. & Stein, R. F. 2002, ApJ, 572, 626
- Chiuderi & Chiuderi Drago (1991) Chiuderi, C. & Chiuderi Drago, F. 1991, Sol. Phys., 132, 81
- Chiuderi Drago (1990) Chiuderi Drago, F. 1990, in Lecture Notes in Physics, Berlin Springer Verlag, Vol. 363, IAU Colloq. 117: Dynamics of Quiescent Prominences, ed. V. Ruždjak & E. Tandberg-Hanssen, 70
- Chiuderi Drago et al. (1983) Chiuderi Drago, F., Kundu, M. R., & Schmahl, E. J. 1983, Sol. Phys., 85, 237
- Chuideri Drago et al. (1992) Chuideri Drago, F., Engvold, O., & Jensen, E. 1992, Sol. Phys., 139, 47
- Engvold (1994) Engvold, O. 1994, in IAU Colloq. 144: Solar Coronal Structures, ed. V. Rusin, P. Heinzel, & J.-C. Vial, 297
- Fontenla et al. (1993) Fontenla, J. M., Avrett, E. H., & Loeser, R. 1993, ApJ, 406, 319
- Gary (1996) Gary, D. E. 1996, in Astronomical Society of the Pacific Conference Series, Vol. 93, Radio Emission from the Stars and the Sun, ed. A. R. Taylor & J. M. Paredes, 387
- Gopalswamy et al. (1999) Gopalswamy, N., Shibasaki, K., Thompson, B. J., Gurman, J., & DeForest, C. 1999, J. Geophys. Res., 104, 9767
- Habbal & Harvey (1988) Habbal, S. R. & Harvey, K. L. 1988, ApJ, 326, 988
- Harvey-Angle (1993) Harvey-Angle, K. L. 1993, PhD thesis, , Utrecht University, The Netherlands, (1993)
- Hiei et al. (1986) Hiei, E., Ishiguro, M., Kosugi, T., & Shibasaki, K. 1986, NASA Conf. Publ., 2442, 109
- Iwai et al. (2016) Iwai, K., Koshiishi, H., Shibasaki, K., et al. 2016, ApJ, 816, 91
- Iwai & Shimojo (2015) Iwai, K. & Shimojo, M. 2015, ApJ, 804, 48
- Iwai et al. (2017) Iwai, K., Shimojo, M., Asayama, S., et al. 2017, Sol. Phys., 292, 22
- Kallunki & Uunila (2017) Kallunki, J. & Uunila, M. 2017, Astronomische Nachrichten, 338, 398
- Karlický et al. (2011) Karlický, M., Bárta, M., Da̧browski, B. P., & Heinzel, P. 2011, Sol. Phys., 268, 165
- Kobelski & ALMA Solar Development Team (2016) Kobelski, A. & ALMA Solar Development Team. 2016, in Astronomical Society of the Pacific Conference Series, Vol. 504, Coimbra Solar Physics Meeting: Ground-based Solar Observations in the Space Instrumentation Era, ed. I. Dorotovic, C. E. Fischer, & M. Temmer, 327
- Kosugi et al. (1986) Kosugi, T., Ishiguro, M., & Shibasaki, K. 1986, PASJ, 38, 1
- Kundu et al. (1978) Kundu, M. R., Fuerst, E., Hirth, W., & Butz, M. 1978, A&A, 62, 431
- Kundu & Liu (1976) Kundu, M. R. & Liu, S.-Y. 1976, Sol. Phys., 49, 267
- Kundu & McCullough (1972) Kundu, M. R. & McCullough, T. P. 1972, Sol. Phys., 24, 133
- Kundu et al. (1994) Kundu, M. R., Shibasaki, K., Enome, S., & Nitta, N. 1994, ApJ, 431, L155
- Lindsey & Kopp (1995) Lindsey, C. & Kopp, G. 1995, ApJ, 453, 517
- Loukitcheva et al. (2004) Loukitcheva, M., Solanki, S. K., Carlsson, M., & Stein, R. F. 2004, A&A, 419, 747
- Loukitcheva et al. (2015) Loukitcheva, M., Solanki, S. K., Carlsson, M., & White, S. M. 2015, A&A, 575, A15
- Loukitcheva et al. (2006) Loukitcheva, M., Solanki, S. K., & White, S. 2006, A&A, 456, 713
- Loukitcheva et al. (2014) Loukitcheva, M., Solanki, S. K., & White, S. M. 2014, A&A, 561, A133
- Loukitcheva et al. (2008) Loukitcheva, M. A., Solanki, S. K., & White, S. 2008, Ap&SS, 313, 197
- Nitta et al. (1992) Nitta, N., Bastian, T. S., Aschwanden, M. J., Harvey, K. L., & Strong, K. T. 1992, PASJ, 44, L167
- Phillips et al. (2015) Phillips, N., Hills, R., Bastian, T., et al. 2015, in ASP Conf. Ser., Vol. 499, Revolution in Astronomy with ALMA: The Third Year, ed. D. Iono, K. Tatematsu, A. Wootten, & L. Testi, 347
- Pohjolainen (2000) Pohjolainen, S. 2000, A&A, 361, 349
- Pohjolainen et al. (2000) Pohjolainen, S., Portier-Fozzani, F., & Ragaigne, D. 2000, A&AS, 143, 227
- Pohjolainen & Urpo (1997) Pohjolainen, S. & Urpo, S. 1997, in ESA Special Publication, Vol. 404, Fifth SOHO Workshop: The Corona and Solar Wind Near Minimum Activity, ed. A. Wilson, 619
- Pohjolainen et al. (1991) Pohjolainen, S., Urpo, S., Terasranta, H., et al. 1991, Hvar Observatory Bulletin, 15, 21
- Raoult et al. (1979) Raoult, A., Lantos, P., & Fuerst, E. 1979, Sol. Phys., 61, 335
- Riehokainen et al. (1998) Riehokainen, A., Urpo, S., & Valtaoja, E. 1998, A&A, 333, 741
- Schmahl et al. (1981) Schmahl, E. J., Bobrowsky, M., & Kundu, M. R. 1981, Sol. Phys., 71, 311
- Silva et al. (2005) Silva, A. V. R., Laganá, T. F., Gimenez Castro, C. G., et al. 2005, Sol. Phys., 227, 265
- Sudar et al. (2015) Sudar, D., Skokić, I., Brajša, R., & Saar, S. H. 2015, A&A, 575, A63
- Tandberg-Hanssen (1995) Tandberg-Hanssen, E., ed. 1995, Astrophysics and Space Science Library, Vol. 199, The nature of solar prominences
- Tapping & Harvey (1994) Tapping, K. F. & Harvey, K. L. 1994, in Poster Proceedings from IAU Colloquium 143: The Sun as a Variable Star: Solar and Stellar Irradiance Variations, ed. J. M. Pap, C. Frohlich, H. S. Hudson, & S. K. Solanki, 181
- Urpo & Pohjolainen (1987) Urpo, S. & Pohjolainen, S. 1987, Hvar Observatory Bulletin, 11, 137
- Vernazza et al. (1981) Vernazza, J. E., Avrett, E. H., & Loeser, R. 1981, ApJS, 45, 635
- Vršnak et al. (1992) Vršnak, B., Pohjolainen, S., Urpo, S., et al. 1992, Sol. Phys., 137, 67
- Wedemeyer et al. (2015) Wedemeyer, S., Bastian, T., Brajša, R., et al. 2015, Advances in Space Research, 56, 2679
- Wedemeyer et al. (2016) Wedemeyer, S., Bastian, T., Brajša, R., et al. 2016, Space Science Reviews, 198, 1
- Wedemeyer-Böhm et al. (2007) Wedemeyer-Böhm, S., Ludwig, H. G., Steffen, M., Leenaarts, J., & Freytag, B. 2007, A&A, 471, 977
- White et al. (2017) White, S. M., Iwai, K., Phillips, N., et al. 2017, Sol. Phys., 292, 88
- White et al. (2006) White, S. M., Loukitcheva, M., & Solanki, S. K. 2006, A&A, 456, 697