On Analyzing Job Hop Behavior and Talent Flow Networks
Abstract
Analyzing job hopping behavior is important for the understanding of job preference and career progression of working individuals. When analyzed at the workforce population level, job hop analysis helps to gain insights of talent flow and organization competition. Traditionally, surveys are conducted on job seekers and employers to study job behavior. While surveys are good at getting direct user input to specially designed questions, they are often not scalable and timely enough to cope with fast-changing job landscape. In this paper, we present a data science approach to analyze job hops performed by about 490,000 working professionals located in a city using their publicly shared profiles. We develop several metrics to measure how much work experience is needed to take up a job and how recent/established the job is, and then examine how these metrics correlate with the propensity of hopping. We also study how job hop behavior is related to job promotion/demotion. Finally, we perform network analyses at the job and organization levels in order to derive insights on talent flow as well as job and organizational competitiveness.
I Introduction
Job hop is a common behavior observed in any workforce. As a person hops from jobs to jobs, he or she acquires new skills and potentially gains higher income. Every job hop captures an important decision made by the person as well as an attempt of the hiring organization to acquire talent. When job hop behavior is analyzed at the workforce level, it will yield insights about the workforce, job pool and employers.
Such insights have been traditionally obtained using surveys on employers and job seekers. For example, the US Bureau of Labor Statistics (BLS) conducts annual surveys with approximately 146,000 businesses and government agencies to collect employment data111www.bls.gov/ces/. The surveys yield useful information about job demand, job supply, income, working hours, etc.. While surveys can be a powerful instrument to gather direct user input, they are usually not scalable. In the case of the BLS surveys, they cover less than of all U.S businesses. Moreover, as fast-changing technologies (such as sharing economy [1]) begin to impact job demand quickly, it is critical to explore new ways to obtain job related insights.
Past studies [2, 3] also tend to study jobs and organizations as isolated entities, without considering them as connected networks which capture talent flows from jobs to jobs and from organizations to other organizations. A lack of this network view prevents us from analyzing the ways people build their career, and competition among organizations for talent. For example, some job changes could be promotions, while others could just be lateral and even demotions. The network view is also crucial in studying the competitions among jobs and organizations that eventually impact job creation and talent attraction.
In contrast, online professional networks (OPNs) are fast becoming a marketplace for resume posting, candidate hunting, and job searching. Representative examples of OPN are LinkedIn, Xing and Viadeo222LinkedIn – www.linkedin.com; Xing – www.xing.com; Viadeo – www.viadeo.com. A lot of detailed job activity data at the individual user level are now publicly available in the OPNs, as soon as the users update their profiles. These data can be analyzed to derive interesting behavioral insights about jobs and organizations, as well as to build services that can benefit both employers and job seekers, e.g., a service that helps employers find suitable employees and job seekers find suitable jobs.
Objectives. In this work, we therefore focus on using data from one of the world’s largest OPNs to analyze job hops and talent flow. To support our analyses on hops within an organization and those involving different organizations, we first develop several metrics that measure the amount of experience is required for every job and its age, from the perspective of people holding the job.
We also aim at studying how the job hop behavior of a workforce is related to job promotion/demotion. This is a topic often discussed based on anecdotal examples [4, 5]. A better approach is to conduct a large-scale data analytics study. This will give much broader insights on job hop patterns particularly useful in human resource recruitment and career coaching.
Finally, our research aims at analyzing talent flow based on job hop behavior and measuring the capabilities of each job and organization in attracting, supplying, and competing for human capital. To this end, we create a weighted directed hop network among jobs and organizations, develop different centrality measures for the job and organization nodes, and evaluate them by manual inspection or by comparing with other attributes such as organization size.
Contributions. We summarize our key contributions as follows:
-
•
We present a new empirical study on job hops involving a city-scale workforce sharing data on an OPN. Unlike past survey works [6, 7, 8, 9, 2, 10] and more recent data-oriented studies [11, 12, 13, 14, 15], our work offers broader analysis that is not constrained to specific workforce segments or industries.
-
•
We develop a data analytics methodology for analyzing job hops, in which we measure the work experience requirement and recency/establishment of a job as well as how they relate to the propensity of hopping. Based on these measures, we also quantify the level gain of a hop, which allows us to analyze job promotion/demotion in relation to hops within and across organizations.
-
•
We analyze talent flow across jobs and companies by constructing job-level and organization-level hop networks respectively. We develop and evaluate several centrality metrics that measure the extent to which jobs and organizations attract, supply and compete for human capital.
II Related Work
Research on job and workforce movements has been around for decades [6, 7, 8, 9, 2]. Topel et al. [6] analyzed years of job changing and wage growth of young men from Longitudinal Employee-Employer data. Long et al. [7] studied the labor mobility in Europe and the U.S. Moscarini et al. [8] measured worker mobility across occupations and jobs in the monthly Current Population Survey data from 1979 to 2006. More recent survey-based studies [9, 2, 10] have revealed that the younger employees are more likely to switch jobs and employers/companies than the older ones. All these studies traditionally relied on surveys, census, and other data such as tax lists and population registers, which require extensive and time-consuming efforts to collect. Moreover, the findings are usually biased to selected workforce segments or industries, and cannot be easily scaled up or replicated in other segments/industries.
With the wide adoption of OPNs, there is a rapidly-growing interest to mine the online user data from the OPNs to understand job and workforce movements as well as career growth. For example, State et al. [16] analyzed the migration trends of professional workers into the U.S. Xu et al. [15] combined work experiences from OPNs and check-in records from location-based social networks to predict job change occasions. Chaudhury et al. [14] analyzed the growth patterns of the ego-network of new employees in companies.
An important aspect in OPNs is job hop. Job hop data capture a wide range of signals that can help understand the performances of organizations, talent sources, job market, professional profiles, as well as career advancement. Cheng et al. [17] modeled job hop activities to rank influential companies. Xu et al. [11] generated and analyzed job hop networks to identify talent circles. Kapur et al. [12] devised the Talent Flow Graph to rank universities based on the career outcomes of their graduates. They applied their approach to two specific workforce segments: investment banker and software developer.
Users’ career paths have also been utilized to model professional similarity for use in job recruitment process [18]. In this work, a sequence alignment method was used to quantify similarity between two career paths. Liu et al. [13] devised a multi-source learning framework that combines information from multiple social networks to predict the career path of a user. Their work focused on four job categories: software engineer, sales, consultant, and marketing.
Our research. The work presented in this paper differs from the above-mentioned works in several unique ways. Firstly, we introduce quantitative metrics to measure how much work experience is required to take up a job and how recent/established a job is, and examine their relationships with the propensity of hopping. Secondly, we compute the level gain of job hops so as to analyze promotion/demotion of employees which, to our best knowledge, has been missing in the previous studies. Finally, we perform an extensive study on talent flow and competition by analyzing both job-level and organization-level hop networks, without restricting ourselves to specific workforce segments or industries.
III Analytics Methodology
III-A Data Harvesting
In this work, we study the job hop data extracted from one of the largest OPNs. Such data are not generally available and technically challenging to gather. To give a meaningful scope to our study within some resource constraint, we decide to cover all public profiles of the OPN users located in a target city within the First World economy. The data was collected around June . Specifically, the data consist of (1) all public user profiles that found in the directory of users associated with the target city, and (2) organization profiles that are mentioned in these public user profiles. In our study, we focus on active profiles, defined as user profiles with least one entry in the education and skills fields. Table I summarizes the data statistics.
It is worth noting that, while our dataset covers a comprehensive set of user profiles, it may still suffer from population bias [19]. That is, the data does not necessarily capture all sorts of occupations. Our dataset, for instance, may leave out blue-collar/non-technical workers who do not use social media. Nevertheless, our OPN data are arguably representative of all professionals, managers, executives and technicians (PMET), who increasingly make up the majority of working population in a developed city economy.
| Statistics | Value |
|---|---|
| No. of user profiles | 2,574,502 |
| No. of active user profiles | 490,200 |
| No. of organizations | 145,524 |
| No. of industries | 147 |
To facilitate data collection, we devise a data crawler that performs two steps to collect the URLs of public user profiles and organization profiles from the OPN website. Firstly, we collected all user profile URLs from the user directory of the target city. We then crawled the content of each user profile using the collected profile URLs. Note that our crawler does not capture users’ online friends nor wall posts. Finally, while crawling the user profiles, the organization URLs found in each user profile are collected and used to crawl the organization profiles (pages).
III-B Notations and Definitions
We derive job hops from job history in the user profiles. We first denote a job as a tuple , which means a job title at organization in industry . Note that each organization belongs to a unique industry . We then define a hop as a transition from one job to another with non-overlapping time period.
Based on the above, we further distinguish between two types of hop:
-
•
External hop. This is defined as a move from one job to another job, where the source and destination organizations are different. Formally, an external hop is a hop from job to job where . Here the source job title can be either the same as or different from the destination job title .
-
•
Internal hop. This refers to a move from one job to another, where the source and destination organizations are the same. That is, an internal hop is a hop from job to job where . To avoid duplicates (e.g., a person may state three times that (s)he is a Civil Engineer at organization X, as (s)he has worked on three construction projects under the same organization), however, we add a constraint . As such, a move from to where and is not counted as a (valid) internal hop.
III-C Hop Graph Construction
After establishing the job hops for all user profiles in our OPN data, we construct two types of weighted directed graphs to facilitate our analyses, namely: (1) job hop graph and (2) organization hop graph. Each node in the job hop graph (or simply, job graph) represents a job title in industry , while a node in the organization hop graph (or simply, organization graph) refers to a organization .
For the job graph, a directed edge is created from node to node if there is at least one person moving from a (job title,industry) pair to another pair . We also capture the number of user profiles moving from to as the edge weight . The same applies to the organization graph, i.e., the edge weight represents the number of users moving from an organization to another organization .
Finally, to handle noise due to data sparsity (e.g., unusual/spurious job titles or organizations), we define a minimum support threshold for each node in the job graph and organization graph. Nodes with the number of users less than the minimum support will be removed from both graphs. Unless explicitly specified, we shall use the default minimum support of users in our empirical study.
III-D Key Metrics
In our study, we want to tell how much career advancement people make in their jobs. We therefore need to first estimate the experience of a person holding a job. Secondly, to determine changes of job market over time, we need to estimate how long a job has existed. To fulfill the two goals, we introduce the following key metrics respectively, which are applied to active user profiles (as defined in Section III-A):
-
•
Work experience: This refers to the duration since the last graduation date of a person till the time at which (s)he finishes a particular job. For a person with job title at organization , the work experience is:
(1) where denotes the last graduation date mentioned in his profile.
For a given job title from industry , the work experience of the (job title, industry) pair is therefore:
(2) Examples of job with high score according to our data are “Professor”, “Managing Director”, and “CEO”, whereas examples of job with low score are “Intern” and “Teaching Assistant”.
-
•
Job age: This is the duration from the start of a given job until the current date . It measures how recent or established a job is from the perspective of a person holding the job. For a person with job title at organization , the job age is defined as:
(3) where refers to the start date of the person ’s job title at organization of industry . For a given job title from industry , the age of the (job title, industry) pair is therefore:
(4) Examples of job with high score based on our data are “Director”, “Systems Engineer”, and “Division Manager”, whereas examples of job with low are “Data Scientist” and “Media Analyst”.
Based on the above metrics, we further derive several higher-level metrics by aggregating over user profiles at either the job or organization level, as follows:
-
•
External hop fraction: The fraction of people who move out from a organization to a different organization over the (total) people hopping from organization . Formally, for a given group of users (e.g., work experience, job age, or skill count group), the external hop fraction is:
(5) where is the set of all user profiles belonging to group who perform external hops from some arbitrary organizations to different organizations . Conversely, is the set of user profiles belonging to group who perform internal hop within the same organization .
-
•
Job level: As different organizations offer jobs of different rewards and seniority levels (even for the same job titles), we want to be able to measure them. Since our data do not carry any salary information, we estimate the seniority level of a job by computing the average work experience over all users who mention job title at organization in their profiles as follows:
(6) where is the set of all people who include job in their profiles. In the equation, can be inferred from . Intuitively, a job with longer average work experience implies that a longer time is required to achieve that position, and hence we can expect it to be a high-level job (e.g., CEO of a multi-national organization).
-
•
Level gain: This refers to the difference between the levels of two jobs within the same or different companies. A positive level gain can be loosely interpreted as a “promotion”, whereas a negative level gain loosely implies a “demotion”. Here the “promotion” (“demotion”) does not necessarily mean a monetary increase (decrease), but more of an increase (decrease) in the level of work experience required. Formally, the level gain for hop from job to job is given by:
(7) We note that, although there is no ground truth available in our OPN data, our manual inspections show that the level gain provides a reasonable proxy for a promotion or demotion. It is also worth mentioning that we do not find zero level gain (i.e., neither “promotion” or “demotion”) in our data.
We next introduce network centrality metrics to measure node importance in both job and organization graphs.
-
•
In-degree centrality. This metric refers to the number of inbound (unweighted) edges for a node in the job or organization graph. The in-degree centrality can be interpreted as a measure of how prominent a job (or organization) is in a local sense—a high in-degree may imply that it attract talents from the immediate in-neighbors. For this metric, we do not take into account the edge weight information (i.e., the total number of incoming user profiles), as we want to minimize the support bias due to a large number of users for a given job (organization).
-
•
Out-degree centrality. This is defined as the number of outbound (unweighted) edges for a node in the job or organization graph. We can use the out-degree centrality to measure how influential a job (or organization) is in a local sense—a high out-degree may be indicative of a talent supplier to the immediate out-neighbors. Again, we do not utilize the edge weight to compute this metric, so as to mitigate the support bias.
-
•
PageRank centrality. This is a well-known metric originally used to rank web pages [20]. PageRank views inbound edges as “votes”, and the key idea is that “votes” from important nodes should carry more weight than “votes” from less important nodes. In this work, we employ a weighted version of PageRank [21], whereby the transition probabilities for each (source) node is proportional to the (out-)edge weights divided by the weighted out-degree of the node. In the context of job and organization graphs, the weighted PageRank can be viewed as a measure of global competitiveness—a job or organization with high PageRank reflects a “desirable” destination point where the flow of talent is heading to. In this case, we use edge weight as the hop volume matters in determining where the flow goes to. To avoid dead ends (i.e., nodes with zero out-degree), we also allow our PageRank to perform random jump with the default “teleportation” probability of .
IV Results and Insights
In this section, we present our empirical findings and analyses, based on the methodology and metrics described in Section III.
IV-A Distribution Analysis
We first examine the distributions of several basic metrics, including skill count, work experience, and job age. We found that the active user profiles most commonly have – skills. The anomaly at skills is due to the fact that our OPN imposes a maximum limit of skills per user profile. Secondly, most jobs consist of young workforce, who have work experience of years or less. Most users in our OPN data are relatively young in terms of work experience. These could be due to the younger users showing more interest in using OPN to conduct professional networking. On the other hand, there are only very few people who have worked for over years. Here the most common work experience (i.e., the mode) is years.
Finally, most jobs have been established for year or more. On the other hand, only very few jobs have been established for more than years. As with work experience, the most common job age is years. The relatively young job age can be explained partly by the young user base, and partly by the sparsity of old but senior-level jobs. From the labor economics perspective, the findings also suggest attention to be given to identifying and creating more senior jobs to support an ageing workforce.
IV-B External Hop Analysis
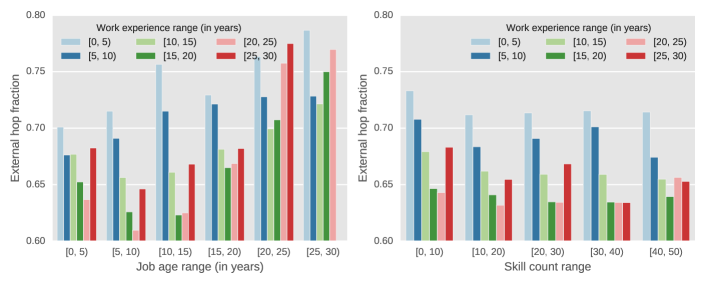
It is also interesting to see how the external hop fraction (cf. Equation 5) varies with different combinations of job age, work experience, and skill count groups. Figure 1 summarizes the results, whereby we set the minimum support of for each bar in the plots. The left chart of Figure 1 reveals two insights:
-
•
External hop fraction vs users’ work experience. For all job age groups under years, younger workforce (with shorter work experience) is more likely to leave their jobs for other organizations than more experienced people. An exception here is people with years of work experience, whereby the external hop fraction shoots up. Again, these refer to very seasoned people (e.g., Director) whose skills are versatile and can freely hop to different organizations. For the job age groups of years, we can see more profound increase in the external hop fractions for people with work experience of years333We do not show the work experience range in the rightmost bar group of Figure 1 (left chart), since the number of support is less than .. These may reflect the tipping points for the seasoned workforce to find new job opportunities outside. Further investigation into this phenomenon is therefore an interesting future work.
-
•
External hop fraction vs job age. Comparisons can also be made among the external hop fractions for the same work experiences across different job age groups (i.e., bars of the same color). We can see that the external hop fraction tends to increase as the job age increases (i.e., more established jobs). This suggests that the older jobs are more likely to see competitions for human capital in general, and so it is more preferable to take up newer, trendier jobs.
External hop fraction vs number of skills. Next, we wish to answer the question of whether more skills lead to higher external hops. The right chart of Figure 1 shows that, within each skill count group, younger people with less work experiences are more likely to move out to other organizations—except again for the very seasoned people with work experience of years. We note that this finding is consistent with that of several earlier works [6, 2, 10]. Nonetheless, we do not see a clear association between the external hop fraction and the number of skills people have. That is, the propensity to hop out has little to do with the diversity of skills that people have.
| Promotion | Demotion | Total | |
|---|---|---|---|
| External hop | 4,813 | 1,720 | 6,533 |
| Internal hop | 3,891 | 387 | 4,278 |
| Total | 8,704 | 2,107 | 10,811 |
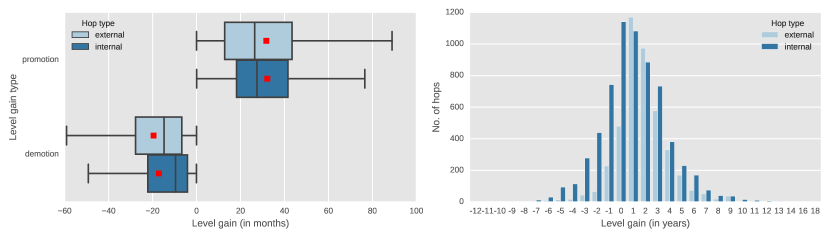
IV-C Promotion and Demotion Analysis
As promotion is often a cited reason for people leaving one job for another. We now conduct a promotion and demotion analysis by dividing the hops into external and internal hops based on level gain (i.e., promotion vs. demotion). Table II and Figure 2 summarize the results. To get a reliable estimate of level gain, and thus reliable “promotion” or “demotion” labels, we require both source and target jobs for each hop must fulfill the (default) minimum support of . As such, we do not include in Table II and Figure 2 hops that fail to meet the minimum support.
From Table II, we can derive two conclusions:
-
•
Firstly, the probability of promotion is greater than that of demotion, i.e., is greater than .
-
•
Secondly, people are more likely to get promoted due to internal hops than getting promoted due to external hops. That is, is greater than .
Figure 2 shows a more fine-grained detail in terms of the level gain distribution. It is evident that the majority of the level gain values are positive, again suggesting that hopping most likely involves promotion rather than demotion (i.e., ). However, we do not find clear differences between external and internal hops in terms of the level gain distribution. This observation is similar to the findings in [5].
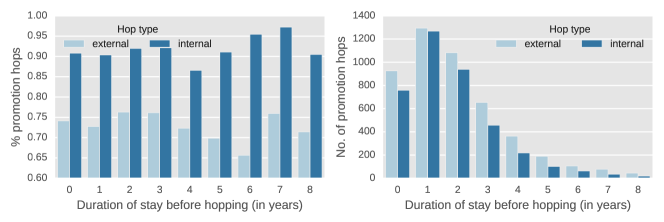
In addition, we investigate whether promotion hops vary with the duration of stay (at some job) before hopping. Figure 3 shows the promotion hop fractions (i.e., and ) as well as promotion hop counts as a function of duration of stay prior to hopping. For these plots, we also set the minimum support threshold to filter out unreliable statistics. The right chart of Figure 3 suggests that promotion hops most commonly happen after a person works for – years. However, the left chart of Figure 3 indicates no obvious relationship between the duration of stay and promotion hop fraction. Regardless, it is again evident that the probability of promotion is higher for internal hops than for external hops.
IV-D Network Analysis
| Metric | Job graph | Organization graph |
|---|---|---|
| Basic | ||
| No. of nodes | 27,451 | 6,139 |
| No. of edges | 93,283 | 173,993 |
| Sparsity of adjacency matrix | 0.01% | 0.46% |
| Strongly connected component | ||
| No. of SCCs | 15,455 | 415 |
| Size of the largest SCC | 11,950 (43.53%) | 5,725 (93.26%) |
| Size of the 2nd-largest SCC | 4 (0.01%) | 1 (0.02%) |
| Weakly connected component | ||
| No. of WCCs | 882 | 15 |
| Size of the largest WCC | 25,747 (93.79%) | 6,125 (99.77%) |
| Size of the 2nd-largest WCC | 13 (0.05%) | 1 (0.02%) |
| SCC = strongly-connected component, WCC = weakly-connected component | ||
Network structure analysis. In this section, we analyze the job hop behavior at the network level, which includes job and organization graphs (cf. Section III-C). The basic statistics of the job and organization graphs are summarized in Table III. We can conclude that both graphs are sparse in general, having small number of edges relative to the squared number of nodes. We also examine the connectedness of the graphs by looking at the strongly-connected component (SCC) and weakly-connected component (WCC) metrics. The former checks for connectedness by following the directionality of the graph edges, whereas the latter ignores the directionality. Overall, the results in Table III indicate that there exists a giant component for both job and organization graphs, and its size is significantly bigger than the second largest component. As such, we can conclude that our job and organization graphs are fairly well-connected, in the sense that there exists a path between any two nodes within the giant components.
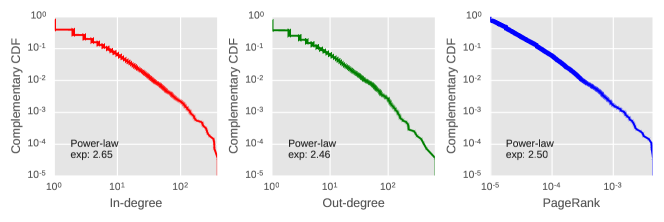
With the connectedness trait validated, we now examine the centrality properties of the nodes in our hop graphs. Figure 4 presents the complementary cumulative distribution functions (CDFs) of the in-degree, out-degree, and PageRank centralities (cf. Section III-D) for the job graph. It is shown that all three metrics exhibit heavy-tail, skewed distribution. We performed power-law fitting and obtained exponent terms of greater than for all graphs, thereby indicating a scale-free phenomenon. Similar result was obtained for the organization graph, although the results are not shown here due to space constraint.
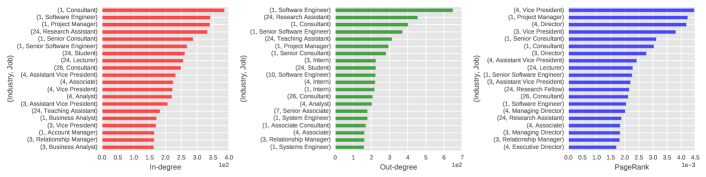
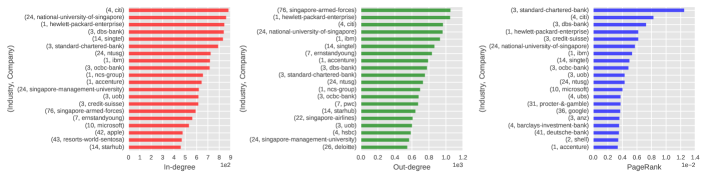
Job centrality analysis. Next, we evaluate the top nodes having the highest centrality values in the job-level and organization-level graphs, as shown in Figures 5 and 6 respectively. The results provide several interesting insights. For the job graph, we find that the top in-degree, out-degree and PageRank jobs are overall dominated by major industries444Major industry codes: Information Technology and Services, Banking, Financial Services, Computer Software, Higher Education, Management Consulting. From the left chart of Figure 5, we can see that the top in-degree nodes refer to those popular jobs in major industries that attract talents. Meanwhile, the middle chart of Figure 5 suggests that the top out-degree jobs are those that involve versatile skills (e.g., software engineer, consultant) or interim roles (e.g., intern). People having these jobs may thus be able to move to more diverse range of jobs/organizations (i.e., talent supplier). Finally, the right chart of Figure 5 reveals that the top PageRank nodes refer to high-level, managerial jobs (e.g., Director, Manager, Vice President). This conforms with our intuition about PageRank as a measure of the desirability of a job (cf. Section III-D).
V Conclusion
In this paper, we put forward a data analytics approach to study job hops at a large scale using data from a city state’s OPN. Our study leads to a few key takeaways. Firstly, from our distribution analyses, we discovered that: (1) younger workforce with less work experience is more likely to move out to other companies than more experienced ones, except for very seasoned people; (2) the propensity to switch jobs to other organizations is higher for older jobs, which are more likely to see competitions for human capital than the newer ones; and (3) job hops involve promotions more likely than demotions, and people are more likely to get promoted due to internal hops than getting promoted due to external hops; Secondly, from our hop network analyses, we found that: (1) top in-degree job (organization) nodes are prominent jobs (companies) that attract talents, whereas top out-degree job (organization) nodes are influential jobs (organizations) that supply talents; and (2) job (organization) nodes with high PageRank refer to desirable, major jobs (organizations) that are well-known for providing good career offering.
The findings from this paper lead to a few possibilities. Firstly, we demonstrate that it is possible to repurpose the career histories of OPN profiles to study the job hop patterns of workforce within a city or country. This vastly improves the scale and granularity of job hop study which was traditionally done using surveys. Through our analysis, we show that the propensity to perform job hops is relatively higher among the young workforce than the older one. This could lead to two main concerns, namely: (i) the limited time to acquire adequate skills on the job among the young employees; and (ii) the unwillingness of companies to provide them skill training. These concerns may cost the workforce long-term’s skill development and productivity. To overcome these concerns, more incentives may be introduced to encourage young employees to stay longer on their jobs. One could also increase the chance of job promotions among the younger employees.
Our analysis also shows that job and organization graphs are well connected. We further define job centrality measures to determine attractive jobs and companies. Such measures allow jobs and companies to be ranked for applicants’ reference during job search. These measures can also further refined to find attractive jobs and companies in specific industry domains.
Acknowledgement
This research is supported by the Singapore National Research Foundation under its International Research Centre@Singapore Funding Initiative and administered by the IDM Programme Office, Media Development Authority (MDA).
References
- [1] J. Hamari, M. Sjöklint, and A. Ukkonen, “The sharing economy: Why people participate in collaborative consumption,” Journal of the Association for Information Science and Technology, 2015.
- [2] D. Joseph, W. F. Boh, S. Ang, and S. Slaughter, “The career paths less (or more) traveled: A sequence analysis of IT career histories, mobility patterns, and career success,” MIS Quarterly, vol. 36, no. 2, pp. 427–452, 2012.
- [3] C. Maier, S. Laumer, A. Eckhardt, and T. Weitzel, “Who really quits?: A longitudinal analysis of voluntary turnover among it personnel,” SIGMIS Database, vol. 46, no. 4, pp. 26–47, 2015.
- [4] J. Alper, “Job-hopping to greater career heights,” Science, vol. 265, no. 5180, pp. 1924–1925, 1994.
- [5] M. Hamori, “Job-hopping to the top and other career fallacies,” Harvard Business Review, vol. 88, no. 7-8, pp. 154–157, 2010.
- [6] R. H. Topel and M. P. Ward, “Job mobility and the careers of young men,” National Bureau of Economic Research, Working Paper 2649, July 1988.
- [7] J. Long and J. Ferrie, “Labour mobility,” The Oxford Encyclopedia of Economic History, 2003.
- [8] G. Moscarini and K. Thomsson, “Occupational and job mobility in the US,” The Scandinavian Journal of Economics, vol. 109, no. 4, pp. 807–836, 2007.
- [9] S. Fuller, “Job mobility and wage trajectories for men and women in the united states,” American Sociological Review, vol. 73, no. 1, pp. 158–183, 2008.
- [10] D. Schawbel, “The cost of millennial retention study,” Millennial Branding, Tech. Rep., 2013.
- [11] H. Xu, Z. Yu, J. Yang, H. Xiong, and H. Zhu, “Talent circle detection in job transition networks,” in KDD, 2016.
- [12] N. Kapur, N. Lytkin, B.-C. Chen, D. Agarwal, and I. Perisic, “Ranking universities based on career outcomes of graduates,” in KDD, 2016.
- [13] Y. Liu, L. Zhang, L. Nie, Y. Yan, and D. S. Rosenblum, “Fortune teller: Predicting your career path,” in AAAI, 2016, pp. 201–207.
- [14] A. Chaudhury, M. Kim, and M. Tiwari, “Importance of first steps in a community for growth, diversity, and engagement,” in WWW, 2016, pp. 19–20.
- [15] H. Xu, Z. Yu, H. Xiong, B. Guo, and H. Zhu, “Learning career mobility and human activity patterns for job change analysis,” in ICDM, 2015, pp. 1057–1062.
- [16] B. State, M. Rodriguez, D. Helbing, and E. Zagheni, “Migration of professionals to the US: Evidence from LinkedIn data,” in SocInfo, 2014, pp. 531–543.
- [17] Y. Cheng, Y. Xie, Z. Chen, A. Agrawal, A. Choudhary, and S. Guo, “Jobminer: A real-time system for mining job-related patterns from social media,” in KDD, 2013, pp. 1450–1453.
- [18] Y. Xu, Z. Li, A. Gupta, A. Bugdayci, and A. Bhasin, “Modeling professional similarity by mining professional career trajectories,” in KDD, 2014, pp. 1945–1954.
- [19] A. Olteanu, C. Castillo, F. Diaz, and E. Kiciman, “Social data: Biases, methodological pitfalls, and ethical boundaries,” Available at SSRN: https://ssrn.com/abstract=2886526, 2016.
- [20] S. Brin and L. Page, “The anatomy of a large-scale hypertextual web search engine,” Computer Networks and ISDN systems, vol. 30, no. 1, pp. 107––117, 1998.
- [21] A. N. Langville and C. D. Meyer, “A survey of eigenvector methods for web information retrieval,” SIAM Review, vol. 47, no. 1, pp. 135–161, 2005.