Evidence of incoherent carriers associated with resonant impurity levels and their influence on superconductivity in the anomalous superconductor Pb1-xTlxTe
Abstract
We present a combined experimental and theoretical study of the evolution of the Fermi surface of the anomalous superconductor Pb1-xTlxTe as a function of thallium concentration, drawing on a combination of magnetotransport measurements (Shubnikov de Haas oscillations and Hall coefficient), Angle Resolved Photoemission Spectroscopy (ARPES), and density functional theory (DFT) calculations of the electronic structure. Our results indicate that for Tl concentrations beyond a critical value the Fermi energy coincides with resonant impurity states in Pb1-xTlxTe, and we rule out the presence of an additional valence band maximum at the Fermi energy. Through comparison to non-superconducting Pb1-xNaxTe we argue that the presence of these states at the Fermi energy provides the pairing interaction and thus also the anomalously high temperature superconductivity in this material.
Pb1-xTlxTe is a hole-doped narrow band-gap semiconductor that exhibits by far the highest known superconducting critical temperature, Tc, of any material of equivalent carrier density Ueno et al. (2011); Bustarret (2015). Superconductivity in very low density systems is in itself unexpected from the conventional phonon-mediated BCS theory of superconductivity, and has prompted discussion of a number of exotic pairing mechanisms. In n-doped SrTiO3, for example, non-adiabatic phonon pairing Gor’kov (2016a, b), pairing through the exchange of a plasmonic mode Takada (1980) or a soft optical phonon mode Appel (1969), pairing from quantum ferroelectric fluctuations Edge et al. (2015), and an enhancement of the density of states and/or pairing potential due to multi-band Fermi surface effects Lin et al. (2014); Binnig et al. (1980); Fernandes et al. (2013) have been proposed; whereas enhanced electronic correlations from multi-valley Fermi surface effects have been invoked to explain the recently discovered bulk superconductivity in Bismuth Cohen (1964); Prakash et al. (2017). The present case of superconductivity in PbTe, however, has the additional curiosity of occurring only when hole-doping is achieved by thallium (Tl) impurities Nemov and Ravich (1998); Kaidanov and Ravich (1985), which suggests that a unique property of the dopant may be key.
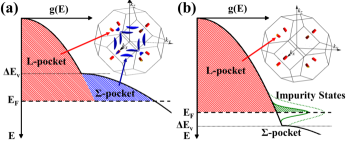
A number of experimental studies have inferred the presence of shallow impurity levels in the valence band of Pb1-xTlxTe Nemov and Ravich (1998). Density functional theory (DFT) calculations (appendix A) Ahmad et al. (2006a); Xiong et al. (2010a), using supercells containing 64 to 216 atoms, find that low levels of atomic substitution profoundly modify the band structure. Therefore, doping cannot be pictured as a rigid shift of the chemical potential. In the case of Tl, the valence of impurity states depend on the position of Fermi energy, . For large (small) hole concentrations, Tl3+ (Tl1+) is favored Xiong et al. (2010a). Interestingly, these distinct charge states become energetically degenerate when lies about 50 meV below the top of the valence band, as suggested by earlier heuristic arguments Nemov and Ravich (1998). Charge fluctuations associated with such resonant impurity states have been proposed as an alternative pairing interaction in Tl-doped PbTe Dzero and Schmalian (2005); Matsuura and Miyake (2012); Costi and Zlatić (2012), potentially accounting for the anomalously high and other normal state properties Matsushita et al. (2005, 2006). However, other scenarios are also possible, in particular a second (heavy) valence band maximum occurs at a similar energy in DFT calculations Giraldo-Gallo et al. (2016), raising the alternative view that additional pockets in the Fermi surface could produce a less exotic superconducting mechanism by increasing the density of states and/or providing additional inter-band scattering mechanisms Kaidanov and Ravich (1985). These two scenarios, illustrated in fig. 1, can be distinguished based on characterization of the low-energy electronic structure of Tl-doped PbTe. Here we present a combined experimental and computational study of the low-energy electronic structure and Fermi surface of Pb1-xTlxTe, utilizing Shubnikov de Haas (SdH), angle-resolved photoemission spectroscopy (ARPES), and Hall effect measurements, as well as density functional theory (DFT) calculations of the electronic structure (appendix A). We definitively establish that the -pocket remains well below the Fermi energy at all compositions of Pb1-xTlxTe and therefore does not drive the superconductivity in this material. Furthermore, by contrasting our data with similar data from the non-superconducting analog Pb1-xNaxTe we observe a number of phenomena that distinguish superconducting and non-superconducting compositions, which we show to be consistent with the presence of additional mobile charges associated with the resonant impurity states introduced by Tl doping.
Single crystals of Pb1-xTlxTe were grown by an unseeded physical vapor transport method (appendix B). For magnetoresistance measurements, the crystals were cleaved into [100] oriented rectilinear bars typically 1 mm in length. Electrical contacts were made in a 4-point geometry along the top face with typical contact resistances of achieved by sputtering gold pads onto lightly scratched surfaces before attaching gold wires with silver epoxy. Compositions , 0.15 and 0.4 were measured to 35 T at the DC facility of the National High Magnetic Field Laboratory (NHMFL) in Tallahassee, FL, USA; , 0.8 and 1.3 were measured to 32 T (DC) at the High Field Magnet Laboratory in Nijmegen, The Netherlands; and additional measurements for and 0.8 were taken up to 60 T at the pulsed field facility of the NHMFL, in Los Alamos National Laboratory, NM, USA. Resistivity data was taken at positive and negative fields and symmetrized to obtain the magnetoresistance. The angle dependent data were obtained at a temperature of K using a single-axis rotator probe such that the field direction was rotated through the (110) plane of the crystal. Hall measurements were taken for all the samples studied at a temperature of K. ARPES measurements were performed at beamline 7.0.1 of the ALS and at the SIS beamline of the Swiss Light Source (SLS), Switzerland using a photon energy of =70eV at 40 K. All samples were cleaved in-situ prior to measurement.
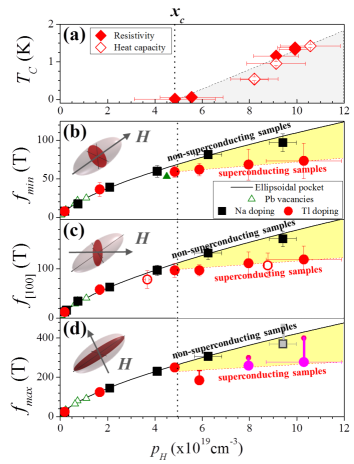
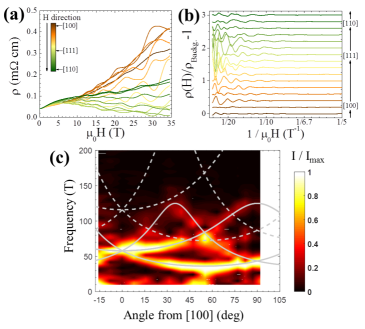
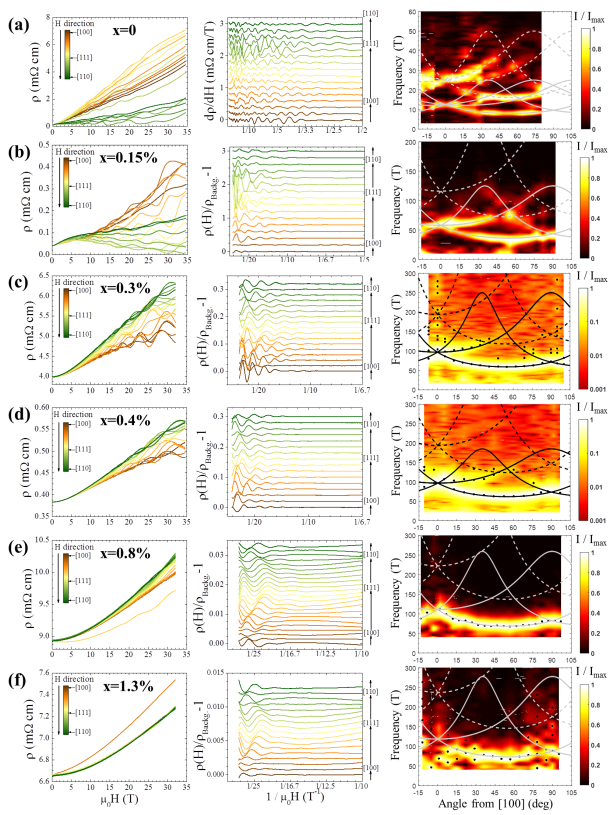
Figure 2(a) shows the magnetoresistance of a representative Pb1-xTlxTe sample with =0.15 (cm-3) for different field orientations in the (110) plane, clearly exhibiting SdH oscillations. The (110) plane is a natural plane to study the angle evolution of the SdH frequencies in PbTe as it passes through all of the crystallographic high symmetry directions and allows the determination of both the transverse and longitudinal extremal cross-sectional areas of the ellipsoidal pocket known to describe the first valence band maximum situated at the L-point (the ‘L-pocket’) in PbTe. Figure 2(b) shows the oscillating component of the magnetoresistance as a function of inverse field, where the non-oscillating component has been removed by fitting and subtracting a cubic spline from the data in fig. 2(a). Fourier analysis reveals multiple oscillatory components that are periodic in inverse field, as expected for quantum oscillations, with frequencies and magnitudes that vary as a function of angle. This variation is illustrated in fig. 2(c) which shows how the amplitude (represented by the colour scale) of the fast Fourier transform (FFT) of the oscillatory component of the magnetoresistance (fig. 2(b)) evolves with frequency and angle. Similarly to the non-superconducting Na-doped analog Giraldo-Gallo et al. (2016), all of the frequencies observed at every angle can be very well fitted by fundamental and second harmonics (shown as solid and dashed lines respectively in fig. 2(c)) corresponding to four ellipsoidal FS pockets at the L-point. This analysis was repeated for each sample (appendix C) and yields the values of the minimum and maximum cross-sectional areas of the L-pocket, which for this particular composition are T and T respectively. No signature of the -pocket or any features of non-ellipsoidicity of the L-pocket were observed at any composition measured in this study.
The values of , and (SdH frequency with ), of the L-pocket measured here in Pb1-xTlxTe are shown in figs. 3(b-d) as a function of Hall number (which is a good approximation to carrier concentration in a single band-ellipsoidal Fermi surface Ravich (1970); Giraldo-Gallo et al. (2016)), and compared to the same values previously found in non-superconducting Pb1-xNaxTe Giraldo-Gallo et al. (2016) and Pb1-δTe Jensen et al. (1978); Burke et al. (1970). As discussed in ref. 15, in Pb1-xNaxTe and Pb1-δTe the cross sectional areas follow the evolution expected for a single-band perfect ellipsoidal model for all the range of carrier concentration (except for the highest Na doping measured, where there may be a small deviation). This model also holds for non-superconducting concentrations of Tl where , but there is a clear break from this trend for in Pb1-xTlxTe with the deviation growing as increases, concurrently with (see fig. 3(a)). Evidently, the emergence of superconductivity in Pb1-xTlxTe is concomitant with the formation of a second electronic reservoir distinct from the L-pockets.
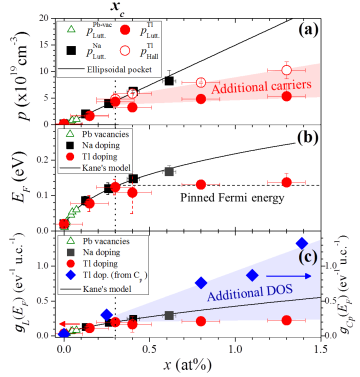
In non-superconducting Pb1-xNaxTe the Luttinger volume of the L-pocket and the Hall number are in excellent agreement for all compositions, indicating that all mobile charges are contained within the L-pocket Giraldo-Gallo et al. (2016). This is shown in fig. 4(a) where the black line shows the expectation if each dopant contributes a single carrier (or equivalently two carriers per lead vacancy) and the Luttinger volume of Pb1-xNaxTe (black squares) follows this closely. However, the present data shows that Pb1-xTlxTe departs from this trend for . The Hall number (open red circles) falls below the expected value if each Tl dopant were to contribute a single hole (as expected for a Tl1+ valence), but still gives a significantly higher estimate of the carrier concentration than the L-pocket Luttinger volume, for composition above . The almost unchanging Luttinger volume indicates that the Fermi energy has become almost fixed at around 130 meV for , in sharp contrast to Pb1-xNaxTe (fig. 4(b)). The Fermi energy was calculated via Kane’s model for an ellipsoidal non-parabolic band that has been shown to be appropriate for the L-pocket in PbTe Giraldo-Gallo et al. (2016); Ravich (1970). The applicability of Kane’s model further allows the electronic density of states of the L-pocket to be estimated and thus compared to the value derived from the Sommerfeld coefficient of the specific heat that necessarily encompasses all states at the Fermi energy. Similarly to the comparison between the Luttinger volume and the Hall effect, if all states are accounted for in the L-pocket then these values should be in agreement, but fig. 4(c) shows a large surplus (blue-shaded area, fig. 4(c)) of density of states observed via heat capacity for in Pb1-xTlxTe that cannot be accounted for by the L-pocket observed in the present data. Whilst some of this anomalous increase in the density of states could be due to a zero-bias peak associated with the charge-kondo effect proposed in this material Matsushita et al. (2005), when taken together with the discrepancy between Luttinger volume and Hall number (shaded area, fig. 4(a)) it is natural to conclude that there must be additional mobile states outside of the L-pocket that continue to increase in number with increasing composition despite the Fermi energy being almost constant.
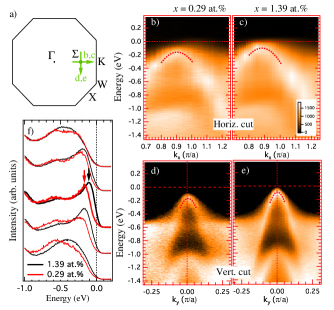
Although the data shown in figures 3 and 4 confirm the presence of additional carriers outside of the L-pocket, they do not unambiguously differentiate between the resonant impurity state and -pocket scenarios. The quantum oscillation amplitude is expected to be significantly smaller for the -pocket owing to its low mobility relative to the L-pocket Ravich (1970) and therefore could be present but unobserved in the data. Furthermore, the relatively large density of states expected for the -pocket could give the impression that the Fermi energy is pinned, which is the expectation for an impurity state that is well defined in energy, as is significantly reduced as reaches the -band edge. To confirm that the -pocket remains below for in superconducting Pb1-xTlxTe low-temperature ARPES measurements were performed, the results of which are shown in figure 5. Fig. 5(a) shows the location and direction in the , plane of the band dispersion data shown in figs. 5(b-e) for the main and transverse axes of the -pocket. In both compositions measured, =0.29% (fig. 5(b&d)) and =1.39% (fig. 5(c&e)), the pocket is seen to remain below by approximately 170meV and 100meV respectively. This is consistent with existing ARPES results that also conclude that only the L-pocket crosses for a sample of =0.5% Nakayama et al. (2008). This result strongly supports the conclusion that the -pocket is not responsible for the anomalous fermiology and superconductivity in Pb1-xTlxTe at .
The experimental results presented here lead to a number of robust conclusions about the nature of the Fermiology of Pb1-xTlxTe. The key conclusion is that the -pocket remains well below at all compositions measured of Pb1-xTlxTe, directly showing that this additional band maximum is not responsible for superconductivity. Moreover, becomes pinned in a narrow band of energies at , coincidently with the onset of superconductivity, which has previously been inferred but never definitively established Nemov and Ravich (1998); Kaidanov and Ravich (1985); Matsushita et al. (2005). Also, despite being pinned, we find evidence that additional mobile carriers are present but not associated with a coherent Fermi surface pocket, which could not previously have been inferred from existing data 111The absence of the impurity band in our ARPES measurements is explained by unfolding our density functional calculations of Tl-doped PbTe supercells (see SI), which show that the band has low spectral weight.. All of these conclusions strongly support the impurity band scenario illustrated in fig. 1(b), and are inconsistent with the -pocket scenario shown in fig. 1(a). This study provides the strongest experimental evidence to date that attention should be focused on the Tl impurity states in order to understand the superconductivity of Tl-doped PbTe.
It remains to be seen how the resonant impurity states contribute to the enhanced superconductivity in Tl-doped PbTe. Existing data in very heavily doped Pb1-xNaxTe achieves a similar density of states to that seen in superconducting Pb1-xTlxTe yet still does not exhibit superconductivity down to 10 mK, which suggests that it is the pairing interaction ( from the BCS gap equation) that is introduced extrinsically by the Tl dopants Chernik and Lykov (1981) that is the key factor determining the onset of superconductivity. Phenomenological models that capture the elements of the electronic structure associated with these impurities certainly indicate that charge fluctuations can provide an effective pairing interaction Dzero and Schmalian (2005); Varma (1988). It is also possible that such correlation effects can lead to an enhanced e-ph interaction, similar to what has been proposed for doped BaBiO3 Yin et al. (2013). Independently of these questions, the understanding of the evolution of the electronic structure of Pb1-xTlxTe points the way towards the design of other superconductors based on a similar mechanism.
We thank Y. Matsushita and A. S. Erickson for crystal growth of some of the samples used in this study, T. Geballe, M. Fechner and P. V. C. Medeiros for insightful discussions, and C. Bell for insights that have improved the manuscript. PGG, PW, and IRF, and work performed at Stanford University, were supported by AFOSR Grant No. FA9550-09-1-0583. BS and NAS acknowledge support from ETH Zürich, the ERC Advanced Grant program (No. 291151), and the Swiss National Supercomputing Centre (CSCS) under project IDs s307, s624 and p504. The high-field magnetoresistance measurements were performed at the National High Magnetic Field Laboratory (NHMFL), which is supported by NSF DMR-1157490, the State of Florida (DC facility), and the DOE/BES “Science at 100T” grant (pulsed field facility); and the High Field Magnet Laboratory, Radboud University/Fundamental Research on Matter, member of the European Magnetic Field Laboratory and supported by EuroMagNET II under European Union (EU) Contract 228043. Work at Ames Laboratory (ARPES measurements) was supported by the U.S. Department of Energy, Office of Basic Energy Sciences, Division of Materials Sciences and Engineering. Ames Laboratory is operated for the U.S. Department of Energy by the Iowa State University under Contract No. DE-AC02-07CH11358. The Advanced Light Source is supported by the Director, Office of Science, Office of Basic Energy Sciences, of the U.S. Department of Energy under Contract No. DE-AC02-05CH11231.
References
- Ueno et al. (2011) K. Ueno, S. Nakamura, H. Shimotani, H. T. Yuan, N. Kimura, T. Nojima, H. Aoki, Y. Iwasa, and M. Kawasaki, Nat. Nanotechnol. 6, 408 (2011).
- Bustarret (2015) E. Bustarret, Physica C 514, 36 (2015).
- Gor’kov (2016a) L. P. Gor’kov, Phys. Rev. B 93, 054517 (2016a).
- Gor’kov (2016b) L. P. Gor’kov, PNAS 113, 4646 (2016b).
- Takada (1980) Y. Takada, J. Phys. Soc. Jpn 49, 1267 (1980).
- Appel (1969) J. Appel, Phys. Rev. 180, 508 (1969).
- Edge et al. (2015) J. M. Edge, Y. Kedem, U. Aschauer, N. A. Spaldin, and A. V. Balatsky, Phys. Rev. Lett. 115, 247002 (2015).
- Lin et al. (2014) X. Lin, G. Bridoux, A. Gourgout, G. Seyfarth, S. Krämer, M. Nardone, B. Fauqué, and K. Behnia, Phys. Rev. Lett. 112, 207002 (2014).
- Binnig et al. (1980) G. Binnig, A. Baratoff, H. E. Hoenig, , and J. G. Bednorz, Phys. Rev. Lett 45, 1352 (1980).
- Fernandes et al. (2013) R. M. Fernandes, J. T. Haraldsen, P. Wolfle, , and A. V. Balatsky, Phys. Rev. B 87, 014510 (2013).
- Cohen (1964) M. L. Cohen, Phys. Rev. 134, A511 (1964).
- Prakash et al. (2017) O. Prakash, A. Kumar, A. Thamizhavel, and S. Ramakrishnan, Science 355, 52 (2017).
- Nemov and Ravich (1998) S. A. Nemov and Y. I. Ravich, Sov. Phys. Usp. 41, 735 (1998).
- Kaidanov and Ravich (1985) V. I. Kaidanov and Y. I. Ravich, Sov. Phys. Usp. 28, 31 (1985).
- Giraldo-Gallo et al. (2016) P. Giraldo-Gallo, B. Sangiorgio, P. Walmsley, H. J. Silverstein, M. Fechner, S. C. Riggs, T. H. Geballe, N. A. Spaldin, and I. R. Fisher, Phys. Rev. B 94, 195141 (2016).
- Ahmad et al. (2006a) S. Ahmad, S. D. Mahanti, K. Hoang, and M. G. Kanatzidis, Phys. Rev. B 74, 155205 (2006a).
- Xiong et al. (2010a) K. Xiong, G. Lee, R. P. Gupta, W. Wang, B. E. Gnade, and K. Cho, J. Phys. D: Appl. Phys. 43, 405403 (2010a).
- Dzero and Schmalian (2005) M. Dzero and J. Schmalian, Phys. Rev. Lett. 94, 157003 (2005).
- Matsuura and Miyake (2012) H. Matsuura and K. Miyake, J. Phys. Soc. Jpn. 81, 113705 (2012).
- Costi and Zlatić (2012) T. A. Costi and V. Zlatić, Phys. Rev. Lett 108, 036402 (2012).
- Matsushita et al. (2005) Y. Matsushita, H. Bluhm, T. H. Geballe, and I. R. Fisher, Phys. Rev. Lett. 94, 157002 (2005).
- Matsushita et al. (2006) Y. Matsushita, P. A. Wianecki, A. T. Sommer, T. H. Geballe, and I. R. Fisher, Phys. Rev. B 74, 134512 (2006).
- Jensen et al. (1978) J. D. Jensen, B. Houston, and J. R. Burke, Phys. Rev. B 18, 5567 (1978).
- Burke et al. (1970) J. R. Burke, B. Houston, and H. T. Savage, Phys. Rev. B 2, 1977 (1970).
- Ravich (1970) Y. I. Ravich, Semiconducting Lead Chalcogenides (Springer, 1970).
- Kane (1956) E. O. Kane, J. Phys. Chern. Solids 1, 249 (1956).
- Kane (1975) E. O. Kane, Semiconductors and Semimetals, Vol. 1, Chapter 3 (Academic, New York, 1975).
- Nakayama et al. (2008) K. Nakayama, T. Sato, T. Takahashi, and H. Murakami, Phys. Rev. Lett. 100, 227004 (2008).
- Note (1) The absence of the impurity band in our ARPES measurements is explained by unfolding our density functional calculations of Tl-doped PbTe supercells (see SI), which show that the band has low spectral weight.
- Chernik and Lykov (1981) I. Chernik and S. Lykov, Soviet Physics, Solid State 23, 1724 (1981).
- Varma (1988) C. M. Varma, Physical Review Letters 61, 2713 (1988).
- Yin et al. (2013) Z. P. Yin, A. Kutepov, and G. Kotliar, Phys. Rev. X 3, 021011 (2013).
- Blöchl (1994) P. E. Blöchl, Phys. Rev. B 50, 17953 (1994).
- Kresse and Joubert (1999) G. Kresse and D. Joubert, Phys. Rev. B 59, 1758 (1999).
- Kresse and Furthmüller (1996) G. Kresse and J. Furthmüller, Phys. Rev. B 54, 11169 (1996).
- Perdew et al. (2008) J. P. Perdew, A. Ruzsinszky, G. I. Csonka, O. A. Vydrov, G. E. Scuseria, L. A. Constantin, X. Zhou, and K. Burke, Phys. Rev. Lett. 100, 136406 (2008).
- Božin et al. (2010) E. S. Božin, C. D. Malliakas, P. Souvatzis, T. Proffen, N. a. Spaldin, M. G. Kanatzidis, and S. J. L. Billinge, Science 330, 1660 (2010).
- Medeiros et al. (2014) P. V. C. Medeiros, S. Stafström, and J. Björk, Phys. Rev. B 89, 041407(R) (2014).
- Medeiros et al. (2015) P. V. C. Medeiros, S. S. Tsirkin, S. Stafström, and J. Björk, Phys. Rev. B 91, 041116(R) (2015).
- Wang et al. (1998) L.-W. Wang, L. Bellaiche, S.-H. Wei, and A. Zunger, Phys. Rev. Lett. 80, 4725 (1998).
- Popescu and Zunger (2010) V. Popescu and A. Zunger, Phys. Rev. Lett. 104, 236403 (2010).
- Popescu and Zunger (2012) V. Popescu and A. Zunger, Phys. Rev. B 85, 085201 (2012).
- Sangiorgio (2017) B. Sangiorgio, First-principles study of PbTe: from exotic superconductivity to emergent ferroelectricity, PhD Thesis, ETH Zurich (2017).
- Ku et al. (2010) W. Ku, T. Berlijn, and C.-C. Lee, Phys. Rev. Lett. 104, 216401 (2010).
- Allen et al. (2013) P. B. Allen, T. Berlijn, D. A. Casavant, and J. M. Soler, Phys. Rev. B 87, 085322 (2013).
- Ahmad et al. (2006b) S. Ahmad, K. Hoang, and S. D. Mahanti, Phys. Rev. Lett. 96, 056403 (2006b).
- Ahmad et al. (2006c) S. Ahmad, S. D. Mahanti, K. Hoang, and M. G. Kanatzidis, Phys. Rev. B 74, 155205 (2006c).
- Hoang and Mahanti (2008) K. Hoang and S. Mahanti, Phys. Rev. B 78, 085111 (2008).
- Xiong et al. (2010b) K. Xiong, G. Lee, R. P. Gupta, W. Wang, B. E. Gnade, and K. Cho, J. Phys. D. Appl. Phys. 43, 405403 (2010b).
- Matsushita (2007) Y. Matsushita, Ph.D. Thesis: Superconductivity and mixed valency in thallium-doped lead telluride (Stanford University, 2007).
- Altarawneh et al. (2009) M. M. Altarawneh, C. H. Mielke, and J. S. Brooks, Rev. of Scientific Instruments 80, 066104 (2009).
- Yelland et al. (2008) E. A. Yelland, J. Singleton, C. H. Mielke, N. Harrison, F. F. Balakirev, B. Dabrowski, , and J. R. Coopers, Phys. Rev. Lett. 100, 047003 (2008).
- Shoenberg (1984) D. Shoenberg, Magnetic Oscillations in Metals (Cambridge University Press, 1984).
- Nagaoka (1965) Y. Nagaoka, Phys. Rev. 138, A1112 (1965).
- Suhl (1965) H. Suhl, Phys. Rev. 138, A515 (1965).
Appendix
Appendix A First-principles calculations
In this section we present our density functional calculations.
A.I Computational details
Our first-principles calculations were performed using the PAW Blöchl (1994); Kresse and Joubert (1999) implementation of density functional theory (DFT) within the VASP package Kresse and Furthmüller (1996). We used a cubic supercell (216 atoms) and substituted two lead atoms with thallium giving a thallium concentration of . All results were averaged over the nine symmetry-inequivalent configurations resulting from this supercell size. We used the PBEsol Perdew et al. (2008) exchange-correlation functional, a -centered -point mesh and a plane-wave energy cutoff of eV. Spin-orbit coupling was not included because of computational cost. We used valence electron configurations for lead, for tellurium, and for thallium. The unit cell volume was fixed to the equilibrium volume (lattice constant of Å to be compared with the experimental lattice constant of Å Božin et al. (2010)) of the pristine compound obtained with a full structural relaxation. The band unfolding was performed using the BandUP code Medeiros et al. (2014, 2015).
A.II Unfolding and effective band structures
Alloys and systems with impurities can be tackled primarily in two different ways from a computational point of view. Firstly, using effective medium approaches, like the virtual crystal approximation (VCA) and the coherent potential approximation (CPA). In this way one obtains directly the properties in the language of the primitive cell description and a comparison with experiments is straightforward. On the other hand, structural relaxations and changes in bond strength and character can not be taken into account. Secondly, using supercells with the explicit insertion/substitution of impurity atoms. In this way any possible effect and interaction caused by the impurities is automatically taken into account. The unfolding technique then allows one to construct an effective band structure (EBS) with the primitive-cell translational symmetries allowing a direct comparison with experiments.
In this work we follow the theory presented in Refs. Wang et al. (1998); Popescu and Zunger (2010, 2012); Medeiros et al. (2014, 2015); for more details about the meaning and interpretation of the unfolding technique and the computational results presented in this Supplementary see also Ref. Sangiorgio (2017). The idea is to calculate the eigenstates of the supercell and determine their amount of primitive-cell Bloch character. In other words, one determines the amount of each Bloch state of the primitive cell contained in the supercell wavefunction by decomposing the supercell eigenstates into Bloch states of the primitive cell. This is done by computing a spectral function associated with each wavevector in the primitive-cell Brillouin zone. In the case of weak symmetry-breaking disorder this spectral function matches results from ARPES experiments, except for the matrix elements describing the transition from the initial to the final state Ku et al. (2010); Allen et al. (2013). Finally, the EBS can be obtained by assigning a weight to each point using the cumulative probability function Medeiros et al. (2014, 2015). represents the number of bands crossing the energy interval at the wavevector in the primitive-cell Brillouin zone.
A.III Results
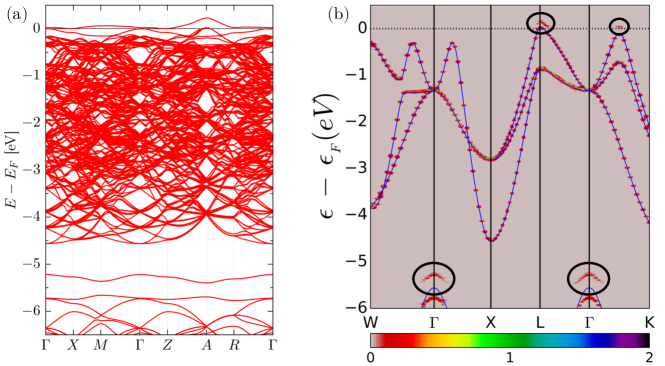
Figure A1 shows the computed valence bands. Panel (a) presents the band structure in the supercell representation; only one representative symmetry-inequivalent configuration is shown. As in previous studies Ahmad et al. (2006b, c); Hoang and Mahanti (2008); Xiong et al. (2010b) we find that the thallium impurities form two localized states, one at the Fermi level (also called resonant, deep-defect or anti-bonding state) and one at about eV (also called hyperdeep-defect or bonding state). These states originate from hybridization of the Te and Tl states. Panel (b) presents the EBS obtained from unfolding and averaging the supercell band structures of the nine symmetry-inequivalent configurations. One can observe some weak contributions, i.e. the associated spectral weight is quite small, from the anti-bonding and bonding states (black circles), but only in certain regions of the Brillouin zone; around the point for the bonding state and around the point and along the () line for the anti-bonding state.
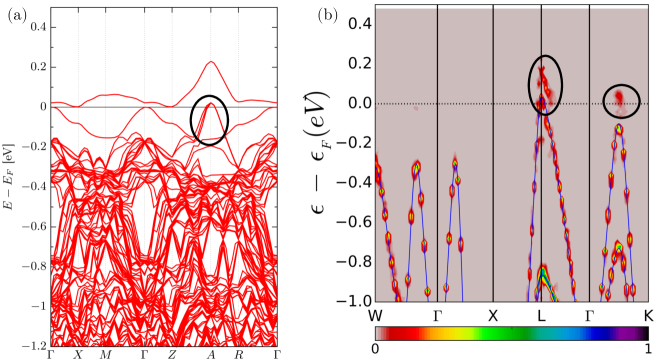
Figure A2 shows a zoom of the band structure of Fig. A1 in the region close to the Fermi level. In panel (a) one can nicely observe the narrow anti-bonding band at the Fermi level and the Te pocket (black circle) located at the point in the primitive-cell picture. Panel (b) presents the EBS in the same energy range. The anti-bonding band has appreciable spectral weight only around the point and along the line (black circles). From this plot it is not clear whether and where in the Brillouin zone the anti-bonding band crosses the Fermi level.
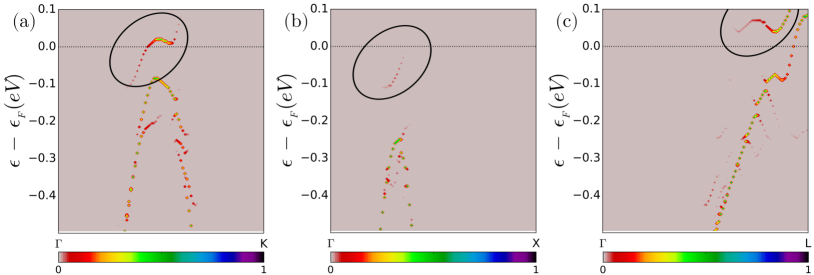
For this reason we show in Fig. A3 the EBS along three high-symmetry directions, the line (a), the line (b), and the line (c). Note again that the anti-bonding band has appreciable spectral weight only in some parts of the considered lines (black circles). This band can be seen to cross the Fermi energy once along the line, and also along the line, even if in the latter case the spectral weight is so small that it can be hardly seen on the printed plot. On the other hand, no crossing is observed along ; the observed crossing originates from the Te bands. The observed trend suggests that the Fermi surface produced by the anti-bonding band would contain the and points, but not the and points. A more accurate description of the shape of the Fermi surface requires a scan through the region of interest in the Brillouin zone; it was not undertaken because of computational cost.
In summary, we have shown that the impurity band of Tl-doped PbTe is composed of partly delocalized states since the associated unfolded bands show some dispersion. On the other hand, its contributions can not be observed throughout the whole Brillouin zone, but only in certain regions. Even in those regions, its spectral weight is small, explaining why these states are undetected in the ARPES measurements shown in this work.
Appendix B Crystal Growth
Pb1-xTlxTe single crystals were grown by an unseeded physical vapor transport (VT) method, similar to that described in Ref. 22, by sealing in vacuum polycrystalline pieces of the already doped compound, with (or close to) the desired final stoichiometry. The polycrystalline material was obtained by mixing high purity lead telluride (PbTe, 99.999, Alfa Aesar), Thallium telluride (Tl2Te, 99.9, Alfa Aesar) and metallic tellurium (99.999+, Alfa Aesar) in the appropriate ratios. The mix was ground to fine powders, in air, and then cold-pressed into a compact pellet. This pellet was sealed in a quartz tube with a small argon pressure and then sintered at 600 ∘C for 24 hours. The grind-press-sinter process was repeated once more. The pellet was broken into small pieces (0.5-3mm), placed in a quartz tube, with a length of 10 cm and fully evacuated. The tube was placed in a horizontal furnace, heated up to 700-750 ∘C and held at this temperature for 10 days. Mass transport occurs from the hottest part of the tube (center, where the material is initially placed) to the cooler ends, at which high quality single crystals nucleate thanks to the slow mass transport. Additionally, depending on slight variations in the furnace temperature gradient, some single crystals are observed to form at the top of the initial polycrystalline pile at the center of the tube, which is possible due to a slight vertical temperature gradient due to contact of the quartz tube with the furnace central-thermocouple.
Determination of the Tl concentration was performed by comparing the measured Hall number of any given sample against a previously established calibration curve. The calibration was obtained by performing multiple Hall effect and electron microprobe measurements for samples grown by the same technique, for a wide range of Tl concentrations up to the solubility limit, as described in ref. 50.
Appendix C Determination of Fermi Surface parameters
| (at.) | (cm-3) | (T) | (T) | (T) | (cm-3) | ||
|---|---|---|---|---|---|---|---|
| 0 | 0.19 0.0007 | 8 1 | 12.5 2 | 25 2 | 10 4 | 0.16 0.02 | - |
| 0.15 | 1.67 0.005 | 36 9 | 58 10 | 125 8 | 12 6 | 1.7 0.2 | 0.058 0.003 |
| 0.2 | 3.68 0.07 | - | 78 18 | - | - | - | - |
| 0.3 | 4.84 0.11 | 59 7 | 97 14 | 250 18 | 18 5 | 4.4 0.4 | 0.142 0.004 |
| 0.4 | 5.88 0.04 | 62 8 | 97 11 | 185 50 | 9 5 | 3.3 0.9 | - |
| 0.8 | 7.96 0.14 | 69 20 | 111 23 | 260 40 | 14 | 4.9 1.0 | 0.233 0.002 |
| 1.1 | 8.77 0.15 | - | 107 25 | - | - | - | - |
| 1.3 | 10.3 1.6 | 73 23 | 119 27 | 278 122 | 14 | 5.4 2.5 | - |
The same analysis that was performed for the data shown in Fig. 2 of the main manuscript for the =0.15 Tl-doped sample was also performed for all the other samples measured. The angle evolution of the frequencies of oscillation for each Tl composition is shown in Figure A4. These plots include a comparison with the perfect ellipsoidal model, using the maximum and minimum cross-sectional areas that best fit the data (see Table AI). These values are plotted in Fig. 3 of the main manuscript as a function of Hall number. Inspection of the data shown in Fig. A4 reveals a progressive reduction of the amplitude of oscillations with increasing Tl concentration for compositions above =0.15, resulting in FFT’s with low-amplitude and broad peaks, especially in the higher frequency ranges. As a consequence of this reduction, direct determination of the topology and volume of the L-pockets is more challenging for the highest Tl-concentrations. For the Tl concentrations of =0 (pure PbTe) and =0.15 the angle evolution of the three different frequency branches for this plane of rotation can be fully tracked for all angles, allowing us to directly obtain the values for the minimum and maximum L-pockets cross-sectional areas from the data. The sample with Tl concentration of =0.3, shown in Fig. A4(c), shows a clear evolution of, at least, two of the frequency branches, which can be tracked up to frequency values of around 150 T. For this sample, a logarithmic color scale was used in order to highlight the weak high-frequency contributions. Additionally, the exact positions of the maxima of the FFT for each angle are shown (black circles), which still permits comparison with the perfect ellipsoidal model. The weak weight seen at the 90∘-250 T region, together with the angle evolution of the middle frequency branch for frequencies below 150 T, provide strong constraints for the determination of the maximum L-pocket cross-sectional area for this composition, even though the dispersion of the whole branch cannot be tracked for all angles. A similar situation is observed for the sample with Tl concentration of =0.4, shown in Fig. A4(d). The color scale in this plot is also logarithmic, and the exact position of the FFT maxima for all angles are shown. For this sample there is no direct indication of the maximum L-pocket cross-sectional area. However, the determination of this quantity was guided by the angle evolution of the middle frequency branch for frequencies below 130 T, as well as the angle-evolution of the lower-frequency branch, although this last is much less sensitive to variations of . For the two-highest compositions, just as for all the other compositions, the determination of the L-pocket minimum cross-sectional area, , is direct. However, the L-pocket maximum cross-sectional area, , cannot be obtained directly from the FFT contour plots in Figs. A4(e) and A4(f), as only the angle evolution of the lower frequency branch can be observed. For the perfect ellipsoidal model curves shown in these plots, the value of was obtained assuming the same value () found in Na-doped PbTe samples in the same range of carrier concentrations Giraldo-Gallo et al. (2016). These values are indicated by asterisks in Table AI, and are shown by pink symbols in Figure 3(d) of the main text.
Appendix D High field Hall resistance
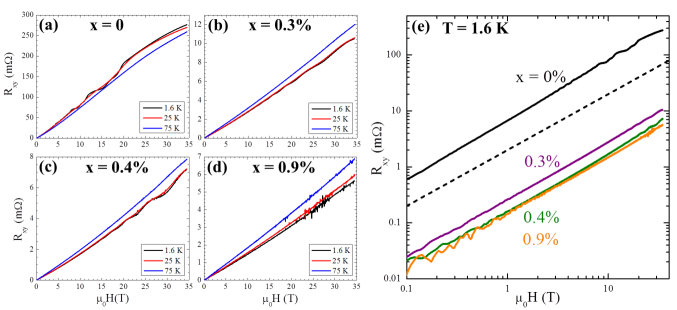
Hall effect measurements were performed for representative dopings, for fields up to 35 T at the NHMFL. Fig. A5 shows the data of as a function of magnetic field (oriented in the [001] direction), for temperatures of 1.6 K, 25 K and 75 K, and compositions of , , and . For the lowest Tl concentrations, a small oscillating component is observed in the data, superimposed to the non-oscillating background, which is the focus of these measurements. For the composition deviations from linear behavior, together with a suppression of the oscillatory component, are clearly observed for fields above T. These deviations are ascribed to overcoming the quantum limit for this sample at this field orientation. For all other compositions, which are well below the quantum limit for all fields measured, the Hall resistance follows a linear dependence with magnetic field for all fields, supporting the single band picture deduced from SdH and ARPES data. The linear Hall behavior is better observed in Fig. A5(e), which shows the Hall resistance as a function of field for all compositions at a temperature of 1.6 K, in a logarithmic scale. As can be readily seen, the Hall resistance is a linear function of field for all compositions.
Appendix E Effective cyclotron mass
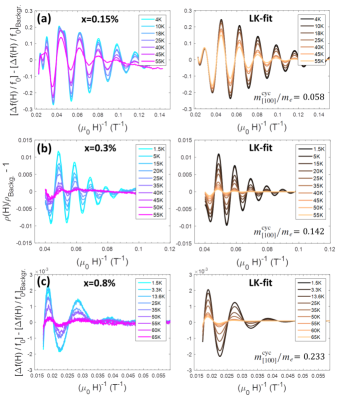
In order to determine the evolution of effective cyclotron masses of holes in Tl-doped PbTe with carrier concentration, we measured the temperature dependence of the quantum oscillations amplitude for samples of different Tl concentrations, with the field oriented along or close to the [100] direction. For a sample of , this was done by measuring magnetoresistance curves up to a DC field of 30 T. For samples with compositions and shifts in the resonance frequency of a proximity detector oscillator (PDO) circuit were recorded as a function of field Altarawneh et al. (2009), from which changes in the skin depth with field, and therefore, resistivity, can be obtained Yelland et al. (2008). To accurately determine the cyclotron effective masses for such a low carrier-density material, we simultaneously fitted all magnetoresistance/PDO frequency shift curves to the Lifshitz-Kosevich (LK) formula (in SI units) Shoenberg (1984):
| (1) | |||||
where the sum is over each frequency observed in the data, and for which a separate cyclotron effective mass, can be obtained.
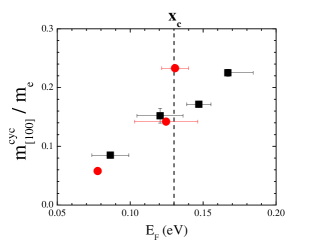
Figure A6 shows the temperature dependence of the oscillating component of magnetoresistance/PDO frequency shift for the Pb1-xTlxTe samples studied, with field oriented along the [100] direction, providing direct access to the cyclotron effective mass along the [100] direction, . Least-squares fits to Eq. 1, including the two strongest frequency components for each Tl doping, and for a field range of 7 T to 45 T (pulsed fields, at Los Alamos National Lab) for the sample, 7 T to 30 T (DC field) for the sample, and 17 T to 59 T (pulsed fields) for the sample, are shown in the right-column plots of this figure. The cyclotron mass obtained from these fits are shown in the plots, and summarized in Table AI. Figure A7 shows the obtained values of cyclotron effective masses along the [100] direction as a function of Fermi energy, for the Tl-doped samples studied, as well as for the Na-doped samples reported in ref. 15. An enhancement on the cyclotron effective mass for Fermi energies above the critical one is observed, which suggests an enhancement in electronic correlations in the L-pockets for compositions . Since the mass renormalization appears to turn on for , it is very likely connected to the presence of the resonant Tl impurity states at the Fermi energy. Whether this reflects an enhanced electron-phonon coupling associated with these states Yin et al. (2013), the presence of a Suhl resonance from the putative charge Kondo effect Dzero and Schmalian (2005); Nagaoka (1965); Suhl (1965), or some other interaction deriving from the impurity states, remains to be established.
Within the Kane model (known to be valid for PbTe in the absence of impurity states Giraldo-Gallo et al. (2016)) the DoS depends on the cyclotron effective mass like , where , and and are the longitudinal and transverse cyclotron masses for the ellipsoidal L-pockets (for a perfect ellipsoid of anisotropy , ). The present case is however more consistent with a renormalisation of the effective mass due to interactions which implies a linear dependence of the DoS on effective mass. As these scenarios give an increase in the DoS of 1.7 and 1.4 respectively for a sample with , they cannot explain the observed missing density of states, which is found to be 3.6 higher from the Sommerfeld coefficient than that derived from the L-pocket via the Kane model, as illustrated in figure 4(c) of the main text.