The Scuti pulsations of Pictoris
as observed by ASTEP from Antarctica
Abstract
Aims. The Antartica Search for Transiting Extrasolar Planets (ASTEP), an automatized 400 mm telescope located at Concordia station in Antarctica, monitored Pictoris continuously to detect any variability linked to the transit of the Hill sphere of its planet Pictoris b. The long observation sequence, from March to September 2017, combined with the quality and high level duty cycle of our data, enables us to detect and analyse the Scuti pulsations of the star.
Methods. Time series photometric data were obtained using aperture photometry by telescope defocussing. The 66 418 data points were analysed using the software package Period04. We only selected frequencies with amplitudes that exceed four times the local noise level in the amplitude spectrum.
Results. We detect 31 Scuti pulsation frequencies, 28 of which are new detections. All the frequencies detected are in the interval 34.7675.68 d-1. We also find that Pictoris exhibits at least one pulsation mode that varies in amplitude over our monitoring duration of seven months.
Key Words.:
stars:individual: Pictoris - stars: variables: Scuti - stars: oscillations - methods: data analysis - techniques: photometric1 Introduction
With a visual magnitude of 3.8, the A5V star Pictoris is among the 500 brightest stars in the sky. This star is surrounded by a debris disk composed of dust and gas known to be continuously replenished by evaporating exocomets and colliding planetesimals (Ferlet et al. 1987; Lecavelier Des Etangs et al. 1996; Beust & Morbidelli 2000; Wilson et al. 2017), and hosts at least one planet, Pictoris b, detected with the Very Large Telescope’s (VLT) adaptive optics NaCo system (Lagrange et al. 2009; Lagrange et al. 2010). The disk, which is seen edge-on, offers a unique opportunity to study the planet-forming environment and planet-disk interactions.
Many studies have been devoted to the physical characterization of the environment of the star. Studies of Pictoris itself have mainly focussed on the determination of its basic parameters and age (Lanz et al. 1995; Crifo et al. 1997; Di Folco et al. 2004). Crifo et al. 1997 found that the star is very close to the zero age main sequence (ZAMS), which is a finding confirmed by studies of the age of the Pictoris moving group, 23 Myr (Mamajek & Bell, 2014).
Very low-amplitude periodic variations in brightness, radial velocity, and line profile have been reported and studied (Koen 2003; Koen et al. 2003; Galland et al. 2006). These observations showed that Pictoris is one of the brightest known Scuti stars. Using photometric time series with a 50 cm telescope, Koen 2003 identified three frequencies with amplitudes below 1.5 mmag, while 18 frequencies were identified from line-profile spectroscopic variations obtained with the SAAO 1.9 m telescope (Koen et al., 2003).
Since its discovery in 2003, the monitoring of the astrometric position of the planet Pictoris b has provided a good estimation of its orbital parameters. It appears that the orbit of Pictoris is very close to the transit configuration. As a consequence, it is certain that the Hill sphere of Pictoris b transits the star with a closest approach either in August 2017 (Wang et al., 2016), October 2017 (Lagrange, in preparation), or January 2018 (Lecavelier des Etangs & Vidal-Madjar, 2016). This has motivated a monitoring campaign, started in 2017 and still ongoing, to detect any variability of Pictoris due to circumplanetary material surrounding its planet (see e.g. Stuik et al. 2017).
In this Letter, we analyse a long-sequence photometric observation, part of the monitoring campaign, of Pictoris. These observations allow us to better characterize the pulsations of the star. Section 2 of the paper describes the observations and data reduction while Section 3 focusses on the frequency analysis. Results are discussed in Section 4 and concluding remarks are made in Section 5.
2 Observations and data reduction
Photometric observations were made with the Antartica Search for Transiting Extrasolar Planets (ASTEP) 400 mm telescope, installed at the Concordia station, Dome C, Antarctica (Abe et al. 2013; Guillot et al. 2015; Mékarnia et al. 2016). Briefly, ASTEP 400 is a custom 400 mm Newtonian telescope equipped with a 5-lens Wynne coma corrector and a 4k 4k front-illuminated FLI Proline KAF 16801E CCD with a 16 bits analogue-to-digital converter. The corresponding field of view is 1 with an angular resolution of 0.93”pixel-1 (see Daban et al. 2010 for details).
Pictoris, which is circumpolar under Dome C latitude, was monitored continuously from the beginning of March through the end of September of the 2017 Antarctic polar campaign; data acquisition started automatically when the Sun was 6 degrees below the horizon. These observations are part of the international campaign dedicated to monitoring the Pictoris b Hill sphere transit, providing the opportunity to study the circumplanetry material surrounding the planet. Pictoris is so bright (=3.85 mag) that it saturates our CCD camera even at its minimum exposure time. We therefore used a highly defocussed point spread function (PSF) of approximately 100 pixels in diameter and containing roughly counts from Pictoris. The PSF value was chosen as a compromise between field crowdedness and signal-to-noise ratio compatible with a milli-magnitude precision of each individual calibrated point (considering photon noise only). The Pictoris stellar field is not very crowded so that the defocussed PSFs of all our reference stars do not overlap with any other nearby stars, which are bright enough to be detected within the exposure time. The Sloan i’ filter ( = 0.695 - 0.844 m) was used. We monitored the star continuously when the sky brightness due to the Sun elevation allowed it, at a cadence of 90 s (exposure time of 60 s, readout, and processing overhead of 30 s). In parallel, the focussed PSF is tracked by an independent CCD (see Daban et al. 2010) at a cadence of about 1 s. Each acquired science image passes through a custom PSF identification and field recognition algorithm to guarantee the field centring relative to the tracking CCD: the tracking CCD set point is constantly adjusted to compensate small differential drifts between the science and tracking optical paths. Data acquisition was performed automatically. To maximize the recording continuity, we used a reduced exposure time of 30 s when the Sun elevation is between and due to the increased sky brightness.
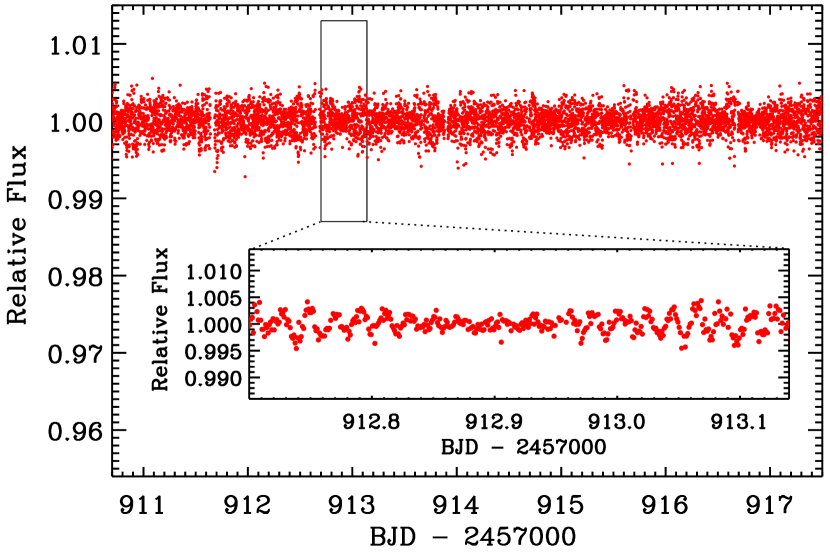
The ASTEP 400 data reduction pipeline includes bias and dark subtraction, bad pixel masking, and correction of the sky concentration effect, which causes an additive bell-shaped halo component to be present in the centre of each frame (Andersen et al., 1995). We performed aperture photometry of the 18 brightest stars in our images with sufficient counts to be useful. We used the same circular aperture radius for the 18 extracted sources, including Pictoris and our comparison stars HD 39463 and HD 38891. Figure 1 shows a seven-day subset of the calibrated light curve obtained by ASTEP 400. The rms noise is estimated at 1130 ppm for an integration time of 60 s.
The comparison data from the Hubble Space Telescope (HST) were obtained with WFC3/UVIS in the 953N filter (=0.9532 m, FWHM=0.0064 m) using spatial scanning mode to avoid saturation (HST programme GO-14621; PI: Wang). Photometry from each spatial scan was extracted using the WFC3 pipeline described in Stevenson et al. 2014, turning each scan into a photometric point with uncertainties dominated by photon noise (57 ppm). The HST data were then corrected for a 0.15% photometric offset between the two scan directions by simultaneously fitting the offset with the Scuti pulsations as a quasi-periodic Gaussian process. A detailed analysis of the HST data will be presented in a future publication.
3 Frequency analysis
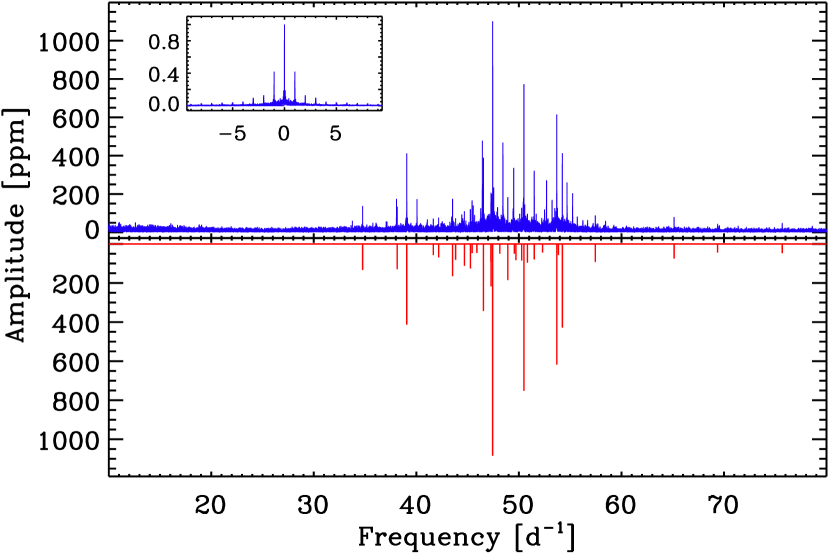
For our analysis, we kept a data set of 66 418 good measurements (i.e. keeping only data with the Sun below -8∘ and selecting those obtained under good photometric conditions) collected from March 5, to September 22, 2017, with an average sampling of 90 s. This corresponds to 34.3% of the total time, between the beginning and end of the observing period, and 52.7% of the possible observing time (with the Sun below ). The frequency analysis was performed with the software Period04 (Lenz & Breger, 2005), which is based on classical Fourier analysis and least-square algorithms. We searched for frequencies in the interval 0 - 200 d-1, but all the Scuti frequencies were detected in the spectral region 34.76 - 75.68 d-1. The relative amplitude of the daily side lobes is kept below 0.4 (Fig. 2) owing to our excellent time coverage, thereby avoiding any ambiguity when extracting each frequency peak.
For each detected frequency the amplitude and phase were calculated by a least-squares sine fit. The data were then pre-whitened and a new analysis was performed. Our analysis was conducted for all frequencies detected with a signal-to-noise amplitude ratio above the widely used value S/N 4 (Breger et al., 1993). We detected 31 Scuti frequencies, which are presented in Table 1 and illustrated in Fig. 2. The top panel of the figure shows the amplitude spectrum of our data, including the spectral window based on the times of analysed data, while the bottom panel shows the location of the detected frequencies. We reached a residual noise level of 9.45 ppm in the 35 - 65 d-1 region.
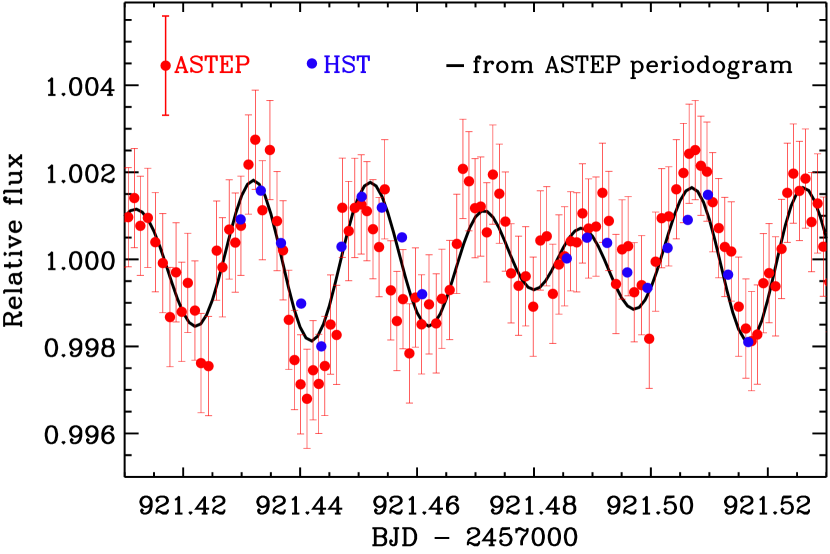
The uncertainties in the frequencies and their corresponding amplitudes and phases were computed with the relations proposed by Montgomery & O’Donoghue (1999). However, as mentioned in their paper, these uncertainties are underestimates of the true size of the errors. Therefore, the uncertainties given in Table 1 are 3 errors. We note that the relations proposed by Montgomery & O’Donoghue (1999) give the same error for all amplitudes. We also performed another independent check to investigate the reality of the detected frequencies. We created two equal subsets of the ASTEP time series and analysed these separately. We found a strong match between the frequencies obtained from the two subsets. The fit of the 31-frequency solution is plotted, as an example, over a small set of our measurements and better accuracy HST/WFC3 data points (Fig. 3). The fit is given by the relation , where is the relative flux of the star as a function of the time and are the detected frequencies, amplitudes, and phases, respectively. The origin of the time is ()2 457 000. Figure 3 also highlights the complementarity between high accurate and stable HST and the much longer ASTEP data. The agreement is very good. The amplitude of the variations seems to be slightly lower in the HST data, than ASTEP data, which is expected because HST uses a redder filter (0.9532 m instead of 0.7695 m).
| Frequency | Amplitude | Phase |
|---|---|---|
| (d-1) | (ppm) | (rad) |
| f1 47.43904 0.00005 | 1084 19 | 1.994 0.017 |
| f2 50.49188 0.00007 | 752 19 | 4.777 0.025 |
| f3 53.69138 0.00008 | 622 19 | 1.022 0.030 |
| f4 54.23727 0.00012 | 429 19 | 1.477 0.043 |
| f5 39.06297 0.00012 | 412 19 | 2.767 0.045 |
| f6 46.54281 0.00015 | 344 19 | 3.359 0.054 |
| f7 47.28350 0.00023 | 216 19 | 0.077 0.086 |
| f8 48.91877 0.00027 | 186 19 | 0.620 0.100 |
| f9 43.52749 0.00031 | 165 19 | 3.433 0.113 |
| f10 34.76028 0.00038 | 133 19 | 3.558 0.141 |
| f11 38.12913 0.00040 | 128 19 | 1.683 0.146 |
| f12 45.26910 0.00041 | 125 19 | 4.162 0.149 |
| f13 44.68376 0.00046 | 111 19 | 0.424 0.168 |
| f14 50.83133 0.00053 | 95 19 | 5.271 0.196 |
| f15 57.45220 0.00055 | 92 19 | 4.186 0.203 |
| f16 47.27074 0.00056 | 91 19 | 5.205 0.205 |
| f17 50.26818 0.00060 | 85 19 | 1.093 0.220 |
| f18 49.71224 0.00063 | 81 19 | 6.030 0.231 |
| f19 43.82897 0.00064 | 80 19 | 3.344 0.233 |
| f20 51.49786 0.00066 | 77 19 | 2.491 0.242 |
| f21 65.13460 0.00068 | 75 19 | 0.938 0.248 |
| f22 42.17268 0.00074 | 69 19 | 3.588 0.271 |
| f23 53.85402 0.00089 | 57 19 | 2.518 0.328 |
| f24 41.65042 0.00093 | 55 19 | 1.920 0.340 |
| f25 49.55851 0.00104 | 49 19 | 3.919 0.382 |
| f26 48.13791 0.00106 | 48 19 | 1.010 0.390 |
| f27 45.43672 0.00109 | 47 19 | 2.957 0.398 |
| f28 45.90177 0.00113 | 45 19 | 5.438 0.414 |
| f29 75.67860 0.00113 | 45 19 | 3.357 0.416 |
| f30 69.37515 0.00116 | 44 19 | 0.997 0.426 |
| f31 52.30184 0.00116 | 44 19 | 5.801 0.427 |
4 Discussion
All the detected frequencies are confined in the interval between 34.76 and 75.68 d-1. These frequencies are high for a Scuti, but not exceptional among hot pre-main-sequence (PMS) Scuti star (Casey 2011; Zwintz et al. 2014). The non-regularity of the frequencies in the spectrum is also common for the PMS and ZAMS.
We did not detect any frequency. So, all the pulsation modes are sinusoidal, which is consistent with the small amplitudes we observed. We did not detect either + combinations, regular frequency spacing between consecutive eigenmodes, or regular rotational splitting. The rapid rotation of the star (vsini 130 km s-1; Royer et al. 2007) certainly breaks any regular pattern in the spectrum (see e.g. Reese et al. 2017).
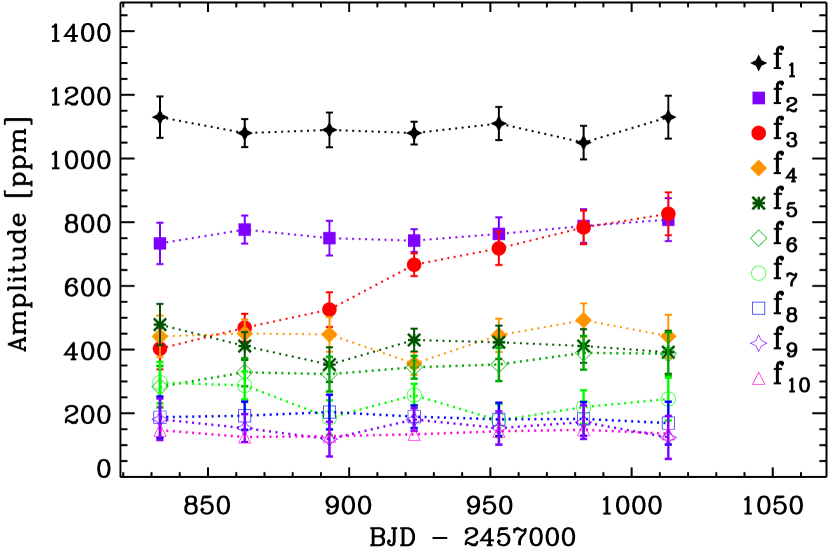
We looked for amplitude and phase modulation of the first 10 frequencies. We divided the data set into seven parts, each 30 days in length, and tracked the amplitude of our 10 highest amplitude peaks through the data set at fixed frequency using least squares. We found an amplitude change for only one pulsating mode that corresponds to our third pulsation frequency (=53.69138 d-1) (Fig. 4). This amplitude increased from 403 to 82666 ppm. No significant amplitude variation was found for the other frequencies. On the other hand, no significant phase variation was detected in our analysis. However, the detection of amplitude variations in our seven-month observations is not surprising since 61.3% of the Scuti stars observed by the Kepler Space Telescope exhibit at least one pulsation mode that varies significantly in amplitude over four years (Bowman et al., 2016).
Koen (2003) and Koen et al. (2003) detected three frequencies (47.4355, 38.0593 and 47.2823 d-1) in their photometric and radial velocity observations with amplitudes =1.52, 1.02, 0.88 mmag, and =0.129, 0.119, 0.03 km s-1, respectively. Their first and third frequencies correspond to our =47.43904 and =47.28350 d-1 frequencies but their 38.0593 d-1 frequency is clearly a one-day alias of our =39.06297 d-1 frequency. Galland et al. (2006) also detected two of the these frequencies in their HARPS measurements =47.44 d-1, =0.215 km s-1 and =39.05 d-1, =0.17 km s-1.
Koen et al. (2003) searched for periodicity in the moving bumps seen in the broaden line profile of the star. They detected 18 high-degree frequencies between 24.73 and 68.54 d-1. Most of these frequencies correspond to high-degree modes (4 10) that cannot be detected in photometry. Only one of their frequencies (45.440.02 d-1) was detected in our analysis. It matches our =45.43672 d-1 frequency. Koen et al. (2003) provide some mode identifications but, as they discuss, there may be some doubt about the validity of the results. In particular they did not have enough data to avoid the one-day alias in the frequency determination and the fast rotation of the star complicates the problem even further.
5 Conclusions
We have presented and analysed high-precision photometric observations of Pictoris, covering the period from March to September 2017, using the ASTEP 400 mm telescope installed at Concordia, Dome C in Antarctica. We detected 31 pulsation frequencies among which 28 are new. All of the detected frequencies were in the interval 34.76 - 75.68 d-1. We found amplitude variation for one pulsation mode, but there was no significant phase change in any detected frequencies.
In this present study, we focussed only on the detection of the pulsation frequencies of the star. A future work will be devoted to the identification of these pulsation modes by combining photometric and radial velocity data. Furthermore, the BRITE-Constellation mission (Weiss et al., 2014) has observed Pictoris continuously in two colours from November 4, 2016 to June 22, 2017; the corresponding results will be described in Zwintz et al. (in preparation).
The pulsation spectrum, obtained from the ASTEP data, already allows the calculation of a synthetic photometric stellar pulsation curve over a large observation period. This information is crucial to remove the Scuti pulsations signal from the Pictoris light curve to detect signatures of photometric events related either to the Hill sphere transit of Pictoris b or to any other circumstellar material passing in front of the star.
Acknowledgments
The field activities at Dome C benefit from the support of the French and Italian polar agencies IPEV and PNRA in the framework of the Concordia station programme. Part of the project has been supported by the Programme National de Planétologie, the Lagrange Laboratory of the Observatoire de la Côte d’Azur, the National Research Agency (ANR-14-CE33-0018), and through the “Investments in the Future” project managed by the ANR (ANR-15-IDEX-01). KZ acknowledges support by the Austrian Fonds zur Förderung der wissenschaftlichen Forschung (FWF, project V431-NBL), the Austrian Space Application Programme (ASAP) of the Austrian Research Promotion Agency (FFG), and the Tiroler Wissenschaftsfonds (GZ: UNI-0404/1985; PI: K. Zwintz). P.K. and J.J.W. acknowledge support from NASA NNX15AC89G and NNX15AD95G/NEXSS, NSF AST-1518332 and HST-GO-14621. This work benefited from NASA’s Nexus for Exoplanet System Science (NExSS) research coordination network sponsored by NASA’s Science Mission Directorate.
References
- Abe et al. (2013) Abe, L., Gonçalves, I., Agabi, A., et al. 2013, A&A, 553, A49
- Andersen et al. (1995) Andersen, M. I., Freyhammer, L., & Storm, J. 1995, in ESO Conference and Workshop Proceedings, Vol. 53, Calibrating and Understanding HST and ESO Instruments, ed. P. Benvenuti, 87
- Beust & Morbidelli (2000) Beust, H. & Morbidelli, A. 2000, Icarus, 143, 170
- Bowman et al. (2016) Bowman, D. M., Kurtz, D. W., Breger, M., Murphy, S. J., & Holdsworth, D. L. 2016, MNRAS, 460, 1970
- Breger et al. (1993) Breger, M., Stich, J., Garrido, R., et al. 1993, A&A, 271, 482
- Casey (2011) Casey, M. P. 2011, PhD thesis, Saint Mary’s University (Canada
- Crifo et al. (1997) Crifo, F., Vidal-Madjar, A., Lallement, R., Ferlet, R., & Gerbaldi, M. 1997, A&A, 320, L29
- Daban et al. (2010) Daban, J.-B., Gouvret, C., Guillot, T., et al. 2010, in Proc. SPIE, Vol. 7733, Ground-based and Airborne Telescopes III, 77334T
- Di Folco et al. (2004) Di Folco, E., Thévenin, F., Kervella, P., et al. 2004, A&A, 426, 601
- Ferlet et al. (1987) Ferlet, R., Vidal-Madjar, A., & Hobbs, L. M. 1987, A&A, 185, 267
- Galland et al. (2006) Galland, F., Lagrange, A.-M., Udry, S., et al. 2006, A&A, 447, 355
- Guillot et al. (2015) Guillot, T., Abe, L., Agabi, A., et al. 2015, Astronomische Nachrichten, 336, 638
- Koen (2003) Koen, C. 2003, MNRAS, 341, 1385
- Koen et al. (2003) Koen, C., Balona, L. A., Khadaroo, K., et al. 2003, MNRAS, 344, 1250
- Lagrange et al. (2010) Lagrange, A.-M., Bonnefoy, M., Chauvin, G., et al. 2010, Science, 329, 57
- Lagrange et al. (2009) Lagrange, A.-M., Kasper, M., Boccaletti, A., et al. 2009, A&A, 506, 927
- Lanz et al. (1995) Lanz, T., Heap, S. R., & Hubeny, I. 1995, ApJL, 447, L41
- Lecavelier des Etangs & Vidal-Madjar (2016) Lecavelier des Etangs, A. & Vidal-Madjar, A. 2016, A&A, 588, A60
- Lecavelier Des Etangs et al. (1996) Lecavelier Des Etangs, A., Vidal-Madjar, A., & Ferlet, R. 1996, A&A, 307, 542
- Lenz & Breger (2005) Lenz, P. & Breger, M. 2005, Communications in Asteroseismology, 146, 53
- Mamajek & Bell (2014) Mamajek, E. E. & Bell, C. P. M. 2014, MNRAS, 445, 2169
- Mékarnia et al. (2016) Mékarnia, D., Guillot, T., Rivet, J.-P., et al. 2016, MNRAS, 463, 45
- Montgomery & O’Donoghue (1999) Montgomery, M. H. & O’Donoghue, D. 1999, Delta Scuti Star Newsletter, 13, 28
- Reese et al. (2017) Reese, D. R., Lignières, F., Ballot, J., et al. 2017, A&A, 601, A130
- Royer et al. (2007) Royer, F., Zorec, J., & Gómez, A. E. 2007, A&A, 463, 671
- Stevenson et al. (2014) Stevenson, K. B., Bean, J. L., Madhusudhan, N., & Harrington, J. 2014, ApJ, 791, 36
- Stuik et al. (2017) Stuik, R., Bailey, III, J. I., Dorval, P., et al. 2017, ArXiv e-prints [arXiv:1709.01325]
- Wang et al. (2016) Wang, J. J., Graham, J. R., Pueyo, L., et al. 2016, AJ, 152, 97
- Weiss et al. (2014) Weiss, W. W., Rucinski, S. M., Moffat, A. F. J., et al. 2014, PASP, 126, 573
- Wilson et al. (2017) Wilson, P. A., Lecavelier des Etangs, A., Vidal-Madjar, A., et al. 2017, A&A, 599, A75
- Zwintz et al. (2014) Zwintz, K., Fossati, L., Ryabchikova, T., et al. 2014, Science, 345, 550