Present address: ]University of Michigan, Ann Arbor, MI 48109 Present address: ]Korea Atomic Energy Research Institute, Gyeongju-si, 38180, South Korea Corresponding author: crede@fsu.edu]
Present address: ]INFN, Sezione di Genova, 16146 Genova, Italy Present address: ]Imam Abdulrahman Bin Faisal University, Industrial Jubail 31961, Saudi Arabia Present address: ]University of Kentucky, Lexington, KY 40506 Present address: ]Idaho State University, Pocatello, Idaho 83209
The CLAS Collaboration
Measurement of the beam asymmetry and the target asymmetry in the photoproduction of mesons off the proton using CLAS at Jefferson Laboratory
Abstract
The photoproduction of mesons off the proton has been studied in the reaction using the CEBAF Large Acceptance Spectrometer (CLAS) and the frozen-spin target (FROST) in Hall B at the Thomas Jefferson National Accelerator Facility. For the first time, the target asymmetry, , has been measured in photoproduction from the decay , using a transversely-polarized target with energies ranging from just above the reaction threshold up to 2.8 GeV. Significant non-zero values are observed for these asymmetries, reaching about 30-40 % in the third-resonance region. New measurements for the photon-beam asymmetry, , are also presented, which agree well with previous CLAS results and extend the world database up to 2.1 GeV. These data and additional photoproduction observables from CLAS were included in a partial-wave analysis within the Bonn-Gatchina framework. Significant contributions from -channel resonance production were found in addition to -channel exchange processes.
pacs:
13.60.Le, 13.60.-r, 14.20.Gk, 25.20.LjI Introduction
The internal structure of the nucleon gives rise to an excitation spectrum, which is still poorly understood within quantum chromodynamics (QCD). Attempts at understanding the spectrum in terms of the basic QCD constituents in lattice-QCD have made significant progress in recent years Edwards:2011jj . However, quark models based on effective quark degrees of freedom still provide important guidance in our searches for baryon resonances. Known as the so-called missing baryon resonances, many more states have been predicted by phenomenological models such as the Constituent Quark Models (CQMs) (see e.g. Refs. Capstick:2000qj ; Loring:2001ky ) and approaches based on a chiral Langrangian Sarkar:2009kx than have been observed experimentally. The situation is particularly puzzling in the center-of-mass region above 1.7 GeV and the recent lattice-QCD calculations are even consistent with the level counting based on symmetry Edwards:2011jj . Much of our knowledge on nucleon resonances was extracted in pion-nucleon scattering experiments Olive:2016xmw , but CQMs have suggested that many higher-mass states could decouple from the channel. For this reason, photoproduction has long been considered an important approach in studying the systematics of the spectrum. A summary of the progress toward understanding the baryon spectrum is given in Refs. Klempt:2009pi ; Crede:2013sze .
It is essential to study nucleon resonances in all their possible decay modes to firmly establish their existence and to extract their properties. The production of vector mesons is particularly interesting since these mesons () carry the same quantum numbers, , as the photon and therefore, they are expected to play an important role in photoproduction. The Review of Particle Physics Olive:2016xmw clearly shows that the vector-meson decay modes have remained under-explored in recent years. However, many hitherto unobserved higher-mass resonances might strongly couple to these decay modes. The study of -meson photoproduction is especially interesting. The reaction has an additional advantage over vector-meson production since it serves as an isospin filter. The meson is an isoscalar particle and therefore, the reaction is sensitive only to (nucleon) resonances. This reduces the complexity of the contributing intermediate states and facilitates the search for new resonances. Moreover, the reaction threshold at MeV lies in the third-resonance region around MeV and thus, provides access to higher-mass resonances.
In photoproduction, the cross section for production is represented by complex numbers, representing the three spin states of the , the two spin states of the initial real photon, as well as the two spin states of the initial and the recoiling proton, respectively. By virtue of parity invariance, 12 relations among these amplitudes exist and consequently, only 12 independent complex helicity amplitudes or 24 real numbers remain at each energy and angle. In the ideal case of no experimental uncertainties, this will require 23 independent measurements (allowing for an overall arbitrary phase) at each energy and angle for a complete description. Identifying a set of 23 carefully chosen observables for vector mesons and measuring all of them in order to achieve a “complete experiment” Pichowsky:1994gh remains a challenging task. However, it is possible to extract useful dynamical information from the experimentally-accessible polarization observables. These observables impose constraints on phenomenological models, thereby aiding in reducing the ambiguity in the extraction of the resonance contributions to this reaction.
The present database of photoproduction observables includes cross-section measurements from various collaborations Barth:2003kv ; Williams:2009ab ; Wilson:2015uoa ; Strakovsky:2014wja , spin-density matrix elements (SDMEs) Williams:2009ab ; Wilson:2015uoa , the beam asymmetry Ajaka:2006bn ; Klein:2008aa ; Vegna:2013ccx ; Collins:2017vev , and the double-polarization observables Eberhardt:2015lwa ; Akbar:2017uuk (helicity asymmetry) and Eberhardt:2015lwa (correlation between linear-photon and longitudinal-target polarization). The importance of polarization observables for our understanding of this reaction has frequently been discussed in the literature, e.g. Refs. Klempt:2009pi ; Crede:2013sze .
Since the meson has the same quantum numbers as the incoming photon, a dominant -channel background contribution is expected. The inclusion of polarized SDMEs and the polarization observables , and from the CBELSA/TAPS Collaboration played a crucial role in a recent BnGa partial-wave analysis Denisenko:2016ugz toward understanding the nature of the -channel amplitudes and disentangling them from the -channel resonance contributions. For example, a data description with only -channel amplitudes predicted the beam asymmetry to be close to zero, whereas experimentally this asymmetry was observed to be significantly bigger and to exceed values of 0.5 across the entire incident-photon energy range below 2 GeV. Linear beam polarization allowed the study of the production process in more detail and helped separate natural and unnatural parity-exchange conributions (e.g. pomeron and exchange, respectively). A summary of all published results in photoproduction can be found in our preceding paper Akbar:2017uuk .
In this paper, first-time measurements are presented for the target asymmetry, , as well as results for the beam-asymmetry, , in the photoproduction reaction:
| (1) |
from the CLAS-FROST experiment. These new measurements cover a broad range in photon energies, GeV for and GeV for . The presented results on allow a comparison with previously published results and serve as a validation for the new measurements of the target asymmetry. Moreover, these results also represent first-time measurements for the energy range GeV.
This paper has the following structure. Section II describes the CLAS (FROST) experimental setup. The data reconstruction and event selection are discussed in Section III and the technique for extracting the polarization observables is described in Section IV. Experimental results and a discussion of observed resonance contributions are presented in Sections V and VI, respectively. The paper ends with a brief summary and an outlook.
II The FROST Experimental Setup
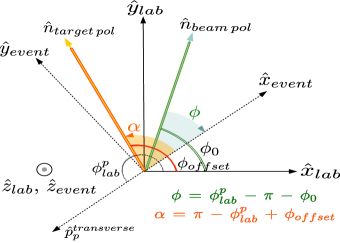
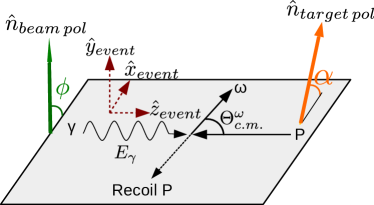
The FROzen Spin Target (FROST) Keith:2012ad experiment was conducted at the Thomas Jefferson National Accelerator Facility (Jefferson Lab) in Newport News, Virginia, using the CEBAF Large Acceptance Spectrometer (CLAS) Mecking:2003zu in Hall B at Jefferson Lab. FROST covered a variety of individual experiments with all possible combinations of linear and circular beam polarization, as well as longitudinal and tranverse target polarization, thus providing access to single- and double-polarization observables in a large number of reactions Strauch:2015zob ; Senderovich:2015lek ; Akbar:2017uuk . For these measurements of the beam and target asymmetries, the target was transversely polarized and the beam was linearly as well as circularly polarized, respectively. Figure 1 shows a schematic that illustrates the more complex kinematic situation of linear-beam polarization in combination with transverse-target polarization in the two coordinate systems relevant for this analysis: the laboratory frame and the event frame. The -axis was chosen to be along the direction of the incoming photon beam in both frames. The -axis in the laboratory frame, , was chosen along the vertical direction pointing away from the floor, and was given by . The - and -axes in the event frame were chosen as follows: was perpendicular to the center-of-mass production plane. Mathematically, , where is a unit vector along the momentum of the recoiling proton in the center-of-mass frame. Then, was given by .
The beam of linearly-polarized tagged photons was created by employing a coherent bremsstrahlung technique Timm:1969mf ; Lohmann:1994vz whereby unpolarized electrons were scattered from a thick diamond radiator. The electrons were initially accelerated using the Continuous Electron Beam Accelerator Facility (CEBAF) at Jefferson Lab with energies reaching up to GeV. After passing the radiator, the electrons were deflected into a tagging detector system Sober:2000we , which provided the information to tag the time and the energy of the corresponding bremsstrahlung photons with a resolution of ps and , respectively. The orientation of the linear polarization plane could be set to either parallel (denoted as ) or to perpendicular (denoted as ) relative to the floor of the experimental hall by adjusting the azimuthal angle of the crystal lattice of the diamond radiator Livingston:2008hv . The corresponding azimuthal angle of the beam polarization in the laboratory frame was or , respectively (see Figure 1). The angle between a selected diamond plane and the incident electron beam determined the leading-edge of an enhancement in the photon energy spectrum known as the “coherent edge.” The incident photons reached their maximum polarization within a roughly MeV window below the coherent edge. In this experiment using linear beam polarization, coherent-edge settings from GeV to GeV in intervals of GeV were used. The average degree of polarization of the linearly-polarized beam was measured via a fit of the photon energy spectrum using a coherent bremsstrahlung calculation Ken_pol_cal and was found to vary between 40 - 60 % depending on energy.
For the measurement of the target asymmetry, a circularly-polarized, tagged, bremsstrahlung photon beam was used, which results from a polarization transfer when the incident electron beam itself is longitudinally polarized. Since the electron beam helicity state flipped rapidly, integrating over the initial helicity states resulted effectively in an unpolarized incident photon beam.
The target nucleons were free protons inside a cm long frozen-spin butanol (C4H9OH) target system Keith:2012ad . The target was transversely polarized using a Dynamic Nuclear Polarization (DNP) technique Abragam:1978 outside the CLAS detector in a T homogeneous magnetic field and at a temperature of - 300 mK. To maintain the transverse polarization of the target inside the detector system, the target was cooled down to about mK and a T holding field was applied using a dipole magnet. An average transverse polarization of about was achieved. The polarization values were determined from regular NMR measurements taken for both target polarizations: pointing away from the floor (denoted as ‘’) and pointing towards the floor (denoted as ‘’). The target polarization was inclined at an angle (referred to as the target offset angle) from the -axis in the laboratory frame for the ‘’ setting and at for the ‘’ setting, as shown in Fig. 1. These offsets were necessary to prevent photoproduced background from being directed into the CLAS acceptance region by the target holding field.
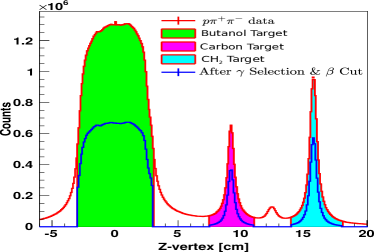
In addition to the butanol target, two unpolarized targets were placed in the target cryostat, including carbon and polyethylene (CH2) targets for background subtraction and systematic studies. They were placed further downstream than the butanol target at approximately cm and 16 cm, respectively, and were well-separated from each other, as is evident from the -vertex distribution shown in Fig. 2. The thickness of the additional targets was chosen such that the hadronic rate from each was about 10 % the rate of butanol.
The charged final-state particles were detected using the CLAS spectrometer Mecking:2003zu , which was based on a non-homogeneous toroidal magnetic field, primarily pointing in the direction, with a maximum magnitude of T generated by a six-coil torus magnet. The design of the magnet provided a field-free region around the polarized target. The CLAS detector system had many components, each with a six-fold symmetry about the beam axis, covering a solid angle of about 80 % of . For an event to be recorded, the trigger configuration required the detection of at least one charged track.
III Event Selection
The mesons were reconstructed from their decay. This decay mode has the highest branching fraction of ( Olive:2016xmw . Events were selected when exactly one final-state proton as well as one and one track were detected. A one-constraint kinematic fit imposing a missing was used to reconstruct the four-vector of the neutral pion.
Prior to kinematic fitting, the following cuts and event corrections were applied. Initial photon selection cuts were required since the photons arrived at the target in 2 ns bunches. To select the correct photon out of several potential candidates, a cut of ns on the coincidence time (time difference between the event vertex time and the time the photon arrived at the vertex) was applied. This reduced the initial situation from approximately five candidate photons per event to only about 8 - 10 % of all events having more than one candidate photon. These events were discarded. To further minimize the ambiguity in identifying the correct photon, only those events were considered in which the vertex-timing cut identified the same photon for all tracks.
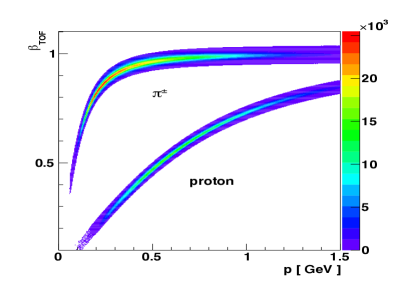
For final-state particle identification, the value of each track was determined from two separate sources: (1) was measured using the momentum information from the drift chambers and the PDG mass Olive:2016xmw for the particle, and (2) used the velocity information from the time-of-flight (TOF) system Smith:1999ii ; Mecking:2003zu . Events were selected based on , where was the width of the Gaussian distributions, which were centered at zero for pions and protons. This led to a significant improvement in the identification of good final-state tracks and clear bands for protons and charged pions could be identified in the versus momentum distributions (Fig. 3). In addition, vertex cuts of cm2 and cm were applied to select events originating from the butanol target.
The four-vectors of the selected charged final-state particles were corrected for the energy loss due to the interaction with materials while traveling through the CLAS volume. Small momentum corrections of a few MeV were also required to correct for factors such as variations in the magnetic field of the torus magnet and/or misalignments of the drift chambers. The corrections of the and proton four-vectors were initially determined such that the mass distributions of in and did not have any azimuthal dependence. By using kinematic fitting, these corrections were further fine-tuned and momentum-dependent corrections for the were also found.
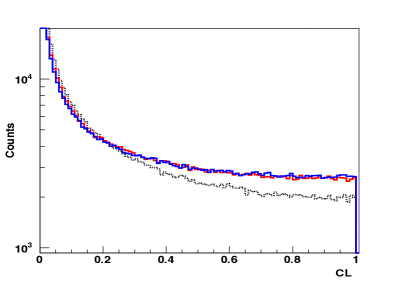
In a final step, a kinematic fit on these corrected four-vectors imposed energy and momentum conservation implying a missing . An example of our confidence-level (CL) distributions is shown in Fig. 4. After applying energy-loss corrections, the slope of the distribution improved significantly, approaching the ideal value of zero toward CL = 1. The application of momentum corrections led to a further improvement in the distribution. However the improvement was small since the momentum corrections were much smaller in magnitude than the energy-loss corrections. A very small CL cut of was finally applied to simply require fit convergence. This removed most of the background.
Event-based signal-background separation
The remaining background, consisting of mostly events originating from bound nucleons of the butanol target as well as other non- events resulting in a final state, was separated from signal events using a probabilistic event-based method. This multivariate analysis technique is described in detail in Ref. Williams:2008sh and its application in previous CLAS analyses on the measurement of the photoproduction cross sections and the double-spin asymmetry is detailed in Refs. Williams:2009ab ; Akbar:2017uuk . The method determines a weight for each event, denoted as the event value, which denotes the probability for the event being a signal event. These values were then used as event weights to provide any signal distribution, such as angular or mass distributions, and also facilitated the application of event-based likelihood fits (see Section IV.1). For this method, the data were divided into data subsets based on their photon energy (binned in -MeV wide bins) and on their beam and/or target polarization orientations. To determine the value for each event in any given data subset, the 300 kinematically-nearest neighbors were selected using a distance metric in the phase space of all relevant kinematic variables, with the exception of the invariant mass. In this analysis, these variables were:
where denotes the cosine of the polar angle of the meson in the center-of-mass frame, and denote the two angles of the meson in the helicity frame, is the azimuthal angle of the meson in the lab frame, and is a quantity that is proportional to the decay amplitude Williams:2009ab . It was calculated in terms of the pion momenta in the rest frame of the :
| (2) |
for a totally symmetric decay, where is the sum of the kinetic energies and is the mass. The parameter varies between 0 and 1 and shows a linear increase as expected for a vector meson.
This method guaranteed the selection of the 300 nearest neighbors in a very small region of the multi-dimensional phase space around the candidate event. Therefore, it was assumed that the signal and background distributions did not vary rapidly in the selected region and that the invariant mass distribution of these 300 events determined the value of the event. Due to the small sample size of the selected nearest neighbors, an event-based unbinned maximum likelihood method was implemented to fit the mass distributions. The fit function was defined as:
| (3) |
where denoted the signal and the background probability density function (pdf). was a normalization constant and was the signal fraction with a value between 0 and 1. The value itself was then given by:
| (4) |
where was the invariant mass of the candidate event, and .
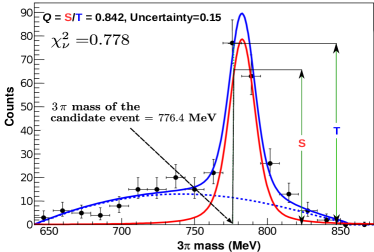
A Voigtian function, which is a convolution of a Gaussian (to describe the resolution) and a Breit-Wigner (to describe the natural line shape of the resonance), was chosen to describe the signal pdf. A third-order Chebychev polynomial was selected to describe the background pdf. Since the unbinned maximum-likelihood fitting technique did not provide any goodness-of-fit measure to check the fit quality, the output of each likelihood fit was used to perform a least-squares fit of the -mass distribution of the same 300 events. The corresponding value provided the goodness of fit. An example of such a least-squares fit is shown in Figure 5. The figure also demonstrates how the Q value was calculated for a candidate event. The choice of a Voigtian for the signal pdf and a third-order Chebychev for the background pdf gave the overall best distribution for the reduced-. For the energy bins close to the production threshold, a product of an Argus function and a second-order Chebychev polynomial was used for the background pdf in order to better describe the edge of the phase space, which had a fairly sharp cut-off on the right-hand side of the signal peak.
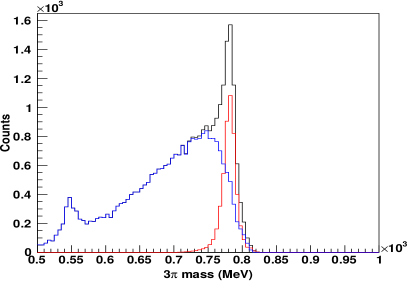
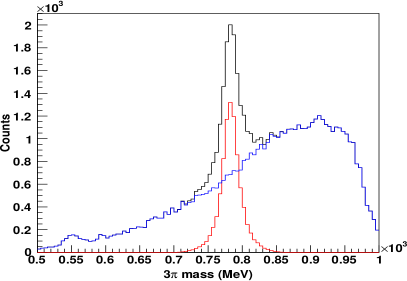
Figure 6 shows two examples of invariant mass distributions for all linearly-polarized events in the energy bin GeV (left) and GeV (right), summed over all angles and polarization states. The figure demonstrates the quality of the applied background-subtraction procedure: the total-mass distribution (black line) was nicely separated into a Voigtian mass distribution for the signal (red line), obtained by weighting each event with , and a smooth polynomial background (blue line), obtained by weighting each event with (). At threshold, the choice for the background pdf did not always sufficiently constrain the likelihood fits. This occasionally manifested itself as small dip-like structures in the background mass distribution. Such effects were taken into account in determining the systematic uncertainties associated with this method (see Section V.3).
After applying all selection cuts and the event-based signal-background separation method, a total of 98,910 events were retained from the entire data set using the combination of linear-beam polarization and transverse-target polarization, over the full photon energy range of 1100 - 2100 MeV. From the corresponding data set using circular-beam polarization, 122,679 events were retained over the full incident-photon energy range of 1200 - 2800 MeV.
IV Data Analysis
The total cross section, , for photoproduction using a transversely-polarized target can be expressed in terms of the unpolarized cross section, , and a number of polarization observables as:
| (5) |
where denotes the average degree of linear-beam polarization (which was observed to be the same for ‘’ and ‘’ target polarizations), denotes the average target polarization (which was also observed to be the same for ‘’ and ‘’ beam polarizations) and the azimuthal angle () is defined as the angle between the photon beam (target) polarization and the -axis in the event frame, as shown in Fig. 1. Mathematically,
| (6) |
which is also evident from the figure. Here, denotes the lab azimuthal angle of the recoiling proton and () refers to the orientation of the photon-beam (transversely-polarized target) polarization with respect to the -axis in the laboratory frame. The definition of the angles and the polarization observables is analogous to the corresponding definition for the photoproduction of a single-pseudoscalar meson. When the beam polarization was set to (or ), then (or ) rad. Similarly, (or ()) rad when the target polarization was set to ‘’ (or ‘’). These values in radians correspond to and , respectively, as discussed in Section II.
The total number of experimentally observed events is related to as:
| (7) |
where is the incident photon flux, denotes the target cross-sectional area, and refers to the CLAS detector acceptance. The parameter was observed to be independent of the relative orientation of the beam polarization with respect to the detector. Furthermore, the acceptance for the two target-polarization orientations was assumed to be very similar since the magnetic field of the holding magnet was fairly small. Small corrections of about 0.5 degrees or less were applied to the azimuthal and polar angles of the detected final-state particles due to the effects of the holding field. More details on these corrections are available in Ref. Roy:Dissertation .
For the extraction of asymmetries, the absolute value of the photon flux was not required. Rather, the ratios of fluxes between data sets with different beam-target polarizations were needed to effectively unpolarize the target in order to extract the beam asymmetry, . The flux ratios were determined by using the information on the total number of reconstructed events from the polyethylene target, which was directly proportional to the photon flux. This target was chosen since the effects of the magnetic holding field were negligible at the target location. Events were also counted irrespective of topology so that the ratios were independent of the physics dynamics involved in the reaction specific to this analysis.
IV.1 Extraction of the photon-beam asymmetry,
Three independent kinematic variables were required to completely describe the event kinematics in photoproduction, as shown in Fig. 7. The following variables were chosen: the photon energy (), the polar angle of the meson in the center-of-mass frame (), and the azimuthal angle of the recoil proton () in the laboratory frame (not shown in the figure). The observed modulation in the distribution was then used to extract the beam asymmetry at various (, ) bins. An event-based maximum-likelihood fitting technique was implemented to fit the angular modulations and extract . This technique is considered more powerful than the conventional binning technique when the data suffer from low statistics since it uses information from every event, thereby preventing any loss of information due to binning. The method was based on the principles outlined in Ref. Paterson:2016vmc , which showed its application in a previous CLAS measurement. In this analysis, the likelihood (or the joint probability density) of obtaining the experimentally observed angular distribution was expressed in terms of as the only fit parameter (see Eq. 12-15). To extract from the FROST data, the target polarization had to be removed (as detailed below). Maximizing the likelihood function then gave the most likely value for .
To nullify the effect of the target polarization to measure , event samples with opposite target polarization but the same beam polarization were combined using appropriate scale (or normalization) factors. The number of events, , after combining data sets with beam polarization and different target polarizations (‘’ or ‘’), was given by:
| (8) |
where was a normalization factor that depended on the photon flux, and , and the average degrees of target polarization, and , of the two data sets:
| (9) |
Substituting Eq. 5 and 7 into Eq. 8 gave:
| (10) |
where was defined as .
Similarly, the number of events, , after combining data sets with beam polarization and different target polarizations was given by:
| (11) |
The asymmetry between and data could then be expressed as:
| (12) |
where
| (13) |
The likelihood of obtaining the observed angular distribution in in any kinematic bin, using from Eq. 12-13, was given by:
| (14) |
and denotes the sum of events over all four beam-target polarization settings used in that kinematic bin. The weight for each event depended on its and the normalization factor for the corresponding data set. From the above discussion, the weight of the event was given by:
| (15) |
Minimizing ln yielded the value and the statistical uncertainty of the polarization observable . This was performed at every (, ) bin. The MINUIT software package cern:minuit was used for the minimization.
IV.2 Extraction of the target asymmetry,
The target asymmetry was extracted from data using a transversely-polarized target and an incident circularly-polarized photon beam. The same likelihood technique described in subsection IV.1 was used to determine this polarization observable. Since the incident photons were polarized, this beam polarization had to be nullified.
The number of events with target polarization ‘’, , after combining events with different helicity states, was given by:
| (16) |
where the normalization factor was since the helicity state flipped rapidly and the events were not separated into different data sets. By substituting the value of into Eq. 16 and using Eq. 5 and 7, the number was given by:
| (17) |
where was the flux for the data set with target polarization ‘’.
Similarly, the number of events with target polarization ‘’, , after combining events with different helicity states, was given by:
| (18) |
where was the flux for the data set with target polarization ‘’.
The asymmetry between target ‘’ and ‘’ data could then be expressed as:
| (19) |
where
| (20) |
The likelihood of obtaining the observed angular distribution in in any kinematic bin, using from Eq. 19, was given by:
| (21) |
and denotes the sum of events over the two target-polarization settings used in that kinematic bin. The weight of the event was for all events. The observable was then extracted by minimizing -ln .
V Results
This section presents the experimental results for the beam asymmetry, , and the target asymmetry, , in the photoproduction of a single meson off the proton. The observable can be compared with published results from various experiments and excellent agreement is observed, in particular with recent CLAS measurements using a liquid-hydrogen target. Since extracting single-spin observables from double-polarization data is challenging, this good agreement for provides confidence in the quality of the first-time measurements of the associated target asymmetries.
V.1 The Beam Asymmetry
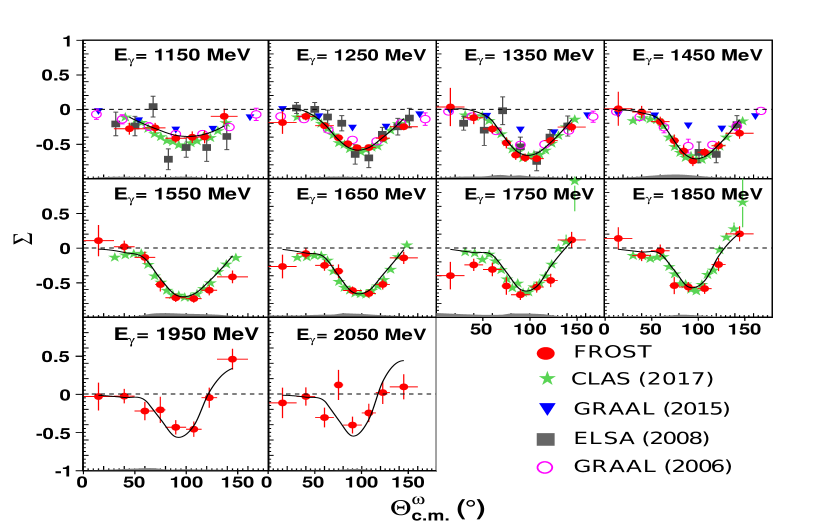
Figure 8 shows the results for in the photoproduction reaction (Eq. 1) including the statistical uncertainties for each data point from FROST (shown as red circles) as a function of . The data points are given for 10 energy bins in the incident-photon energy range GeV; Each energy bin is -GeV wide. The numerical values for the data presented in Fig. 8 including the statistical and systematic uncertainties are available in Ref. PRC:SupplementalMaterial . The very forward and backward angles had low statistics owing to poor CLAS acceptance. Therefore, a variable binning scheme for this angle range was chosen such that the bins at the very forward and backward regions are wider than the bins in the central region.
The FROST data points above GeV in incident photon energy represent first-time measurements. Also shown in the figure are published results from other experiments: two sets of results from the GRAAL Collaboration Ajaka:2006bn (2006 data - magenta open circles) and Vegna:2013ccx (2015 data - blue inverted triangles). The GRAAL-2006 data cover the energy range from the reaction threshold up to GeV and were extracted from the decay mode. The GRAAL-2015 data cover the same energy range but represent a statistics-weighted average of results obtained from the and the radiative decay modes, with the exception of the GeV photon energy bin where the results were obtained from the radiative decay mode only. The CBELSA/TAPS Collaboration published results from the decay mode in 2008 for energies up to GeV Klein:2008aa (gray squares). Also shown are recent results from the CLAS Collaboration Collins:2017vev from a liquid-hydrogen experiment (green stars). These latter data from CLAS are in excellent agreement with the new data from this analysis and serve as a validation for the first-time measurements of the target asymmetry presented in the following section.
The overall agreement of the angular distributions from all experiments ranges from fair to good with some more serious discrepancies in certain bins. For example, the CBELSA/TAPS data points tend to be bigger in magnitude than the GRAAL 2006 results, particularly for the center angles, , of the first two energy bins. The GRAAL Collaboration aimed at resolving this issue with additional measurements but the results published in 2015 exhibited even greater inconsistencies with the previous measurements, especially between the two GRAAL measurements themselves. The more recent results appear to be significantly smaller in magnitude in the central region around .
In the lower-energy range below 1.5 GeV, the CLAS results can be compared with the previously published data. They are in very good agreement with the GRAAL 2006 and in fair agreement with the GRAAL 2015 results close to the threshold. The CBELSA/TAPS data points suffer from significantly larger statistical uncertainties but the agreement with the CLAS results is fair and mostly within uncertainties. All of this provides confidence in the new CLAS-FROST data and also resolves the inconsistency between the two GRAAL measurements in favor of the 2006 results.
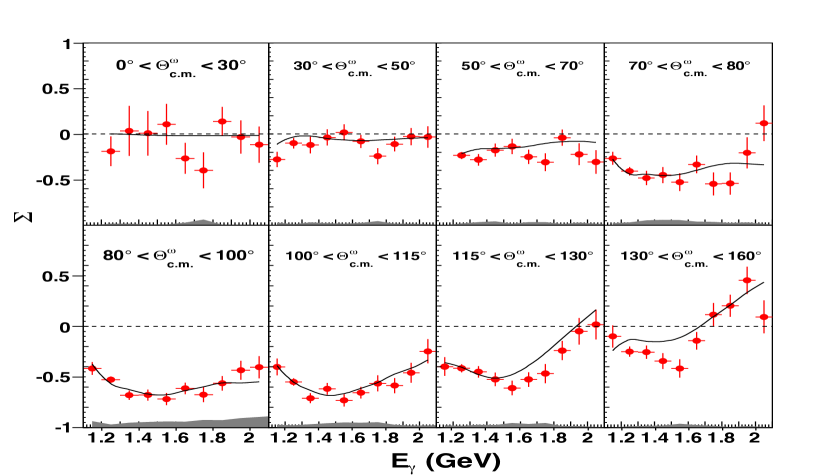
Figure 9 shows the beam asymmetry as a function of the incident-photon energy for different bins. The first angle bin, , suffered from low statistics at all energies. However, the results in the subsequent angle bins clearly show that the overall shape of the beam asymmetry with respect to energy changes noticeably upon moving from forward to backward angles. The asymmetry is small and almost consistent with zero across the entire energy range for , whereas it grows bigger in the successive angle bins, reaching a value of about 0.55 in the angle bin.
V.2 The Target Asymmetry
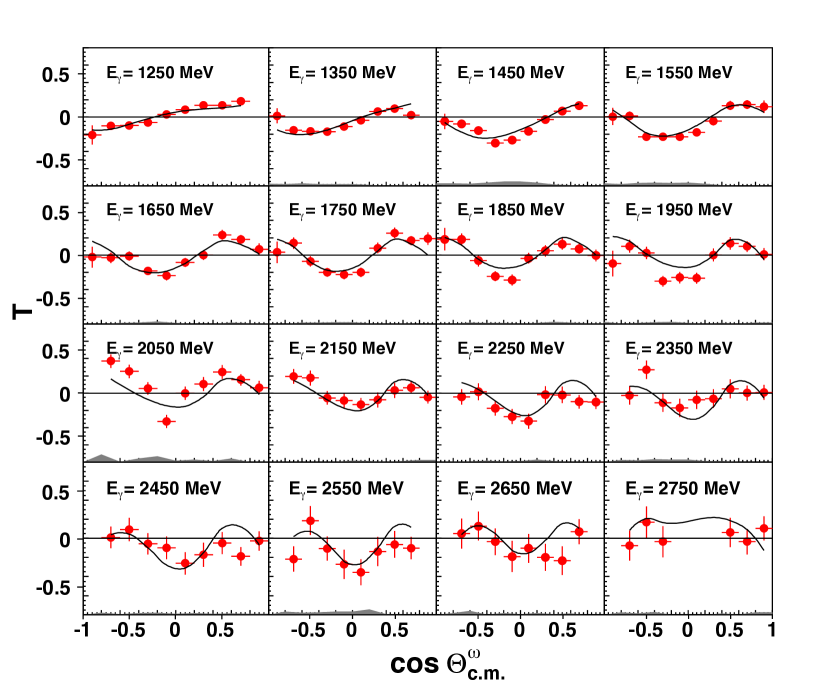
Figure 10 shows the results for the target asymmetry in the photoproduction reaction (Eq. 1) including the statistical uncertainties for each data point from FROST as a function of cos . The data points are given for 16 energy bins in the incident-photon energy range MeV; Each energy bin is -MeV wide. The numerical values for the data presented in Fig. 10 including the statistical and systematic uncertainties are available in Ref. PRC:SupplementalMaterial . The observable exhibits rich structures and acquires large values of about 0.3 - 0.4 around cos over a large energy range.
V.3 Systematic uncertainties
The individual contributions to the overall systematic uncertainty for each observable that were studied in this analysis are listed in Table 1. The absolute systematic uncertainty due to the background subtraction is shown as an error band at the bottom of each distribution in Figs. 8 - 10. The fractional uncertainties were added in quadrature and the totals are given in Table 1.
A major contribution came from the event-based background-subtraction technique. To estimate this contribution to the overall systematic uncertainty, the value of each event was increased by and the beam asymmetry was re-extracted. Here, denotes the fit uncertainty in the value of the event. The change in the observable in each kinematic bin provided an absolute uncertainty in the observable due to this method. For the beam asymmetry, it was observed to be on average above MeV in the incident photon energy. This procedure was based on the assumption that the chosen signal and background pdfs properly described the data. However, as mentioned in Section III, the description was not always satisfactorily close to the photoproduction threshold. In such situations, a dip-like structure in the background distribution under the peak was observed. To estimate the systematics associated with this effect, the background distribution was fitted with a second-order polynomial in the range , where was the width of the peak. The fractional difference between the original background and the fit in the range was determined to be about 5 - 7 % on average. To quantify the effect of this fractional difference on the final observables, the following strategy was employed: Since the background was under-estimated in the region , equivalent to the signal being over-estimated, the values of the events belonging to this mass range were changed by . The observable was then re-determined and the fractional difference between the original observable and the modified observable was quoted as the systematic uncertainty. It was determined to be on average in the energy range GeV.
| Source | Systematic Uncertainty | |
| Background subtraction | given as gray band for each | |
| distribution in Figs 8, 9, 10 | ||
| Beam-polarization | ||
| Target-polarization | ||
| Target-offset angle | ||
| Normalization | ||
| beam asymmetry | ||
| target asymmetry | ||
| Beam asymmetry | ||
| (fractional only) | ||
| Target asymmetry | ||
| (fractional only) |
The systematic uncertainty in the linear-beam polarization was evaluated to be , a value which was also used in other CLAS analyses Paterson:2016vmc ; Dugger:2013crn . The systematic uncertainty associated with the target polarization was determined to be Keith:2012ad . To estimate the systematic uncertainty in the observable due to the target-offset angle, this angle was varied by its uncertainty of and the change in the re-extracted observable was examined. It was found to be on average.
For the measurement of the beam asymmetry, three factors were required to normalize the four linearly-polarized data sets, as can be seen from Eqs. 9-13 (Section IV.1):
| (22) |
The first two normalization factors were needed to unpolarize the target in the ‘’ and ‘’ data sets, respectively. The third normalization factor was then required to normalize the corresponding ‘’ and ‘’ data sets (after the target was rendered unpolarized). The uncertainties in the normalization factors depended on the uncertainties in the flux ratios, which were obtained from the ratios of the numbers of reconstructed events originating from the polyethylene target. One way to estimate the systematic uncertainty in these ratios was to compare them with the ratios obtained from the carbon target. The results were found to differ by or less at all energies. Another way to check the systematics of this method was to use the direct information on the photon flux from the photon tagging system. Although this information was not available for the FROST data used in this analysis, it was available for FROST-g9a data, which utilized a circularly-polarized beam and a longitudinally-polarized target. The results differed again by only from those determined for the polyethylene target. The applied uncertainties of in the flux ratios as well as the uncertainty in the target polarization were used to evaluate the overall uncertainties in the normalization factors using standard error propagation. Since each normalization factor could be varied by , all permutations were performed and the observable re-extracted. The change in the beam asymmetry was observed to be on average across all energies.
For the measurement of the target asymmetry using circularly-polarized data, only one factor was required to normalize data sets with opposite target polarization (Section IV.2) and thus, the systematic uncertainty in the overall normalization was smaller than for the linearly-polarized data. Following the same procedure as for the beam asymmetry, the normalization factor was changed by 2 % and the observable re-extracted. An effect of was observed in the target asymmetry due to the normalization.
VI Partial Wave Analysis
The data presented here were included in a partial-wave analysis within the Bonn-Gatchina (BnGa) PWA framework. The scattering amplitudes in the BnGa analysis for the production and the decay of baryon resonances are constructed in the framework of the spin-momentum operator expansion method. The details of this approach are discussed in Ref. Anisovich:2006bc . The approach is relativistically invariant and allows for the combined analyses of different reactions imposing analyticity and unitarity directly. The BnGa database takes into account almost all important data sets of photo- and pion-induced reactions, including three-body final states Anisovich:2011fc . A full description of the experimental database BnGa:Database goes beyond the scope of this paper.
The BnGa group has recently reported on a PWA Denisenko:2016ugz of photoproduction data that was based on results from the CBELSA/TAPS Collaboration alone. The data sets and the relevant observables (d/d, SDMEs, , , and ), which were used in the PWA, are discussed in Refs. Denisenko:2016ugz ; Wilson:2015uoa . The new BnGa-PWA solution, which includes data from the CLAS Collaboration, is shown in Figs. 8 - 10 as a solid line. The CLAS data include the polarization observables and (presented here), , , , and . More details on the PWA framework and branching ratios for decays into will be discussed in a subsequent publication Anisovich:2017 .
In the FROST data presented here, large beam asymmetries, as well as smaller but significantly non-zero target asymmetries are observed, which indicate significant -channel contributions, in agreement with the expectation from the BnGa PWA. Close to the reaction threshold, the leading partial waves are the and waves, which are identified with the and the sub-threshold nucleon resonances. Recent calculations that used an effective chiral Lagrangian approach Zhao:2000tb also found these two resonances to play a major role in photoproduction. In particular, the was analyzed in the beam polarization asymmetries. The partial wave is complex and multiple nucleon resonances likely contribute to our data around GeV. The importance of the wave was also discussed in an earlier event-based PWA based on CLAS cross section data and unpolarized spin-density matrix elements alone Williams:2009aa . The BnGa PWA finds indications for at least one more resonance around GeV.
Toward higher energies, the -channel contributions increase in strength and in the case of , the linear-beam polarization allows for the separation of natural- from unnatural-parity exchange processes. The BnGa group has found that pomeron-exchange dominates over the smaller -exchange across the presented energy range. Further -resonance contributions are required to describe the data at and above center-of-mass energies of GeV. The , , and partial waves play a significant role in the PWA solution. In addition to the close to the threshold, a further structure around GeV is observed, which is identified with the state. The latter is listed as a one-star state in the RPP Olive:2016xmw and considered a missing baryon resonance.
A full discussion of the contributing resonances can be found in a forthcoming paper on the details of the PWA Anisovich:2017 .
VII Summary
The photon-beam asymmetry for the photoproduction reaction has been measured at Jefferson Laboratory using the CLAS spectrometer and the frozen-spin FROST target, covering the energy range from 1.1 to 2.1 GeV. The meson has been studied via its decay. The high-quality FROST results are in overall fair agreement with previously published data (including CLAS) and help shed some light on earlier-observed discrepancies among the known data sets. Moreover, first-time measurements of the target asymmetry have been presented covering a large incident-photon energy range from 1.2 to 2.8 GeV. These data are rich in structures. The angular distributions change from an almost linear behavior close to the reaction threshold to a more oscillatory behavior at higher energies. The asymmetries acquire significant values of up to 0.4, mostly around cos .
Acknowledgements.
The authors thank the technical staff at Jefferson Lab and at all the participating institutions for their invaluable contributions to the success of the experiment. This material is based upon work supported by the U.S. Department of Energy, Office of Science, Office of Nuclear Physics, under Contract No. DE-AC05-06OR23177. The group at Florida State University acknowledges additional support from the U.S. Department of Energy, Office of Science, Office of Nuclear Physics, under Contract No. DE-FG02-92ER40735. This work was also supported by the US National Science Foundation, the State Committee of Science of Republic of Armenia, the Chilean Comisión Nacional de Investigación Cientifica y Tecnológica (CONICYT), the Italian Istituto Nazionale di Fisica Nucleare, the French Centre National de la Recherche Scientifique, the French Commissariat a l’Energie Atomique, the Scottish Universities Physics Alliance (SUPA), the United Kingdom’s Science and Technology Facilities Council, and the National Research Foundation of Korea, the Deutsche Forschungsgemeinschaft (SFB/TR110), and the Russian Science Foundation under grant 16-12-10267.References
- (1) R. G. Edwards et al., Phys. Rev. D 84, 074508 (2011).
- (2) S. Capstick and W. Roberts, Prog. Part. Nucl. Phys. 45, S241 (2000).
- (3) U. Loring, B. C. Metsch and H. R. Petry, Eur. Phys. J. A 10, 447 (2001).
- (4) S. Sarkar, B. X. Sun, E. Oset and M. J. Vicente Vacas, Eur. Phys. J. A 44, 431 (2010).
- (5) C. Patrignani et al. [Particle Data Group], Chin. Phys. C 40, no. 10, 100001 (2016).
- (6) E. Klempt and J. M. Richard, Rev. Mod. Phys. 82, 1095 (2010).
- (7) V. Crede and W. Roberts, Rept. Prog. Phys. 76, 076301 (2013).
- (8) M. Pichowsky, C. Savkli and F. Tabakin, Phys. Rev. C 53, 593 (1996).
- (9) J. Barth et al., Eur. Phys. J. A 18, 117 (2003).
- (10) M. Williams et al. [CLAS Collaboration], Phys. Rev. C 80, 065208 (2009).
- (11) A. Wilson et al. [CBELSA/TAPS Collaboration], Phys. Lett. B 749, 407 (2015).
- (12) I. I. Strakovsky et al., Phys. Rev. C 91, 045207 (2015).
- (13) J. Ajaka et al., Phys. Rev. Lett. 96, 132003 (2006).
- (14) F. Klein et al. [CBELSA/TAPS Collaboration], Phys. Rev. D 78, 117101 (2008).
- (15) V. Vegna et al. [GRAAL Collaboration], Phys. Rev. C 91, no. 6, 065207 (2015).
- (16) P. Collins et al., Phys. Lett. B 773, 112 (2017).
- (17) H. Eberhardt et al., Phys. Lett. B 750, 453 (2015).
- (18) Z. Akbar et al. [CLAS Collaboration], Phys. Rev. C 96, no. 6, 065209 (2017).
- (19) I. Denisenko et al., Phys. Lett. B 755, 97 (2016).
- (20) C. D. Keith et al., Nucl. Instrum. Meth. A 684, 27 (2012).
- (21) B. A. Mecking et al., Nucl. Instrum. Meth. A 503, 513 (2003).
- (22) S. Strauch et al. [CLAS Collaboration], Phys. Lett. B 750, 53 (2015).
- (23) I. Senderovich et al. [CLAS Collaboration], Phys. Lett. B 755, 64 (2016).
- (24) U. Timm, Fortsch. Phys. 17, 765 (1969).
- (25) D. Lohmann et al., Nucl. Instrum. Meth. A 343, 494 (1994).
- (26) D. I. Sober et al., Nucl. Instrum. Meth. A 440, 263 (2000).
- (27) K. Livingston, Nucl. Instrum. Meth. A 603, 205 (2009).
- (28) K. Livingston, Jefferson Lab CLAS-Report 2011-020, https://misportal.jlab.org/ul/Physics/Hall-B/clas/viewFile.cfm/2011-021.pdf?documentId=657
- (29) A. Abragam and M. Goldman, Rep. Prog. Phys. 41, 396 (1978).
- (30) E. S. Smith et al., Nucl. Instrum. Meth. A 432, 265 (1999).
- (31) M. Williams, M. Bellis and C. A. Meyer, JINST 4, P10003 (2009).
- (32) P. Roy, Doctoral Dissertation (2016), Florida State University, https://www.jlab.org/Hall-B/general/clas_thesis.html.
- (33) C. A. Paterson et al. [CLAS Collaboration], Phys. Rev. C 93, no. 6, 065201 (2016).
- (34) MINUIT - Function Minimization and Error Analysis, CERN Program Library entry D506, Copyright CERN, Geneva 1994.
- (35) See Supplemental Material at [URL will be inserted by publisher] for the numerical values of the presented data.
- (36) M. Dugger et al. [CLAS Collaboration], Phys. Rev. C 88, no. 6, 065203 (2013) Addendum: [Phys. Rev. C 89, no. 2, 029901 (2014)].
- (37) A. V. Anisovich and A. V. Sarantsev, Eur. Phys. J. A 30, 427 (2006).
- (38) A. V. Anisovich et al., Eur. Phys. J. A 48, 15 (2012).
- (39) http://pwa.hiskp.uni-bonn.de/baryon_x.htm
- (40) A. V. Anisovich et al., in preparation.
- (41) Q. Zhao, Phys. Rev. C 63, 025203 (2001).
- (42) M. Williams et al. [CLAS Collaboration], Phys. Rev. C 80, 065209 (2009).