Chandra Observation of PWN G16.73+0.08 in SNR G16.7+0.1
Abstract
We present X-ray observations of PWN G16.73+0.08/SNR G16.7+0.1 using archival data of Chandra ACIS. The X-ray emission peak location of this pulsar wind nebula is found to be offset by 24 arcsec from the centre of the 1.4-GHz emission of this nebula. The X-ray nebula is elongated in the direction from the X-ray peak to the 1.4-GHz emission centre. This offset suggests that G16.73+0.08 is an evolved pulsar wind nebula interacting with the supernova remnant reverse shock. We identify a point source, CXO J182058.16-142001.5, near the location of the X-ray peak. The spectrum of the X-ray nebula can be described by an absorbed power law of photon index and hydrogen column density cm-2. CXO J182058.16-142001.5 is likely a pulsar. We estimate its spin-down power to be about erg s-1. Assuming its age at 3000 and 10,000 years, its dipole magnetic field strength at the polar surface is estimated to be about G and G, respectively.
keywords:
ISM: individual objects: G16.7+0.1 – X-rays: individual: G16.73+0.08 – stars: neutron – pulsars: general – ISM: supernova remnants – radiation mechanisms: non-thermal1 Introduction
The term ’Pulsar Wind Nebulae’ (PWNe) was first proposed by Hester & Kulkarni (1988a), motivated by theoretical and observational works in the 1980’s on the interpretation of the observed radio and X-ray nebulae or cores in supernova remnants (SNRs). It was realized that these objects are not part of remnants of supernova explosion events, but objects driven by the relativistic winds injected from the central pulsar and interacting with ISM or with supernova ejecta (e.g., Kennel & Coroniti (1984); Michel (1985); Chevalier (1987); Kulkarni & Hester (1988); Hester & Kulkarni (1988b)). The study of PWNe has provided information about physical properties of ISM and supernova ejecta, about the composition, energetics and evolution of the winds, and about the wind injection rate of the pulsar. In addition, pulsar winds are likely related to the so-called positron excess in cosmic rays, which otherwise may have a dark-matter origin (e.g., Erlykin & Wolfendale (2013); Feng & Zhang (2016)). PWNe are also found to be major TeV sources in the sky. To date, about 60 PWNe are found, although of nearly half of which the central pulsars are yet to be identified. For a more comprehensive review, readers are referred to, e.g., Kargaltsev et al. (2015), Porth et al. (2017), and Reynolds et al. (2017).
G16.73+0.08 is believed to be a PWN in the SNR G16.7+0.1. Its radio emission from 90 cm to 2 cm was reported in Helfand et al. (1989). ASCA observation yielded a detection of an unresolved source (Sugizaki et al., 2001). Later in XMM observation an extended source was revealed, which is located near the geometric centre of SNR G16.7+0.1 (Helfand, Agueros & Gotthelf, 2003). This gives a hint of possible location offset between the XMM-observed X-ray nebula and the radio nebula of G16.73+0.08, because the radio nebula is about 28 arcsec away from the geometric centre of G16.7+0.1. We noticed that Chandra had also observed this source in 2003 and therefore started the analysis of this Chandra data. Our results are reported in this paper. With Chandra’s fine angular resolution, we confirm the location offset between the X-ray and radio nebulae of G16.73+0.08. This morphology indicates that G16.73+0.08 is likely an evolved system interacting with the supernova-remnant reverse shock (Blondin, Chevalier & Frierson, 2001; van der Swaluw, Downes & Keegan, 2004; Temim et al., 2015; Kolb et al., 2017). We also identify a point X-ray source near the peak of the X-ray nebula. The spectrum of the X-ray nebula can be described by an absorbed power law, consistent with earlier XMM observation. We describe the Chandra data and image morphology in Section 2, spectral analysis in Section 3, and discuss the location offset between the X-ray and radio nebulae of G16.73+0.08 and other physical properties of the possible pulsar at the centre of the X-ray nebula in Section 4.
2 Data and Image Morphology
The Chandra X-ray Observatory (Weisskopf, O’Dell & van Speybroeck, 1996) observed G16.7+0.1 on 2003 October 3 with ACIS-S without grating in a timed-exposure (TE) mode (ObsId: 3845; PI: D. Helfand). The usable data volume, after GTI filtering, is about 25 ksec. We processed this data using Chandra Interactive Analysis of Observations (CIAO) software version 4.9 to produce level 2 data for further analysis. We selected only those data in the energy range from 1 keV to 8 keV to have better energy calibration information, lower particle background and lower ACIS quantum efficiency contamination for this study.
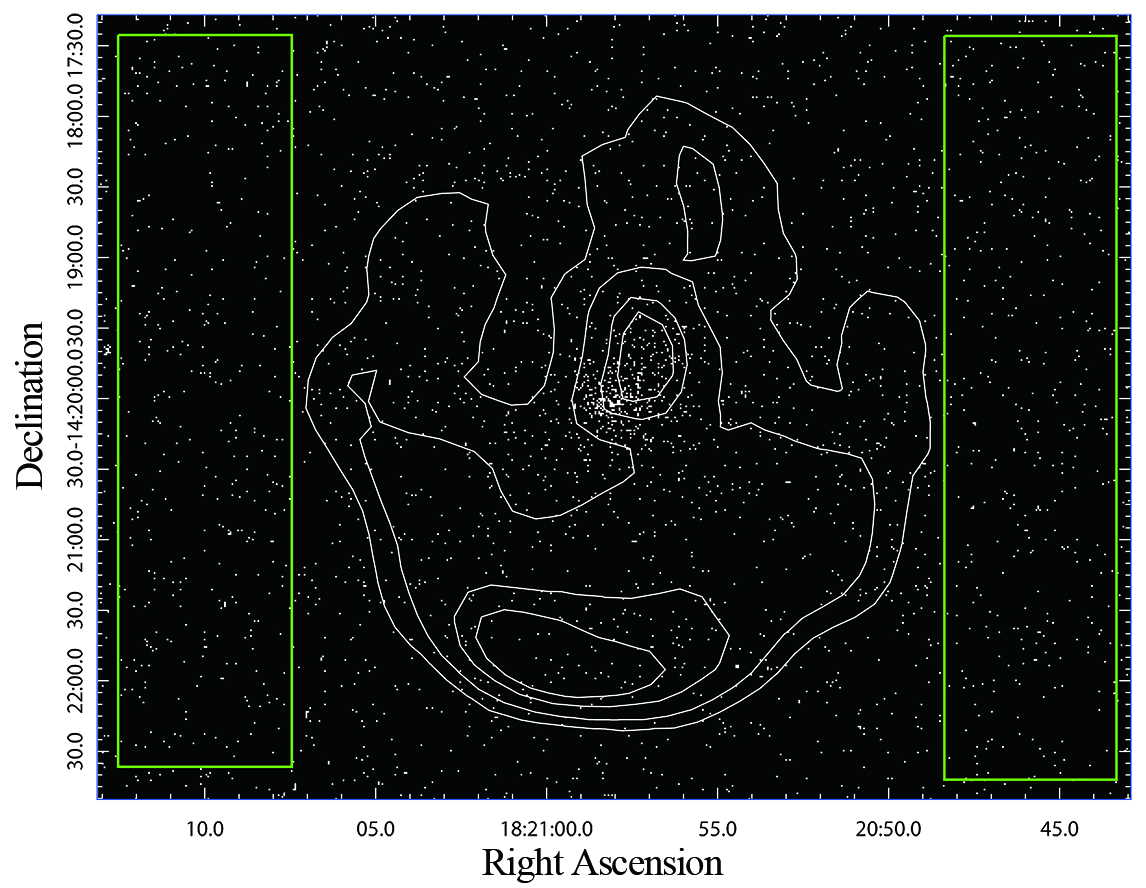
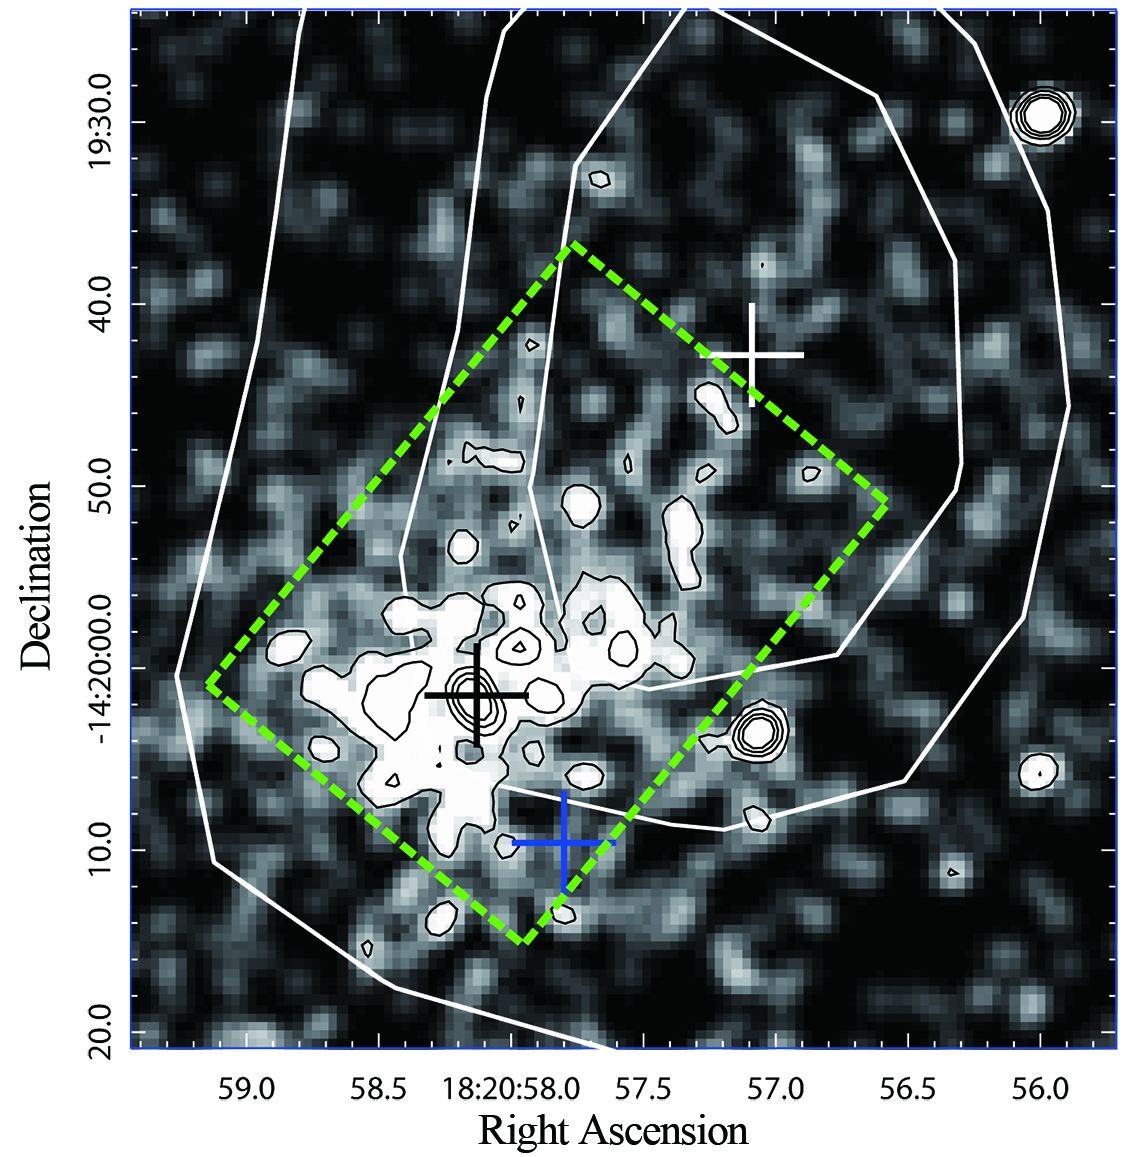
Fig. 1 shows the Chandra image of G16.73+0.08 overlaid with JVLA 1.4-GHz continuum contours (see alsoZhang et al. (2017)). It is clear in this figure that the X-ray nebula does not coincident well with the 1.4-GHz nebula near the centre of SNR G16.7+0.1. Fig. 2 is a zoom-in view of this central region. The three crosses indicate the positions of the X-ray emission peak (black, ), the centre of the 1.4-GHz nebula (white, ), and the geometric centre of the radio SNR G16.7+0.1 (blue, , as quoted in Helfand, Agueros & Gotthelf (2003)). The X-ray nebula is elongated in the direction from the X-ray peak to the 1.4-GHz nebula centre, with a size of about 30 arcsec 20 arcsec. Two point-like sources in Fig. 2, located at 16 arcsec to the west of the X-ray peak and at the top-right in the figure, are spatially coincident with two point sources in the 2MASS catalog, 2MASS 18205707-1420034 () and 2MASS 18205669-1419295 (), respectively.
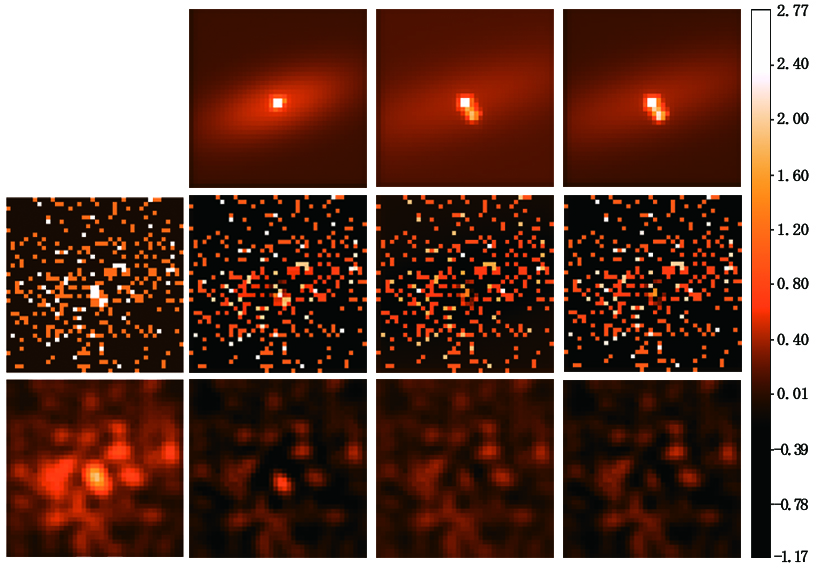
The X-ray emission peak, located at 24 arcsec away from the 1.4-GHz nebula centre to the southeast, is highly concentrated. To study the morphology in more details, we used a model composed of a delta function, a two-dimensional Gaussian and a constant to fit the image data in a 20-arcsec 20-arcsec region centred at the X-ray emission peak location, the black cross in Fig. 2. The model was convolved with a Chandra point spread function, which we obtained with the Chandra Ray Tracer (ChanRT) simulator (Carter et al., 2003) at photon energy 3.5 keV and with the MARX package version 5.3.2 (Davis et al., 2012). Results of this model fitting are shown in the 2nd column in Fig. 3. In the top panel is the convolved model. The middle panel is the residual image and the bottom panel is the smoothed residual image. Although this fitting is well acceptable with , mainly due to the small number of photons, 397, in this 40-pixel 40-pixel region, a bright feature remains at the location of the X-ray emission peak. We therefore added one more two-dimensional Gaussian to account for that feature. Results of this fitting are shown in the 3rd column in Fig. 3. This fitting is similarly acceptable, but that bright feature is gone. This second Gaussian component, whose FWHM is about 2.6 arcsec, might be manifestation of a possible torus around the central neutron star represented here by the delta-function component. Values of its fitting parameters are shown in Table 1. We note, however, that a model without the delta-function component, that is, consisting of a constant and two two-dimensional Gaussians, also gives an equally well fitting and there is no bright featute at the centre either. Results of this fitting are shown in the 4th column in Fig. 3. It casts some doubt on the existence of a point source at the centre, as judged from the data. Nonetheless, the model with a delta function and two Gaussians besides a constant, seems more physical, since it presents a picture of a neutron star, a possible torus, and a pulsar wind nebula. We identify the central point source, represented here by the delta function component, as CXO J182058.16-142001.5.
| Model A (the 3rd column in Fig. 3): | |
|---|---|
| The delta-function component | |
| location R.A.: | |
| location Dec.: | |
| photon count: | 12.32 |
| The 2-d Gaussian component I | |
| centre R.A.: | |
| centre Dec.: | |
| ellipticity: | 0.88 |
| FWHM: | |
| major-axis direction: | from north to east |
| photon count: | 13.96 |
| The 2-d Gaussian component II | |
| centre R.A.: | |
| centre Dec.: | |
| ellipticity: | 0.73 |
| FWHM: | |
| major-axis direction: | from north to east |
| photon count: | 123.48 |
| The constant component | |
| photon count: | 197.27 |
| Model B (the 4th column in Fig. 3): | |
| The 2-d Gaussian component I | |
| centre R.A.: | |
| centre Dec.: | |
| ellipticity: | 0.88 |
| FWHM: | |
| major-axis direction: | from north to east |
| photon count: | 26.24 |
| The 2-d Gaussian component II | |
| centre R.A.: | |
| centre Dec.: | |
| ellipticity: | 0.72 |
| FWHM: | |
| major-axis direction: | from north to east |
| photon count: | 124.09 |
| The constant component | |
| photon count: | 194.84 |
3 Spectral Analysis
To study the X-ray spectrum of this elongated nebula, we defined the target region for spectral analysis as the rectangular region shown in Fig. 2. The background region was chosen to be the two rectangular regions outside the SNR, as shown in Fig. 1. The spectrum of this target region, in keV, can be well fitted ( for 22 d.o.f) by an absorbed power law of a photon index () and a neutral hydrogen column density cm-2. The interstellar absorption model employed in our analysis is an photoelectric absorption model (‘phabs’ in XSPEC) with the assumed abundance taken from Anders & Grevesse (1989). These results are consistent with the earlier XMM observation (Helfand, Agueros & Gotthelf, 2003). On the other hand, we actually expect this region contains not only the pulsar wind nebula, but also some contribituion from the SNR. Adding one more thermal spectral componet (‘bremss’ in XSPEC) to the model, however, yields a best fit with a larger , 0.85. Although it is still an acceptable fit, the thermal component becomes the dominating one in such a fit, and the uncertainty ranges of its fitting parameters are so large that XSPEC (version 12.0.9n) cannot give a valid error estimate. We do not think this is an adequate fit. We conclude that the contribution from the SNR is negligible based on the current data.
Although the above power-law fitting describes the spectrum very well, the central neutron star, together with the tiny extended source as revealed in our imaging analysis, can have a spectral behavior very different from the PWN. We therefore also performed another spectral analysis with the central region, defined as a circular region of radius 2 arcsec centred at the X-ray peak location, removed from the PWN.
| The whole target region | |
|---|---|
| Column density, | cm-2 |
| Photon index, | |
| 0.78 | |
| Degrees of freedom | 22 |
| Unabsorbed flux (0.5 - 10 keV) | erg cm-2 s-1 |
| Target region without the central circle | |
| Column density, | cm-2 |
| Photon index, | |
| 1.19 | |
| Degrees of freedom | 20 |
| Unabsorbed flux (0.5 - 10 keV) | erg cm-2 s-1 |
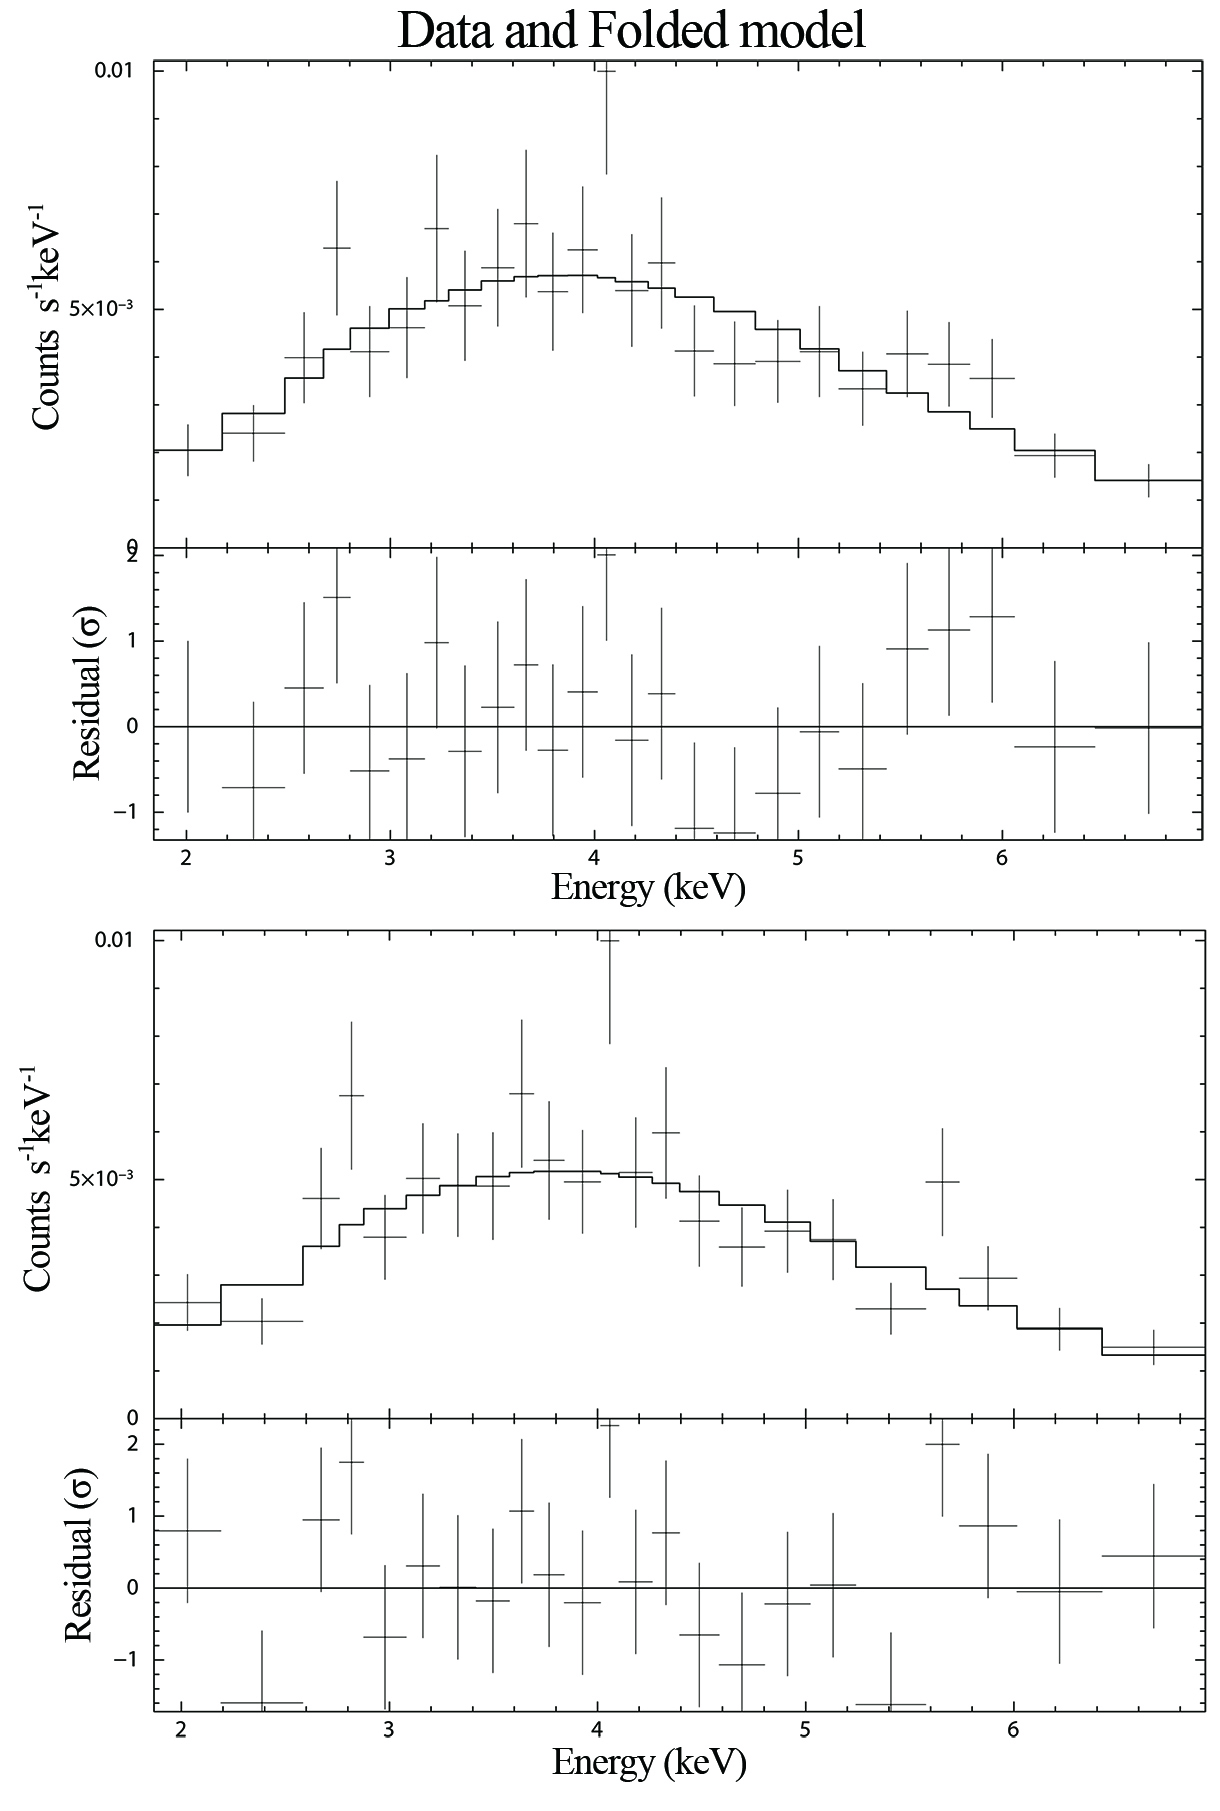
We fit the spectrum of the PWN target region without the central circle with a power-law model. Fitting results are shown in Table 2. The neutral hydrogen column density, cm-2 and the photon index, , do not change much. Similar to the spectrum of the whole target region with the central circle included, adding a thermal component to the spectral model does not improve the fitting. The fitting and residuals are shown in Fig. 4.
The central circle contains only 39 photons in keV, out of the 512 photons in the whole target region. It is difficult to have a meaningful spectral fitting. Its photon count is 11, 11, and 17 in the energy bands 1 – 3.4, 3.4 – 4.7, and 4.7 – 8.0 keV, respectively. The corresponding number for the whole target region is 164, 180, and 168.
In the Chandra X-ray image (Fig. 1), the X-ray emission in the SNR shell region is not obvious. Taking an annular region centred at the geometric centre of the radio SNR (the blue cross in Fig. 2) with a 45-arcsec inner radius and a 135-arcsec outer radius as the SNR shell region, the same as that defined in Helfand, Agueros & Gotthelf (2003), and another annular region from 135 arcsec to 175 arcsec as the background region, we found that there are 13014 photons in the SNR shell region and 9391 counts in the background region. The number of net counts in the shell region is 748.6, after subtracting estimated background counts. This number is 6.5 times the square root of 13014. We therefore conclude that the X-ray emission in the SNR shell region is detected at a level of about . This region is so background-dominated that a meaningful spectral fitting cannot be obtained.
4 Discussion
The offset between the 1.4-GHz and X-ray nebulae in G16.73+0.08 was revealed to some extent in the XMM data (Helfand, Agueros & Gotthelf, 2003), in which, with a coarser spatial resolution, the X-ray nebula was found to be close to the geometric centre of the radio SNR, while its radio nebula was known to be off centre (Helfand et al., 1989). With Chandra’s better resolution, we report the offset of 24 arcsec between the 1.4-GHz and X-ray nebulae in G16.73+0.08 in Fig. 2. We note that the nebula observed at 6-cm and 20-cm wavelengths has a weak extension to the location of the X-ray nebula and that the 2-cm emission in fact has a high intensity region surrounding the location of CXO J182058.16-142001.5, in addition to the 2-cm nebula coincident with that at 6-cm, 20-cm, and 1.4-GHz (Figure 2 in Helfand et al. (1989)). Such an offset between radio and X-ray nebulae has been observed in several pulsar wind nebulae, for example, G327.1-1.1 (Temim et al., 2015, 2009), G292.0+1.8 (Bhalerao et al., 2015), MSH 15-56 (Temim et al., 2013), MSH 11-62 (Slane et al., 2012), and Vela X (LaMassa, Slane & de Jager, 2008). The morphology of these PWNe in X-ray and radio bands can be interpreted as PWNe being interacting with (or, crushed by) the supernova remnant reverse shock (Blondin, Chevalier & Frierson, 2001; van der Swaluw, Downes & Keegan, 2004; Temim et al., 2015; Kolb et al., 2017). The asymmetry of the SNR reverse-shock sweeping direction may come from inhomogeneity of ISM, anisotropic SN explosion, and/or the motion of pulsars. Our study indicates that G16.73+0.08 is a member of this reverse-shock-crushed PWN family. The age of SNR G16.7+0.1 could therefore be larger than previuosly thought, because in such a case the SNR has passed the free expansion phase and is likely dynamically evolved. Though, its absolute age could still be on the order of a few thousand years if the ambient density is high. It depends strongly on the environment property; see, e.g., Temim et al. (2015) and Kolb et al. (2017).
From the spectral analysis of the X-ray nebula, we obtained a photon index of and column density cm-2, which are both in agreement with the photon index and cm-2 obtained from XMM observation (Helfand, Agueros & Gotthelf, 2003). The unabsorbed flux in 0.5 – 10 keV from our result is erg s-1 cm-2, comparable to the flux erg s-1 cm-2 obtained in Helfand, Agueros & Gotthelf (2003). Removing the contribution from the central source in a 2-arcsec-radius circular region does not change the fitting results much; see Table 2.
Based on an empirical relationship between the photon index of the X-ray nebula and the central pulsar’s spin-down power (Gotthelf, 2003), the photon index 0.99 gives a spin-down power of erg s-1 for the possible pulsar in G16.73+0.08. Using another empirical relationship between the X-ray luminosity (0.2 –- 4 keV) of the pulsar-powered nenula (including the pulsar) and the pulsar spin-down power , (Seward & Wang, 1988), we may also estimate the spin-down power. The derived unabsorbed flux from our fitting model in 0.2 – 4 keV is erg s-1 cm-2. Adopting a distance of 14 kpc (Zhang et al., 2017), the corresponding luminosity is erg s-1, which yields a spin-down power of erg s-1. We will use the average of the above two estimates, that is, erg s-1, for the following discussion.
In Helfand, Agueros & Gotthelf (2003), the age of the possible pulsar is estimated to be about 2100 years, based on the assumption that the SNR is in the free-expansion phase with an expansion speed of 3000 km/s and the SNR is at a distance of 10 kpc. Using a new distance measurement based on HI absorption and OH maser observations (Zhang et al., 2017), the distance to G16.7+0.1 is inferred to be 14 kpc. The age of the pulsar is then about 3000 years. However, considering the scenario that SNR reverse shock has already crushed the PWN, its age could be larger. Given the spin-down power and characteristic age , one may infer the pulsar’s period and its time derivative . For years, we have s and s s-1. For years, they are s and s s-1. The estimated dipole magnetic field strength at the polar surface is G and G for the above two cases, respectively.
In summary, the PWN G16.73+0.08 has its X-ray emission region separated from the radio one. It is likely that this PWN is in the stage of interacting with the SNR reverse shock. A point-like X-ray source, which we designate as CXO J182058.16-142001.5, is found near the brightness centre of the X-ray nebula, together with a small extended source, which may be a torus surrounding the neutron star. Future longer observations with adequate time resolution is very much desired to explore the properties of this possible pulsar. Observations with adequate spatial resolution is also needed to study spatially resolved spectra of the nebula. These are helpful to our understanding of how pulsars emit electron-positron pairs and how these pair plasmas, as the pulsar winds, propagate and evolve.
Acknowledgments
We are very much appreciative of valuable suggestions from the anonymous referee to improve this paper significantly. This research has made use of data obtained through the High Energy Astrophysics Science Archive Research centre Online Service, provided by the NASA/Goddard Space Flight Center. This work was supported by the Ministry of Science and Technology of the Republic of China under grants MOST 105-2112-M-007-002 and MOST 106-2811-M-007-008.
References
- Anders & Grevesse (1989) Anders, E., Grevesse, N., 1989, Geochimica et Cosmochimica Acta, 53, 197
- Bhalerao et al. (2015) Bhalerao, J., Park, S., Dewey, D., Hughes, J. P., Mori, K., Lee, J.-J., 2015, ApJ, 800, 65
- Blondin, Chevalier & Frierson (2001) Blondin, J. M., Chevalier, R. A., & Frierson, D. M., 2001, ApJ, 563, 806
- Carter et al. (2003) Carter, C., et al., 2003, ADASS XII ASP Conference Series, Vol. 295, p.477
- Chevalier (1987) Chevalier, R. A., 1987, Nature, 329, 611
- Davis et al. (2012) Davis, J. E., et al., 2012, SPIE 8443, 84431A
- Erlykin & Wolfendale (2013) Erlykin, A. D., & Wolfendale, A. W., 2013, Astroparticle Physics, 49, 23
- Feng & Zhang (2016) Feng, J., & Zhang, H.-H., 2016, EPJC, 76, 229
- Gotthelf (2003) Gotthelf, E.V., 2003, ApJ, 591, 361
- Helfand et al. (1989) Helfand D. J., Velusamy, T., Becker, R. H., & Lockman, F. J., 1989, ApJ, 341, 151
- Helfand, Agueros & Gotthelf (2003) Helfand D. J., Agueros M. A., & Gotthelf E. V., 2003, ApJ, 592, 941
- Hester & Kulkarni (1988a) Hester, J. J., Kulkarni, S. R., 1988a, Bulletin of the American Astronomical Society, Vol. 20, p.1050
- Hester & Kulkarni (1988b) Hester, J. J., Kulkarni, S. R., 1988b, ApJ, 331, L121
- Kargaltsev et al. (2015) Kargaltsev, O., Cerutti, B., Lyubarsky, Y., & Striani, E., 2015, Space Sci. Rev., 191, 391
- Kennel & Coroniti (1984) Kennel, C. F., Coroniti, F. V., 1984, ApJ, 283, 694
- Kolb et al. (2017) Kolb, C., Blondin, J., Slane, P., Temim, T., 2017, ApJ, 844, 1
- Kulkarni & Hester (1988) Kulkarni, S. R., Hester, J. J., 1988, Nature, 335, 801
- LaMassa, Slane & de Jager (2008) LaMassa, S. M., Slane, P. O., de Jager, O. C. 2008, ApJL, 689, L121
- Michel (1985) Michel, F. C., 1985, ApJ, 288, 138
- Porth et al. (2017) Porth, O., Buehler, R., Olmi, B., Komissarov, S., Lamberts, A., Amato, E., Yuan, Y., & Rudy, A., 2017 Space Sci. Rev., 207, 137
- Reynolds et al. (2017) Reynolds, S. P., Pavlov, G. G., Kargaltsev, O., Klingler, N., Renaud, M., & Mereghetti, S., 2017, Space Sci. Rev., 207, 175
- Seward & Wang (1988) Seward, F.D., & Wang, Z.-R., 1988, ApJ, 332, 199
- Slane et al. (2012) Slane, P., et al., 2012, ApJ, 749, 131
- Sugizaki et al. (2001) Sugizaki, M., Mitsuda, K., Kaneda, H., Matsuzaki, K., Yamauchi, S., & Koyama, K., 2001, ApJS, 134, 77
- Temim et al. (2009) Temim, T., Slane, P., Gaensler, B. M., Hughes, J. P., van der Swaluw, E., 2009, ApJ, 691, 895
- Temim et al. (2013) Temim, T., Slane, P., Castro, D., Plucinsky, P. P., Gelfand, J, Dickel, J. R., 2013, ApJ, 768, 61
- Temim et al. (2015) Temim, T., Slane, P., Kolb, C., Blondin, J., Hughes, J. P., Bucciantini, N., 2015, ApJ, 808, 100
- van der Swaluw, Downes & Keegan (2004) van der Swaluw, E., Downes, T. P., & Keegan, R., 2004, A&A, 420, 937
- Weisskopf, O’Dell & van Speybroeck (1996) Weisskopf, M. C., O’Dell, S. L., & van Speybroeck, L. P. 1996, Proc. SPIE, 2805, 2
- Zhang et al. (2017) Zhang, M. F., Tian, W. W., Zhu, H., Chang, H.-K., 2017, submitted