Size-scaling limits of impulsive elastic energy release from a resilin-like elastomer
Abstract
Elastically-driven motion has been used as a strategy to achieve high speeds in small organisms and engineered micro-robotic devices. We examine the size-scaling relations determining the limit of elastic energy release from elastomer bands with mechanical properties similar to the biological protein resilin. The maximum center-of-mass velocity of the elastomer bands was found to be size-scale independent, while smaller bands demonstrated larger accelerations and shorter durations of elastic energy release. Scaling relationships determined from these measurements are consistent with the performance of small organisms which utilize elastic elements to power motion. Engineered devices found in the literature do not follow the same size-scaling relationships, which suggests an opportunity for improved design of engineered devices.
I Introduction
Many organisms use impulsive, elastically-driven motion to exceed the power limitations of muscle James et al. (2007); Patek et al. (2011). For example, mantis shrimp store elastic bending energy in the exoskeleton of their raptorial appendages, which upon release drives their appendages at velocities up to 30 m/s, allowing them to crush shells or spear prey Patek et al. (2004); Zack et al. (2009); Rosario and Patek (2015); McHenry et al. (2016). Although large organisms make some use of elastic structures (e.g. tendon), elastic energy storage and release can be crucial for small organisms (typically in length) to achieve rapid movement Bennet-Clark (1977); James et al. (2007). These small organisms - such as mantis-shrimp, trap-jaw ants, locusts and fleas - use a latch to separate the phase of elastic energy storage (via muscle contractions) from that of energy release Ilton et al. (2018). Disentangling the rate of muscle contraction from energy release allows these organisms to achieve astonishing kinematic performance (high velocities, large accelerations, and short durations of movement), and perhaps most remarkably, to perform these motions in a repeatable manner sustained by their metabolic processes.
Organisms that store and release elastic energy have served as inspiration for recent robotics research Kovač et al. (2008); Debray (2011); Koh et al. (2013); Zhao et al. (2013); Kim et al. (2014); Koh et al. (2015); Zaitsev et al. (2015a); Haldane et al. (2016). Several research groups have taken a biomimetic or bioinspired approach in an attempt to match (or exceed) biological performance using engineered devices. This approach has led to new techniques for robotic manipulation Debray (2011); Rollinson et al. (2013); Kim et al. (2014); Haldane et al. (2016), the ability to move robots on difficult terrain Kovač et al. (2008); Koh et al. (2015); Zaitsev et al. (2015a), and has been used to test scientific hypotheses about locomotion Koh et al. (2013); Kim et al. (2014); Koh et al. (2015). However, these engineered devices are typically larger than biological organisms, and the fastest organisms have a greater kinematic performance than currently achievable by small robots using elastic elements to perform repeatable motions Ilton et al. (2018).
In addition to an elastic element (i.e. spring) there are three other major components of an elastically-driven system: (i) a motor (in many animals, muscle) that generates sufficient work to load the elastic element, (ii) an energy-efficient latch to store and release the elastic element without significant dissipation, and (iii) a load mass that is moved by the elastic element and that is not actively involved in elastic energy release. But since these systems drive motion through elastic recoil, the kinematic performance in these systems depends on the properties of an elastic element. Although springs are often assumed to be ideal, the materials properties and geometry of a spring can constrain its kinematics Ilton et al. (2018).
In this work, we address the gap in performance between biological and synthetic systems by examining the role of size-scale and materials properties for elastic energy storage and release. To determine the limits of elastic energy release due to only spring properties, we take a reductionist approach by examining the dynamics of a freely-retracting spring in isolation - externalizing the motor and latch. This externalization decouples the motor and latch from the fast movement of the spring, which is similar to the way some fast elastically-driven organisms operate Cox et al. (2014). Here we take this isolation one step further by measuring the dynamics of a spring that carries no additional load mass. From an initially uniform uniaxial extension, we release long thin bands of polyurethane elastomer. This polyurethane has similar mechanical properties to resilin, an elastomeric protein found in some arthropods and important for elastically-driven motion in locusts Burrows and Sutton (2012); Burrows (2016). Resilin is a material with high resilience (resilience is a measure of energy recovery, and is defined by the ratio of energy recovered upon unloading divided by the energy expended during loading a material) with 90% resilience measured for both natural and recombinant resilin Weis-Fogh (1961); Jensen and Weis-Fogh (1962); King (2010); Gosline et al. (2002); Elvin et al. (2005). We measure the free retraction of a resilin-like polyurethane elastomer, and building upon recent work Vermorel et al. (2007); Bogoslovov and Roland (2007); Niemczura and Ravi-Chandar (2011); Tunnicliffe et al. (2015); Yoon and Siviour (2017), track the full displacement field of the material. The displacement field is used to obtain the center-of-mass motion of the band, which allows for a functional determination of the scaling relations that define the limits of impulsive elastic performance. We focus on the size-scale and materials properties of a spring and how these factors affect its elastically-driven performance by examining three key parameters often used to assess kinematic performance in biology and micro-robotics James et al. (2007); Patek et al. (2011, 2004); Kovač et al. (2008); Rogers et al. (2016); Burrows (2006); Gerratt and Bergbreiter (2013); Irschick (2003): maximum center-of-mass velocity (), maximum center-of-mass acceleration (), and duration of elastic energy release (). Utilizing this experimental approach we ask two guiding questions: Does kinematic performance depend on the size of an elastic element? How does the kinematic performance of elastically-driven biological organisms and engineered devices compare to the isolated recoil of a resilin-like elastomer?
Expected scaling relations for the center-of-mass kinematic performance of a recoiling elastomer band can be rationalized based on physical principles. First, the center-of-mass acceleration of the band is given by the ratio of the net force acting on the band divided by its mass. Just after the release of the band from one end, if the only external force acting on the band is from the clamp at the other (fixed) end, then center-of-mass acceleration is
where is the initial stress from which the band is released, while and are the equilibrium length of the band and its density, respectively. To separate the role of materials and loading strain, we can rewrite this equation as
| (1) |
with the secant elastic wavespeed () from an initial strain () defined as
| (2) |
During the unloading of a uniform, long thin strip of elastic material stretched to an initial strain of , the center-of-mass travels a displacement . Using this displacement and assuming a constant center-of-mass acceleration given by Eq. (1), leads to the duration of elastic energy release
| (3) |
Finally, with those same assumptions, the maximum center-of-mass velocity is determined by the product of acceleration and duration, , yielding an expression consistent with the maximum velocity found in previous work for a linear elastic material Tunnicliffe et al. (2015)
| (4) |
II Materials and Methods
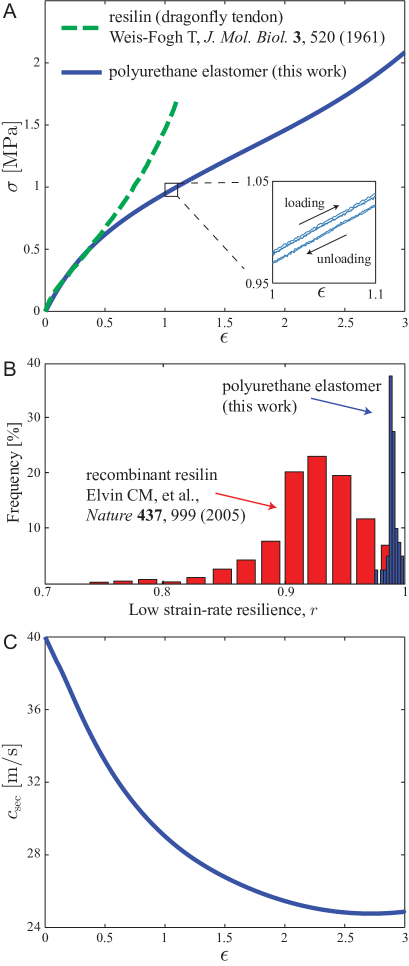
To experimentally verify these scaling relations, a commercially available pre-fabricated polyurethane elastomer sheet (McMaster-Carr, 8716K61, durometer 40A, thick) was sectioned into long, thin bands using a razor blade. For the narrowest bands (width, ), a laser cutter (Universal Laser Systems) was first used to create shallow grooves to guide the razor blade, reducing variation in the band width. Samples were cut to ensure a uniaxial geometry (), with and . The mechanical properties of the material were characterized by performing cyclic loading/unloading of the bands at low strain-rate (), using a tensile testing apparatus (Instron 5564). The polyurethane elastomer has similar mechanical response to resilin (Fig. 1A-B) at low strain-rates, and a resilience at up to 300% strain. Beyond 300% strain, the material would typically fail due to stress concentrations at the clamped ends of the band. While resilin can strain up to 300% reliably Weis-Fogh (1961), it is not generally observed to stretch this much in vivo. The highest suggested in vivo strain for a recoiling insect spring is in the flea pleural arch, where the resilinous portion is hypothesized to strain 100% Bennet-Clark and Lucey (1967) - thus our experimental elastomer strain covers the whole range of the strains seen in vivo. Over the full range of the polyurethane elastomer, the secant wavespeed of the polyurethane depends on strain and varies between (Fig. 1C), as calculated from Eq. 2 using the stress-strain relationship in Fig. 1A and the density of the material (average density of all samples , with the mass of each sample measured using an analytical balance).
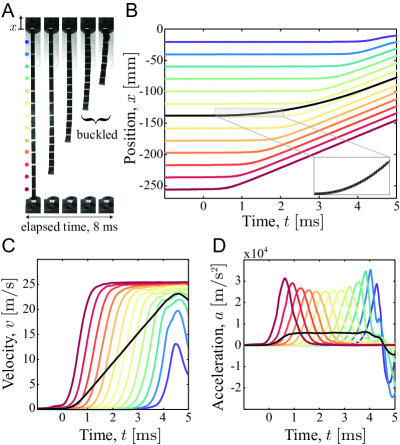
Free retraction measurements were performed by initially loading a band clamped between two pneumatic grips to a given initial strain () using the tensile testing apparatus, and then releasing one of the grips (Fig. 2A). Upon release, the band rapidly contracts, and the motion was recorded using a high speed camera (Photron Fastcam SA3, frame rate 20-75 kfps). A macro zoom lens (Nikon AF Nikkor 24-85mm) was used to maximize the image of the band to cover the full 1024 pixel CCD of the camera along the direction of motion (-axis), giving a pixel resolution of depending on the band length and initial strain. Markings, which had been placed along the band (Sharpie® marker, metallic silver), were then digitized from the high speed videography using a custom MATLAB script to determine the position () of each point of the band as a function of time () (Fig. 2B). To generate velocity, acceleration, and higher order derivatives of the position with respect to time, the digitized position data was fit to free knot splines Schwetlick and Schütze (1995); Schütze and Schwetlick (1997). Combining the motion of each section of the band, the center-of-mass kinematics were then deduced, allowing for the determination of and . The duration was defined as the time between the onset of the propagating elastic wave (determined by a minimum onset threshold of jerk) until the kinetic energy of the band reached its maximum (which occurs at ).
III Results
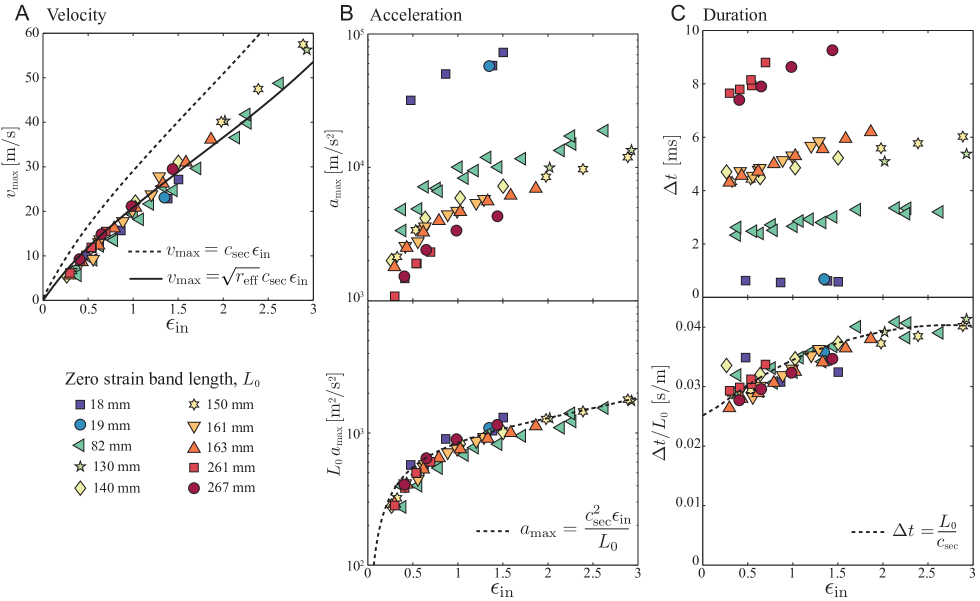
The kinematic performance of 13 different bands with varying geometry (varying and ) was measured (Fig. 2 shows an example measurement) as a function of the strain energy loaded into the band (between 1-8 values of for each band, for a total of 57 unique measurements). The center-of-mass kinematic performance does not depend on for the uniaxial geometry used in these experiments. The maximum center-of-mass velocity, acceleration, and duration all increase with increasing initial strain (Fig. 3A-C). The center-of-mass velocity is independent of the band length (Fig. 3A), however, the maximum center-of-mass acceleration and duration both depend on band length (Fig. 3B-C); the acceleration is inversely proportional to band length (Fig. 3B, bottom panel) and the duration scales with band length (Fig. 3C, bottom panel), as demonstrated by the data collapse after appropriately normalizing and with .
The scaling relations predicted by Eqs. (1-4) are comparable to the observed recoil kinematics (dashed curves in Fig. 3A-C), using measured from the tensile test (Fig. 1C). The scalings agree with the data for acceleration and duration with no free parameters (Fig. 3B-C). However, the scaling relationship for velocity systematically exceeds the observed recoil velocity (Fig. 3A).
To understand the systematic difference in predicted and measured recoil velocity, it is helpful to examine the predicted velocity scaling of Eq. (4) in the context of the kinematic data in Fig. 2D. The equation assumes a constant acceleration over the entire duration recoil. Although this is a reasonable approximation, the measured duration also includes the ramp-up time to reach ( in Fig. 1D) and the ramp-down to zero acceleration (also in Fig. 1D). During this ramp-up and ramp-down period the acceleration is less than , which leads to a breakdown in the predicted scaling of Eq. (4). Factors that could affect the ramp-up/ramp-down time include frictional losses from interaction of the band with the pneumatic clamp Tunnicliffe et al. (2015), inertia of elastomer material inside the clamp, dispersion of the elastic wave due to losses within the material or to the environment Vermorel et al. (2007), and residual strain left in the band at the point of buckling Bogoslovov and Roland (2007). These losses depend on both material properties of the band and external factors. Since these factors are challenging to accurately model, as a first approximation we assume these losses are constant for all the bands measured, and introduce an effective resilience of the recoiling elastomer through the scaling
| (5) |
This effective resilience accounts for both energy loss within the band and external dissipation (such as friction of the clamp), and is defined by the ratio of output kinetic energy to input elastic energy (i.e. , where is the stored elastic energy density). The energy loss seems to primarily occur during the ramp-up and ramp-down periods of the recoil, which accounts for why and do not depend on . Using as a free parameter to fit the measured recoil velocity (Fig. 3A, solid curve), results in . This effective resilience is significantly lower than that measured at low strain-rate (recall from Fig. 1B).
IV Discussion
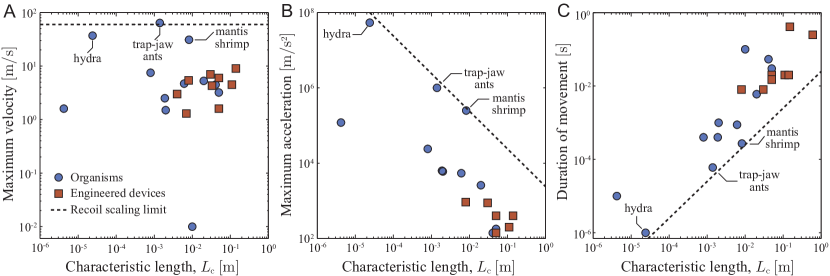
Armed with scaling relations that agree with the observed recoil kinematics, we now return to answering our first guiding question: Does kinematic performance depend on the size of an elastic element? The size-scaling limits of the resilin-like polyurethane elastomer for repeatable, elastic energy release (Fig. 4, dashed lines) are determined by setting the initial strain to in the scaling relations from Fig. 3 (recall for failure of the polyurethane was often observed). The maximum velocity of the polyurethane elastomer recoil is size-scale independent (Fig. 4A), while the maximum acceleration and duration of movement depend on size (Fig. 4B-C). The dashed lines in Fig. 4 represent the kinematic performance of this particular material choice of polyurethane elastomer, under a specific loading geometry (uniaxial extension), and driving zero added load mass. In the next two paragraphs we justify two specific claims about the recoil scaling limits shown in Fig. 4: (1) the overall scaling of kinematic performance with size does not depend on the specific choice material, geometry, or load mass, and (2) the dashed lines in Fig. 4 are an approximate upper bound for the particular material choice used in this study, independent of geometry and load mass.
First, the size-scaling of kinematic performance (summarized in the first column of Table 1) should be independent of the specific choice of materials, geometry, and load mass. Changing the elastic material would alter the pre-factors in the scaling limits through changing , failure properties, and resilience, without altering the fundamental trade-offs with size-scale Ashby (2011). A different geometry (e.g. using a cantilevered beam as a spring) or adding load mass to the system would alter the absolute kinematic performance of the system. However, if the relative size of elements all change with system size, then changing geometry or mass simply introduces a lengthscale-independent pre-factor to the scaling relations. As a specific example, for a cantilevered beam driving a heavy load mass the scaling relations shown in Fig. 3 still hold, but with added coefficients that depend on two dimensionless parameters: the aspect ratio of the beam (length to thickness), and the ratio of the spring mass to load mass (see Supplementary Information). Since these are independent of size-scale when relative size proportions are held constant, the scaling of kinematic performance with characteristic length shown in Fig. 4 are robust descriptions of the size-scale dependence of elastically-driven motion.
| Recoil | Organisms | Devices | |
|---|---|---|---|
| Velocity | |||
| Acceleration | |||
| Duration |
The second claim above — that for the specific polyurethane used in this study the dashed lines in Fig. 4 are an approximate upper bound to elastically-driven performance — is also related to the geometry and load mass. In both of these cases, changing geometry or adding load mass, the net effect is a decrease in the system’s kinematic performance and does not change the scaling argument in Fig. 4. Intuitively, adding load mass to the system would decrease the kinematic performance compared to the unloaded elastomer bands used here. The uniaxial geometry used in this work ensures a nearly uniform strain energy density in the material. Other geometries (such as bending) result in a non-uniform strain energy density, and material failure will likely occur at a lower average strain energy density than for uniaxial extension (see Supplementary Information). And although geometries which introduce a mechanical advantage in the system through a lever arm can amplify displacement, they also increase inertial load. As a result, a longer lever arm does not improve performance of the three kinematic parameters in Fig. 4. Therefore, changing geometry or load mass would shift the polyurethane scaling to lower performance (lowering the intercepts in the plots of Fig. 4), without altering the size-scaling relationship (the slopes in Fig. 4).
Putting these results in a larger context, we return to our second guiding question: How does the kinematic performance of elastically-driven biological organisms and engineered devices compare to the isolated recoil of a resilin-like elastomer? We interpret our results by comparing the size-scale dependence of the kinematic performance of the model elastomer with the performance of organisms and engineered devices that incorporate elastic elements (Fig. 4). The limits of kinematic performance for the polyurethane elastomer shows a similar size-scaling to elastically-driven organisms, which is in contrast to the engineered devices (Table 1). Specifically, the maximum acceleration scales inversely with characteristic lengthscale for both elastic recoil measurements and organisms, yet the maximum acceleration of current engineered devices depends more weakly on size-scale. We are cautious in the interpretation of this result as each organism or engineered device in this dataset represents a unique embodiment of materials properties and geometry of elastic energy release, and the engineered devices span a narrower range of lengthscales than the organisms. However, the connection between size-scale dependence of the recoil performance and elastically-driven organisms suggests a possible universality to the size-scaling limits of elastic energy release.
Another notable feature that emerges from Fig. 4 is the ability for examples from biology to match the performance of the synthetic elastomer system. The scaling limits of kinematic performance for the elastomer recoil is similar to the performance of hydra, trap-jaw ants, and mantis shrimp. This is impressive for three reasons. First, compared to our isolated polyurethane elastomer, we would expect a diminished performance for organisms because they have load mass that does not contribute to elastic energy storage. For example, in the raptorial appendage of mantis shrimp, the two regions that move furthest (the propodus and dactyl) do not store significant elastic energy Rosario and Patek (2015), and the added mass of these regions slows the release of elastic energy. Second, dissipation is likely much more significant at the lengthscales of these organisms Bennet-Clark (1977), and remarkably, both the hydra and mantis shrimp achieve their kinematic performance under water in a viscous environment. Finally, since performance of organisms in the lab is often inferior to that in nature Astley et al. (2013); Irschick (2003), the kinematic performance of these organisms could potentially be higher in a natural setting. The remarkable performance of hydra, trap-jaw ants, and mantis shrimp despite these hindering factors, suggests that the materials properties of the biological springs are likely critical to their kinematics. While resilin is often discussed as an energy store (going back to refs. Weis-Fogh (1961) and Bennet-Clark and Lucey (1967)), many arthropods also use the much harder chitin as a primary material to store energy, as is the case for chitinous springs in locusts Burrows and Sutton (2012); Wan et al. (2016), froghoppers Burrows et al. (2008); Siwanowicz and Burrows (2017), planthoppers Siwanowicz and Burrows (2017), mantis shrimp Tadayon et al. (2015), and trap-jaw ants Larabee et al. (2017). Chitin, having an elastic modulus orders of magnitude larger than resilin Vincent and Wegst (2004), may account for the ability of arthropod systems to surpass the maximums observed in our experiments which use a resilin-like elastomer as the primary energy store. This difference in modulus is consistent with observed elastic mechanisms in the highest performing organisms, including the chitinous exoskeletal elastic materials in mantis shrimp Patek et al. (2004) and trap-jaw ants Gronenberg (1996), along with mini-collagen fibrils in hydra Nüchter et al. (2006).
Material properties of elastic elements have been shown previously to play an important role in elastic energy storage and release in synthetic systems. Work on engineered devices has noted the importance of using spring materials with a high elastic energy density capacity, such as elastomers Lee (1990); Ashby (2011). Even though metals typically have a significantly higher elastic wavespeed, the large strain to failure of elastomers allows them to reach velocities that are often greater than that of metal springs Maier (1957). However, typical elastomers dissipate a significant fraction of the stored elastic energy (low resilience), so one might expect that elastomeric materials with high resilience, such as elastin or resilin found in some organisms King (2010); Gosline et al. (2002); Elvin et al. (2005), would serve as ideal candidates for the quick release of elastic energy. Understanding the trade-offs between resilience, elastic wavespeed, and maximum strain in biological materials employed by organisms undergoing elastically-driven motion could provide insight into the ultimate limits of elastic energy release. Recent evidence indicates that similar trade-offs persist in biological systems. While resilin and elastin are highly resilient materials, their capacity for elastic energy storage is low. This suggests that the coupling of resilient and stiff materials commonly found in biological systems may offset these inherent trade-offs Burrows et al. (2008). The weak size-scale dependence of the engineered devices (Table 1) and their diminished performance compared to biological organisms demonstrates that there are opportunities for improved design. For small-scale devices, performance enhancements could be developed from a bioinspired approach, utilizing composite elastic materials with both resilient and stiff components. Depending on the desired function of the device, this work suggests some advantage to engineering devices at smaller size-scales to maximize performance (e.g. maximizing acceleration or minimizing duration might be a goal). A deeper understanding of spring performance in the context of an on-board motor, latch, and load mass could further reveal important design principles currently limiting engineering design.
The impact of size-scale on kinematic performance is complicated by the choice of using either absolute performance, or scaling the performance relative to body size (relative performance). Biologists examine kinematics of organisms both in an absolute sense (a cheetah runs more quickly than an ant) and in a relative sense (relative to body size, some ants are faster than cheetahs). Relative performance of running (body lengths per second) and jumping (jump height per body length) have been used to characterize both biological organisms Avery and Bond (1989); Spagna and Peattie (2012); Burrows (2006); Rosario et al. (2016) and engineered devices Kovač et al. (2008); Saranli et al. (2001); Gerratt and Bergbreiter (2013); Gao et al. (2012). In biology, relative size has been used to standardize for size differences between animals in the same species Avery and Bond (1989) or across several species Spagna and Peattie (2012), and it has been suggested that relative performance is more ecologically relevant as it correlates well with the ability to evade predators Van Damme and Van Dooren (1999); Bergmann et al. (2009). Relative performance can also be used to normalize for drag effects, which become significant at small size-scales Bennet-Clark (1977). However, in contrast to the prevalent use of relative performance, we find that absolute velocity is a size-scale independent quantification of elastic performance for the lengthscales probed in the current work. Higher relative velocities (along with higher accelerations or shorter durations) can be achieved simply by reducing the size of an elastic element. Therefore, comparing the performance of systems that are orders of magnitude different in size-scale requires caution.
In summary, we have measured the kinematic performance of elastic energy release for an elastomer with similar mechanical properties to the protein resilin. In agreement with expected scaling relations, the maximum center-of-mass velocity of a freely retracting band is independent of length, and depends only on the initial strain at which the band was released and the elastic wavespeed of the material. The maximum center-of-mass acceleration and duration of elastic energy release were found to depend on the length of the elastomer band, with an improved performance at smaller size-scales. Previously reported measurements of kinematic performance in elastically-driven organisms show similar size-scaling limits to the elastomer studied here, whereas the acceleration of engineered micro-robotic devices varies more weakly with size-scale. The current results, which probe the upper bound of elastically-driven kinematics of a resilin-like material, show a similar performance to some of the fastest biological systems. Future work which seeks to delineate the role of elastic wavespeed, maximum strain, and resilience in elastic biological systems could lead to a foundational understanding for improved engineering design. Specifically, the mechanical properties of resilin, chitin, and resilin/chitin composites would be of great importance to compare to engineered systems.
Data accessibility.
All relevant data are included in the manuscript. This article has no additional data.
Authors’ contributions.
M.I. S.M.C., A.J.C. designed research; M.I., T.E. performed experiments; M.I., S.M.C., G.P.S., S.N.P., A.J.C. wrote the paper.
Competing interests.
The authors declare no conflict of interest.
Funding.
This material is based upon work supported by the U. S. Army Research Laboratory and the U. S. Army Research Office under contract/grant number W911NF-15-1-0358.
Acknowledgments.
The authors thank Professor Ryan Hayward and Tetsu Ouchi for help with high speed imaging.
References
- James et al. (2007) R. S. James, C. A. Navas, and A. Herrel, Journal of Experimental Biology 210, 923 (2007).
- Patek et al. (2011) S. N. Patek, D. M. Dudek, and M. V. Rosario, Journal of Experimental Biology 214, 1973 (2011).
- Patek et al. (2004) S. N. Patek, W. L. Korff, and R. L. Caldwell, Nature 428, 819 (2004), arXiv:arXiv:1011.1669v3 .
- Zack et al. (2009) T. I. Zack, T. Claverie, and S. N. Patek, Journal of Experimental Biology 212, 4002 (2009).
- Rosario and Patek (2015) M. V. Rosario and S. N. Patek, Journal of Morphology 276, 1123 (2015).
- McHenry et al. (2016) M. J. McHenry, P. S. Anderson, S. Van Wassenbergh, D. G. Matthews, A. P. Summers, and S. N. Patek, The Journal of Experimental Biology 219, 3399 (2016).
- Bennet-Clark (1977) H. C. Bennet-Clark, in Scale Effects in Animal Locomotion, edited by T. J. Pedley (Academic Press Ltd., London, 1977) pp. 185–201.
- Ilton et al. (2018) M. Ilton, M. S. Bhamla, X. Ma, S. M. Cox, L. L. Fitchett, Y. Kim, J.-S. Koh, D. Krishnamurthy, C.-Y. Kuo, F. Z. Temel, A. J. Crosby, M. Prakash, G. P. Sutton, R. J. Wood, E. Azizi, S. Bergbreiter, and S. N. Patek, Science 360, eaa01082 (2018).
- Kovač et al. (2008) M. Kovač, M. Fuchs, A. Guignard, J. C. Zufferey, and D. Floreano, in Proceedings - IEEE International Conference on Robotics and Automation (IEEE, 2008) pp. 373–378.
- Debray (2011) A. Debray, Bioinspiration & Biomimetics 6, 026002 (2011).
- Koh et al. (2013) J. S. Koh, S. P. Jung, M. Noh, S. W. Kim, and K. J. Cho, in Proceedings - IEEE International Conference on Robotics and Automation (IEEE, 2013) pp. 26–31.
- Zhao et al. (2013) J. Zhao, J. Xu, B. Gao, N. Xi, F. J. Cintron, M. W. Mutka, and L. Xiao, IEEE Transactions on Robotics 29, 602 (2013).
- Kim et al. (2014) S.-W. Kim, J.-S. Koh, J.-G. Lee, J. Ryu, M. Cho, and K.-J. Cho, Bioinspiration & Biomimetics 9, 036004 (2014).
- Koh et al. (2015) J.-S. Koh, E. Yang, G.-P. Jung, S.-P. Jung, J. H. Son, S.-I. Lee, P. G. Jablonski, R. J. Wood, H.-Y. Kim, and K.-J. Cho, Science 349, 517 (2015).
- Zaitsev et al. (2015a) V. Zaitsev, O. Gvirsman, U. Ben Hanan, A. Weiss, A. Ayali, and G. Kosa, in IEEE International Conference on Intelligent Robots and Systems, Vol. 10 (IOP Publishing, 2015) p. 066012.
- Haldane et al. (2016) D. W. Haldane, M. M. Plecnik, J. K. Yim, and R. S. Fearing, Science Robotics 1, eaag2048 (2016).
- Rollinson et al. (2013) D. Rollinson, S. Ford, B. Brown, and H. Choset, Proceedings of the ASME 2013 Dynamic Systems and Control Conference DSCC2013, 3875 (2013).
- Cox et al. (2014) S. M. Cox, D. Schmidt, Y. Modarres-Sadeghi, and S. N. Patek, Bioinspiration and Biomimetics 9, 16014 (2014).
- Burrows and Sutton (2012) M. Burrows and G. P. Sutton, Journal of Experimental Biology 215, 3501 (2012).
- Burrows (2016) M. Burrows, The Journal of Experimental Biology 219, 2449 (2016).
- Weis-Fogh (1961) T. Weis-Fogh, Journal of Molecular Biology 3, 520 (1961).
- Jensen and Weis-Fogh (1962) M. Jensen and T. Weis-Fogh, Philosophical Transactions of the Royal Society B: Biological Sciences 245, 137 (1962).
- King (2010) R. J. King, Dynamic mechanical properties of resilin, {M.Sc. Thesis}, Virginia Polytechnic Institute and State University (2010).
- Gosline et al. (2002) J. Gosline, M. Lillie, E. Carrington, P. Guerette, C. Ortlepp, and K. Savage, Philosophical Transactions of the Royal Society B: Biological Sciences 357, 121 (2002).
- Elvin et al. (2005) C. M. Elvin, A. G. Carr, M. G. Huson, J. M. Maxwell, R. D. Pearson, T. Vuocolo, N. E. Liyou, D. C. C. Wong, D. J. Merritt, and N. E. Dixon, Nature 437, 999 (2005).
- Vermorel et al. (2007) R. Vermorel, N. Vandenberghe, E. Villermaux, N. V. R. Vermorel, and E. Villermaux, Proceedings of the Royal Society A: Mathematical, Physical and Engineering Sciences 463, 641 (2007).
- Bogoslovov and Roland (2007) R. B. Bogoslovov and C. M. Roland, Journal of Applied Physics 102, 1 (2007).
- Niemczura and Ravi-Chandar (2011) J. Niemczura and K. Ravi-Chandar, Journal of the Mechanics and Physics of Solids 59, 457 (2011).
- Tunnicliffe et al. (2015) L. B. Tunnicliffe, A. G. Thomas, and J. J. Busfield, Polymer Testing 47, 36 (2015).
- Yoon and Siviour (2017) S. H. Yoon and C. R. Siviour, Journal of Dynamic Behavior of Materials 3, 12 (2017).
- Rogers et al. (2016) S. M. Rogers, J. Riley, C. Brighton, G. P. Sutton, D. A. Cullen, and M. Burrows, Journal of Experimental Biology 219, 635 (2016).
- Burrows (2006) M. Burrows, Journal of Experimental Biology 209, 4607 (2006).
- Gerratt and Bergbreiter (2013) A. P. Gerratt and S. Bergbreiter, Smart Materials and Structures 22, 014010 (2013).
- Irschick (2003) D. J. Irschick, Integrative and Comparative Biology 43, 396 (2003).
- Bennet-Clark and Lucey (1967) H. C. Bennet-Clark and E. C. Lucey, The Journal of Experimental Biology 47, 59 (1967).
- Schwetlick and Schütze (1995) H. Schwetlick and T. Schütze, BIT Numerical Mathematics 35, 361 (1995).
- Schütze and Schwetlick (1997) T. Schütze and H. Schwetlick, BIT Numerical Mathematics 37, 105 (1997).
- Ashby (2011) M. F. Ashby, Materials Selection in Mechanical Design, 4th ed. (Butterworth-Heinemann, Oxford, 2011).
- Zaitsev et al. (2015b) V. Zaitsev, O. Gvirsman, U. Ben Hanan, A. Weiss, A. Ayali, and G. Kosa, Bioinspiration & Biomimetics 10, 066012 (2015b).
- Niiyama et al. (2007) R. Niiyama, A. Nagakubo, and Y. Kuniyoshi, in Proceedings - IEEE International Conference on Robotics and Automation (IEEE, 2007) pp. 2546–2551.
- Kajita et al. (2003) S. Kajita, F. Kanehiro, K. Kaneko, K. Fujiwara, K. Harada, K. Yokoi, and H. Hirukawa, in Proceedings 2003 IEEE/RSJ International Conference on Intelligent Robots and Systems (IROS 2003) (Cat. No.03CH37453), Vol. 2 (IEEE, 2003) pp. 1644–1650.
- Churaman et al. (2012) W. A. Churaman, L. J. Currano, C. J. Morris, J. E. Rajkowski, and S. Bergbreiter, Journal of Microelectromechanical Systems 21, 198 (2012).
- Forterre et al. (2005) Y. Forterre, J. M. Skotheim, J. Dumals, and L. Mahadevan, Nature 433, 421 (2005).
- Vincent et al. (2011) O. Vincent, C. Weisskopf, S. Poppinga, T. Masselter, T. Speck, M. Joyeux, C. Quilliet, and P. Marmottant, Proceedings of the Royal Society B: Biological Sciences 278, 2909 (2011).
- Bennet-Clark (1975) H. C. Bennet-Clark, Journal of Experimental Biology 63, 53 (1975).
- Anderson (2016) C. V. Anderson, Scientific Reports 6, 18625 (2016).
- Anderson et al. (2012) C. V. Anderson, T. Sheridan, and S. M. Deban, Journal of Morphology 273, 1214 (2012).
- James and Wilson (2008) R. S. James and R. S. Wilson, Physiological and Biochemical Zoology 81, 176 (2008).
- Burrows (2012) M. Burrows, Journal of Experimental Biology 215, 3612 (2012).
- Patek et al. (2006) S. N. Patek, J. E. Baio, B. L. Fisher, and A. V. Suarez, Proceedings of the National Academy of Sciences 103, 12787 (2006).
- Whitaker et al. (2007) D. L. Whitaker, L. A. Webster, and J. Edwards, Functional Ecology 21, 219 (2007).
- Edwards et al. (2005) J. Edwards, D. Whitaker, S. Klionsky, and M. J. Laskowski, Nature 435, 164 (2005).
- Pringle et al. (2005) A. Pringle, S. N. Patek, M. Fischer, J. Stolze, and N. P. Money, Mycologia 97, 866 (2005).
- Koch et al. (1998) A. W. Koch, T. W. Holstein, C. Mala, E. Kurz, J. Engel, and C. N. David, Journal of Cell Science 111, 1545 (1998).
- Nüchter et al. (2006) T. Nüchter, M. Benoit, U. Engel, S. Özbek, and T. W. Holstein, Current Biology 16, R316 (2006).
- Astley et al. (2013) H. C. Astley, E. M. Abbott, E. Azizi, R. L. Marsh, and T. J. Roberts, Journal of Experimental Biology 216, 3947 (2013).
- Wan et al. (2016) C. Wan, Z. Hao, and X. Feng, Scientific reports 6, 35219 (2016).
- Burrows et al. (2008) M. Burrows, S. R. Shaw, and G. P. Sutton, BMC Biology 6, 41 (2008).
- Siwanowicz and Burrows (2017) I. Siwanowicz and M. Burrows, eLife 6, e23824 (2017).
- Tadayon et al. (2015) M. Tadayon, S. Amini, A. Masic, and A. Miserez, Advanced Functional Materials 25, 6437 (2015).
- Larabee et al. (2017) F. J. Larabee, W. Gronenberg, and A. V. Suarez, The Journal of Experimental Biology 220, 3062 (2017).
- Vincent and Wegst (2004) J. F. Vincent and U. G. Wegst, Arthropod Structure and Development 33, 187 (2004).
- Gronenberg (1996) W. Gronenberg, Journal of Comparative Physiology A 178, 727 (1996), arXiv:BF00225821 [10.1007] .
- Lee (1990) W. Lee, Designing Articulated Legs for Running Machines, {M.Sc. Thesis}, Massachusetts Institute of Technology (1990).
- Maier (1957) K. Maier, Product Engineering 28, 167 (1957).
- Avery and Bond (1989) R. Avery and D. Bond, Amphibia-Reptilia 10, 77 (1989).
- Spagna and Peattie (2012) J. C. Spagna and A. M. Peattie, Journal of Insect Physiology 58, 599 (2012).
- Rosario et al. (2016) M. V. Rosario, G. P. Sutton, S. N. Patek, and G. S. Sawicki, Proceedings of the Royal Society B 283, 20161561 (2016).
- Saranli et al. (2001) U. Saranli, M. Buehler, and D. E. Koditschek, The International Journal of Robotics Research 20, 616 (2001).
- Gao et al. (2012) W. Gao, S. Sattayasamitsathit, and J. Wang, Chemical Record 12, 224 (2012).
- Van Damme and Van Dooren (1999) R. Van Damme and T. J. M. Van Dooren, Animal Behaviour 57, 347 (1999).
- Bergmann et al. (2009) P. J. Bergmann, J. J. Meyers, and D. J. Irschick, Evolution 63, 215 (2009).