Multiwavelength Follow-up Observations of the Tidal Disruption Event Candidate 2XMMi J184725.1631724
Abstract
The ultrasoft X-ray flare 2XMMi J184725.1631724 was serendipitously detected in two XMM-Newton observations in 2006 and 2007, with a peak luminosity of erg s-1. It was suggested to be a tidal disruption event (TDE) because its position is consistent with the center of an inactive galaxy. It is the only known X-ray TDE candidate whose X-ray spectra showed evidence of a weak steep powerlaw component besides a dominant supersoft thermal disk. We have carried out multiwavelength follow-up observations of the event. Multiple X-ray monitorings show that the X-ray luminosity has decayed significantly after 2011. Especially, in our deep Chandra observation in 2013, we detected a very faint counterpart that supports the nuclear origin of 2XMMi J184725.1631724 but had an X-ray flux a factor of 1000 lower than in the peak of the event. Compared with follow-up UV observations, we found that there might be some enhanced UV emission associated with the TDE in the first XMM-Newton observation. We also obtained a high-quality UV-optical spectrum with the SOAR and put a very tight constraint on the persistent nuclear activity, with a persistent X-ray luminosity expected to be lower than the peak of the flare by a factor of 2700. Therefore, our multiwavelength follow-up observations strongly support the TDE explanation of the event.
keywords:
accretion, accretion disks — black hole physics — X-rays: galaxies – galaxies: individual: 2XMMi J184725.16317241 Introduction
Most supermassive black holes (SMBHs) at the center of galaxies are quiescent, but they can sometimes reveal themselves by tidally disrupting and subsequently accreting stars that wander too close to them (Rees 1988, 1990; Komossa 2012, 2015). About 70 such tidal disruption events (TDEs) have been found thus far, with about 30 with X-ray detections (e.g., Komossa & Bade 1999; Gezari et al. 2012; Saxton et al. 2012; Maksym et al. 2013; Miller et al. 2015)111https://tde.space/. While three hard TDEs discovered by Swift had peak X-ray luminosity above erg s-1 and hard X-ray spectra (Bloom et al. 2011; Burrows et al. 2011; Cenko et al. 2012; Brown et al. 2015), most X-ray TDEs have peak 1044 erg s-1 and pure thermal X-ray spectra of characteristic temperature 0.1 keV. Some TDEs, such as 2XMMi J184725.1631724 (J1847 hereafter, Lin et al. 2011, Lin11 hereafter) and XMMSL1 J074008.2-853927 (Saxton et al. 2017), seemed to have more complicate X-ray spectra, with an extra harder component besides the super-soft thermal component.
J1847 is among the four X-ray TDE candidates that we have discovered (Lin11, Lin et al. 2013, 2015, 2017a, 2017b) in our project of classification of bright X-ray sources from the XMM-Newton catalog (Lin et al. 2012). It was serendipitously detected in two XMM-Newton observations (hereafter X1 and X2, Table 1) in the direction of the center of the galaxy IC 4765-f01-1504 (Carrasco et al. 2006) at a redshift of 0.0353 ( Mpc, assuming a flat universe with =73 km s-1 Mpc-1 and =0.27, Lin11). These two XMM-Newton observations were separated by 211 d, with the X-ray flux in X2 higher than in X1 by nearly one order of magnitude. The X-ray spectra in both observations are very soft and can be described by a model dominated by a cool (temperature 0.1 keV) thermal disk component plus a weak steep (photon index 3.5) power-law (PL), similar to the thermal state of stellar-mass black hole (BH) X-ray binaries (Remillard & McClintock 2006). The large amplitude (by a factor 64) of the flare is supported by the non-detection of the source in a ROSAT observation in 1992. The decay of the X-ray flare had been hinted by the non-detection of the source in a follow-up Swift observation 4 yr after X2, which implied a flux decaying factor of 12. The host galaxy showed no clear sign of persistent nuclear activity, based on our Gemini spectrum taken in 2011, which showed no emission lines but typical stellar absorption features. The probable transient nature, extremely soft X-ray spectra, and an otherwise quiescent host prompted Lin11 to conclude that it is a TDE. The X-ray spectra of the TDE candidate XMMSL1 J074008.2-853927 are different from those of J1847 in that X-ray spectra of XMMSL1 J074008.2-853927 are more similar to those typically seen in Seyfert galaxies, with the PL component being hard (2) and strong (relative to the soft component, Saxton et al. 2017).
We have obtained more follow-up observations of J1847 from optical to X-rays, including one new XMM-Newton observation (X3 hereafter, Tables 1 and 2), one Chandra observation (C1 hereafter), five new Swift observations (S2–S6 hereafter), and one SOAR optical spectrum. Here we report the results of these new observations, which we find to further support the TDE nature of the event. In Section 2, we describe the observations and data analysis. In Section 3, we present the results. Our discussion on the source nature and conclusions are given in Section 4.
| Observatory | Observation ID | Start date | Instrument | Expa | Count Ratec | d | d | d | |
| (ks) | (arcsec) | ( cts s-1) | ( erg s-1 cm-2) | ( erg s-1) | |||||
| XMM-Newton | 0405550401(X1) | 2006-09-06 | pn | 19.5 | 15 | ||||
| MOS1 | 27.6 | ||||||||
| MOS2 | 27.6 | ||||||||
| 0405380501(X2) | 2007-04-16 | pn | 20.5 | 35 | |||||
| MOS1 | 32.2 | 35 | |||||||
| MOS2 | 31.9 | 35 | |||||||
| 0694610101(X3)e,f | 2013-03-03 | pn | 19.1 | 20 | 6.7 | 0.25 | 0.31 | 0.98 | |
| MOS1 | 25.6 | 20 | 1.5 | ||||||
| MOS2 | 25.5 | 20 | 3.1 | ||||||
| Swift | 00031930001(S1) | 2011-02-23 | XRT | 5.0 | 20 | 3.3 | 1.5 | 19 | 6.1 |
| 00031930002(S2)e | 2013-04-05 | XRT | 3.1 | 20 | 2.1 | 1.2 | 14 | 7.6 | |
| 00031930003(S3)e | 2013-04-07 | XRT | 2.8 | 20 | |||||
| 00031930004(S4)e | 2013-08-29 | XRT | 1.3 | 20 | 3.4 | 1.5 | 18 | 9.5 | |
| 00031930005(S5)e | 2013-09-08 | XRT | 1.8 | 20 | |||||
| 00031930006(S6)e | 2015-03-15 | XRT | 1.4 | 20 | 5.6 | 2.1 | 23 | 18.8 | |
| Chandra | 15637(C1)e | 2013-03-29 | ACIS-S | 14.9 | 1.1 | ||||
| ROSAT | 800256(R1) | 1992-10-11 | PSPC | 10.7 | 2.3 | 0.63 | 0.87 | 0.037 | |
-
a
XMM-Newton observations are all subject to background flares, the exposure times given are the clean exposure times after excluding periods of strong background flares.
-
b
The radius of the source extraction region.
-
c
The count rates correspond to different energy bands for different observatories (XMM-Newton in 0.2–10 keV, Swift in 0.3–10 keV, Chandra in 0.3–8 keV, and ROSAT in 0.1–2.4 keV), with errors or upper limits (calculated with the ciao task aprates).
-
d
The 0.2–10 keV absorbed () and unabsorbed () fluxes and the unabsorbed bolometric luminosity (integrated over 0.001–100 keV) for X1 and X2 are taken from Lin11, based on the WABS*SIMPL(DISKBB) model. For the ROSAT observation R1, we assumed an absorbed PL of and cm-2 (the bolometric luminosity were integrated over 0.2–100 keV for this model). For all the other observations, we assumed the WABS*SIMPL(DISKBB) fit to X1, with the disk temperature adjusted based on the expected decrease in the bolometric luminosity (see the text for more details). Either 90% errors or upper limits are given.
-
e
New follow-up observations.
-
f
For X3, the observed count rates, fluxes and the bolometric luminosity are treated as upper limits, given that in this observation J1847 was strongly contaminated by Source 2.
| Observation ID | Start date | Filter | Exposure | Magnitude | |
| (Å) | (ks) | (AB mag) | |||
| XMM-Newton/OM: | |||||
| 0405550401(X1) | 2006-09-06 | 2910 | 1.8 | ||
| 2310 | 2.7 | ||||
| 0694610101(X3)a | 2013-03-03 | 2910 | 9.8 | ||
| 2310 | 9.6 | ||||
| 2120 | 14.3 | ||||
| Swift/UVOT: | |||||
| 00031930001(S1) | 2011-02-23 | 2589 | 4.9 | ||
| 00031930002(S2)a | 2013-04-05 | 2589 | 3.1 | ||
| 00031930003(S3)a | 2013-04-07 | 2031 | 2.8 | ||
| 00031930004(S4)a | 2013-08-29 | 2031 | 1.3 | ||
| 00031930005(S5)a | 2013-09-08 | 2031 | 1.8 | ||
| 00031930006(S6)a | 2015-03-15 | 2031 | 1.4 | ||
-
a
New follow-up observations.
2 DATA ANALYSIS
2.1 The XMM-Newton and Chandra Observations
The XMM-Newton observation X3 was taken on 2013 March 3 (Table 1) with a duration of 44 ks using the three European Photon Imaging Cameras (i.e., pn, MOS1, and MOS2 Jansen et al. 2001; Strüder et al. 2001; Turner et al. 2001) in Full Frame mode. Strong background flares, which were seen in all cameras, were excluded following the sas thread for the filtering against high backgrounds222http:xmm.esac.esa.intsascurrentdocumentationthreads. After excluding the strong background intervals, we were left with only good exposures of 19.1, 25.6 and 25.5 ks for pn, MOS1, and MOS2, respectively (Table 1). There was some weak hard emission near the position of J1847. However, this hard source seems to be significantly offset from J1847. The offset is 4.8 arcsec and is larger than the positional uncertainty (3.4 arcsec) of the hard source, based on the 3XMM-DR6 catalog (Rosen et al. 2016). In order to check whether this hard source is J1847, we requested the Chandra observation C1 (15 ks, Table 1) in the director’s discretionary time program. The observation was made on 2013 March 29 (26 d after X3). It used the AXAF CCD Imaging Spectrometer (ACIS; Bautz et al. 1998), with the aimpoint and our target at the back-illuminated chip S3. We reprocessed the data to apply the latest calibration (CALDB 4.7.3) using the script chandra_repro in the Chandra Interactive Analysis of Observations (ciao, version 4.9) package. No high background flares were seen in C1, and we used the data of the whole observation.
The Chandra image clearly resolved the emission near J1847 in X3 into two sources, one at the position of J1847, thus probably the same source, and the other only 5.9 arcsec away (Source 2 hereafter). This offset was obtained based on our performance of the source detection on the 0.3–7 keV image binned at single sky pixel resolution with the ciao wavdetect wavelet-based source detection algorithm (Freeman et al. 2002). We extracted the spectra and the corresponding response files for both sources using the ciao task specextract. We used a circular source region enclosing 90% of the point spread function (PSF) at 2.0 keV (radius 1.1 arcsec for both sources) and a circular background region of radius 20 arcsec near the sources.
Although J1847 cannot be resolved from Source 2 in X3, the observation can still provide enough statistics to constrain the properties of these sources, thanks to the long exposure and the large effective area of the observation. Therefore, we analyzed the observation in the same way as for X1 and X2 (Lin11), except using sas 16.0.0 and the calibration files of 2017 February. We extracted the source and background spectra for the blended emission of J1847 and Source 2 in X3. We used a source region of radius 20 arcsec (the same for all cameras) centered at the detection position in the 3XMM-DR6 catalog. A large background region (radius 100 arcsec for MOS1 and MOS2 and radius 60 arcsec for pn) was used.
2.2 Swift Observations
We also have six follow-up observations of J1847 with Swift, including the one in 2011 that had been analyzed in Lin11 (Table 1). We analyzed the six observations with ftools 6.20 and the calibration files of 2017 February. In all observations, the X-ray telescope (XRT; Burrows et al. 2005) was operated in Photon Counting mode, and we reprocessed the data with the task xrtpipeline (version 0.13.3) to update the calibration. J1847 was not detected in the XRT in these observations. In order to obtain the constraint of the X-ray flux of the source in these observations, we extracted the source and background spectra using circular source and background regions of radii 20 and 100 arcsec, respectively. The upper limit on the count rate was estimated using the ciao task aprates, which adopts the Bayesian approach. The UV-Optical Telescope (UVOT; Roming et al. 2005) in these observations used the UV filters and (Table 2), with a goal to monitor the UV emission. We used the task uvotsource with radii of 5 and 20 arcsec for the circular source and background regions, respectively, and the most recent UVOT calibration as described in Poole et al. (2008) and Breeveld et al. (2010, 2011) to obtain the UV photometry.
2.3 The SOAR Spectroscopic Observation
We obtained a new optical spectrum of the host galaxy of J1847 using the Goodman High-Throughput Spectrograph (Clemens et al. 2004) on the SOAR 4.1-m telescope on 2013 August 26. Seven separate 30 min exposures were obtained, interspersed with arc lamps and flats, for a total on-source exposure time of 3.5 hr. For all data, we used the 400 l mm-1 grating, centered at about 5000 Å, for an approximate wavelength coverage of 3000 to 7000 Å. We used a 1.07-arcsec slit, giving a resolution of 6.8 Å. The individual exposures were reduced and optimally extracted, using apertures ranging from 2.07 to 2.31 arcsec, depending on the seeing in each exposure. Then the spectra from individual exposures were coadded to yield the final spectrum.
We used Penalized Pixel Fitting (ppxf) software (Cappellari & Emsellem 2004) to fit the spectrum with multi-component models comprised of single-population synthetic spectra from Vazdekis et al. (2010), spanning a grid of 48 ages between 0.06 to 14 Gyr and 7 metallicities [M/H]={, , , , , , }. The ppxf software implements the penalized pixel-fitting method to extract the stellar kinematics or stellar population from spectra of galaxies, with a maximum penalized likelihood approach. A multiplicative polynomial of 10 degrees was incorporated in the fit to account for possible calibration uncertainties. The spectrum was corrected for the Galactic dust reddening of mag (Schlegel et al. 1998) before the fit.
2.4 Astrometry Correction
We need to obtain the astrometrically corrected positions of J1847 in various X-ray images to check whether the source is consistent with the galactic origin. The X1 and X2 sources were astrometrically corrected by aligning the 3XMM-DR6 sources with the 2MASS astrometry using 4 and 6 X-ray-IR matches, respectively (J1847 was not in these match lists used for astrometry correction). We used the astrometric correction method in Lin et al. (2016), by searching for the translation and rotation of the X-ray frame that minimize the total of the matches ( is the ratio of the X-ray-IR separation to the total positional error). The uncertainties of the translation and rotation and thus the systematic positional errors of the X-ray sources associated with the astrometry correction procedure were estimated using 200 simulations. The final source positional uncertainties include the statistical component, the systematic error associated with the astrometry correction procedure, and the systematic error of 0.37 arcsec () of the 3XMM-DR6 catalog (Rosen et al. 2016), added in quadrature. We note that the contamination of Source 2 has negligible effects on the position of J1847 that we derived from X1 and X2. This is because Source 2 in these observations would have count rates lower than those of J1847 by factors of 14 and 130, respectively, if it had similar fluxes as observed in C1.
The positions of the sources in C1 were taken from the output of the source detection tool wavdetect. The positional uncertainties included the statistical component, calculated using Equation 12 in Kim et al. (2007), and the absolution astrometric uncertainty of Chandra obtained in Rots & Budavári (2011). No large systematic astrometric offset was found for C1 when we applied the astrometric correction method of Lin et al. (2016) to compare it with the 2MASS sources.
In order to check the galactic origin of J1847, we used an archival Very Large Telescope (VLT) FORS1 -band image, which resolves the candidate host galaxy of J1847 well. It was taken on 2006 April 16. We aligned the astrometry of the image with that of the 2MASS. The VLT image has a relatively small size of , which is the reason why we did not use it to carry out astrometry correction for X-ray sources.
3 Results
3.1 Deep X-ray Follow-up
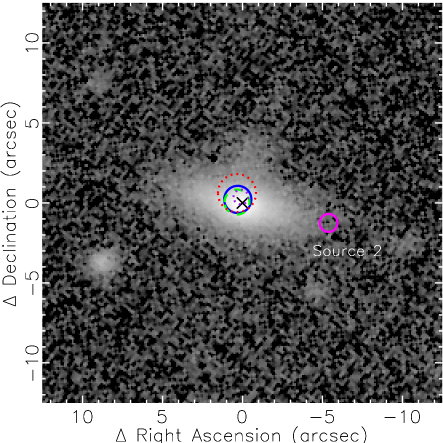
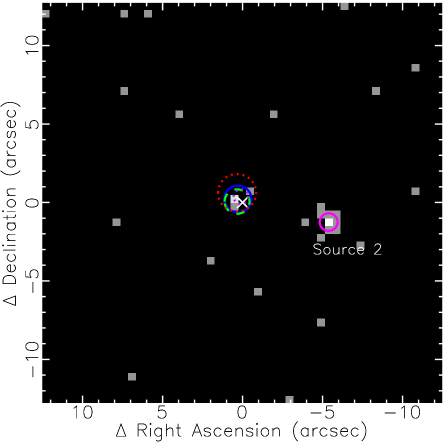
In the Chandra observation C1, we collected 5 counts and 17 counts for J1847 and Source 2, respectively, within 0.3–8 keV, with only 0.2 counts expected to be from the background in both cases. The 95% positional uncertainties of both sources from this Chandra observation are marked in Figure 1, which shows the VLT FORS1 -band image (upper panel) and the Chandra image (lower panel) around the field of J1847. The Chandra position of J1847 is consistent with the galaxy center within the 95% uncertainty. It is also consistent with the average position (weighted by errors) from X1 and X2 (Figure 1).
The very few counts of J1847 in the Chandra observation do not allow for a meaningful fit even with a simple model like an absorbed PL. The absorbed X-ray flux within 0.2–10 keV is fairly independent of the spectral shape. Assuming an absorbed PL of cm-2 (Lin11) and a large range of (2.0–5.0), we obtained (1.5–2.0) erg s-1 cm-2, a factor of 1000 lower than the peak flux (in X2, Table 1). The corresponding unabsorbed 0.2–10 flux had a much larger range ((2–20) erg s-1 cm-2).
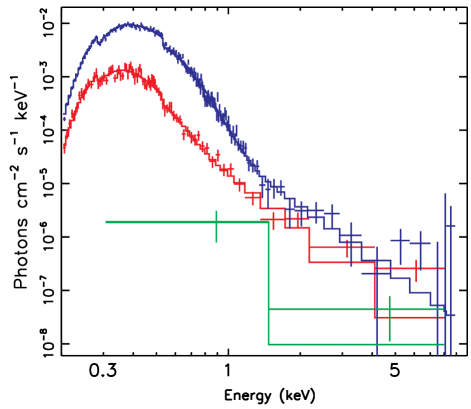
The bolometric luminosity is more relevant for the test of the TDE explanation for J1847, but it is very sensitive to the spectral model adopted. In Lin11, the X1 and X2 spectra were well fitted with the WABS*SIMPL(DISKBB) model, as plotted in Figure 2. The absorption model WABS, the standard thermal disk model DISKBB and the empirical convolution Comptonization model SIMPL, in which a fraction of the input seed photons are converted into a PL (Steiner et al. 2009), can be found in the X-ray spectral fitting package xspec (Arnaud 1996). Based on this model, the main spectral change between X1 and X2 was the inner disk temperature , as often observed in the thermal state of the accreting stellar-mass BH X-ray binaries (Remillard & McClintock 2006; Done et al. 2007). Therefore, we could construct a reasonable WABS*SIMPL(DISKBB) model for the C1 spectrum of J1847, as long as its and thus can be inferred in some way. In the standard TDE theory, is expected to decay with the time after the stellar disruption as (Rees 1988; Phinney 1989). The solid line in Figure 3 plots such a decay trend with the disruption time assumed to be one month before X1, which is reasonable, given that the rising time to the peak is expected to be 1–2 months (Ulmer 1999; Guillochon & Ramirez-Ruiz 2015) for a small BH ( , Lin11). Based on this model, we expect erg s-1 at the time of C1. This luminosity can be matched if we adjust the WABS*SIMPL(DISKBB) fit to X1 to have eV. The model constructed this way is fully consistent with the C1 spectrum, as shown in Figure 2. The model predicts 3.3 counts, while we detected 4.8 net counts in C1.
Source 2 has enough counts for simple spectral fits. We binned the 0.3–8 keV spectrum to have at least 1 count per bin and fitted it with the statistic (Cash 1979; Wachter et al. 1979) in xspec with an absorbed PL model. We obtained (the error bars of the parameters from the spectral fits are at the 90% confidence level throughout the paper), cm-2, and a 0.3–8 keV absorbed flux of erg cm-2 s-1, indicating a faint X-ray source of a very hard spectrum.
In order to check whether there is large spectral and/or flux variability between X3 and C1, we also fitted the combined spectrum of J1847 and Source 2 from C1 with an absorbed PL and obtained cm-2, , and erg cm-2 s-1. These values are broadly consistent with those inferred in the fit to the combined 0.2–10 keV spectrum of J1847 and Source 2 from X3 ( cm-2, , and erg cm-2 s-1). These parameters are broadly consistent with each other. Therefore, there should be no large flux and spectral change of both sources between X3 and C1. However, given the relatively large uncertainties of these parameters, we cannot rule out small variations like a factor of two in the total X-ray flux.
3.2 Long-term X-ray Evolution
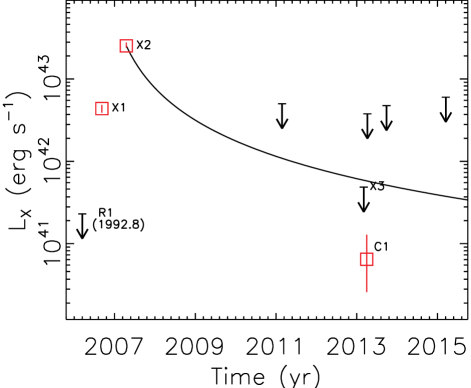
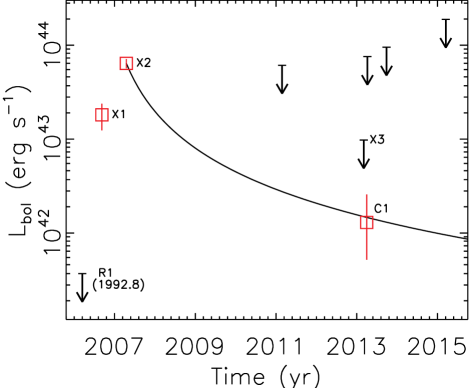
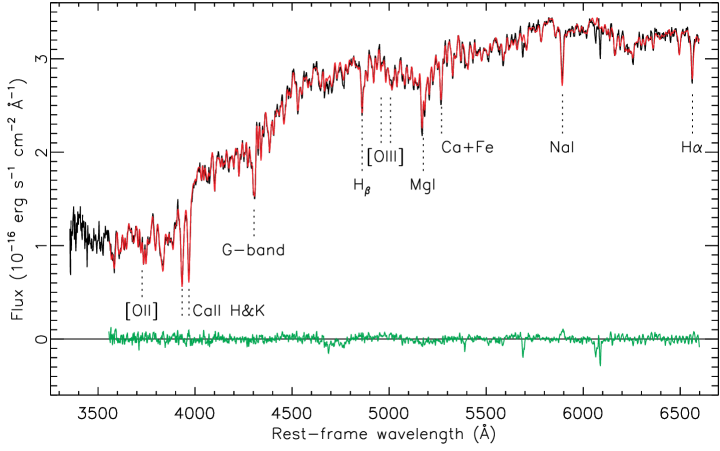
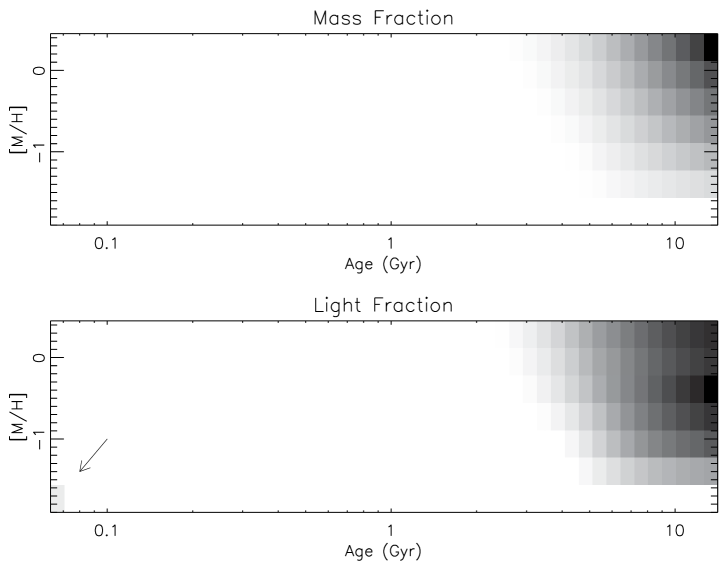
Figure 3 shows the long-term evolution of the unabsorbed X-ray luminosity (upper panel) of J1847 in 0.2–10 keV and the bolometric luminosity (lower panel). For X1 and X2, we used the luminosities inferred in Lin11 based on the WABS*SIMPL(DISKBB)) model. Although the possible contamination of Source 2 on J1847 was not taken into account when we fitted the spectra of J1847 in X1 and X2, we found that the spectral fits obtained in Lin11 were hardly affected even if we included in the spectral fits an additional weak hard PL component with as obtained in our fit to the spectrum of Source 2 in C1. The upper limit of the luminosity in the ROSAT observation was estimated assuming a typical spectrum of an active galactic nucleus (AGN), i.e., an absorbed PL of cm-2 (Lin11) and (Lin et al. 2012). For all the other observations, we assumed the WABS*SIMPL(DISKBB)) fit to X1 with the disk temperature adjusted so that of the model matches that predicted in the standard TDE model (solid line in the lower panel in Figure 3), as we did for C1 in Section 3.1. Except for X1, X2, and C1, in which the source was detected and had little contamination from Source 2, we calculated the upper limits for all other observations (Table 1). For X3, though J1847 was also detected in this observation, it was most likely seriously contaminated by Source 2. We therefore treated the total detected flux of Source 2 and J1847 as the upper limit of J1847 for this observation. We note that S2 and S3 are close in time and were thus combined to calculate the upper limit. This is also the case for S4 and S5.
The source clearly displayed a large variability in , by a factor of 430 between X2 and C1, which were separated by 6 yr. The Swift observations are relatively shallow, and the non-detection of our source in these observations suggests that might have decayed by a factor of 5 from X2 since 2011. The variability of is somewhat less dramatic (a factor of 49 between X2 and C1) than that of . This is due a larger bolometric correction for C1 than for X2. The C1 luminosity was estimated assuming a model of a much cooler disk ( eV, see Section 3.1) and thus a smaller fraction of photons in X-rays than the model used for X2 ( eV, Lin11).
3.3 Long-term Optical and UV Evolution
Figure 4 shows the SOAR spectrum of the host galaxy of J1847. It exhibits no emission lines but typical stellar absorption features, as observed in the Gemini spectrum in 2011. The SOAR spectrum has much higher S/N than the Gemini spectrum and can thus provide a much better constraint on the level of the nuclear activity. We obtained the 3 upper limit of the luminosity of the [O iii] 5007 emission line to be erg s-1. This limit has been corrected for Galactic reddening mag (Schlegel et al. 1998), but not the intrinsic reddening, which is probably very small given that the inferred column density from the X-ray spectral fit is close to the Galactic value (Lin11). Using the [O iii] 5007 and 2–10 keV luminosity relation in Lamastra et al. (2009), whose dispersion is 0.63 dex, we estimated the 3 upper limit of the persistent unabsorbed 2–10 keV luminosity to be erg s-1, or erg s-1 in 0.2–10 keV, assuming a PL of . This upper limit is a factor of 2700 lower than the peak luminosity (in X2).
Our ppxf fit of the spectrum over 3540–6600 Å (the source rest frame) is shown in Figure 4. The fit inferred the intrinsic stellar velocity dispersion to be km s-1, which should be taken with caution because it is lower than the instrumental resolution of 170 km s-1. The total stellar mass is , and the total luminosity within the fitting band is , after correcting for the slit loss by matching the spectrum to the integrated -band flux of the host galaxy obtained in Lin11. Therefore, the ppxf fit suggests a relatively low-mass galaxy.
The mass and light distributions of the stellar populations with respect to the age and the metallicity are shown in Figure 5. The light-weighted age is 9.6 Gyr, and the mass-weighted age is 10.3 Gyr, suggesting a galaxy dominated by old stellar populations.
The UV photometry of J1847 is given in Table 2. Our source fell in the FOV of the Optical Monitor (OM, Mason et al. 2001) in X1 and X3, but not in X2. Both X1 and X3 have been included in the third release of the XMM-OM Serendipitous Ultraviolet Source Survey Catalog (SUSS3, Page et al. 2012), which compiles all optical and UV sources detected in the OM between 2000 March and 2015 July, and the magnitudes of our source in Table 2 are from this catalog. Both observations suggest the presence of a UV source at the position of J1847 (Figure 1). This UV source appeared blue and variable. Both the and fluxes decreased from X1 to X3 by 0.6 mag at the and confidence levels, respectively. Because X1 was near the peak of the X-ray flare and had a much higher X-ray flux than X3, the UV enhancement in X1 is probably associated with the X-ray flare. The UV photometry from the Swift observations (Table 2) supports the presence of a blue UV source at the position of J1847, but it showed no clear variation in Swift observations. We note that the UV filter set in the UVOT is different from that of the XMM-Newton OM, so their photometry should not be directly compared with each other.
In the SUSS3 catalog, the UV source was indicated as an extended source in and in X3 but not in X1. To check whether the UV source was extended in the Swift observations, we run the uvotdetect task in the ftools in the stacked images, one for each filter ( and ). The task gave the profile root mean squares along the major and minor axises of the sources, from which we calculated a geometric mean . From , we obtained arcsec for point sources with similar magnitudes as J1847 and arcsec for J1847, clearly suggesting that the UV source was extended (at the confidence level). For , we obtained arcsec for point sources and arcsec for J1847. Therefore in this filter, there is some sign that the UV source was also extended, at the confidence level. In summary, both the X3 and Swift images suggest the extended nature of the UV source at the late time after the X-ray emission became very weak. We note that the UV source appeared symmetric and that there seemed to be no UV emission at the position of Source 2. Therefore the extended nature of the UV source should not be caused by any contamination from Source 2.
4 DISCUSSION AND CONCLUSIONS
Our multiwavelength follow-up observations of J1847 support the TDE explanation of the source in several aspects. First, the X-ray monitorings of various observatories confirm the large amplitude of the X-ray outburst in 2006–2007, with the absorbed X-ray flux decaying by a factor of 1000 six years after X2. Secondly, the optical spectrum of the host galaxy from the SOAR poses a very tight constraint on the persistent nuclear activity (persistent X-ray luminosity inferred to be erg s-1), as supported by the X-ray observation C1. Thirdly, the C1 observation supports the nuclear origin of the event ( kpc).
Another support for the TDE explanation for J1847 is that the X-ray flux in C1 is fully consistent with that expected for a standard TDE, after properly taking into account the shifting of photon energies out of the X-ray band due to the cooling of the disk (lower panel in Figure 3, Sections 3.1 and 3.2). The main result of this band-limited effect is that the X-ray luminosity has a steeper decay than the standard TDE trend of , as shown in the upper panel in Figure 3. Lodato & Rossi (2011) showed that the X-ray spectral density at 0.2 keV could have an exponential decay, thus much steeper than the decay, around a year after the stellar disruption. We note that our speculation for the presence of a strong cool disk in C1 and other follow-up observations does not conflict with our lack of the detection of the UV variability in Swift observations, because the UV emission from such a cool disk is expected to be an order of magnitude fainter than the extended UV emission detected, which could be due to a small young stellar population (see below).
There are other cases in which X-ray flux could have a steeper decay than . One is partial disruption of a centrally concentrated star. In this case, a large drop in the decay of the mass accretion rate could occur in the months after the flare peak (Guillochon & Ramirez-Ruiz 2013). Temporary large drops in the light curves of TDEs could also be caused by the presence of a secondary SMBH (Liu et al. 2009), as is probably the case for the TDE SDSS J120136.02+300305.5 (Liu et al. 2014). We cannot completely rule out these explanations for the steeper decay of the X-ray flux than in J1847 due to the poor sampling of the light curve.
We have mainly considered the faint emission of J1847 in C1 as due to the TDE, but we cannot rule it out as the pre-existing very faint AGN instead. The 0.2–10 keV luminosity of J1847 in C1 ( erg s-1, assuming an absorbed PL of cm-2 and , typical of AGN spectra) is compatible with the upper limit ( erg s-1) set by the SOAR optical spectrum. The emission in C1 is less likely to be due to the star-forming activity. The star-formation rate of the host galaxy is about 0.2 yr-1 based on the flux (corrected for the Galactic reddening, Hirashita et al. 2003). This rate implies a 0.5–10 keV luminosity of erg s-1 (Ranalli et al. 2003), significantly lower than observed in C1.
There is a blue UV source at the nucleus of the host galaxy of J1847. Given its probably extended nature in the observations after 2011 (X3 and S1–S6), this UV source could be due to the presence of a small young stellar population, as inferred in the ppxf fit to the SOAR spectrum (see the lower panel in Figure 5). The probable decay of the UV source from X1 to X3 by mag, however, requires significant contribution to the UV emission from the TDE in X1. The presence of a young stellar population at the nucleus is interesting, as it has been suspected that the TDE rate might be enhanced in young stellar environments (Arcavi et al. 2014; Tadhunter et al. 2017). Given the dominant very old stellar populations of the host, one possible explanation for the nuclear young stellar population might be a recent minor merger. The possible evidence of this minor merger could be the prominence to the north of J1847 in the VLT image (Figure 1).
In Lin11, we ruled out J1847 as AGNs (based on the very soft X-ray spectra of J1847), foreground stars (based on the large X-ray-to-IR flux ratio of J1847, see also Lin et al. 2012) and Galactic supersoft X-ray sources (J1847 would be too faint to be such an object if it is in our Galaxy). The very large X-ray variability inferred from our follow-up observations and the extremely weak nuclear activity as indicated by the SOAR optical spectrum strengthen our arguments against the AGN explanation for J1847. J1847 is unlikely to be a -ray burst (GRB) or a supernova (SN), based on typical arguments applied to most X-ray TDEs of very soft X-ray spectra and high luminosities over a long time (e.g., Maksym et al. 2014; Lin et al. 2015, 2016). GRBs and SNe typically have very hard X-ray spectra, with 2 (Immler 2007; Levan et al. 2013; Grupe et al. 2013). SNe could show luminous very soft X-ray spectra during the prompt shock breakouts (Soderberg et al. 2008), but this phase is expected to be short in time (less than hours, Nakar & Sari 2012), while J1847 at least stayed bright and super-soft for 0.6 yr. Some ultralong GRBs exhibited relatively soft late-time X-ray spectra (), but they normally also had significant very hard X-ray emission above 2 keV (e.g., Piro et al. 2014; Margutti et al. 2015), but J1847 showed little emission above 2 keV and was much softer in X1 and X2, with and 6.9, respectively, when fitted with an absorbed PL.
Our Chandra observation C1 revealed a faint source (Source 2) only 6 arcsec away from J1847. This source appears to be in the galactic plane of the host galaxy of J1847, but no clear optical counterpart is seen in the VLT image (Figure 1). If it is in this galaxy, it would have an absorbed 0.3–8 keV luminosity of erg s-1, fulfilling the definition of an ultraluminous X-ray source ( erg s-1, Feng & Soria 2011). However, it is very rare to have such a bright off-nuclear X-ray source in an early-type galaxy (Fabbiano 2006). One possible exception could be that there was a minor merger, with Source 2 corresponding to the tidal stripped nucleus of a merging dwarf galaxy (see Farrell et al. 2012; Lin et al. 2016). Although this explanation seems interesting, given that a minor merger could also explain the presence of a nuclear young stellar population (see above), it is still fairly speculative without high-resolution imaging of the environment. An alternative explanation for Source 2 is a background AGN. No matter whether it is an offset nucleus or a background AGN, it might have a Seyfert 2 type, given its very hard X-ray spectrum (Lin et al. 2012). We do not favor the explanation of Source 2 as a -ray burst or a supernova, whose X-ray spectra typically have (Grupe et al. 2013), not as hard as Source 2. We note that we cannot rule out Source 2 as a foreground Galactic source either. With a very hard X-ray spectrum, it could be an intermediate polar (Muno et al. 2004).
Acknowledgments
DL is supported by the National Aeronautics and Space Administration through Chandra Award Number DD3-14066A issued by the Chandra X-ray Observatory Center, which is operated by the Smithsonian Astrophysical Observatory for and on behalf of the National Aeronautics Space Administration under contract NAS8-03060, and by the National Aeronautics and Space Administration ADAP grant NNX17AJ57G. JS acknowledges support from the Packard Foundation. We want to thank the former Swift PI Neil Gehrels for approving our ToO request to make several observations of 2XMMi J184725.1-631724. This paper is partially based on observations obtained at the Southern Astrophysical Research (SOAR) telescope, which is a joint project of the Ministério da Ciência, Tecnologia, e Inovação (MCTI) da República Federativa do Brasil, the U.S. National Optical Astronomy Observatory (NOAO), the University of North Carolina at Chapel Hill (UNC), and Michigan State University (MSU).
REFERENCES
- Arcavi et al. (2014) Arcavi I. et al., 2014, ApJ, 793, 38
- Arnaud (1996) Arnaud K. A., 1996, in Astronomical Society of the Pacific Conference Series, Vol. 101, Astronomical Data Analysis Software and Systems V, Jacoby G. H., Barnes J., eds., pp. 17–+
- Bautz et al. (1998) Bautz M. W. et al., 1998, in Society of Photo-Optical Instrumentation Engineers (SPIE) Conference Series, Vol. 3444, Society of Photo-Optical Instrumentation Engineers (SPIE) Conference Series, R. B. Hoover & A. B. Walker, ed., pp. 210–224
- Bloom et al. (2011) Bloom J. S. et al., 2011, Science, 333, 203
- Breeveld et al. (2010) Breeveld A. A. et al., 2010, MNRAS, 406, 1687
- Breeveld et al. (2011) Breeveld A. A., Landsman W., Holland S. T., Roming P., Kuin N. P. M., Page M. J., 2011, in American Institute of Physics Conference Series, Vol. 1358, American Institute of Physics Conference Series, McEnery J. E., Racusin J. L., Gehrels N., eds., pp. 373–376
- Brown et al. (2015) Brown G. C., Levan A. J., Stanway E. R., Tanvir N. R., Cenko S. B., Berger E., Chornock R., Cucchiaria A., 2015, MNRAS, 452, 4297
- Burrows et al. (2005) Burrows D. N. et al., 2005, Space Sci. Rev., 120, 165
- Burrows et al. (2011) Burrows D. N. et al., 2011, Nature, 476, 421
- Cappellari & Emsellem (2004) Cappellari M., Emsellem E., 2004, PASP, 116, 138
- Carrasco et al. (2006) Carrasco E. R., Mendes de Oliveira C., Infante L., 2006, AJ, 132, 1796
- Cash (1979) Cash W., 1979, ApJ, 228, 939
- Cenko et al. (2012) Cenko S. B. et al., 2012, ApJ, 753, 77
- Clemens et al. (2004) Clemens J. C., Crain J. A., Anderson R., 2004, in Proc. SPIE, Vol. 5492, Ground-based Instrumentation for Astronomy, Moorwood A. F. M., Iye M., eds., pp. 331–340
- Done et al. (2007) Done C., Gierliński M., Kubota A., 2007, A&A Rev., 15, 1
- Fabbiano (2006) Fabbiano G., 2006, ARA&A, 44, 323
- Farrell et al. (2012) Farrell S. A. et al., 2012, ApJ, 747, L13
- Feng & Soria (2011) Feng H., Soria R., 2011, New A Rev., 55, 166
- Freeman et al. (2002) Freeman P. E., Kashyap V., Rosner R., Lamb D. Q., 2002, ApJS, 138, 185
- Gezari et al. (2012) Gezari S. et al., 2012, Nature, 485, 217
- Grupe et al. (2013) Grupe D., Nousek J. A., Veres P., Zhang B.-B., Gehrels N., 2013, ApJS, 209, 20
- Guillochon & Ramirez-Ruiz (2013) Guillochon J., Ramirez-Ruiz E., 2013, ApJ, 767, 25
- Guillochon & Ramirez-Ruiz (2015) Guillochon J., Ramirez-Ruiz E., 2015, ApJ, 809, 166
- Hirashita et al. (2003) Hirashita H., Buat V., Inoue A. K., 2003, A&A, 410, 83
- Immler (2007) Immler S., 2007, in American Institute of Physics Conference Series, Vol. 937, Supernova 1987A: 20 Years After: Supernovae and Gamma-Ray Bursters, Immler S., Weiler K., McCray R., eds., pp. 246–255
- Jansen et al. (2001) Jansen F. et al., 2001, A&A, 365, L1
- Kim et al. (2007) Kim M. et al., 2007, ApJS, 169, 401
- Komossa (2012) Komossa S., 2012, in European Physical Journal Web of Conferences, Vol. 39, European Physical Journal Web of Conferences, p. 2001
- Komossa (2015) Komossa S., 2015, JHEA, 7, 148
- Komossa & Bade (1999) Komossa S., Bade N., 1999, A&A, 343, 775
- Lamastra et al. (2009) Lamastra A., Bianchi S., Matt G., Perola G. C., Barcons X., Carrera F. J., 2009, A&A, 504, 73
- Levan et al. (2013) Levan A. J., Read A. M., Metzger B. D., Wheatley P. J., Tanvir N. R., 2013, ApJ, 771, 136
- Lin et al. (2011) Lin D., Carrasco E. R., Grupe D., Webb N. A., Barret D., Farrell S. A., 2011, ApJ, 738, 52
- Lin et al. (2016) Lin D. et al., 2016, ApJ, 821, 25
- Lin et al. (2017a) Lin D., Godet O., Ho L. C., Barret D., Webb N. A., Irwin J. A., 2017a, MNRAS, 468, 783
- Lin et al. (2017b) Lin D. et al., 2017b, Nature Astronomy, 1, 0033
- Lin et al. (2013) Lin D., Irwin J. A., Godet O., Webb N. A., Barret D., 2013, ApJ, 776, L10
- Lin et al. (2015) Lin D. et al., 2015, ApJ, 811, 43
- Lin et al. (2012) Lin D., Webb N. A., Barret D., 2012, ApJ, 756, 27
- Liu et al. (2009) Liu F. K., Li S., Chen X., 2009, ApJ, 706, L133
- Liu et al. (2014) Liu F. K., Li S., Komossa S., 2014, ApJ, 786, 103
- Lodato & Rossi (2011) Lodato G., Rossi E. M., 2011, MNRAS, 410, 359
- Maksym et al. (2014) Maksym W. P., Lin D., Irwin J. A., 2014, ApJ, 792, L29
- Maksym et al. (2013) Maksym W. P., Ulmer M. P., Eracleous M. C., Guennou L., Ho L. C., 2013, MNRAS, 435, 1904
- Margutti et al. (2015) Margutti R. et al., 2015, ApJ, 805, 159
- Mason et al. (2001) Mason K. O. et al., 2001, A&A, 365, L36
- Miller et al. (2015) Miller J. M. et al., 2015, Nature, 526, 542
- Muno et al. (2004) Muno M. P. et al., 2004, ApJ, 613, 1179
- Nakar & Sari (2012) Nakar E., Sari R., 2012, ApJ, 747, 88
- Page et al. (2012) Page M. J. et al., 2012, MNRAS, 426, 903
- Phinney (1989) Phinney E. S., 1989, in IAU Symposium, Vol. 136, The Center of the Galaxy, Morris M., ed., p. 543
- Piro et al. (2014) Piro L. et al., 2014, ApJ, 790, L15
- Poole et al. (2008) Poole T. S. et al., 2008, MNRAS, 383, 627
- Ranalli et al. (2003) Ranalli P., Comastri A., Setti G., 2003, A&A, 399, 39
- Rees (1988) Rees M. J., 1988, Nature, 333, 523
- Rees (1990) Rees M. J., 1990, Science, 247, 817
- Remillard & McClintock (2006) Remillard R. A., McClintock J. E., 2006, ARA&A, 44, 49
- Roming et al. (2005) Roming P. W. A. et al., 2005, Space Sci. Rev., 120, 95
- Rosen et al. (2016) Rosen S. R. et al., 2016, A&A, 590, A1
- Rots & Budavári (2011) Rots A. H., Budavári T., 2011, ApJS, 192, 8
- Saxton et al. (2012) Saxton R. D., Read A. M., Esquej P., Komossa S., Dougherty S., Rodriguez-Pascual P., Barrado D., 2012, A&A, 541, A106
- Saxton et al. (2017) Saxton R. D., Read A. M., Komossa S., Lira P., Alexander K. D., Wieringa M. H., 2017, A&A, 598, A29
- Schlegel et al. (1998) Schlegel D. J., Finkbeiner D. P., Davis M., 1998, ApJ, 500, 525
- Soderberg et al. (2008) Soderberg A. M. et al., 2008, Nature, 453, 469
- Steiner et al. (2009) Steiner J. F., Narayan R., McClintock J. E., Ebisawa K., 2009, PASP, 121, 1279
- Strüder et al. (2001) Strüder L. et al., 2001, A&A, 365, L18
- Tadhunter et al. (2017) Tadhunter C., Spence R., Rose M., Mullaney J., Crowther P., 2017, Nature Astronomy, 1, 0061
- Turner et al. (2001) Turner M. J. L. et al., 2001, A&A, 365, L27
- Ulmer (1999) Ulmer A., 1999, ApJ, 514, 180
- Vazdekis et al. (2010) Vazdekis A., Sánchez-Blázquez P., Falcón-Barroso J., Cenarro A. J., Beasley M. A., Cardiel N., Gorgas J., Peletier R. F., 2010, MNRAS, 404, 1639
- Wachter et al. (1979) Wachter K., Leach R., Kellogg E., 1979, ApJ, 230, 274