The role of Coulomb interaction in superconducting NbTiN thin films
Abstract
We report on the superconducting properties of Nb1-xTixN thin films of thickness nm, with different Ti fraction in the range , deposited by high temperature chemical vapor deposition. In this parameter range, we observe that the superconducting critical temperature () increases with . Our analysis, in accordance with both McMillan’s and Finkelstein’s theories, shows that disorder-enhanced Coulomb interaction decreases with , leading to an increase of .
Because of its high superconducting critical temperature, high-quality NbTiN has been one of the most preferred materials for many superconducting applications, such as superconducting coating for radio frequency cavities Benvenuti et al. (1997); Fabbricatore et al. (1993); Bosland et al. (1993). The high superconducting energy gap () makes NbTiN very suitable for THz application, such as superconductor-insulator-superconductor mixtures and bolometers Kooi et al. (1998); Bumble et al. (2001); Jackson et al. (2001); Jiang et al. (2010). NbTiN is also a preferred material for optical single photon detection Miki et al. (2013); Schuck et al. (2013); Tanner et al. (2010); Dorenbos et al. (2008) and has been used as high characteristic impedance microwave resonator Samkharadze et al. (2016)— thanks to its very high kinetic inductance. Low loss resonators can be fabricated from NbTiN Barends et al. (2010, 2009); this in combination with high , , and make NbTiN a potential alternative to aluminum for circuit quantum electrodynamics in high magnetic field Samkharadze et al. (2016).
The effect of disorder on conventional s-wave superconductivity has been extensively studied in Nb1-xTixN and its parent compounds, NbN and TiN Goldman and Markovic (1998); Crane et al. (2007); Baturina et al. (2007a, b); Sacépé et al. (2008, 2010); Mondal et al. (2011a, b); Driessen et al. (2012); Coumou et al. (2013); Mondal et al. (2013); Kamlapure et al. (2013); Noat et al. (2013). Already vast and rich physics has been unearthed in these systems, that include superconductor-insulator transition Goldman and Markovic (1998); Baturina et al. (2007a), observation of a pseudogap regime above Sacépé et al. (2010); Mondal et al. (2011a), disorder-induced phase fluctuation Mondal et al. (2011a), spatially inhomogeneous superconductivity Sacépé et al. (2008); Kamlapure et al. (2013); Noat et al. (2013) and enhancement of pair breaking parameter Driessen et al. (2012).
Despite numerous applications and fundamental investigations the following points are clearly missing: (1) A controlled growth technique to deposit high quality thin films. (2) A clear understanding of the variation of superconducting parameters with Ti fraction (). (3) A systematic way to control electronic disorder and to study its effect on superconducting properties. Here, we report on the superconducting properties of high-quality Nb1-xTixN films where electronic disorder can be tuned by controlling . The of our samples increases with which we attribute to the reduction of Coulomb interaction. This is consistent with both McMillan’s and Finkelstein’s equations.
To grow Nb1-xTixN thin films, d.c. magnetron sputtering is the most common technique Bell et al. (1968); Barends et al. (2008, 2009); Makise et al. (2011); Hong et al. (2013); Karimi et al. (2016); Samkharadze et al. (2016), but atomic layer deposition (ALD) has also been explored Klug et al. (2013). In the case of sputtering, the high sputtering rate makes the thickness control very challenging below 10 nm; whereas, in case of ALD, the control of both composition and crystalline quality remains difficult.
Variations of superconducting parameters, especially , with Ti fraction , have been previously reported Di Leo et al. (1990). The authors observed that remains almost constant up to and decreases for higher values. In contrast, Myoren et al. Myoren et al. (2001) observed a monotonous decrease of with for three of their films with , 0.34 and 0.62, respectively. In both cases, the films constituted 3d systems with thicknesses above 300 nm and were prepared by dc magnetron sputtering. Prior to these experiments, Pressal et al. Pessall et al. (1968) and Yen et al. Yen et al. (1967) observed that varies non-monotonically with ; below , increases with and decreases above. In either of these cases, no clear explanation for the observed variation of with Ti fraction was provided.
To study the effect of disorder on superconducting properties, majority of the experiments have been focussed on series of films with different thicknesses, making it difficult to disentangle bulk disorder to surface scattering contributions.
Here, to overcome these issues, we report on the superconducting properties of five Nb1-xTixN thin films of thickness nm grown by high temperature chemical vapor deposition (HTCVD). The detailed structural analysis by x-ray diffraction and cross sectional high resolution transmission electron microscopy reveal that the deposited films are of very high crystalline qualities. Apart from different gas flow rates, chamber conditions are kept identical between each depositions. In this way, the only parameter changing from sample to sample is the Ti fraction (), which we control in the range for the present study. Our goal is to understand how , in the range , impacts disorder and . Disorder will be estimated with the Ioffe-Regel parameter ( is the Fermi wavevector and is the mean free path).
Five Nb1-xTixN thin films have been produced by HTCVD at 1100 ∘C on Epiready (0001) oriented substrate. Deposition apparatus and thermodynamics calculation have been reported elsewhere Tsavdaris et al. (2017). Deposition conditions are the same for each sample except for the ratio of chlorine species in the gas phase. The control of the Nb/Ti ratio in the gas phase allows the control of the titanium concentration in the layer. All the films are nm thick, as determined from x-ray reflectometry.
The films are pure cubic NbTiN (ICDD: 01-088-2404); no hexagonal phases were detected. The XRD (111)- scan rocking curve values, referring to the tilt angle along the 111 direction between grains, are low and between 190 and 350 arcsec with no clear dependence on Ti fraction. Thus, the crystalline quality of NbTiN is not affected by the presence of Ti. However, two NbTiN in-plane variants with an in-plane twist relationship of are detected in all samples. These in-plane variants results from the stacking of material with a cubic structure (NbTiN) on a hexagonal substrate (surface of (0001) ). We found that the domains with a single variant were distributed randomly and have a lateral size in the order of 150 nm Mercier et al. (2014); Tsavdaris et al. (2017).
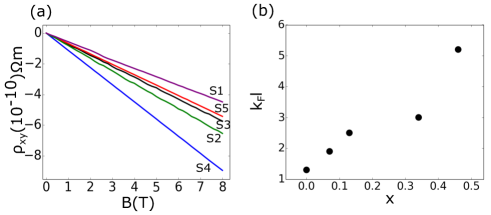
Electrical transport measurements were performed in a Quantum Design Physical Property Measurement System down to 2.5 K and up to magnetic field () 8 T. The free electron parameters of our samples were determined from the combination of longitudinal and Hall resistivity measurement at 50 K; lower temperatures are avoided not to be influenced by superconducting fluctuation related effects Tikhonov et al. (2012); Breznay et al. (2012); Destraz et al. (2017). Fig. 1a shows the variation of Hall resistivity () for all five samples as a function of magnetic field. For all five samples, varies linearly with magnetic field. The free electron density () is determined from the slope of the curve, i.e., from the Hall coefficient , where is the charge of the electron. Knowing , and (the Fermi velocity) are determined from and , where is the mass of the electron. The elastic scattering time () is estimated from Drude’s formula: , here is the longitudinal resistivity at 50 K. The other important free electron parameters, like, , diffusion constant () and density of states at the Fermi level () are determined from , and . is determined from . We note that depends only on experimentally measured quantities and , not on effective electron mass . The important free electron parameters are summarized for each sample in Table-1.
| Samples | RRR | (50 K) | ||||||||||
|---|---|---|---|---|---|---|---|---|---|---|---|---|
| () | ( K) | () | () | () | () | () | (50 K) | () | ||||
| S1 | 4.340 | 0.00 | 0.27 | 7.4 | 5.6 | 607 | 11.1 | 5.2 | 0.9 | 1.3 | 5.1 | 1.24 |
| S2 | 4.339 | 0.07 | 0.37 | 8.6 | 8.4 | 502 | 7.4 | 9.6 | 1.4 | 1.9 | 7.1 | 1.10 |
| S3 | 4.336 | 0.14 | 0.55 | 10.4 | 7.9 | 362 | 7.8 | 12.5 | 1.9 | 2.5 | 9.7 | 1.10 |
| S4 | 4.312 | 0.34 | 0.63 | 11.4 | 13.8 | 349 | 4.5 | 22.4 | 2.8 | 3.1 | 12.0 | 0.92 |
| S5 | 4.303 | 0.46 | 0.88 | 13.1 | 6.8 | 167 | 9.2 | 23.0 | 3.7 | 5.2 | 19.8 | 1.17 |
In Fig. 1b, we plot as a function of , showing that increases monotonically with . Thus, the disorder can be tuned systematically by controlling Ti fraction, making these films ideal candidates to study the effect of atomic level disorder on superconducting properties. This observation is consistent with our structural analysis Tsavdaris et al. (2017), where we observed that surface morphology improved with increasing Ti fraction. This is also consistent with the fact that, both residual resistivity ratio (RRR) and increases with (see Table-1; RRR is defined as (300 K)/(max)). It is well-known that RRR decreases with increasing defect density Kittel (2005) that subsequently reduces . At 50 K where free electron parameters are defined, the electron-phonon interaction is small and thus the electrical resistance stems predominantly from the electron-defect scattering Chand et al. (2009); Chand (2012).
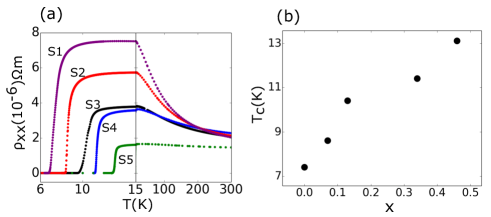
In Fig. 2a, we plot the temperature dependence of at zero magnetic field. Upon cooling down from room temperature increases and reaches a maximum at some intermediate temperature . Below , starts to decrease with decreasing temperature due to the onset of superconductivity. The left panel of Fig. 2a shows a magnified version near the superconducting transition. Clearly is systematically increasing with Ti fraction from sample S1 () to S5 (). This is shown in Fig. 2b where is plotted as a function of . is defined at a temperature where is half of normal resistivity defined by measured at 15 K. In Table-1, we summarize of our samples.
To understand the variation of with , we follow two different approaches: (1) McMillan’s equation and (2) Finkelstein’s equation.
The of a strongly coupled superconductor like NbTiN is governed by McMillan’s equation McMillan (1968)
| (1) |
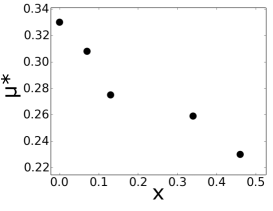
Here, is the Debye temperature, is the effective electron-phonon coupling constant, and is the Coulomb pseudopotential representing electronic Coulomb repulsion. is given by , where is the attractive potential. and depend on the phonon structure and hence lattice parameter (). , on the other hand, depends on disorder— with increasing disorder, increases Anderson et al. (1983). Our five samples have different , , and . Therefore, , , and are different for all five samples. Thus, it is difficult to analyze the variation of as a function of any of the single variables —, , or . However, we note that the maximum change in is less than 1 % between our samples. Thus, the change in from sample to sample due to change in is not enough to describe the variation of . , on the other hand, changes quite significantly— the maximum variation is about 25 %. However, we see no systematic variation of with . For instance, S1 has highest but it also has lowest ; on the other hand, S4 has lowest but it has second highest (see Table-1). In contrast, the variation of with is more systematic. The maximum variation in is about 250 %, much more than or . Thus, it seems that with increasing , disorder of our system reduces, resulting a decrease in . This according to Eq.1, increases .
To verify this mechanism, we assume that and are the same for all our samples. According to Kihlstrom et al. Kihlstrom et al. (1985) and for NbN (S1). Substituting this in Eq.1 yields K for S1. Now substituting K and , we determine from Eq.1 for the remaining samples (S2 to S5). In Fig. 3, we show the variation of as a function of . The observed decrease of with increasing Ti fraction corresponds to decreasing Coulomb interaction, in agreement with the parameters we extracted.
Here, we would like to mention that K is small compared to the values reported in reference Chand (2012) and references therein which range between 250 to 350 K. This is due to the fact that in reference Kihlstrom et al. (1985) was 14.0 K larger than S1. Taking K yields K. Irrespective of exact value of , the qualitative behavior of Fig. 3 remains the same.
Using McMillan’s equation, we have argued that increase of with increasing can most likely be attibuted to Coulomb interaction. But, we had to assume that and do not change from sample to sample. We will now explore Finkelstein’s formula which allows us to express in terms of experimentally measured quantities, normal sheet-resistance and . Thus, unlike McMillan’s equation, there is no free parameter in this framework.
Finkelstein’s model states that with the increasing disorder the reduced scattering length reinforces the Coulomb interaction, which in turn reduces the from the non-disordered value according to the following equation:
| (2) |
Here, is the critical temperature for ‘non-disordered’ material, , .
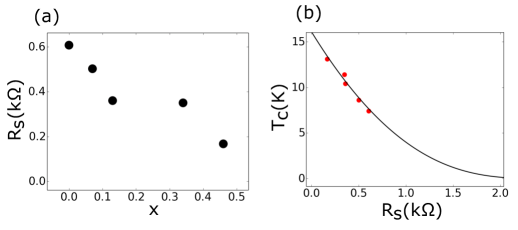
In Fig. 4a, we plot , measured at 50 K where free electron parameters are defined, as a function of . Clearly decreases with .
To apply Finkelstein’s equation, in Fig. 4b, we plot as a function of . The solid line is a fit, taking and as fit parameters. We extract K and s from the fit. , as extracted from the fit, is of the same order of magnitude as estimated from the free electron theory (see Table-1). , on the other hand, is close to bulk reported on Nb1-xTixN samples, which typically range between 16 to 17 K Hazra et al. (2016); Di Leo et al. (1990). However, we would like to point out that each sample, in principle, can have different and . Thus, the extracted and only represent average values.
We would like to point out that Finkelstein’s model is valid for 2d systems. Our films’ thickness (10 nm) is roughly twice (see supplementary information for measurement). Thus, our samples are not exactly in the 2d limit, but very close to it.
In summary, we report on the superconducting properties of five disordered Nb1-xTixN thin films of thickness 10 nm with different . We see that the disorder of the films decrease with increase of . Consequently, with the increase of , the disorder-induced Coulomb interaction reduces, leading to an increase of . Our analysis shows quantitative agreement with the Finkelstein’s theory of disordered superconductivity.
Acknowledgments— We acknowledge financial support from the French National Research Agency/grant ANR-14-CE26-0007–WASI, from the Grenoble Nanosciences Foundation/grant JoQOLaT and from the European Research Council under the European Union’s Seventh Framework Programme (FP7/2007-2013)/ERC Grant agreement No 278203–WiQOJo.
References
- Benvenuti et al. (1997) C. Benvenuti, P. Chiggiato, L. Parrini, and R. Russo, Nuclear Instruments and Methods in Physics Research Section B: Beam Interactions with Materials and Atoms 124, 106 (1997).
- Fabbricatore et al. (1993) P. Fabbricatore, G. Gemme, R. Musenich, R. Parodi, M. Viviani, B. Zhang, and V. Buscaglia, IEEE transactions on applied superconductivity 3, 1761 (1993).
- Bosland et al. (1993) P. Bosland, S. Cantacuzene, J. Gobin, M. Juillard, and J. Martignac, J. Proc. of the 6th Workshop on RF Superconductivity, B. Bonin Ed , 1028 (1993).
- Kooi et al. (1998) J. Kooi, J. Stern, G. Chattopadhyay, H. LeDuc, B. Bumble, and J. Zmuidzinas, International journal of infrared and millimeter waves 19, 373 (1998).
- Bumble et al. (2001) B. Bumble, H. LeDuc, J. Stern, and K. Megerian, IEEE transactions on applied superconductivity 11, 76 (2001).
- Jackson et al. (2001) B. Jackson, A. Baryshev, G. De Lange, J.-R. Gao, S. Shitov, N. Iosad, and T. Klapwijk, Applied Physics Letters 79, 436 (2001).
- Jiang et al. (2010) L. Jiang, S. Shiba, T. Shiino, K. Shimbo, N. Sakai, T. Yamakura, Y. Irimajiri, P. Ananthasubramanian, H. Maezawa, and S. Yamamoto, Superconductor Science and Technology 23, 045025 (2010).
- Miki et al. (2013) S. Miki, T. Yamashita, H. Terai, and Z. Wang, Optics express 21, 10208 (2013).
- Schuck et al. (2013) C. Schuck, W. H. Pernice, and H. X. Tang, Scientific reports 3, 1893 (2013).
- Tanner et al. (2010) M. G. Tanner, C. Natarajan, V. Pottapenjara, J. O’Connor, R. Warburton, R. Hadfield, B. Baek, S. Nam, S. Dorenbos, E. B. Ureña, et al., Applied Physics Letters 96, 221109 (2010).
- Dorenbos et al. (2008) S. Dorenbos, E. Reiger, U. Perinetti, V. Zwiller, T. Zijlstra, and T. Klapwijk, Applied Physics Letters 93, 131101 (2008).
- Samkharadze et al. (2016) N. Samkharadze, A. Bruno, P. Scarlino, G. Zheng, D. DiVincenzo, L. DiCarlo, and L. Vandersypen, Physical Review Applied 5, 044004 (2016).
- Barends et al. (2010) R. Barends, N. Vercruyssen, A. Endo, P. De Visser, T. Zijlstra, T. Klapwijk, P. Diener, S. Yates, and J. Baselmans, Applied Physics Letters 97, 023508 (2010).
- Barends et al. (2009) R. Barends, H. Hortensius, T. Zijlstra, J. J. Baselmans, S. Yates, J. Gao, and T. M. Klapwijk, IEEE Transactions on Applied Superconductivity 19, 936 (2009).
- Goldman and Markovic (1998) A. Goldman and N. Markovic, Phys. Today 51, 39 (1998).
- Crane et al. (2007) R. Crane, N. Armitage, A. Johansson, G. Sambandamurthy, D. Shahar, and G. Grüner, Physical Review B 75, 184530 (2007).
- Baturina et al. (2007a) T. Baturina, A. Y. Mironov, V. Vinokur, M. Baklanov, and C. Strunk, Physical review letters 99, 257003 (2007a).
- Baturina et al. (2007b) T. Baturina, C. Strunk, M. Baklanov, and A. Satta, Physical review letters 98, 127003 (2007b).
- Sacépé et al. (2008) B. Sacépé, C. Chapelier, T. Baturina, V. Vinokur, M. Baklanov, and M. Sanquer, Physical review letters 101, 157006 (2008).
- Sacépé et al. (2010) B. Sacépé, C. Chapelier, T. I. Baturina, V. M. Vinokur, M. R. Baklanov, and M. Sanquer, Nature Communications 1, 140 (2010).
- Mondal et al. (2011a) M. Mondal, A. Kamlapure, M. Chand, G. Saraswat, S. Kumar, J. Jesudasan, L. Benfatto, V. Tripathi, and P. Raychaudhuri, Physical review letters 106, 047001 (2011a).
- Mondal et al. (2011b) M. Mondal, S. Kumar, M. Chand, A. Kamlapure, G. Saraswat, G. Seibold, L. Benfatto, and P. Raychaudhuri, Physical review letters 107, 217003 (2011b).
- Driessen et al. (2012) E. Driessen, P. Coumou, R. Tromp, P. De Visser, and T. Klapwijk, Physical review letters 109, 107003 (2012).
- Coumou et al. (2013) P. Coumou, E. Driessen, J. Bueno, C. Chapelier, and T. Klapwijk, Physical Review B 88, 180505 (2013).
- Mondal et al. (2013) M. Mondal, A. Kamlapure, S. C. Ganguli, J. Jesudasan, V. Bagwe, L. Benfatto, and P. Raychaudhuri, Scientific Reports 3, 1357 (2013).
- Kamlapure et al. (2013) A. Kamlapure, T. Das, S. C. Ganguli, J. B. Parmar, S. Bhattacharyya, and P. Raychaudhuri, Scientific reports 3, 2979 (2013).
- Noat et al. (2013) Y. Noat, V. Cherkez, C. Brun, T. Cren, C. Carbillet, F. Debontridder, K. Ilin, M. Siegel, A. Semenov, H.-W. Hübers, et al., Physical Review B 88, 014503 (2013).
- Bell et al. (1968) H. Bell, Y. Shy, D. Anderson, and L. Toth, Journal of Applied Physics 39, 2797 (1968).
- Barends et al. (2008) R. Barends, H. Hortensius, T. Zijlstra, J. Baselmans, S. Yates, J. Gao, and T. Klapwijk, Applied Physics Letters 92, 223502 (2008).
- Makise et al. (2011) K. Makise, H. Terai, M. Takeda, Y. Uzawa, and Z. Wang, IEEE transactions on applied superconductivity 21, 139 (2011).
- Hong et al. (2013) T. Hong, K. Choi, K. Ik Sim, T. Ha, B. Cheol Park, H. Yamamori, and J. Hoon Kim, Journal of Applied Physics 114, 243905 (2013).
- Karimi et al. (2016) A. Karimi, D. La Grange, N. Goebbels, and A. Santana, Thin Solid Films 607, 14 (2016).
- Klug et al. (2013) J. A. Klug, N. G. Becker, N. R. Groll, C. Cao, M. S. Weimer, M. J. Pellin, J. F. Zasadzinski, and T. Proslier, Applied Physics Letters 103, 211602 (2013).
- Di Leo et al. (1990) R. Di Leo, A. Nigro, G. Nobile, and R. Vaglio, Journal of Low Temperature Physics 78, 41 (1990).
- Myoren et al. (2001) H. Myoren, T. Shimizu, T. Iizuka, and S. Takada, IEEE transactions on applied superconductivity 11, 3828 (2001).
- Pessall et al. (1968) N. Pessall, R. Gold, and H. Johansen, Journal of Physics and Chemistry of Solids 29, 19 (1968).
- Yen et al. (1967) C. Yen, L. Toth, Y. Shy, D. Anderson, and L. Rosner, Journal of Applied Physics 38, 2268 (1967).
- Tsavdaris et al. (2017) N. Tsavdaris, D. Harza, S. Coindeau, G. Renou, F. Robaut, E. Sarigiannidou, M. Jacquemin, R. Reboud, M. Hofheinz, E. Blanquet, et al., Chemistry of Materials (2017).
- Mercier et al. (2014) F. Mercier, S. Coindeau, S. Lay, A. Crisci, M. Benz, T. Encinas, R. Boichot, A. Mantoux, C. Jimenez, F. Weiss, et al., Surface and Coatings Technology 260, 126 (2014).
- Tikhonov et al. (2012) K. S. Tikhonov, G. Schwiete, and A. M. Finkel’stein, Physical Review B 85, 174527 (2012).
- Breznay et al. (2012) N. P. Breznay, K. Michaeli, K. S. Tikhonov, A. M. Finkel’Stein, M. Tendulkar, and A. Kapitulnik, Physical Review B 86, 014514 (2012).
- Destraz et al. (2017) D. Destraz, K. Ilin, M. Siegel, A. Schilling, and J. Chang, Physical Review B 95, 224501 (2017).
- Kittel (2005) C. Kittel, Introduction to solid state physics (Wiley, 2005).
- Chand et al. (2009) M. Chand, A. Mishra, Y. Xiong, A. Kamlapure, S. Chockalingam, J. Jesudasan, V. Bagwe, M. Mondal, P. Adams, V. Tripathi, et al., Physical Review B 80, 134514 (2009).
- Chand (2012) M. Chand, PhD Thesis, Tata Institute of Fundamental Research, India; http://www.tifr.res.in/ superconductivity/pdfs/madhavi.pdf (2012).
- McMillan (1968) W. L. McMillan, Phys. Rev. 167, 331 (1968).
- Anderson et al. (1983) P. W. Anderson, K. A. Muttalib, and T. V. Ramakrishnan, Phys. Rev. B 28, 117 (1983).
- Kihlstrom et al. (1985) K. Kihlstrom, R. Simon, and S. Wolf, Physica B+C 135, 198 (1985).
- Hazra et al. (2016) D. Hazra, N. Tsavdaris, S. Jebari, A. Grimm, F. Blanchet, F. Mercier, E. Blanquet, C. Chapelier, and M. Hofheinz, Superconductor Science and Technology 29, 105011 (2016).