Technical Report No. 9910 (revised), Department of Statistics, University of Toronto
Circularly-Coupled Markov Chain Sampling
Radford M. Neal
Department of Statistics and Department of Computer Science
University of Toronto, Toronto, Ontario, Canada
http://www.cs.utoronto.ca/~radford/
radford@stat.utoronto.ca
| First version: | 22 November 1999 |
|---|---|
| Revised: | 28 February 2002 |
Abstract
I show how to run an -time-step Markov chain simulation in a circular fashion, so that the state at time follows the state at time in the same way as states at times follow those at times for . This wrap-around of the chain is achieved using a coupling procedure, and produces states that all have close to the equilibrium distribution of the Markov chain, under the assumption that coupled chains are likely to coalesce in less than iterations. This procedure therefore automatically eliminates the initial portion of the chain that would otherwise need to be discarded to get good estimates of equilibrium averages. The assumption of rapid coalescence can be tested using auxiliary chains started at times spaced between and . When multiple processors are available, such auxiliary chains can be simulated in parallel, and pieced together to give the circularly-coupled chain, in less time than a sequential simulation would have taken, provided that coalescence is indeed rapid.
The practical utility of these procedures is dependent on the development of good coupling schemes. I show how a specialized “random-grid” Metropolis algorithm can be used to produce the required exact coalescence. On its own, this method is not efficient in high dimensions, but it can be used to produce exact coalescence once other methods have brought the coupled chains close together. I investigate how well this combined scheme works with standard Metropolis, Langevin, and Gibbs sampling updates. Using such strategies, I show that circular coupling can work effectively in a Bayesian logistic regression problem.
1 Introduction
Sampling from a complex distribution by simulating a Markov chain having this distribution as its equilibrium distribution is an important technique in statistical mechanics (eg, Frenkel and Smit 1996), in Bayesian statistics (eg, Gilks, et al 1996), and in other computational problems (eg, Sinclair 1993). States from the equilibrium distribution of the chain are then used to estimate quantities of interest, such as the average energy of a physical system, or a Bayesian predictive distribution.
Ideally, such simulations would be conducted with theoretical knowledge of the time needed for the chain to reach its equilibrium distribution to within a given tolerance. Although some progress has been made at producing quantitative bounds on convergence times of Markov chains (eg, Rosenthal 1995a), such theoretical guarantees are presently unavailable for most problems of practical interest.
Instead, practitioners usually assess the convergence of the Markov chain sampler empirically, by formal or informal methods. These methods attempt to determine whether the chain has reached an adequate approximation to its equilibrium distribution within the number of iterations simulated. If it appears to have done so, some initial portion of the chain (the “burn-in” period) is generally discarded in order to avoid biasing the results by inclusion of states that reflect the state in which the chain was started rather than its equilibrium distribution. The bewildering variety of methods for diagnosing convergence and discarding an appropriate burn-in period have been reviewed by Cowles and Carlin (1996), Brooks and Roberts (1998), and Mengersen, et al (1999).
One convergence diagnostic, due to Johnson (1996), looks at multiple “coupled” chains that are started from different initial states, but that subsequently undergo transitions determined by the same random numbers. Rosenthal (1995b) reviews the application of coupling to Markov chains. Briefly, coupling chains introduces dependencies between them, and may lead them to “coalesce” to the same state after some number of iterations. The probability that a chain started from the initial state distribution has not coalesced with a chain started from the equilibrium distribution by time provides an upper bound on the total variation distance of the chain from equilibrium at time . In Johnson’s diagnostic, the time required for several chains whose initial states were drawn from a distribution that is meant to be “overdispersed” with respect to the equilibrium distribution is taken as an informal indication of how much time is required for approximate equilibrium to be reached.
One way of viewing the circular coupling method of this paper is as a refinement of Johnson’s scheme, which addresses two problems that scheme suffers from. One problem noted by Johnson is that using the states immediately following the time when all chains coalesce introduces a bias in the results, favouring states where coalescence is more likely. The circular coupling scheme of this paper discards an initial portion of the chain without introducing bias (under certain assumptions), by using the last state of the chain to start a new chain at time zero, and using the states of this chain rather than of the original chain up to the point where it and the original chain coalesce. Another problem is that although Johnson’s scheme considers several initial states, it uses only a single sequence of random numbers. It could be that this one sequence happens to produce atypically fast coalescence. Diagnostics in the circular coupling scheme are based on a variety of starting states at times spaced throughout the total simulation period, thereby effectively considering various initial random number sequences. This reduces (but does not eliminate) the possibility that the results will be misleadingly optimistic.
The coupling technique of this paper also provides a way of exploiting parallel computation in Markov chain simulation. As discussed by Rosenthal (1999), there are many possibilities for exploiting multiple processors for the overall task of estimating quantities using Markov chain Monte Carlo methods. However, the core operation of simulating a single realization of a Markov chain might appear to be inherently sequential, since it might seem that the state at time cannot be obtained until the state at time has been found. In this paper, however, I will show how coupling allows one to use multiple processors to simulate a single realization of a Markov chain in substantially less time that would be required by a single processor, provided that the Markov chain and the coupling method employed lead to rapid coalescence of chains.
The practical feasibility of circular coupling is dependent on finding an efficient coupling scheme — ie, a way of introducing dependencies between the transitions from chains currently in different states that promotes the rapid coalescence of these chains to the same state. In this paper, I first describe a specialized “random-grid” Metropolis update, which can produce exact coalescence even for continuous distributions, and use this to demonstrate circular coupling in simple one-dimensional examples. In higher dimensions, this method does not work well on its own. However, one can combine more standard Markov chain updates, coupled in a way that leads the chains to approach each other more and more closely, with an occasional random-grid Metropolis update, which can produce exact coalescence once the chains are very close. I examine how well this strategy works using standard Metropolis, Langevin, and Gibbs sampling updates, and find that at least the Langevin and Gibbs sampling updates can produce efficient coupling.
I conclude by demonstrating that circular coupling can be applied effectively to a polytomous logistic regression problem with a hierarchical prior over regression coefficients.
Although circular coupling works well in this demonstration, there may sometimes be a cost to restricting the Markov chains used to those for which good coupling methods are available, and even when a suitable coupling scheme is available, it may not be optimal, and hence may lead to coalescence times that are greater than the actual time required for the Markov chain to reach approximate equilibrium. However, this requirement for an efficient coupling scheme is less onerous than for the alternative of exact (a.k.a. “perfect”) sampling methods, such as coupling from the past (Propp and Wilson 1996) and the interruptible scheme of Fill (1998). For these methods, the coupling scheme must not only promote coalescence, but also permit the efficient tracking of large sets of states, so that the coalescence of a huge (possibly infinite) set of chains started in all possible states can be determined. Circular coupling looks only at the coalescence of a moderate number of explicitly simulated chains, and is therefore much easier. The price of this is that circular coupling will not provide an absolute guarantee that the states obtained are from the exact equilibrium distribution, but only an assurance that they are from close to the equilibrium distribution, provided that certain conditions are met whose truth can be empirically tested, but not verified with certainty.
In some situations, any added cost from using Markov chain methods that produce good coupling may be offset by using this coupling to reduce the variance of estimates. This can be done by using estimators that exploit correlations with states of a coupled chain that samples from an approximating distribution for which expectations are known exactly (Pinto and Neal 2001; Schmeiser and Chen 1991; Chen, et al 2000, Section 3.4).
I begin in Section 2 by presenting the algorithms and their justification in the abstract. Section 3 introduces the random-grid Metropolis coupling scheme, uses it to demonstrate the idea of circular coupling in two one-dimensional problems, and discusses how this scheme can be generalized to higher-dimensional problems, though on its own it does not perform well in a nine-dimensional example. Section 4 shows how random-grid Metropolis updates can be combined with other updates to produce more efficient circularly-coupled samplers. These methods are shown to be effective in a logistic regression problem in Section 5. I conclude in Section 6 by discussing the significance of circular coupling for the routine use of Markov chain sampling.
2 Circular coupling algorithms
Suppose we wish to sample from a distribution for some state variable by using a Markov chain having as an invariant distribution. We hope that this Markov chain is ergodic, and hence has as its only invariant distribution, and that it converges to this equilibrium distribution rapidly.
Realizations of this chain with different initial states can be coupled by representing the transitions of the chain by a function , which takes as arguments the state at some time, , and the random numbers generated at that time, , and returns the state of the chain at the next time, . The random numbers at each time are drawn independently, each from the same distribution, .
With this representation, an ordinary Markov chain simulation for time steps is conducted as follows:
- Standard Markov chain simulation:
-
1)
Randomly draw from the initial state distribution, .
-
2)
For :
Randomly draw from the distribution , independently of previous draws.
Let .
There are many ways of expressing a given set of transition probabilities by using different transition functions, , and different random number distributions, . Apart from possible differences in computational cost, the choice makes no difference for the algorithm above.
In the circular-coupling algorithms below, however, chains started in different states are coupled by using the same , in the hope that this will lead the chains to “coalesce” to the same state. Different ways of expressing the transitions in terms of a function may lead to coalescence occurring more or less rapidly. However, with any coupling scheme of this nature, once two chains have coalesced to the same state at some time, they will remain in the same state at all subsequent times.
2.1 The basic circular coupling procedure
A circularly-coupled Markov chain simulation for time steps begins the same way as a standard simulation, but after generating , a second set of states, , are generated by letting and then redoing the simulation from this starting point, using the same random numbers, , as before. If the chain started from coalesces with the original chain before time , there is no need to perform any further computations, since each from that time on will be the same as the corresponding . Here is the basic procedure (without the diagnostics that will be added in Section 2.3), which is also illustrated in Figure 1:
- Basic circularly-coupled Markov chain simulation:
-
1)
Randomly draw from the initial state distribution, .
-
2)
For :
Randomly draw from the distribution , independently of previous draws.
Let . -
3)
Let .
-
4)
For while :
Let . -
5)
Let the remaining be the same as the corresponding .

In practice, pseudo-random numbers would generally be used, eliminating the need to save ; instead, the pseudo-random number generator can simply be re-initialized using the original seed. If the amount of memory needed to save a state is large, the values of might not be saved when they are first generated, but instead be recomputed as are generated. The time devoted to this recomputation will be relatively small if coalescence of with is rapid. Estimates for the expectations of functions of state that are of interest can be found without saving all the states using sums of the values of these functions at all iterations. These sums can be accumulated during the initial simulation, and then updated as each wrapped-around state is simulated.
If the wrapped-around chain fails to coalesce with the original chain (ie, if ), the procedure may be seen as having failed. The project of sampling from might then be abandoned, or the procedure might be redone with a substantially larger value for . For purposes of theoretical analysis, however, I will assume that the for are always treated as a sample from the equilibrium distribution of the chain, and used to estimate expectations of functions with respect to this distribution, even if coalescence did not occur. (Note that since when coalescence does occur, these points should not both be included in the sample, as this point would then count double.) In the next section, I show that all these will indeed have approximately the equilibrium distribution, provided certain assumptions regarding speed of coalescence are satisfied. Of course, the will generally be dependent, and this will need to be accounted for when assessing the accuracy of the estimates obtained, as with standard Markov chain Monte Carlo procedures.
2.2 Proof of approximate correctness
The following theorem guarantees the approximate correctness of circular coupling, under certain assumptions:
Theorem: Let , , and be such that if and are independent with and . Then each point , for , that is generated by the basic circularly-coupled Markov chain simulation procedure with a given (assumed here to be even) has a distribution that is within of the equilibrium distribution, , in total variation distance,111Here, the total variation distance between distributions and is defined to be , where the supremum is over all events . Total variation distance is sometimes given an alternative definition that is twice this. provided and are such that the following conditions hold regarding coupled chains (ie, chains that are simulated using the same random number sequence, ):
-
1)
If two chains are started from states drawn from the equilibrium distribution, , independently of each other, and of the , they will coalesce within iterations with probability at least .
-
2)
If a chain is started from a state drawn from , independently of the , and another chain is started from a state drawn from the distribution , independently of the initial state of the other chain and of the , then the two chains will coalesce within iterations with probability at least .
The proof looks at another way of generating the sequence , along with , by means of the procedure given below, and illustrated in Figure 2.
- Theoretical circular coupling procedure:
-
1)
Randomly draw from the initial state distribution, .
-
2)
For :
Randomly draw from the distribution , independently of previous draws.
Let . -
3)
Randomly draw and from , each independently of the other and of the .
-
4)
For : Let .
For : Let . -
5)
Let and .
-
6)
For : Let .
For : Let . -
7)
Let for and let for .

The generation of in steps (1) and (2) above is the same as for the practical circular coupling procedure of the previous section, but the rest of the theoretical procedure could not be carried out in practice, since it requires sampling directly from , which is presumably infeasible.
However, we can use this theoretical procedure to prove the approximate correctness of the practical circular coupling procedure. First, we will see that the produced by the theoretical procedure all have distribution . Second, when the two conditions of the theorem hold, we will see that the distribution of obtained with the theoretical procedure is approximately the same as for the practical procedure.
That each of the obtained using the theoretical procedure has distribution follows easily as long as is an invariant distribution of the Markov chain defined by the function and the random number distribution — ie, as long as the distribution of is when has distribution and has distribution , independent of . From this, it follows that all the and and all and have distribution , since they are produced by transitions that leave invariant, starting from a state drawn from . Since each is defined to be equal to either or , the must all have distribution as well.
For the second part of the proof, we first note that when the two conditions of the theorem hold, the following events occur with the indicated probabilities:
-
a)
with probability at least .
-
b)
with probability at least .
-
c)
with probability at least .
For event (a), this follows from Condition (1) because and are the result of iterations with the same (for ), starting from points and that are both drawn independently from , independently of these . That is drawn from follows from it being produced from , which is drawn from , by applying transitions that leave invariant. Note that these transitions are defined in terms of for , which does not overlap the set of above. The bound on the probability of event (b) follows from Condition (1) similarly, and the bound on the probability of event (c) follows from Condition (2).
The event of (a), (b), and (c) all occurring has probability at least , because the probability that at least one of (a), (b), and (c) will not occur is at most (this bound is valid even though the three events may not be independent). When this happens, . Furthermore, for — this is obvious for all except , and for that , it is a consequence of . When all of (a), (b), and (c) occur, the values of generated will therefore be the same as would be generated by the basic circular coupling procedure.
From the coupling inequality (Lindvall 1992), we can bound the total variation distance between the distribution of as produced by the practical procedure and the distribution of as produced by the theoretical procedure by the probability of these sequences differing, which we have seen is in turn bounded above by . The total variation distance between the distributions of any individual for the two procedures is bounded by the same quantity. Since the distribution of each produced by the theoretical procedure is , we see that the distribution of each produced by the practical procedure is within of in total variation distance.
2.3 Testing the conditions for approximate correctness
Conditions (1) and (2) required for the approximate correctness of the circular coupling procedure will seldom be verifiable theoretically. Instead, we will have to content ourselves with an empirical diagnostic test.
This test starts by tentatively assuming that the two conditions are true for the value of we are using, and for some fairly small values of and . If so, the value of each obtained should come from close to the equilibrium distribution . Although will not be completely independent of , the dependence should in practice be sufficiently slight that we can see as a realization of the Markov chain started at equilibrium, at least as long as we look only up to with . (Here and below, addition and subtraction on times is done modulo , so that if , then refers to .)
Condition (2) states that such a sequence, , will with high probability coalesce within iterations with another coupled chain started in a state drawn from the initial state distribution . Choosing some that divides , we can test whether this in fact occurs when starting at times by simulating auxiliary chains starting at those times. In practice, we would usually wish for coalescence to occur in considerably fewer than iterations, so let us suppose that we simulate each such chain for only some number iterations, or until the auxiliary chain coalesces with
This leads to the following extension of the basic circular coupling procedure:
- Circularly-coupled simulation with auxiliary diagnostic chains:
-
1-5)
Perform steps (1) to (5) of the basic circularly-coupled Markov chain simulation procedure.
-
6)
Let be the number of steps needed for the wrapped-around chain to coalesce with the original chain — ie, let be the smallest such that — unless the chains do not coalesce within iterations, in which case let .
-
7)
For :
Let .
Randomly draw from the initial state distribution, .
Set .
For (modulo ) while :
Let .
Set .
The time required for this procedure will be roughly proportional to the number of Markov chain iterations (ie, the number of evaluations of ), which will be . Note that if all the auxiliary chains coalesce with the wrapped-around chain, , there will be no real distinction between the auxiliary chains and the original chain that was started with drawn from . The same wrapped-around chain would have been found from any of the starting points.
The values of for that are obtained by this procedure are indicative of whether Condition (2) holds. If many of the are equal to , we should not be confident that this condition holds, and should rerun the simulation with a larger value for and probably a larger value for as well (recall that should be substantially smaller than ). It may often be reasonable to think that the have an approximately geometric distribution, in which case the parameter of this distribution could be estimated from this (right-censored) data, and used to estimate the value of for which Condition (2) holds.
This test does not provide direct information about Condition (1), which involves two chains started from the equilibrium distribution. However, if the evidence from the auxiliary chains leads us to conclude that all but a small fraction, , of chains started from coalesce in no more than iterations with a chain started from the equilibrium distribution, then we can also conclude that two chains started from the equilibrium distribution will coalesce with each other within iterations with probability at least , since if they both coalesce with a chain started from , they must also coalesce with each other.
If all the auxiliary diagnostic chains are observed to coalesce quickly with the wrapped-around chain, we therefore have reason to believe that both conditions for approximate correctness hold. This will not be an absolute guarantee, however. It could be that the initial state distribution, , gives little probability to a region that has high probability under , and that is isolated from the regions that do have high probability under . Both the wrapped-around chain and the auxiliary diagnostic chains might never visit this isolated region, in which case the diagnostic chains would present a self-consistent but drastically incorrect picture of the distribution of coalescence times. To help avoid this, it is desirable for to be “overdispersed” with respect to , but even if this is so, there is no guarantee that all high probability regions of will be found, since some region with a large probability under might have a small “basin of attraction”, and hence could be missed even if it is within the high probability region of . This can occur, for example, when gives substantial probability to a small region with very high probability density, which the chain is unlikely to chance upon.
2.4 Parallel simulation
The auxiliary chains used as diagnostics in the previous section are expected to coalesce with the wrapped-around chain reasonably rapidly. If this is indeed so, coalescence of each auxiliary chain with the next auxiliary chain (started time steps forward) will also be fairly rapid. It will then be possible to find the wrapped-around chain by parallel computation on several processors, in less time than would be needed to simulate the wrapped-around chain using a single processor. The following procedure is based on this idea:
- Parallel simulation of a circularly-coupled Markov chain:
- In parallel, processors numbered by do the following:
- (The variables , , and are local to each processor)
-
1)
Let .
-
2)
For :
Randomly draw from the distribution , independently of other draws. -
3)
Randomly draw from the distribution , independently of other draws.
-
4)
For :
Set . -
5)
Set .
-
6)
Send to processor (modulo ) as the new value for .
-
7)
Repeat the following:
Wait for a new value for to be received from processor (modulo ).
For while :
Set .
If :
Set .
Send to processor (modulo ) as the new value for . - The procedure terminates when all processors are waiting.
The wrapped-around chain consists of the final values of that are stored in the processors. The subscript of wraps around in the above procedure, so that processor sends to processor , which uses it to replace the old value of . An ordinary, non-circular Markov chain simulation can be performed in parallel in the same way as above by omitting this wrap-around, keeping fixed at its original value, but I will not discuss this further here.
The computation time for the above simulation will be at least the time required to simulate Markov chain iterations, since that many iterations will always be done in steps (4) and (5). Each processor will then begin simulating a chain starting from the new value received for its . If each of these chains coalesces within iterations with the chains that were simulated starting from the original values for each , then each processor will find that the value for that it communicates to the next processor is unchanged, and the entire procedure will terminate. The time taken will be that required for between and Markov chain iterations.
If, on the contrary, not all of these chains coalesce within iterations, one or more of the processors will have to perform a third simulation. In general, a processor might have to rerun its simulation any number of times, as a result of the previous processor sending it new start states. Assuming that a sequential simulation would have resulted in the wrapped-around chain coalescing with the original chain, the time required for the parallel simulation will be roughly proportional to the maximum number of iterations that any of the chains with different starting points take to coalesce with this wrapped-around chain. If this time is comparable to the time for a sequential simulation, the slow coalescence of the auxiliary chain would be indicative of a problem, and it would usually be best to stop the whole procedure, and restart it with a larger value for .
It is possible that the procedure as shown will not terminate. This will happen if different starting points lead to different wrapped-around chains; Figure 6 in Section 3.2 below illustrates this possibility. In practice, the procedure should be terminated when some processor has received more than some maximum of new values for its starting point. The maximum number of such new starting points is a rough diagnostic of how rapidly the chains couple, providing information similar to that provided by the in the procedure of Section 2.3.
This parallel simulation procedure may be adaptable to vector computation, provided the computation of does not involve lots of conditional computations. Such a vectorized simulation might be appropriate when vector operations are supported by hardware, or when programming is done in an interpreted language in which vector operations are not much slower than scalar operations, due to the fixed overhead of interpretation.
Finally, note that although the parallel simulation procedure aims to do roughly what is done by the sequential procedure with auxiliary diagnostic chains of Section 2.3, the actual computations done may differ. When not all chains coalesce with the wrapped-around chain within iterations, the sequential procedure of Section 2.3 will simulate two or more auxiliary chains that operate at the same times. It is possible that these chains will coalesce with each other before coalescing with the wrapped-around chain, but the sequential procedure does not detect this, and will simulate the coalesced chains separately. Coalescence of chains is detected differently in the parallel procedure, however, which may lead to such portions of chains being simulated only once. Use of this procedure may therefore be advantageous even when one has available only a single processor (which executes the parallel processes by time sharing).
3 Coupling using random-grid Metropolis updates
To be practically useful, the circular coupling procedure needs a representation of the Markov chain transitions in terms of a function that is easily computable and that leads to rapid coalescence of chains. Exact sampling methods such as coupling from the past (Propp and Wilson 1996) also require such a representation, as does Johnson’s (1996, 1998) convergence diagnostic. Several such schemes have recently been discussed in the context of exact sampling by Green and Murdoch (1998). Note that we are at liberty to choose the Markov chain transitions to facilitate coupling, though this might sometimes come at a cost in terms of convergence rate.
In this section, I present a simple coupling scheme based on “random-grid” Metropolis updates, which can produce exact coalescence in continuous state spaces, and use it to demonstrate some aspects of circular coupling using simple one-dimensional distributions. I also show that the random-grid method alone does not work well for high-dimensional problems. However, random-grid Metropolis updates can be combined with other standard methods to obtain better results, as is discussed in Section 4, and applied to the example in Section 5.
3.1 Random-grid Metropolis in one dimension
Suppose that our state, , consists of a single real value, and that our desired distribution is given by the density function . Recall that the Metropolis algorithm defines a Markov chain transition in terms of a density function, , for proposing a move to state , given that the chain is currently in state . This proposal is accepted with probability . If the proposal is rejected, the new state is the same as the old state. Provided that the proposal distribution is symmetrical (ie, ), this update leaves the distribution invariant.
I will consider a random-walk Metropolis algorithm using proposals that are uniformly distributed in an interval of width , centred on the current state, for which
| (3) |
The most obvious way of expressing this update in terms of a function is as follows:
| (6) |
This function takes the current state and a vector, , of two random numbers as arguments, and returns the next state, which will have the distribution as defined for the Metropolis algorithm with the proposal distribution above. However, with this function, the probability of exact coalescence of chains is zero, whenever the current states are distinct.
Fortunately, the same Markov chain transition probabilities are obtained with the following function, which can lead to coalescence with positive probability:
| (9) | |||||
| where | |||||
Round returns the integer nearest its argument. The function can be seen as first transforming the state to , then rounding to the nearest integer, and finally applying the inverse transformation. For a given value of , a range of values for of width all result in the same value for . Hence, two chains whose current states are in this range, and which both accept the proposed point, will coalesce exactly.
This function can be visualized as first laying down a grid of points spaced apart, with the position of the grid being chosen uniformly at random, and then proposing to move to the point on this grid that is nearest the current state, . It is then clear that the distribution of the proposed state is as in equation (3).
How well can this method be expected to work? There are two aspects to this question — how rapidly a Markov chain using these updates will converge to the equilibrium distribution, and how rapidly two chains coupled in this way will coalesce. As for any coupling method, the average coalescence time cannot be less than the time for approximate convergence, but it might well be larger, if the coupling scheme is ill-chosen.
The convergence rate for random-grid Metropolis will of course depend on the distribution, and on the choice of . For one-dimensional problems, the optimal is generally quite large, even if this leads to a low acceptance rate. However, I will here assume that is chosen so as to produce a fairly high acceptance rate, since this is more relevant to the higher-dimensional problems examined later.
If the acceptance rate is substantially greater than one-half (eg, 3/4), coalescence should occur about as rapidly as convergence to the equilibrium distribution. With such a high acceptance rate, two coupled chains must often accept simultaneously, which will have a good chance of causing coalescence if the states of the two chains are substantially less than apart. Furthermore, the chains will indeed approach to within that distance fairly often, because they both move in steps less than in size, and in one dimension, their paths cannot avoid crossing. (One chain cannot stay below the other indefinitely, since both chains must be sampling from the same equilibrium distribution.)
Before discussing how this scheme can be generalized to higher dimensions, I first use one-dimensional random-grid updates to demonstrate some general aspects of circular coupling.
3.2 Simple demonstrations using random grid Metropolis
To illustrate the concept of circularly-coupled Markov chain simulation, I include here two simple illustrations with a one-dimensional state space. Both examples use the random-grid Metropolis algorithm of the previous section, which is based on the uniform proposal distribution of equation (3), with , coupled using the scheme of equation (9). This value for was chosen deliberately so as to produce a somewhat inefficient sampler.
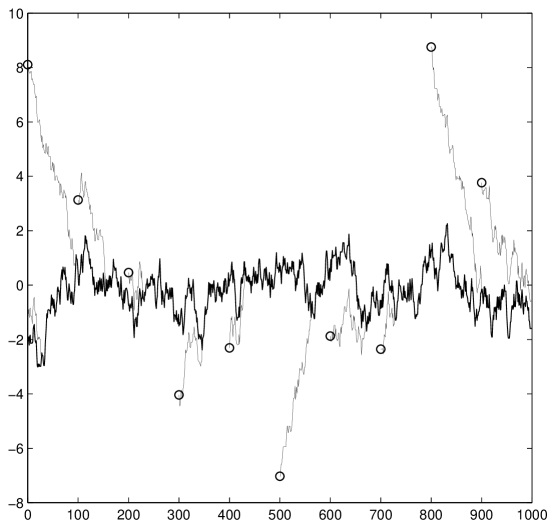
The first example illustrates the behaviour of circular coupling when coalescence is rapid. Figure 3 shows a simulation of length that samples from the distribution, with as the initial state distribution. Ten chains were simulated in total — one started at , plus nine auxiliary chains started at . All chains coalesce rapidly with the wrapped-around chain, an indication (but not an absolute guarantee) that the conditions for the states of the wrapped-around chain to all come from the equilibrium distribution are satisfied.
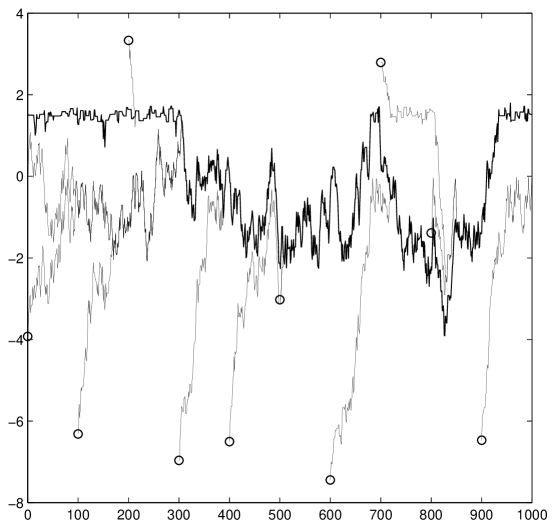
The second example illustrates how circular coupling behaves when coalescence is less rapid. The distribution to be sampled from is in this case a bimodal mixture of normals, . Figure 4 shows a circularly-coupled simulation for this distribution that is typical of runs of length , with starting points. Some of the ten chains started with states from the distribution coalesce rapidly, as for the first example, but others do not. In particular, the chain started at takes about 400 iterations to coalesce with the wrapped-around chain. This is evidence that the conditions needed for the states of the wrapped-around chain to come from approximately the correct distribution may not be satisfied.
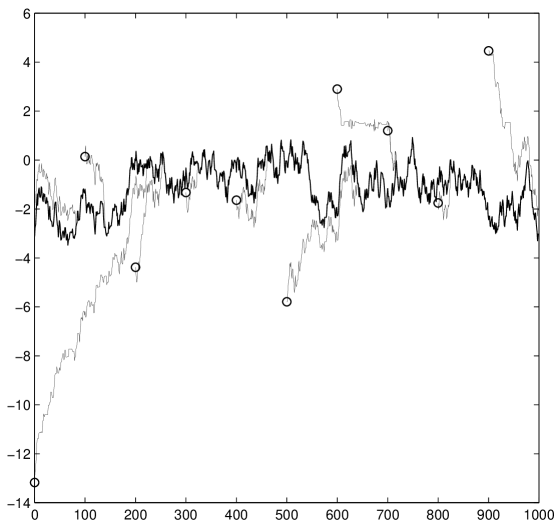
Figure 5 shows another run of the same simulation, with a different pseudo-random number seed. This run might well be misleading, since the wrapped-around chain found samples from only the lower of the mixture distribution’s two modes. Moreover, the chains from all ten starting points coalesce with this wrapped-around chain reasonably quickly, which might lead one to think that the procedure is sampling from approximately the correct distribution. The distribution of states produced by this procedure might indeed be at least roughly correct, since as seen in the previous figure, other runs of the same simulation procedure do produce wrapped-around chains that visit the upper mode as well. However, even if the distribution of each state of the wrapped-around chain for is close to correct, the states in this chain are clearly highly dependent, and hence a single wrapped-around chain can fail to provide an adequate sample. Behaviour similar to this occurs in a few percent of the runs. Using more than ten random starting points would reduce the chances of such a problem remaining undiagnosed.
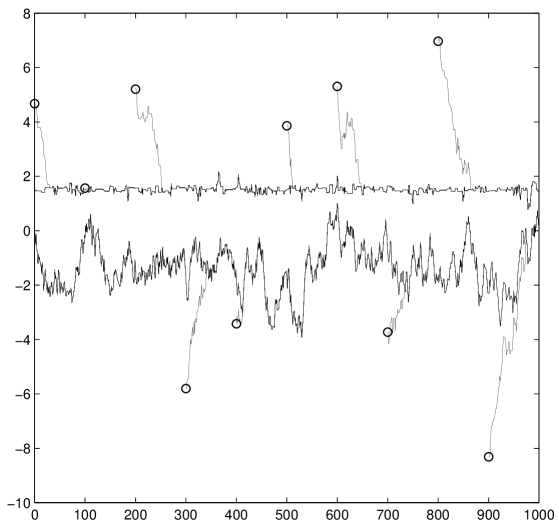
Figure 6 shows another possible result of the simulation procedure, which occurs about once in a thousand runs. Here, six of the ten chains coalesce to a wrapped-around chain that moves within the upper mode only. The chains started from the other four initial states coalesce to a wrapped-around chain that moves within the lower mode. When this situation occurs, one can tell that the simulation should be rerun with a larger value of .
3.3 Random-grid Metropolis in more than one dimension
The random-grid Metropolis procedure can be used to sample from multi-dimensional distributions in two ways. One way is to update one component of the state at a time, in sequence or randomly, using the one-dimensional random-grid method of Section 3.1. The other way is to update all components of the state at once, using a multi-dimensional random grid.
Multi-dimensional random-grid Metropolis updates use a proposal distribution that is uniform over a hypercube centred on the current state, with sides of length . To produce exact coalescence, this is implemented using a function analogous to that of equation (9), which can be visualized as randomly positioning a multi-dimensional square grid with points separated by in each coordinate direction, and then proposing to move to the grid point nearest the current state. In detail, a -dimensional update from state is done by generating a vector of independent Uniform(0,1) random variates, , and then setting the next state to
| (12) |
where the function is defined by
| (13) |
(Note that subscripts of will now index components of the multivariate state, not time, as was the case before.)
In contrast to the situation in one dimension, it is conceivable that two coupled chains with a higher-dimensional state might both sample from the same equilibrium distribution, moving in steps of size less than in each coordinate direction, and yet almost always be separated by a distance greater than in at least one direction, thereby making exact coalescence unlikely when using the random-grid procedure. This will be avoided if coupled chains have a tendency to approach each other more and more closely, even when they are far apart, so that they will eventually get close enough for exact coalescence to occur.
It turns out that both single-component and multi-dimensional random-grid Metropolis methods do have such a tendency for distant chains to move closer together. Unfortunately, this tendency is lost once the chains are fairly close, so exact coalescence can be quite delayed. In the next two sections, I analyse this situation for the case of sampling from a multivariate normal distribution, and demonstrate how well the methods work for a nine-dimensional example. These results provide insight into how to do better by combining random-grid Metropolis with other updates, as discussed in Section 4, but impatient readers may skip to Section 4 immediately without serious loss of continuity.
3.4 Analysis of random-grid Metropolis for multivariate normals
It is possible to see that random-grid Metropolis will indeed tend to bring two coupled chains closer together in the simple case of sampling from a multivariate normal distribution. In analysing this situation, I will assume that times when one of the two chains accepts its proposal and the other rejects are fairly rare, and that consequently, when this does occur, it is usually from states that were produced by both chains accepting a proposal simultaneously. If components are updated one at a time, the assumption is that updates in which one chain accepts a change to a component and the other rejects are from a state in which the last change to that particular component was an update in which both chains accepted. Note that this assumption will certainly hold if the acceptance rate is quite high, as it will be if is chosen to be small.
Under this assumption, we need consider only the following four possibilities for how the two chains are updated:
-
1.
Both chains accept their proposals, starting from states that are the result of both chains accepting the previous proposal (for the whole state, or for the component currently being updated).
-
2.
Both chains reject their proposals.
-
3.
One chain accepts its proposal, but the other rejects, starting from states that are the result of both chains accepting.
-
4.
Both chains accept their proposals, starting from states resulting from one chain accepting and the other rejecting.
Let the states of the two chains be and , with components and , for . Let the vector of differences in components be . After an update for component in which both chains accepted, , will be a multiple of , since the points accepted by the chains were on a grid with this spacing. Because of this, when this component is next updated, the amount by which it is altered in the proposal will be the same for both chains, because the offsets of the nearest grid point from the current states will be identical when the current states are themselves on a grid with the same spacing. If both chains accept this proposal, will be unchanged. Hence updates of type (1) above do not change the distance between the chains.
Updates of type (2) obviously do not change the distance between chains.
Updates of type (4) can change the distance between chains, either increasing or decreasing , but the expected value of after such an update, averaging over the random grid placement, is the same as the previous value of . To see this, write , with an integer and . One can easily see that if both chains accept, then with probability , the distance between the new states will be and with probability this distance will be , giving an expected distance of . These updates will therefore have no systematic tendency to move the chains together or apart, even though the eventual exact coalescence of the chains will occur with a type (4) update.
It is the effect of updates of type (3) that is crucial. Since these updates start with states for which each is a multiple of , as for type (1) updates, the changes proposed for each component, , will be the same for both chains. (Note that if one component is being updated at a time, will be zero for all except the component currently being updated.) The acceptance probability for a proposal to change by can be written as
| (14) |
Here, , where is the covariance of the multivariate normal distribution being sampled (the mean is assumed, without loss of generality, to be zero). We have that
| (15) |
For a chain with state to accept the update while a chain with state rejects, it must be that , from which it follows that
| (16) |
The quantity on the left can be interpreted as an inner product, using the metric defined by the positive-definite matrix . That this inner product is negative indicates that an infinitesimal change to in the direction of would reduce the squared distance between and , as measured by . When the chain with state accepts (while the other rejects), its state changes by the finite amount , and though this change is in the right direction, it may overshoot. The actual change in the squared distance will be
| (17) |
When the chains are far apart, and hence is large, the first term in (17), which is negative, will likely dominate, but once the chains are close together, exact coalescence will be delayed by the effect of the second term, which is always positive.
The rate at which distant chains approach each other can be found by considering the probability of one chain accepting and the other rejecting. If the chains’ states are and , this probability is . (Recall that the acceptance decisions are linked by use of the same value for .) Changes by and are equally likely to be proposed, so we can average over these two possibilities, while keeping fixed apart from this overall sign flip. Suppose that is large compared to , and also that the acceptance rate is high, so that the exponential in equation (14) can be approximated linearly. We can then consider the three cases of such proposals leading to an increase in for both chains, a decrease for both chains, or an increase for one and a decrease for the other, obtaining
| (18) |
Multiplying this by the change in squared distance when one chain does accept while the other rejects (from (17), ignoring the second term), we find that the expected decrease in squared distance (in the metric defined by ) is approximately
| (19) |
The expectation of is , where for multi-dimensional random-grid updates, and for a random-grid update of a single component chosen randomly. Achieving a given acceptance rate generally requires a value of for multi-dimensional updates that is a factor of smaller than for single-component updates (Roberts, et al. 1997), so can be considered to be the same when comparing the two types of updates. The expected decrease in squared distance averaging over the distribution of can now be found as
| (20) |
Let the eigenvectors of be , normalized to unit length, and let the corresponding eigenvalues be . The eigenvectors of will be the same, with its eigenvalues being . By expressing in this eigenvector basis, as , we can write the expected relative change in the squared distance resulting from an update as
| (21) |
The relative change in squared distance will therefore be somewhere between a maximum of and a minimum of , depending on the values of the . If the differ substantially, one would expect that chains started with random and would approach rapidly initially, but more slowly later, once the chains are close together in the direction.
Unfortunately, once the chains are close enough that the second term of (17) is substantial, the tendency for them to approach closer will be largely lost. Exact coalescence will then occur only when the chains come together by chance.
We can try to find roughly when the chains cease to systematically approach by equating the expected decrease in the squared distance due to the first term in (17), which is given by (20), with the expected increase due to the second term in (17), which is
| (22) |
Finding the value of this exactly seems hard, but we can use it to find how the distance of from at the time when the chains stop approaching scales with (which as defined above is proportional to ). Let be the squared magnitude of , and assume that the direction of at the relevant time is independent of , as should be true for sufficiently small values of . We can then see that the expected increase in distance from (22) is proportional to , while the expected decrease in distance from (20) is proportional to . From this, one can see that the squared distance at which the chains cease to systematically approach each other should be proportional to ; hence the distance at which the chains cease to approach each other is proportional to .
3.5 Demonstration of random-grid Metropolis for a multivariate normal
The behaviour analysed in the previous section will be demonstrated here using a nine-dimensional normal distribution for . The means of these variables are all zero. Variables have standard deviation 0.1, and are independent of each other and of the other variables. Variables have standard deviation one, and have correlation with each other. This correlation is close to the value of at which the covariance matrix would become singular. The eigenvalues of for this distribution are , for , and for .


Multi-dimensional random-grid Metropolis updates and single-component random-grid Metropolis updates (of a component selected at random) were both tried. To begin, we can look at the results using quite small stepsizes of for the multi-dimensional updates and for the single-component updates. Both stepsizes result in ; the rejection rate is about 4.5%. With such small stepsizes, the assumptions of the analysis in the previous section should be satisfied.
Figure 7 shows simulations of two coupled chains with these stepsizes, starting from initial states of and . The plots show the values of the log of the squared distance of the two chains, given by , at every tenth iteration, up to iteration 8000. The way the distance declines matches the predictions of the analysis in the previous section. Initially, the reduction in the log of the squared distance averages about each iteration, as expected if the reduction is dominated by to , which all have the value 100, only a bit less than the value of for . After about 2000 iterations, the rate of decline changes, as expected, to about .
With larger stepsizes of for multi-dimensional updates and for single-component updates, the chains approach each other faster, as shown in Figure 8. For these stepsizes, , and the rejection rate is about 18%. The rates of decline in squared distance are mostly consistent with the analysis of Section 3.4, but with these larger stepsizes, the initial rate of decline is lowered, because the probability of one chain accepting when the other rejects saturates at one. Also, random increases in distance are apparent fairly early on.


Longer runs show that after the initial approach, the distance between the two chains reaches a quasi-stable random distribution, until such time as the chains happen to coalesce by chance. This is seen for the smaller stepsizes in Figure 9, and for the larger stepsizes in Figure 10. The analysis of Section 3.4 suggests that the smaller stepsizes should produce smaller values of the squared distance during this random phase, in proportion to the values of . Here, the log of the ratio of values is , which does seem to be roughly the difference in the upper end of the values seen in Figures 9 and 10.
Figure 10 also includes a plot of the first component of state for the chains using single-component updates, which indicates that these chains move around the distribution in less time than it takes for them to coalesce. One would hope to find coupling schemes that do better than this. Coalescence using multi-dimensional updates is even slower (with the same value for ), a phenomenon that was confirmed with further runs (though there is considerable variability in coalescence times for both methods). The faster coalescence when using single-component updates appears to be due to the independence of , , and from the each other and from the other components. Because of this independence, once one of these components becomes the same for the two chains, it will remain the same thereafter, if all updates are made to single components, since differing values for the other components will not affect its conditional distribution. In the run shown on the upper left of Figure 10, , , and all coalesce by iteration 110, leaving a six-dimensional rather than a nine-dimensional problem. This also explains why the upper end of the quasi-stable distribution for distance is lower for single-component updates than for multi-dimensional updates.
However, for much larger values of the stepsize, , multi-dimensional updates work better. For example, with , performance is comparable to that seen in Figure 10 for single-component updates. With this value for , the acceptance rate is very low (about 0.7%), but the increased chances of coalescence when proposals are accepted compensates. In problems with many more than the nine dimensions of this example, however, a correspondingly large value for would likely lead to an extremely small acceptance rate, so such a large-stepsize strategy cannot be expected to work in general.
4 Schemes that combine random-grid and other updates
Although coupled chains that use random-grid Metropolis updates are capable of coalescencing exactly, we can see from Figures 9 and 10 that the random-grid method is not very efficient at producing exact coalescence of chains that have approached closely. This reflects a deficiency in the coupling scheme, since these chains move to a nearly independent point in less time than that required for them to coalesce exactly. Furthermore, even if they could be coupled more effectively, random-grid Metropolis updates will not always be the best way of sampling from the distribution of interest.
In this section, I explore a general strategy for combining random-grid Metropolis updates with other types of updates to produce Markov chains that sample efficiently and that are coupled so as to produce exact coalescence in a time similar to that needed to move to a nearly independent point. I then discuss how well this strategy works with standard Metropolis, Langevin, and Gibbs sampling updates.
4.1 The general strategy
The strategy that will be used for practical applications of circular coupling consists of alternately performing two sorts of updates:
-
1.
An update, or series of updates, that is designed to efficiently sample from the desired distribution, and that is coupled so as to cause chains to approach closer and closer.
-
2.
A random-grid Metropolis update, which can lead to exact coalesce of chains that are already close together.
The coupling scheme used for the updates in step (1) may not be capable of achieving exact coalescence, but if these updates have brought the chains close together, the random-grid update in step (2) will have a good chance of bringing them together exactly.
A wide variety of Markov chain updates could be used in step (1). Mostly crucially, all such updates must be implemented in a way that ensures that the same number of pseudo-random variates are generated for an update regardless of the state of the chain — if this is not so, all subsequent updates will use different pseudo-random numbers in different chains, destroying any possibility of coalescence. Beyond this, it is desirable for the updates in step (1) to bring the coupled chains closer together, though it is not essential that this occur for every pair of states that the chains might be in, as long as it occurs sufficiently often that there is a good chance that the chains will be brought close enough together that the random-grid update of step (2) has a good chance of producing exact coalescence.
In step (2), it is probably best to perform only a single random-grid update for each component. If the proposal in a random-grid update is accepted by both chains, but fails to bring them together, a second random-grid update using the same value of will certainly not do so, since the states will differ by or more in at least one component, too far for them to coalesce in a single additional update that uses the same value for . If an initial random-grid update is rejected by one or both chains, a second update might produce coalescence, but this possibility must be balanced against the tendency of random-grid updates to move chains that have been brought close together further apart.
There are two ways of performing a random-grid update of each component — by doing a single multi-dimensional random-grid update, or by doing single-component random-grid updates for each component in turn. The following rough analysis indicates that for high-dimensional problems a single multi-dimensional update is the better choice.
Suppose that the components of the state in the two chains differ by , where is the dimensionality. Then the probability of a randomly-placed grid with spacing leading to proposals in the two chains with the same value for some particular component is
| (25) |
The probability that the proposals have the same values for all components, and hence would produce exact coalescence if accepted, is therefore
| (28) |
If the are much smaller than , this can be approximated by
| (29) |
To obtain the probability of exact coalescence, we must multiply by the probability that both chains accept a single multi-dimensional random-grid update, or by the product of the acceptance probabilities for all the single-component random-grid updates. (I’ll assume, as seems reasonable, that acceptance is nearly independent of whether the proposals would lead to coalescence if accepted.) The value of affects the acceptance probability and proposal coalescence probability oppositely, necessitating a trade-off.
For acceptance probabilities not far from one, the log of the acceptance probability for a single-component update will typically be roughly , for some constant , and the log of the probability that the updates to all components will be accepted will be . The optimal choice for with single-component updates maximizes the log of the probability of actual coalescence, which is
| (30) |
The maximum occurs at , where . We would like to have magnitude of order one, in which case we must have , and . Note that with this scaling for , the probability that the proposals for all components will be accepted will remaining of order one as increases.
In contrast, for a multi-dimensional update, the log of the acceptance probability will be roughly (Roberts, et al. 1997). The optimal will maximize
| (31) |
The maximum occurs at , where . For the magnitude of to be of order one, we must have , and . Note that with this scaling for , the acceptance probability will remain of order one as increases.
We can conclude that when is large, multi-dimensional random-grid updates will be preferred to single-component updates in step (2), since they will have a good chance of producing exact coalescence with a larger value for , which will be easier to achieve in step (1). Exceptions to this may occur when some components of state are independent of others, in which case exclusive use of single-component updates in both steps (1) and (2) can result in these components coalescing independently, invalidating the assumption above that coalescence requires that a single proposal or sequence of proposals lead to coalescence of all components simultaneously, starting from a state in which none of the components had coalesced.
It would be possible to use random-grid Metropolis updates in both step (1) and step (2), likely with different values for . There would then be at least a small chance of exact coalescence occurring in step (1). I will not examine this possibility here, however, since using more general updates for step (1) provides greater flexibility when chosing an efficient sampling scheme for the distribution of interest.
In the sections below, I consider the use in step (1) of standard random-walk Metropolis updates, Langevin updates, and Gibbs sampling updates. I first investigate in some detail how well standard Metropolis updates work, because this method is well-known and widely-used. It will turn out, however, that although standard Metropolis updates can be used in this coupling scheme, they are rather inefficient, and difficult to tune. Some readers may therefore wish to skip immediately to Section 4.3, where Langevin updates are shown to work much better.
4.2 Coupled Metropolis updates
Standard random-walk Metropolis updates use a symmetrical proposal distribution centred on the current state. Such a proposal distribution can be viewed as adding a random offset to the state, and updates based on these proposals can be coupled by simply using the same random offset in different chains, as well as using the same random number to make the acceptance decision. The uniform proposal of equation (3), coupled as in equation (6), is one example, which can be generalized to multi-dimensional proposals. It is also common for the offset of the proposed state to come from a zero-mean normal distribution. For multi-dimensional updates, the covariance matrix for such proposals is often diagonal, since obtaining detailed information about the distribution that would allow a better choice may be difficult, or the dimensionality may so large as to make general matrix operations costly.
The analysis of standard random-walk Metropolis updates coupled by using the same offsets in different chains is similar to that for random-grid Metropolis updates, presented in Section 3.4, for sampling from multivariate normal distributions. The analysis of standard Metropolis updates is simpler, however, since the complication of the four types of random-grid updates is absent. Instead, the offset of the proposed state from the current state will always be the same in all chains, and we can analyse all updates in the same way as type (3) random-grid updates were analysed.
If variables are updated one at a time, at random, using a normal proposal distribution with standard deviation , the expected squared change to a coordinate will be , where is the number of dimensions. Multi-dimensional updates using a proposal distribution with covariance matrix will of course give .
Figures 11 and 12 illustrate that chains using standard Metropolis updates approach each other in the same way as chains using random-grid Metropolis updates, for the nine-dimensional normal distribution described in Section 3.5. The right plot in Figure 11 shows the results that are obtained when updating single components chosen at random with a normal proposal distribution for which ; the plot on the left shows the results obtained using multi-dimensional updates with a spherical normal proposal distribution for which . In both cases, , the same as in Figure 9. Larger stepsizes of and , giving , were used in Figure 12, corresponding to the random-grid results in Figure 10. The rejection rates of the standard Metropolis methods were similar to those of the corresponding random-grid methods.


The behaviour seen with these standard Metropolis updates is both qualitatively and quantitatively similar to that seen with random-grid Metropolis updates. An exception visible in the figures is that when using standard multi-dimensional Metropolis updates, the distance at which random increases in distance between chains begin to occur is less than for the corresponding runs with random-grid Metropolis updates.
A fundamental difference is that chains coupled using random-grid updates eventually coalesce exactly. In contrast, it is easy to see that when two chains using standard Metropolis updates with a continuous proposal distribution are coupled by using the same offsets, the probability of exact coalescence after any finite number of iterations is zero, since it can occur only if the random proposal offset exactly matches the difference between the states of the two chains (and one then accepts while the other rejects).
For this nine-dimensional example, the distance between coupled chains using standard Metropolis updates appears to converge to a non-degenerate stationary distribution. In one dimension, however, coupled chains spend ever-increasing amounts of time at ever-smaller distances. This is illustrated in Figure 13, which shows two chains sampling from a standard univariate normal distribution. In dimensions, the probability that a standard Metropolis update will result in two chains that were moderately close approaching to a small distance between and will be proportional to , based on the volume of a shell of this radius. Once there, these two chains will remain at that distance until one accepts at the same time as the other rejects. The probability of this happening when sampling from a normal distribution is proportional to , so the expected time spent at this distance before jumping back to a moderate distance will be proportional to . The fraction of time spent at a distance between and will therefore be proportional to , which is when . Since the integral of diverges in the vicinity of zero, an ever-increasing amount of time will be spent with the chains in ever-closer states. This will not happen for , however, unless the problem is essentially one-dimensional, due to the components being independent, with single-component updates being used. The phenomenon is probably of no practical help in achieving exact coalescence even in one dimension.

Instead, we can follow the two-step strategy outlined in Section 4.1, combining standard Metropolis updates designed to bring chains close together (step (1)) with a random-grid Metropolis update designed to produce exact coalescence once the chains are close (step (2)). As discussed in that section, exact coalescence can occur in step (2) only if the separation of the two chains for all components is less than , where is the parameter of the random-grid update. Exact coalescence will occur with reasonably high probability only if in addition the average separation, , is small enough that a coalescent proposal is likely, and if the probability of accepting this proposal is both chains is fairly high.


Chains can be brought close together more efficiently in step (1) if the stepsize () in the standard Metropolis updates is varied, starting with a large value that quickly brings the chains fairly close together, then switching to a smaller value to bring them somewhat closer, and so forth, until they are close enough for exact coalescence to be likely in step (2). This is illustrated in Figure 14, for the nine-dimensional normal distribution described in Section 3.5, using standard multi-dimensional Metropolis updates. The starting states were the result of many multi-dimensional Metropolis updates using the fairly large stepsize of . By switching to successively smaller values for , starting with , the squared distance between the chains is reduced in 170000 iterations to a level that would have taken over twice as many iterations if the smallest value for had been used from the beginning. The pattern of decline followed by random movement seen in the upper plots in Figure 14 illustrates that switching to smaller values of is a generally desirable strategy, though the optimal time to switch is not obvious.
If, as in Figure 14, each stage uses a stepsize, , that is a factor of two smaller than in the previous stage, we can expect each stage to reduce the log of the squared distance by before random increases in distance again become a large factor. Since the rate of decline in the log of the squared distance is proportional to , accomplishing this will take four times as many iterations as were needed in the previous stage.
We can determine the effort needed to reach a given distance by methods similar to this as follows. Suppose we go through stages indexed by , using stepsizes in each stage of , starting with states a distance apart. The minimum squared distance, , achievable in stage before random effects become large will be proportional to , giving or . The rate of decline in will be proportional to , giving a rate in stage of . The number of iterations that must be spent in stage in order to reduce by will therefore be . The total number of iterations up to the completion of stage will be
| (32) |
To achieve some desired squared distance, , will require stages, which will take a total number of iterations of
| (33) |
This becomes smaller as approaches zero, corresponding to changing more and more frequently. The limiting value as is
| (34) |
Hence, to bring the chains close together will require time that is inversely proportional to the square of the desired distance, if the optimal strategy of varying is used. If instead we use the single stepsize of , achieving a squared distance of will require reducing by . The number of iterations required for this will be
| (35) |
Comparing with equation (34), we see that varying is advantageous, though the benefit is not huge.


Acceptance rates:
More directly relevant than the squared distance is the maximum separation of states in any coordinate direction, since coalescence from a random-grid update is not possible if this is greater than . This maximum separation was investigated using nine runs like the one shown at the bottom of Figure 14. Once the distance between the chains becomes small, the maximum separation was found to be roughly proportional to the distance. The maximum separation of coordinates during the nine runs is plotted on the left in Figure 15. On the right in Figure 15 is the probability that a multi-dimensional random-grid proposal, or sequence of single-component proposals, would result in the proposed new states in both chains being the same, for three values of , found using equation (28), and the distribution of component separations seen in the nine runs.
To find the optimal value for , we must also account for the probability that a random-grid update that would lead to coalescence if accepted by both chains actually is accepted by both. Once the chains are close, acceptance in one chain should usually coincide with acceptance in the other, and acceptance should be nearly independent of whether the proposals in the two chains would lead to coalescence. With these assumptions, the probability of the chains coalescing is the product of the probability of a coalescent proposal and the acceptance rate. The reciprocal of this is the expected number of tries before coalescence occurs. This is plotted for three values of on the left in Figure 16, using the proposal coalescence probabilities from the plot on the right of Figure 15, and acceptance rates obtained empirically, and shown in the figure. Multiplying the expected number of tries by the number of standard Metropolis iterations required in step (1) for each try gives a measure of the computational cost for achieving coalescence, plotted on the right of Figure 16.
I tested these predictions by running the basic circularly-coupled simulation procedure of Section 2.1, with Markov chain transitions, each consisting of steps (1) and (2) of the procedure of Section 4.1. Step (1) consisted of standard multi-dimensional Metropolis iterations with varying , as in the run shown in the bottom of Figure 14. Step (2) consisted of one multi-dimensional random-grid update. For each of the values of considered in Figures 15 and 16, nine runs were done, all starting from the state , and the number of iterations before the wrapped-around chain coalesced with the original chain was recorded. Runs were also done in which step (1) consisted of only standard Metropolis updates, corresponding to stopping after the updates with . Finally, runs were done with standard multi-dimensional Metropolis iterations followed by one sequence of single-component random-grid updates.
| multi-dimen. random grid | multi-dimen. random grid | single-comp. random grid | ||||||||||
| 170000 iterations | 42000 iterations | 170000 iterations | ||||||||||
| 8 | (5, | 16) | 9 | 34 | (21, | 66) | 41 | 12 | (7, | 23) | 19 | |
| 7 | (4, | 13) | 9 | 15 | (9, | 28) | 17 | 38 | (23, | 77) [1] | 31 | |
| 18 | (11, | 34) | 35 | 73 | (42, | 168) [3] | 48 | 841 | (281, | 16396) [8] | 572 | |
The results are shown in Table 1. The coalescence times — ie, the number of random-grid updates before coalescence, each preceded by a series of standard Metropolis updates — were modeled as being exponentially distributed, censored at 100 (the length of a run). The mean coalescence time was given an improper prior with density proportional to the reciprocal of the mean. The table shows the posterior mean (equal to the sample mean if all runs coalesced before 100 iterations), along with a 90% posterior interval. This is followed by the theoretical prediction for the mean coalescence time, as shown in Figure 16, or computed in an analogous manner for the single-component random grid updates. (The probability of the single-component random-grid proposals all being accepted was found empirically to be 26%, 6.7%, and 0.25% for , , and .)
There are no apparent conflicts between the observations and the theory, showing that the various assumptions made hold at least approximately for this problem.
The overall conclusion I reach from this investigation is that although standard Metropolis updates can be used to achieve coalescence in a circularly-coupled simulation, doing so is rather laborious, both in the amount of computer time required and in the amount of human time needed to find an appropriate schedule of changes to and an appropriate choice of . One should note that much of the time needed to achieve coalescence is spent doing updates with stepsizes that are sub-optimally small from the point of view of moving efficiently around the distribution. Furthermore, as discussed in Section 4.1, in high-dimensional problems, the distance between chains will need to be made quite small in step (1) if step (2) is to have a good chance of producing exact coalescence. Achieving this with standard Metropolis updates is possible, using the strategy of varying , but the scaling of the time needed for the chains to approach within a given distance, given by equation (34), is rather poor. Fortunately, there are other Markov chain sampling methods that can be coupled much more effectively.
4.3 Coupled Langevin updates
Langevin methods are applicable to distributions on continuous state spaces for which the gradient of the probability density can be computed. Defining , an uncorrected Langevin update changes the current state, , to the next state computed as follows:
| (36) |
where is a standard normal random variate, and is an adjustable stepsize parameter. The stationary distribution of this Markov chain is not exactly , but it approaches as approaches zero. (Smaller values of will of course require longer runs.)
The corrected Langevin procedure, introduced by Rossky, Doll, and Friedman (1978), produces the exactly correct stationary distribution for any stepsize, , by treating the right side of equation (36) as a Metropolis-Hastings proposal, which is accepted or rejected based on ratios of probability densities and of proposal densities (Hastings 1970). The corrected Langevin algorithm can also be seen a special case of more general algorithms based on the “leapfrog” discretization of Hamiltonian dynamics (Duane, et al 1987; Neal 1996a, Section 3.1). In this formulation, we introduce a “momentum” vector, , of the same dimension as , and define . We then simulate a Markov chain that samples from the distribution for with density proportional to , whose marginal distribution with respect to is .
One iteration of this formulation of the Langevin method changes the state, , as follows:
-
1.
Replace with an independent draw from the normal distribution with mean zero and covariance .
-
2.
Set
-
3.
Set
-
4.
Set
-
5.
Accept as the new state with probability . Otherwise, keep unchanged but negate .
Step (1) and steps (2) to (5) can separately be shown to leave invariant the distribution with density proportional to . The combination therefore leaves this distribution invariant as well. For good performance, should be chosen to be small enough that step (5) usually accepts, but not much smaller than is necessary to achieve this.
To couple Langevin updates in two chains, we need only use the same random normal vector in step (1), and the same random number for the acceptance decision in step (5). This method is quite effective. Figure 17 shows the result of using it to sample from the nine-dimensional normal distribution described in Section 3.5. The distance between states in the two chains declines exponentially fast, reaching quite a small value in the same time as is needed for one of the chains to reach a point nearly independent of its initial state.

The good coupling behaviour of Langevin updates for multivariate normal distributions is easily explicable. For a zero-mean normal distribution with covariance , the uncorrected update of equation (36) is
| (37) |
The separation between two chains, and , will therefore change as follows:
| (38) |
If the eigenvalues of are , the eigenvalues of will be . These eigenvalues will all have absolute value less than one if is less than , where is the largest eigenvalue of . Coupled uncorrected Langevin chains will therefore approach each other rapidly as long as is chosen to be somewhat smaller than this. For the corrected Langevin method, this good coupling behaviour might be disturbed by rejections that occur in one chain but not the other. If the rejection rate is low, however, this will not be a problem. The example above used a stepsize of , substantially less than . The rejection rate was 14%.
More generally, Langevin updates couple well when applied to any distribution over for which the log of the density function is strictly concave. Consider first a univariate distribution of this sort. Suppose the current states of two coupled chains sampling from this distribution are and , and suppose without loss of generality that . The log-concavity of the density then guarantees that , from which it follows that, for an uncorrected Langevin update,
| (39) |
It is possible for this update to overshoot, with being negative, and possibly being greater than . However, if the density is smooth, and is sufficiently small, will be well-approximated by a quadratic function in the vicinity of and when these points are close together. The chains will then tend to approach for the same reason as they do when sampling from a normal distribution, as discussed above. Corrected Langevin updates will also tend to produce good coupling as long as is small enough that the rejection rate is low.
This argument extends to multivariate log-concave distributions as long as the stepsize, , is small. To see this, consider the line passing through the current states of the two chains, and . The probability density along this line will be log-concave if the joint density is log-concave. If the Langevin update moved only along this line, according to the projections on it of and , the argument above would show that the distance between the states of the two chains would decrease. Generally, of course, the states will also move in directions orthogonal to this line. However, to first order, small movements in these orthogonal directions do not change the distance between and . The states of the chain will therefore tend to approach each other when is sufficiently small.
The states of two coupled Langevin chains need not always approach each other when the distribution is not log concave. However, we might nevertheless hope that reasonably good coupling behaviour will result as long as the chains spend enough time in regions of the state space where the density is log concave. Further investigation is needed to understand when this is actually true.
The efficiency of Langevin sampling can usually be improved by modifying step (1) of the procedure shown above as follows (Horowitz 1991; Neal 1996a, Section 3.5.3):
-
1b.
Change to , where is an independent draw from the normal distribution with mean zero and covariance .
Setting to zero produces the standard Langevin method. When a value for close to one is used, the chain tends to proceed in approximately the same direction for many iterations (provided the rejection rate is small). This “persistent” form of the Langevin method suppresses the random walk behaviour of standard Langevin updates, thereby improving the efficiency with which the space is explored.
Figure 18 shows the performance of Langevin with persistence on the nine-dimensional multivariate normal distribution, using and . This value for suppresses random walks for roughly 20 iterations, until the momentum has been largely randomized by the updates of step (1b). A smaller stepsize was used here than for the standard Langevin updates so that the rejection rate would be small, avoiding the undesirable reversals of direction that occur when the proposed state is rejected in step (5). The plot on the left clearly shows that the persistent form of Langevin samples more efficiently than standard Langevin (compare with the left plot in Figure 17). Furthermore, the states of the coupled chains approach each other very closely, in time comparable to that needed for one of the chains to move to a roughly independent point.

4.4 Coupled Gibbs sampling updates
Gibbs sampling updates can be effectively coupled when random variates from the successive full conditional distributions are generated by inversion of the cumulative distribution function, or by a procedure with an equivalent coupling effect. This method has used by Johnson (1996) and by Pinto and Neal (2001).
In detail, we implement Gibbs sampling for the th component by replacing by
where is a random variate uniformly distributed on , and is the inverse of the cumulative distribution function for the conditional distribution of given the current values of the other components. This method for generating random variates with a given distribution is efficient for a few distributions (eg, the exponential and the Cauchy), but it would not be the preferred method for most distributions if coupling were not an issue. Fortunately, if the conditional distributions for different chains differ only by translation and scaling, as will be the case when sampling from a multivariate normal, an equivalent coupling effect can be obtained by transforming a random variate with location parameter zero and scale parameter one, generated by any convenient method, to the appropriate location and scale in each chain.
Figure 19 demonstrates the effectiveness of this coupling method for the example nine-dimensional normal distribution. Pinto and Neal (2001) found that this coupling scheme is also very effective for some non-normal distributions. Unfortunately, although the adaptive rejection sampling method of Gilks and Wild (1992) allows Gibbs sampling to be done for any log-concave distribution, it is not easy to see how to modify adaptive rejection sampling to produce good coupling. This limits the contexts in which coupled Gibbs sampling is possible.

5 A logistic regression example
To see whether circular coupling works in practice for typical Bayesian inference problems of moderate complexity, I have tested it using simulated data for a polytomous logistic regression model with a hierarchical prior.
The problem concerns four real-valued predictor variables and one three-way class variable, taking values of 1, 2, or 3. The conditional probability of the class variable in case , written , given the predictor variables, , is modeled as follows:
| (40) |
where
| (41) |
The model parameters are redundant, since adding a constant to for all does not change the probabilities of the . This redundancy is retained in order to permit easy specification of a prior that is symmetric with respect to the three classes. A hierarchical prior is used, in which the prior distribution of the depends on hyperparameters associated with the predictor variables, whose prior distribution is in turn controlled by a top-level hyperparameter, . The prior specifications are as follows (with the only dependencies present being those explicitly shown):
| (42) | |||||
| (43) | |||||
| (44) | |||||
| (45) |
A data set of size 150 was simulated in which the four predictor variables had a multivariate normal distribution, each with mean zero, variance 2, and correlation 1/2 with each of the other three predictor variables. The class variable was simulated using the values chosen for the predictor variables along with the following values for the parameters:
| (49) |
Notice that the last two predictor variables have no effect on the distribution of the class variable. The first two predictor variables and the class are plotted for the 150 simulated cases in the top left of Figure 20.

I sampled from the posterior distribution for this model and data set using a hybrid strategy. With the hyperparameters temporarily fixed, the parameters, , were updated using the Langevin method with persistence, along with occasional random-grid Metropolis updates. The top-level hyperparameter, , was updated using random-grid Metropolis alone. The lower-level hyperparameters, , were updated by Gibbs sampling alone. Random-grid updates were not needed to produce exact coalescence for these hyperparameters because conditional on and the , the are independent of each other, and hence will coalesce exactly with one Gibbs sampling update once and the have coalesced exactly.
In detail, one complete iteration of the Markov chain consisted of the following updates:
-
1)
10 repetitions of the following:
-
a)
10 Langevin updates with stepsize and with persistence .
-
b)
25 random-grid Metropolis updates for , using a proposal with .
-
c)
One Gibbs sampling update for each of the .
-
a)
-
2)
A random-grid Metropolis update for all the simultaneously, using a proposal with .
-
3)
A random-grid Metropolis update for , using a proposal with .
-
4)
One Gibbs sampling update for each of the .
-
5)
A replacement of the momentum variables by values drawn independently from the standard normal distribution.
The parallel simulation algorithm of Section 2.4 with and was applied, although only one physical processor was used. Ten initial states were sampled from the prior distribution to begin each of the ten segments of the simulation. Each segment continued from this initial state for ten iterations of the above steps. Each segment was then restarted from the final state of the preceding segment, and re-simulated until it coalesced with the previously simulated chain, or the ten iterations were completed. This re-simulation was performed again whenever the start state of the segment changed.
Coalescence was reasonably quick. In the first re-simulation stage, one of the ten segments coalesced with the previous simulation after 9 iterations; the others continued until all ten iterations were done. In the second re-simulation stage (involving only nine segments, since one segment’s start state was unchanged), six of the segments coalesced with the previous simulation (after 1, 1, 1, 5, 9, and 9 iterations). The third re-simulation stage involved only three segments, which all coalesced (after 1, 6, and 6 iterations), completing the process. A total of 268 iterations were simulated, requiring 16 seconds of computation time on a 1.7 GHz Pentium 4 processor.
Simulation traces for the relevant differences in the parameter values are shown in Figure 20, for the 100 states of the final wrapped-around chain (the state at time 0 is omitted, since it is identical to the state at time 100). The left plot in Figure 21 shows a similar trace of the four lower-level hyperparameters. Note that the hyperparameters controlling the magnitudes of the parameters for the two irrelevant inputs have taken on values that shrink the distribution of the regression coefficients for these variables to be close to zero.

Finally, the right plot in Figure 21 shows a trace of the top-level hyperparameter for the wrapped-around chain, along with traces starting at the ten initial states, showing that the chains started from these states coalesce rapidly with the wrapped-around chain. This rapid coalescence from a variety of starting states provided evidence (though not a certain guarantee) that the assumptions required for the states of the wrapped-around chain to have close to the desired distribution are satisfied.
6 Discussion
The circular coupling procedure has been shown here to produce states with approximately the correct distribution provided certain conditions regarding coalescence times are satisfied. In practice, we will usually not know with certainty whether these conditions hold, but diagnostic tests can provide useful evidence of this.
If we did have a theoretical proof that the required conditions hold, the benefits of circular coupling would be modest. These conditions would also suffice to show that the distribution of the last state of an ordinary Markov chain simulation for time steps comes from close to the equilibrium distribution of the chain. We could therefore obtain a sample of (dependent) points from approximately the correct distribution by simply continuing the simulation of this chain for another iterations. The circular coupling procedure would save at most a factor of two in computation time compared to this alternative, less if coalescence of the wrapped-around chain did not occur quickly.
The primary reason why circular coupling is of interest is that it may provide a way of diagnosing convergence and of discarding a “burn-in” period that is more automatic than current methods, allowing Markov chain Monte Carlo methods to be used on a more routine basis.
We can compare circular coupling with two contrasting strategies for Markov chain Monte Carlo that have been advocated by Geyer (1992) and by Gelman and Rubin (1992). Geyer favours simulating a single chain for as long as possible, in order to maximize the chances that this time is long enough for a good approximation to the equilibrium distribution to be reached. Gelman and Rubin advocate that the available time be used instead to simulate a moderate number of chains, which consequently are each run for a shorter time, using starting states chosen from an “overdispersed” distribution. This allows one to recognize that there is a problem if chains started in different states behave differently.
The benefits of both of these schemes are obtained using a single, long circularly-coupled chain, together with a moderate number of auxiliary diagnostic chains, whose starting points are chosen from an overdispersed distribution. There is no need to perform more than one circularly-coupled simulation, provided the auxiliary diagnostic chains are found to coalesce in much less time than the length of the run. Since the auxiliary chains are started from independent points, and each uses initially a different segment of the random number sequence, they provide independent checks on the convergence of the chain, just as completely separate simulations would.
The strategy of using a single circularly-coupled run has the disadvantage that the time required is not completely predictable, since the coalescence time is not known in advance. If coalescence is rapid, the run may finish in less than the time available, and one might wish to use the remaining time to simulate further states, in order to obtain more accurate estimates. On the other hand, if coalescence turns out to be slow, a longer run may be necessary in order to be sure that the correct distribution has been reached. It should be possible to extend a circularly-coupled simulation run to a greater length, redoing only the very beginning, where the wrapped-around starting state will change once the chain is run for longer. Further work is needed to work out the details of such a procedure, and to investigate whether letting the run vary in length might introduce bias.
Another advantage of diagnosing convergence based on coupling is that it looks at the entire state. Informal convergence diagnostics are usually based instead on a small number of low-dimensional functions of state. Other methods for diagnosing convergence based on the whole state, such as that of Ritter and Tanner (1992), are likely to break down when the state is of high dimension. In contrast, at least in some cases, such as sampling from a multivariate normal using the Langevin method (see Section 4.3), circular coupling can work well even for a very high dimensional distribution.
Assuming that we have determined to our satisfaction that the chain has converged, we still have the problem of discarding an initial “burn-in” segment. Wrapping the chain around to produce a circularly-coupled chain solves this problem without introducing any substantial bias, under the assumptions of the theorem in Section 2.2, whereas other methods for deciding how much of the chain to discard can introduce bias into the final result, as discussed by Cowles, et al (1999).
A further minor advantage of circular coupling is that assessing the accuracy of estimates by accounting for the autocorrelation along the chain is slightly easier when the chain is circular, because time series techniques work more cleanly with circular time series than with time series having ends. For instance, the need to “taper” the ends when doing spectral analysis is eliminated.
The ability of circular coupling to exploit parallel computation may also be useful in practice. The parallel procedure of Section 2.4 can be routinely applied whenever circular coupling can be done at all. If one is simulating a single, long circular chain, the only other possibility for exploiting parallelism would be within the computations needed to perform the individual transitions. Though there will typically be much scope for this, it does require special programming for the particular chain being simulated.
To obtain these benefits, effective coupling schemes will need to be developed, which can be applied to a wide range of distributions with little or no need for problem-specific tailoring. The strategy of combining Langevin and Gibbs sampling updates with random-grid Metropolis updates has been shown here to work well for a non-trivial Bayesian inference problem, but further theoretical and empirical work is needed to characterize the range of problems for which these methods will work well. More sophisticated Markov chain methods, notably “hybrid Monte Carlo”, are needed for the most difficult problems, such as Bayesian inference for neural network models (Neal 1996a). In preliminary work, I have found that a combination of hybrid Monte Carlo and random-grid Metropolis leads to rapid coalescence for some problems, but for others, such as inference for complex neural network models, coalescence is difficult to achieve. Solving this problem may require some additional innovation, such as, perhaps, the use of “tempering” methods (Neal 1996b) to produce a simplified distribution in which chains can more easily be brought together.
Acknowledgements
I thank Jeffrey Rosenthal for inspiration to examine the possibility of parallel simulation of Markov chains and for helpful discussions. This research was supported by the Natural Sciences and Engineering Research Council of Canada, and by the Institute for Robotics and Intelligent Systems.
References
-
Brooks, S. P. and Roberts, G. O. (1998) “Convergence assessment techniques for Markov chain Monte Carlo”, Statistics and Computing, vol. 8, pp. 319-335.
-
Chen, M.-H., Shao, Q.-M., and Ibrahim, J. G. (2000) Monte Carlo Methods in Bayesian Computation, Springer-Verlag.
-
Cowles, M. K. and Carlin, B. P. (1996) “Markov chain Monte Carlo convergence diagnostics: a comparative study”, Journal of the American Statistical Association, vol. 91, pp. 883-904.
-
Cowles, M. K., Roberts, G. O., and Rosenthal, J. S. (1999) “Possible biases induced by MCMC convergence diagnostics”, Journal of Statistical Computation and Simulation, vol. 64, pp. 87-104.
-
Duane, S., Kennedy, A. D., Pendleton, B. J., and Roweth, D. (1987) “Hybrid Monte Carlo”, Physics Letters B, vol. 195, pp. 216-222.
-
Fill, J. A. (1998) “An interruptible algorithm for perfect sampling via Markov chains”, Annals of Applied Probability vol. 8, pp. 131-162.
-
Frenkel, D. and Smit, B. (1996) Understanding Molecular Simulation: From Algorithms to Applications, San Diego: Academic Press.
-
Gelman, A. and Rubin, D. B. (1992) “Inference from iterative simulation using multiple sequences” (with discussion), Statistical Science, vol. 7, pp. 457-472 (discussion pp. 483-511).
-
Geyer, C. J. (1992) “Practical Markov chain Monte Carlo”, Statistical Science, vol. 7, pp. 473-483 (discussion pp. 483-511).
-
Gilks, W. R., Richardson, S., and Spiegelhalter, D. J. (1996) Markov Chain Monte Carlo in Practice, London: Chapman and Hall.
-
Gilks, W. R. and Wild, P. (1992) “Adaptive rejection sampling for Gibbs sampling”, Applied Statistics, vol. 41, pp. 337-348.
-
Green, P. J. and Murdoch, D. J. (1998) “Exact sampling for Bayesian inference: towards general purpose algorithms” (with discussion), in J. M. Bernardo, et al (editors), Bayesian Statistics 6, Oxford: Clarendon Press, pp. 301-321.
-
Hastings, W. K. (1970) “Monte Carlo sampling methods using Markov chains and their applications”, Biometrika, vol. 57, pp. 97-109.
-
Horowitz, A. M. (1991) “A generalized guided Monte Carlo algorithm”, Physics Letters B, vol. 268, pp. 247-252.
-
Johnson, V. E. (1996) “Studying convergence of Markov chain Monte Carlo algorithms using coupled sample paths”, Journal of the American Statistical Association, vol. 91, pp. 154-166.
-
Johnson, V. E. (1998) “A Coupling-Regeneration Scheme for Diagnosing Convergence in Markov Chain Monte Carlo Algorithms”, Journal of the American Statistical Association.
-
Lindvall, T. (1992) Lectures on the Coupling Method, New York: Wiley.
-
Mengersen, K. L., Robert, C. P., and Guihenneuc-Jouyaux, C. (1999) “MCMC convergence diagnostics: a reviewww” (with discussion), in J. M. Bernardo, et al (editors), Bayesian Statistics 6, Oxford: Clarendon Press, pp. 415-440.
-
Neal, R. M. (1996a) Bayesian Learning for Neural Networks, Lecture Notes in Statistics No. 118, New York: Springer-Verlag.
-
Neal, R. M. (1996b) “Sampling from multimodal distributions using tempered transitions”, Statistics and Computing, vol. 6, pp. 353-366.
-
Pinto, R. L. and Neal, R. M. (2001) “Improving Markov chain Monte Carlo estimators by coupling to an approximating chain”, Technical Report No. 0101, Dept. of Statistics, University of Toronto, 13 pages.
-
Propp, J. G. and Wilson, D. B. (1996) “Exact sampling with coupled Markov chains and applications to statistical mechanics”, Random Structures and Algorithms, vol. 9, pp. 223-252.
-
Ritter, C. and Tanner, M. A. (1992) “Facilitating the Gibbs sampler: The Gibbs stopper and the Griddy-Gibbs sampler”, Journal of the American Statistical Association, vol. 87, pp. 861-868.
-
Roberts, G. O., Gelman, A., and Gilks, W. R. (1997) “Weak convergence and optimal scaling of random walk Metropolis algorithms”, Annals of Applied Probability, vol. 7, pp. 110-120.
-
Rosenthal, J. S. (1995a) “Minorization Conditions and Convergence Rates for Markov Chain Monte Carlo”, Journal of the American Statistical Association, vol. 90, pp. 558-566.
-
Rosenthal, J. S. (1995b) “Convergence rates of Markov chains”, SIAM Review, vol. 37, pp. 387-405.
-
Rosenthal, J. S. (1999) “Parallel computing and Monte Carlo algorithms”, Technical Report No. 9902, Dept. of Statistics, University of Toronto.
-
Rossky, P. J., Doll, J. D., and Friedman, H. L. (1978) “Brownian dynamics as smart Monte Carlo simulation”, Journal of Chemical Physics, vol. 69, pp. 4628-4633.
-
Schmeiser, B. and Chen, M.-H. (1991) “On random-direction Monte Carlo sampling for evaluating multidimensional integrals”, Working Paper SMS91-1, Dept. of Statistics, Purdue University.
-
Sinclair, A. (1993) Algorithms for Random Generation and Counting: A Markov Chain Approach, Boston: Birkhäuser.