11email: werner@astro.uni-tuebingen.de22institutetext: NASA Goddard Space Flight Center, Greenbelt, MD 20771, USA
Metal abundances in hot white dwarfs with signatures of a superionized wind
About a dozen hot white dwarfs with effective temperatures = 65 000 K – 120 000 K exhibit unusual absorption features in their optical spectra. These objects were tentatively identified as Rydberg lines of ultra-high excited metals in ionization stages v–x, indicating line formation in a dense environment with temperatures near K. Since some features show blueward extensions, it was argued that they stem from a superionized wind. A unique assignment of the lines to particular elements is not possible, although they probably stem from C, N, O, and Ne. To further investigate this phenomenon, we analyzed the ultraviolet spectra available from only three stars of this group; that is, two helium-rich white dwarfs, HE 0504–2408 and HS 0713+3958 with spectral type DO, and a hydrogen-rich white dwarf, HS 2115+1148 with spectral type DAO. We identified light metals (C, N, O, Si, P, and S) with generally subsolar abundances and heavy elements from the iron group (Cr, Mn, Fe, Co, Ni) with solar or oversolar abundance. The abundance patterns are not unusual for hot WDs and can be interpreted as the result of gravitational settling and radiative levitation of elements. As to the origin of the ultra-high ionized metals lines, we discuss the possible presence of a multicomponent radiatively driven wind that is frictionally heated.
Key Words.:
stars: abundances – stars: atmospheres – stars: evolution – stars: AGB and post-AGB – white dwarfs| Star | Type | Instrument | Dataset | Grating | /Å | /s | Date | PI | |
|---|---|---|---|---|---|---|---|---|---|
| HS 2115+1148 | DAO | HST/GHRS | Z3GT0104T | G140L | 1700–2200 | 1150–1435 | 4243 | 1996-10-23 | Werner |
| HST/GHRS | Z3GT0105T | G140L | 1700–2200 | 1480–1770 | 5440 | 1996-10-23 | Werner | ||
| FUSE | C0960101000 | 20000 | 915–1188 | 9370 | 2002-07-02 | Finley | |||
| FUSE | C0960102000 | 20000 | 915–1188 | 6441 | 2004-05-59 | Finley | |||
| HE 0504–2408 | DO | HST/GHRS | Z2WX0104T | G140L | 1700–2200 | 1150–1435 | 1414 | 1995-09-28 | Werner |
| HST/GHRS | Z2WX0105T | G140L | 2300–2700 | 1480–1770 | 2611 | 1995-09-28 | Werner | ||
| HST/GHRS | Z2WX0106T | G270M | 30000 | 2957–3000 | 2394 | 1995-09-28 | Werner | ||
| FUSE | A0010101000 | 20000 | 915–1188 | 6620 | 2001-12-03 | Werner | |||
| HS 0713+3958 | DO | HST/GHRS | Z2WX0204T | G140L | 1700–2200 | 1150–1435 | 4243 | 1995-09-22 | Werner |
| HST/STISb𝑏bb𝑏bObservation of the cool companion. | O63Z01010 | G750L | 530–1040 | 5240–10270 | 2405 | 2001-01-19 | Werner | ||
| FUSE | A0010201000 | 20000 | 915–1188 | 5249 | 2000-03-15 | Werner | |||
| FUSE | A0010202000 | 20000 | 915–1188 | 9812 | 2000-11-11 | Werner | |||
| FUSE | S6011901000 | 20000 | 915–1188 | 8933 | 2002-02-12 | Friedman | |||
| HS 0727+6003 | DO | FUSE | Z9031001000 | 20000 | 915–1188 | 20556 | 2003-02-01 | Dupuis |

1 Introduction
More than two decades ago, the discovery of two hot helium-rich (DO) white dwarfs (HE 0504–2408, HS 0713+3958; effective temperature 70 000 K) with ultra-high excitation (uhe) absorption lines in optical spectra was announced (Werner et al. 1995). The newly detected lines were assigned to extremely high ionization stages of the CNO elements and neon (C v, C vi/N vi, N vii/O vii, O viii, Ne ix, and Ne x). The ionization energies, however, require temperatures on the order K. Some lines exhibit an asymmetric profile shape suggesting their formation in a stellar wind, hence the alternative designation of these stars as “hot-wind DOs”. Since then, no progress has been made to explain the origin of these line features. However, this phenomenon turned out to be not uncommon among DO white dwarfs. In total, 9 out of about 70 known hot DOs are affected (Dreizler et al. 1995; Hügelmeyer et al. 2006; Reindl et al. 2014a; Werner et al. 2014). In addition, one DAO white dwarf (HS 2115+1148, Dreizler et al. 1995) and one PG1159 star (Hügelmeyer et al. 2006) were found to exhibit uhe lines.
The determination of the basic photospheric parameters ( and surface gravity ) of these stars is hampered by an obviously related phenomenon in the optical spectra, namely abnormally deep He ii lines, in the case of the DOs and PG1159 star, and Balmer lines, in the case of the DAO. In this paper we present the first analysis of ultraviolet (UV) spectra that are available for only three uhe stars; i.e., the two DOs and the DAO mentioned above. We performed the observations with the Goddard High Resolution Spectrograph (GHRS) aboard the Hubble Space Telescope (HST) and the Far Ultraviolet Spectroscopic Explorer (FUSE) and use additional archival data. The primary aim of this analysis is to constrain the stellar effective temperatures by several ionization balances and determine metal abundances. Further clues concerning the uhe phenomenon are expected as well.
We introduce the program stars in Sect. 2 and present the UV observations in Sect. 3. Model atmospheres and atomic data for the spectral analysis are described in Sect. 4. Spectral line fitting procedures and results are reported in Sect. 5. The paper is concluded with a summary and discussion of the results (Sect. 6.)
2 Program stars
Our program stars are those three WDs exhibiting uhe features, for which FUSE spectra and HST spectra with sufficient resolution spectra are available. For another DO, HS 2027+0651 (Dreizler et al. 1995), only low resolution (1.2 Å and less) HST/STIS data exist, and hence, it was not included in our study. Still another uhe DO discovered by Dreizler et al. (1995), HS 0727+6003, has not been observed with HST, and hence, we do not analyze this object in detail either. However, HS 0727+6003 has an archival, unpublished FUSE spectrum, which we will shortly discuss.
2.1 DO white dwarfs HE 0504–2408 and HS 0713+3958
A rough estimate of = 70 000 K and = 7.5 followed from optical spectra of both stars (Werner et al. 1995). HS 0713+3958 was reassessed by Reindl et al. (2014b) using newly available optical SDSS spectra and a grid of He+C NLTE model atmospheres, and = 80 00010 000 K and = 7.750.5 was derived. The detection of He i 5876 Å served as a constraint and also supports our present analysis. Infrared photometry revealed that HS 0713+3958 has a cool companion with a spectral type of late K that is separated about 1” from the primary (Napiwotzki 1997).
2.2 HS 2115+1148 (DAO)
In their discovery paper, Dreizler et al. (1995) derived = 67 000 K and = 6.9 from the Balmer lines, putting emphasis on the highest observed series member (H) and noting a severe Balmer-line problem: H–H are much deeper in the observation than in the model with the given parameters (H+He NLTE models). Similar problems with other DAO stars (Napiwotzki & Rauch 1994) were solved by the inclusion of C, N, and O opacities (Werner 1996), however, in this particular case the problem remained. Gianninas et al. (2010) derived = 62 230 K, = 7.76 from Balmer-line fitting using NLTE models including CNO as the only metals and assuming solar abundances. The inclusion of CNO was used as a proxy for the presence of metals to mitigate the Balmer-line problem. The two analyses arrived at similar helium abundances of 0.63 % and 0.43 % mass fraction, which were derived from a weak He ii 4686 Å line.
Compared to the two DOs, the uhe lines in this DAO are much less prominent.
| HS | HE | HS | ||
| 2115+1148 | 05042408 | 0713+3958 | Sunb𝑏bb𝑏bSolar abundances from Asplund et al. (2009). | |
| Type | DAO | DO | DO | |
| / K | 80 000 | 85 000 | 65 000 | |
| 7.0 | 7.0 | 7.5 | ||
| H | 0.99 | 0.74 | ||
| He | 0.995 | 0.999 | 0.25 | |
| C | ||||
| N | ||||
| O | ||||
| Si | ||||
| P | ||||
| S | ||||
| Cr | ||||
| Mn | ||||
| Fe | ||||
| Co | ||||
| Ni |
| I | II | III | IV | V | VI | |
|---|---|---|---|---|---|---|
| H | 15, 105 | |||||
| He | 29, 60 | 15, 105 | ||||
| C | 1, 0 | 133, 745 | 54, 279 | |||
| N | 1, 0 | 76, 405 | 54, 297 | |||
| O | 83, 637 | 105, 671 | 54, 280 | |||
| Si | 17, 28 | 30, 102 | 25, 59 | |||
| P | 3, 0 | 21, 9 | 18, 12 | |||
| S | 39, 107 | 25, 48 | 38, 120 |
3 Ultraviolet observations
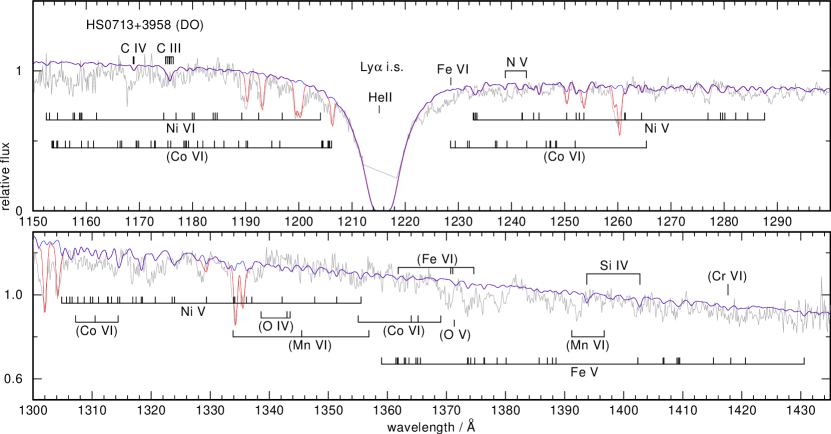
We obtained HST/GHRS UV spectra of the three program stars (Tab. ; Figs. 1–7). Without quantitative analyses, these spectra were presented previously in Werner et al. (1997a, b); Werner & Dreizler (1999). A high-resolution segment of HE 0504–2408 at 2957–3000 Å (Fig. 7) was recorded along with a red optical spectrum of the cool companion of HS 0713+3958 (Fig. 8).
Far-UV observations (915–1220 Å) of HE 0504–2408 and HS 0713+3958 were taken with Berkeley Extreme and Far-UV Spectrometer (BEFS) aboard ORFEUS-SPAS II in 1996, but the resolution (0.5 Å) was claimed to be too poor for spectral line identification (Werner et al. 1999). A reinspection of these data in the MAST archive reveals that the spectrum of HS 0713+3958 is indeed very noisy, while the HE 0504–2408 spectrum is better but still inferior to the coadded FUSE data taken later. Hence we do not use the BEFS data. The FUSE spectra of both stars were presented by Werner et al. (2003b) and the only photospheric lines identified at that time were the S vi and P v resonance doublets. Archival FUSE data of the DAO HS 2115+1148 and DO HS 0727+6003 are used for our work. They were hitherto unpublished and not analyzed. The FUSE data were processed using the procedure described by Werner et al. (2015). All spectra were shifted such that the photospheric lines have zero radial velocity.
The FUSE observations exhibit many absorption lines of the interstellar medium (ISM). To unambiguously identify stellar lines, we employed the program OWENS (Lemoine et al. 2002; Hébrard et al. 2002; Hébrard & Moos 2003). It has the capacity to consider several, individual ISM clouds with their own radial and turbulent velocity, temperature, chemical composition, and respective column densities. We identified and modeled lines of H i, D i, H2 ( = 0–9), HD ( = 0–1), C i–iii, C ii∗, N i–ii, O i, Si ii, P ii, S iii, Ar i, and Fe ii.
4 Model atoms and model atmospheres
We used the Tübingen Model-Atmosphere Package (TMAP444http://astro.uni-tuebingen.de/~TMAP) to compute non-LTE, plane-parallel, line-blanketed atmosphere models in radiative and hydrostatic equilibrium (Werner & Dreizler 1999; Werner et al. 2003a, 2012). Table summarizes the number of considered non-LTE levels and radiative transitions between them. All model atoms were built from the publicly available Tübingen Model Atom Database (TMAD; Rauch & Deetjen 2003), which is comprised of data from various sources, namely Bashkin & Stoner (1975), the databases of the National Institute of Standards and Technology (NIST555http://www.nist.gov/pml/data/asd.cfm), the Opacity Project (OP666http://cdsweb.u-strasbg.fr/topbase/topbase.html; Seaton et al. 1994), CHIANTI777http://www.chiantidatabase.org (Dere et al. 1997; Landi et al. 2013), and the Kentucky Atomic Line List888http://www.pa.uky.edu/~peter/atomic.
Besides H, He, C, N, and O, our models include Si, P, S, Cr, Mn, Fe, Co, and Ni. To reduce the computational efforts, the light metals (up to sulfur) were considered with small model atoms and subsequently, one by one, dealt with large model atoms while keeping fixed the atmospheric structure. The statistics of these large model atoms is summarized in Tab. .
For the iron-group elements considered (Cr–Ni), we used a statistical approach, employing seven superlevels per ion linked by superlines, together with an opacity sampling method (Anderson 1989; Rauch & Deetjen 2003). Ionization stages iv–viii augmented by single, ground-level stages ix were considered. We used the complete line list of Kurucz (so-called LIN lists, comprising about , , , , and lines of the considered ions of Cr, Mn, Fe, Co, and Ni; Kurucz 1991, 2009, 2011) for the computation of the non-LTE population numbers, and the so-called POS lists, which include only the subset of lines with well-known, experimentally observed line positions, for the final spectrum synthesis.
5 Spectral line fitting procedure and results
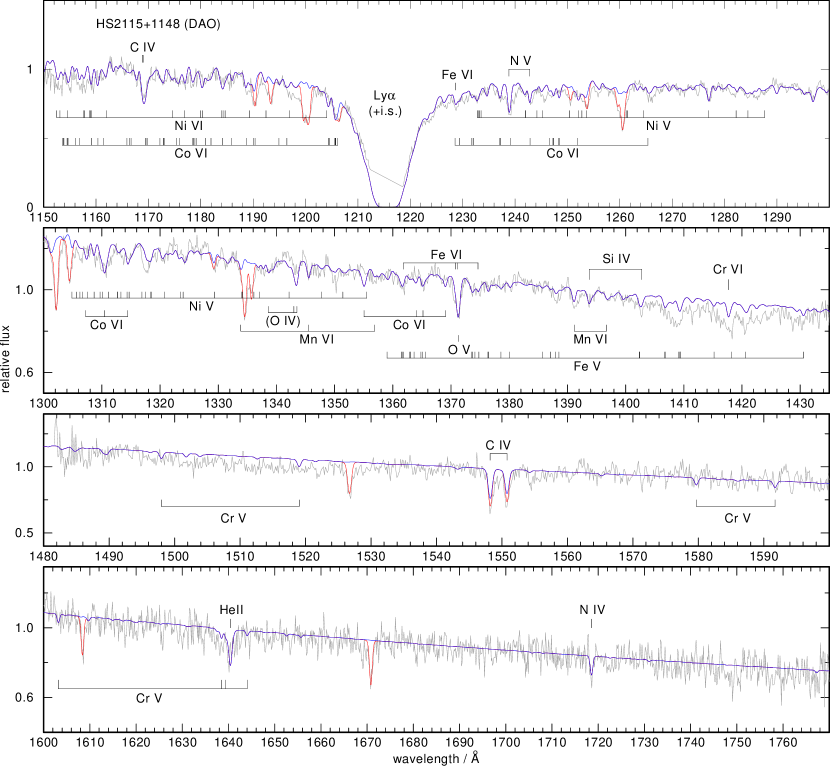
For the line profile fitting we proceeded as follows. In the 1150–1300 Å range of the HST spectra we assumed an arbitrary normalization factor and a reddening of to match the continuum shape. In all other wavelength windows of the HST and FUSE spectra shown in Figs. 1–8, zero reddening was assumed and a flux scaling factor that can be different from window to window was applied. All model spectra were convolved with Gaussians according to the resolution of the observations.
The observed flux falls significantly below the models at about 1490–1520 Å in the spectra of HE 0504–2408 and HS 0713+3958, which we assign to the blueshifted O vii n=56 uhe line (hydrogenic wavelength 1522 Å). Another broad feature at 1390-1430 Å remains unexplained. In the G270M spectrum of HE 0504–2408 (Fig. 7) we identify the blueshifted O viii n=78 uhe line covering the 2957–2970 Å interval (hydrogenic wavelength 2979 Å). This line is so broad that it is even detectable in a low-resolution (about 5 Å) IUE999International Ultraviolet Explorer spectrum (image LWP22367, taken from the MAST archive). The feature is also detectable in a IUE spectrum of HS 0713+3958 (LWP27020). In the same IUE spectra, the blueshifted O vii n=67 uhe line (hydrogenic wavelength 2525 Å) is present in both DOs, and at shorter wavelengths the blueshifted O viii n=67 uhe line (hydrogenic wavelength 1933 Å) is just detectable (images SWP43954 and SWP49562, respectively).
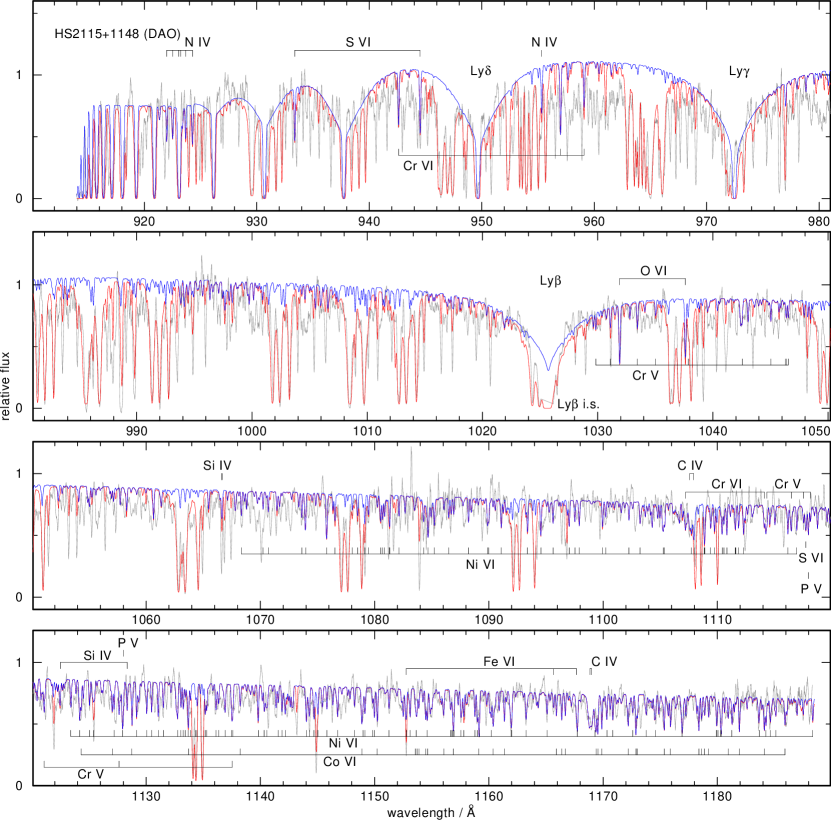
5.1 HS 2115+1148 (DAO)
5.1.1 Effective temperature and surface gravity
At the outset, we computed a grid of hydrogen models with a small admixture of helium (He = 0.004; all element abundances in this paper are given in mass fractions) to constrain and from the Lyman lines in the FUSE spectrum. The value of was further constrained with a series of models including metals by exploiting several ionization balances (C iii/iv, N iv/v, O v/vi, Fe v/vi, Ni v/vi). We finally adopted = K and = . While the uncertainty in is rather small, a tighter limit to is not possible. The significantly lower values for found in previous analyses of optical spectra (67 000 K and 62 230 K; see Sect. 2.2) are clearly excluded by our model fits to the metal lines, and the high surface gravity derived by Gianninas et al. (2010) from the Balmer lines ( = 7.76) contradicts the Lyman-line wings. In their original discovery paper, Dreizler et al. (1995) derived = 6.9 from Balmer-line fitting with pure H/He NLTE models, which is close to our value; these authors note, however, the fit is poor and has a pronounced Balmer line problem.
5.1.2 Element abundances
Helium.
He ii 1640 Å suggests He = 0.001, which is lower than derived previously from He ii 4686 Å (0.006 and 0.004; Dreizler et al. 1995; Gianninas et al. 2010). Performing a fit to He ii 4686 Å in the spectrum presented by Dreizler et al. (1995) with our models confirms their high value of He = 0.006, i.e., we obtain no consistent fit to the UV and optical He ii lines. At any rate, because of the low abundance, no He ii lines are detectable in the FUSE spectrum.
Light metals.
From a few C iv lines we find C = . The resonance doublet is not deep enough in the model and we suspect an interstellar contribution to the observed profile. The C iii multiplet at 1175 Å is not detectable, confirming the high . From a few N iv lines including 1718 Å and the N v 1239/1243 Å resonance doublet we conclude N = . O v 1371 Å and the O vi 1032/1038 Å resonance doublet suggest O = . The O iv triplet at 1339/1343/1344 Å is not detectable, again confirming the high temperature. From the Si iv 1394/1403 Å resonance doublet and the Si iv 1122/1128 Å doublet, we find Si = . From the resonance doublets P v 1118/1128 Å and S vi 933/944 Å, P = and S = is derived.
Iron-group elements.
The UV spectra are dominated by lines from iron and nickel. From iron we see mainly Fe v lines, which are predominantly located in the 1360–1430 Å band. In comparison, only few Fe vi lines can be identified. We derive a solar abundance (Fe = ). From nickel, we see lines from Ni v (most of them in the 1230–1350 Å region) and Ni vi (1070–1200 Å) and we adopt a 10 times solar abundance (Ni = ).
As indicated in Figs. 1 and 2, we identify lines from chromium, manganese, and cobalt. Specifically, we detect a smaller number of Cr v and Cr vi lines and derive Cr = , which is about 2 dex oversolar. A few Mn vi lines are detectable and we measure a slightly oversolar abundance (Mn = ). A larger number of Co vi lines can be seen, contributing to the nickel line forest in the 1120–1260 Å range. The derived abundance of Co = is more than two dex oversolar. The error in the abundance determinations is estimated to 0.3 dex.
We comment on the many unidentified lines in this and the other program stars in Sect. 5.5 below.

5.2 HE 0504–2408 (DO)
5.2.1 Effective temperature and surface gravity
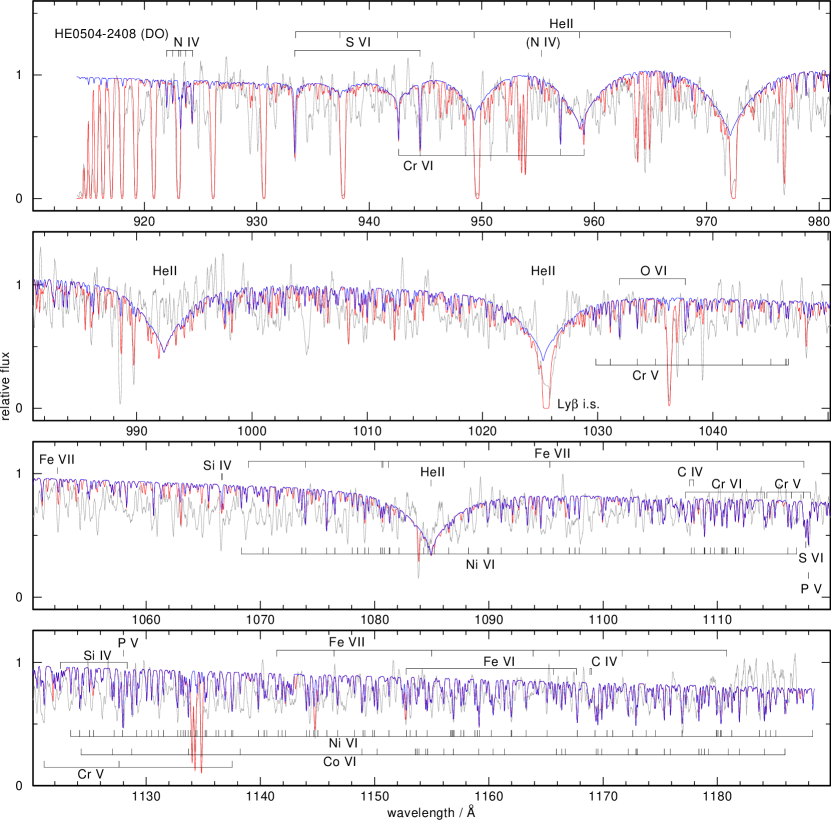
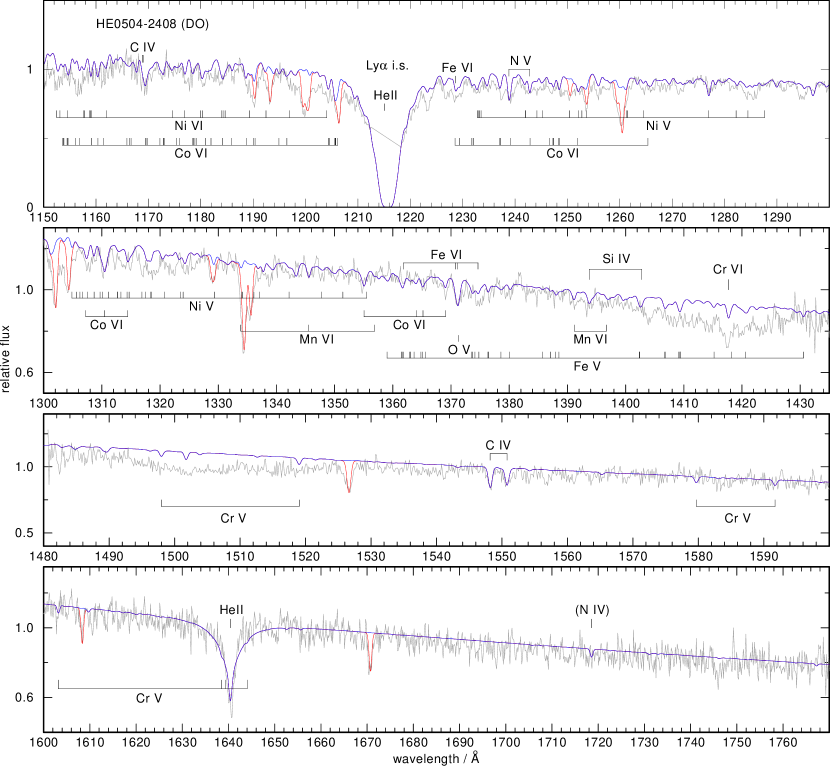
In analogy to the DAO analysis described above, we began our analysis of both DO stars with a grid of pure helium models (with a small admixture of hydrogen) to roughly constrain and , and then fine-tuned by exploiting metal ionization balances. For HE 0504–2408 we found = K and = , i.e., similar values as for the DAO analysis, but the uncertainty in is twice as large, mainly because of the weaker lines of C, N, and O. A lower temperature is excluded by the lack of the C iii multiplet at 1175 Å and the lack of O iv lines in the HST spectrum. Fittingly, in a high-resolution (0.1 Å) optical spectrum (taken in the SPY survey; Napiwotzki et al. 2003) the He i 5876 Å line is not detectable, yielding a lower limit of = 80 000 K. Higher temperatures are excluded because low-ionization heavy-metal lines would disappear (Cr v, Fe v, Ni v). Higher surface gravities would give a too broad He ii 1640 Å line, while lower gravities would give too deep, narrow line cores in the higher series members of the Pickering series in the optical.
The model poorly fits the He ii lines at 991 Å and 1085 Å, which appear much shallower in the observation. A possible explanation is discussed in Sect. 5.5.
5.2.2 Element abundances
We derive C, N, and O abundances that are lower than in the DAO star HS 2115+1148. For N, only an upper limit could be fixed (C = , N , O = ). While the Si abundance is the same (), significantly larger P and S abundances were found (P = , S = ). For Cr, Mn, Fe, Co, and Ni we derive the same abundances as in the DAO analysis. As before, the error in the abundance determinations is estimated to 0.3 dex.
5.3 HS 0713+3958 (DO)
5.3.1 Effective temperature and surface gravity
As mentioned in Sect. 2.1, a weak He i 5876 Å line is detectable in the SDSS spectrum and serves as a good constraint for . At = 7.5 we find a best fit at = K. Below this temperature, He i 4471 Å would be detectable but it is not visible in the observation. Reindl et al. (2014b) derived a higher temperature ( = 80 00010 000 K and = 7.750.5) using helium-model atmospheres including only carbon. Our pure helium-models confirm this result. But in our fully metal line blanketed models, the He i 5876 Å line is significantly weaker so that we arrive at a lower temperature for a good fit. The surface gravity cannot be fixed better from the optical spectra. For the following we assume = 7.50.5. The error range comprises the previously estimated values for the gravity.
As was the case with the other DO, the model poorly fits the He ii lines at 991 Å and 1085 Å because these lines are too deep to fit the observation (see discussion in Sect. 5.5).
5.3.2 Element abundances
Light metals.
The carbon abundance is solely derived from the C iii multiplet at 1175 Å (C = ). From the absence of N iv and N v lines and the O iv multiplet at 1338.61/1342.99/1343.51 Å and O v 1371 Å, we derive N and O . The O vi resonance doublet is absent because of the low . For the other light metals we find from the same lines as discussed above Si = , P = , and S = . Quite large errors of 0.7 dex must be accepted because of the relatively poor quality of the spectra.
Iron-group elements.
In the models, lines of Cr v are dominant while Cr vi lines are weak. However, none of the lines can be identified in the observation and we find Cr . The Mn vi lines seen in the two other stars are absent here because of the lower temperature. No other Mn lines are predicted so that we are unable to derive an upper abundance limit. As to iron, Fe v lines are stronger than Fe vi lines in the models. We find Fe = . Lines from cobalt cannot be identified. Mainly from the absence of Co v lines in the HST range, we fix Co . From Ni v lines we measure Ni = . Again, relatively large errors of 0.7 dex must be accepted.
Trans-iron elements.
In the FUSE spectrum of HS 0713+3958, we possibly found lines from heavier elements but the spectrum is too noisy for firm detections. By comparison with the DO white dwarf RE 0503289, which has similar and (75 000 K, 7.5) and in which 14 trans-Fe elements were discovered (Hoyer et al. 2017), lines from Zn v, Ge v/vi, Se vi, Mo vi, Sn v, and Te vi might be present.
5.3.3 Spectroscopy of the cool companion
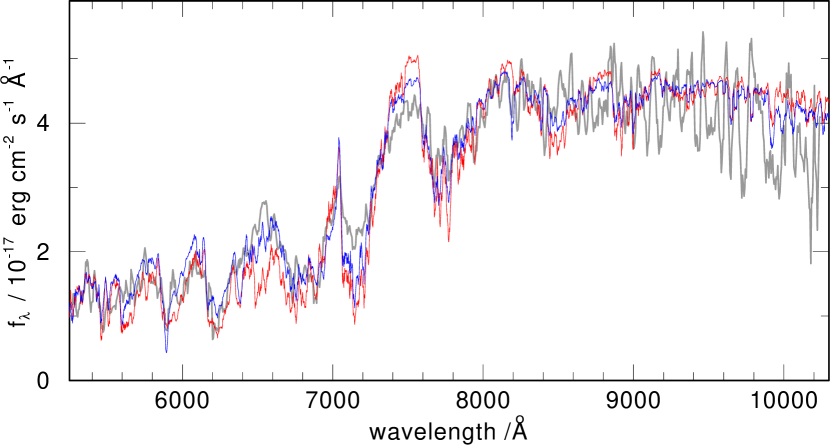
In Fig. 8, we show the HST/STIS G750L spectrum that we took from the cool companion of HS 0713+3958. It is characterized by TiO bands. We compare it to two NextGen (Allard et al. 2001) models (solar abundances) that suggest that = 3300 K and = 5, hence, the spectral type is M5V (Voigt 2012, p. 312; citing Aller et al. (1982)), which is later than estimated previously from photometry.
The quality of the spectrum is not good enough to discern between models with different surface gravity (i.e., luminosity). A similarly good fit is achieved with a subgiant spectrum with = 3600 K and = 2.5, however, the companion must be a dwarf. The spectroscopic distance to the WD primary is 392 pc, derived from the ratio of the observed to the model flux, the surface gravity = 7.50.5, and the spectroscopic mass of MWD = 0.450.06 M⊙ (from extrapolation of evolutionary tracks from Althaus et al. 2009). The uncertainty in the distance is about a factor of two, which is dominated by the error in surface gravity. Taking this distance, we derive a radius of the companion of R R⊙, again within a factor of two, by comparing the observed and model ( = 3300 K, = 5) spectra. It is consistent with the radius of a M5V star (0.27 R⊙; Voigt 2012, p. 324).
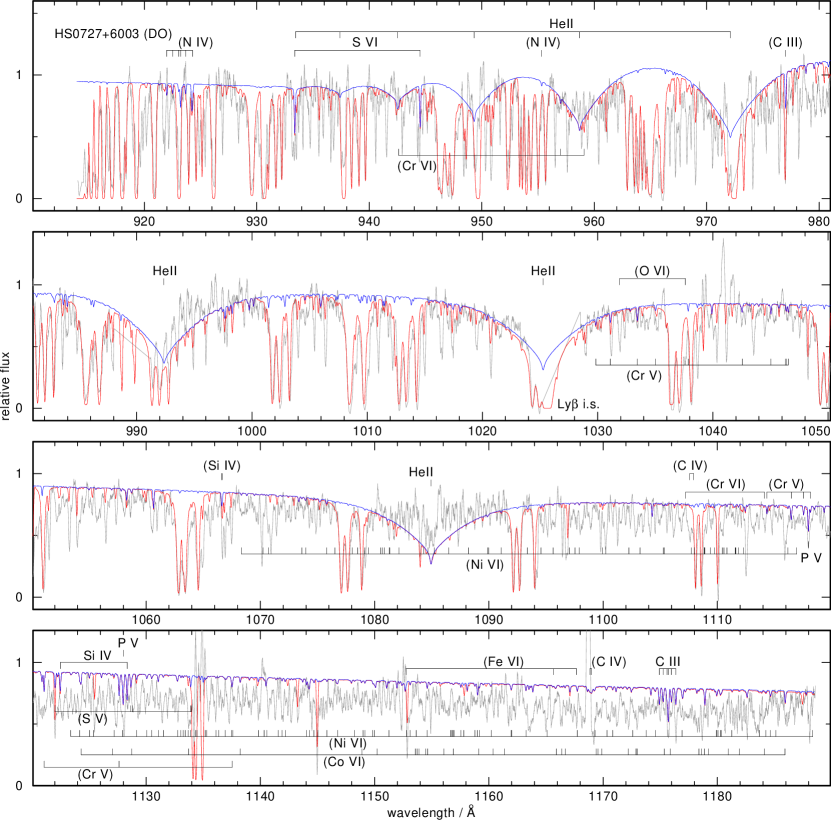
5.4 Archival FUSE data of HS 0727+6003 (DO)
As mentioned in the Introduction, we retrieved a previously unpublished FUSE spectrum of yet another uhe DO, HS 0727+6003, from the MAST archive. It is shown in Fig. 9, together with the final model spectrum for HS 0713+3958, which we have shown in Fig. 5. The presence of the C iii multiplet at 1175 Å indicates a similar temperature as that of HS 0713+3958 (65 000 K) but without further UV data, no detailed assessment of the photospheric parameters is possible. The only other metal lines that can be identified are from Si, P, and S, and their strengths point at similar abundances as in HS 0713+3958.
Two things are remarkable. First, even more discrepant than in the two analyzed DOs is the very weak He ii 1085 Å line, which is much deeper in the model. Second, we are unable to identify any line of iron-group elements (see discussion in Sect. 5.5).
5.5 Unidentified opacities in the program stars
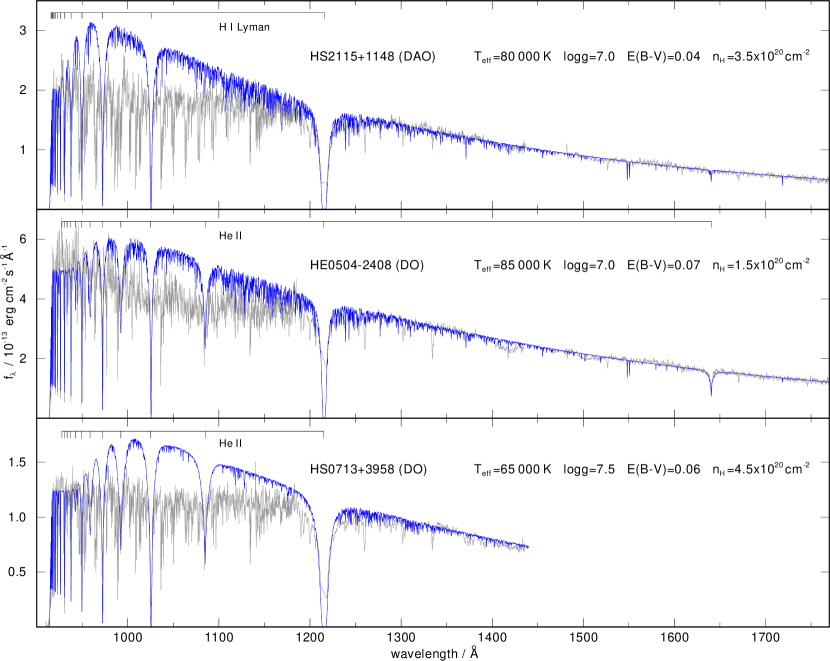
In the spectra of all three program stars, particularly in the higher resolved FUSE data, many spectral lines remain unidentified. In fact, if we look at the overall flux distributions, we see that extreme blanketing by unidentified lines causes significant flux depression in the 950–1150 Å spectral range (Fig. 10). According to our models, they cannot be assigned to iron-group elements or other light metals. Instead, we might see either a multitude of lines from trans-iron elements (some of which are possibly identified in HS 0713+3958; see Sect. 5.3.2) and/or the flux depressions could stem from broad, unknown opacity sources, for example, from superionized species.
We ruled out that calibration problems cause the 950–1150 Å flux depression. The fundamental FUSE flux calibration is based on the same DA WDs as the HST spectrographs, so there is no disconnect in the definition that might lead to spurious spectral slope determinations. Furthermore, the deviation in spectral slope between the models and data begins around Ly in the two hotter stars and longward of Ly in the cooler HS 0713+3958, well within the STIS band. The four FUSE channels are each calibrated separately and the measured spectra in the four channels were consistent within a few percent, which is consistent with the scatter among the flux calibration measurements obtained throughout the FUSE mission. Similarly, measurements of the program stars obtained at multiple epochs were also consistent to within a few percent, indicating that there were no shortcomings in the corrections for the gradually varying throughput of the instrument. (See Section 7.5 of the FUSE Data Handbook for information on the FUSE flux calibration and performance throughout the mission101010http://archive.stsci.edu/fuse/dh.html.)
The slope of the FUV extinction curve is known to vary from one Galactic line of sight to another, but all derived reddening laws have been monotonic shortward of about 1800 Å (e.g., Sofia et al. 2005; Cartledge et al. 2005). There has been no evidence for a bump in the FUV extinction curve at 1050 Å analogous to the well-known bump at 2175 Å.
Fig. 10 also explains the weakness of the He ii lines in the FUSE spectra of the DOs. In the previous figures, where we have shown the FUSE spectra, we normalized the model spectra to the local continua in the panels, however, it is obvious that the true continua are undetermined because of strong line blanketing. This finding calls into question the validity of our abundance determinations of metals, which exclusively rely on lines located in the range 950–1150 Å. This mainly affects phosphorus and sulfur, whose abundances could be systematically higher than we derived.
As mentioned previously (Sect. 5), there is a very shallow, roughly 20 Å wide absorption feature in HE 0504–2408 centered at around 1500 Å. As an alternative identification as a possible uhe line, we speculated that it might be the blueshifted component of a weak C iv 1550 Å P Cygni profile (Werner et al. 2003b). If true, then it would stem from a wind with a terminal velocity of about 10 000 km/s.
5.6 Optical spectra
We compared our final models for the three program stars with optical spectra. In all cases, the problems with the too-deep hydrogen Balmer and He ii lines remained. The problems of our models could be related to the lack of opacities from unidentified species. In the case of the DAO, the H and H lines fit well (higher series members are not present) while the lower series members are still too weak in the model, as in previous work. In the two DOs, the same problem holds for the He ii Pickering lines and He ii 4686 Å. The relatively low = 7 in the models is not in contradiction to the non-detection of Pickering lines shortward of He ii 4340 Å. We reiterate that in the case of the DAO, we obtain inconsistent He abundances derived from the He ii lines at 1640 Å and 4686 Å, namely, He = 0.001 and 0.006.
6 Summary and discussion
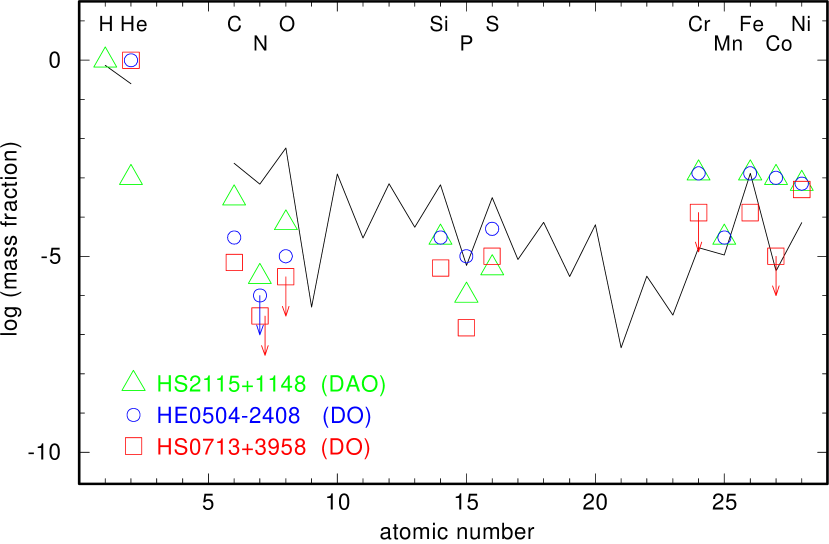
We determined metal abundances in three hot white dwarfs showing signatures of a superionized wind (see Table and Fig. 11). Generally, we find low abundances of the light elements C, N, O, Si, P, and S (between solar and less than solar), while iron is solar and other Fe-group elements are between roughly solar and 100 times solar. The abundance patterns are not unusual when compared to other hot WDs with similar effective temperature. It can be assumed that they are determined by gravitational settling and radiative acceleration, although Barstow et al. (2014) argued that the wide spread of observed element abundances in hot DA white dwarfs in a given temperature range could result from accretion from external sources.
In particular, the DAO HS 2115+1148 ( = 80 000 K, = 7) has a metal abundance pattern that is very similar to BD (80 000 K, 7.2; Ziegler et al. 2012) with respect to all species. Because of the nearly identical photospheric parameters one might ask whether BD exhibits uhe lines in the optical spectrum. Unfortunately, no optical spectrum exists because it is a close binary star with a dominating cool companion. Good et al. (2005) measured abundances of C, N, O, Si, Fe, and Ni in 16 DAO white dwarfs and the results are qualitatively similar to those for HS 2115+1148 as well.
We seek to understand how the metal abundances of the two DOs of our investigation (having 65 000 K and 85 000 K; both with = 7) compare to other DOs. A recent investigation of two DOs with =7 but significantly higher temperatures (115 000 K and 125 000 K) revealed solar abundances of heavier elements (Ne, Si, P, S, Ar, Fe, and Ni). This is the consequence of on-going mass loss preventing gravitational settling (Werner et al. 2017). The most detailed analyzed DO with similar temperature is RE 0503–289 (70 000 K, = 7.5; Rauch et al. 2017). With the exception of carbon, which is oversolar in RE 0503–289, other light metals (N, O, Si, P, and S) are underabundant by about one dex, in qualitative agreement with our DOs studied here. Fe and Ni abundances in RE 0503–289 ( solar and solar, respectively) are lower than in our two DOs (0.1–1.0 solar and 0.9–1 solar). Aside from the enhanced Fe and Ni abundances, there is no significant difference in the abundances of the two hot-wind DOs and RE 0503–289, which has no signatures of a superhot wind.
For our analysis, we computed line-blanketed, chemically homogeneous non-LTE model atmospheres, including the opacities of all investigated metals. We hoped that these models would remove the Balmer-line problem in the DAO and the respective He ii line problem in the DOs. However, the effect of the considered metal opacities on the atmospheric structure is insufficient to obtain good fits to the extraordinarily deep H and He ii line cores in the optical spectra. This corroborates our earlier suspicion that this problem is probably related to the occurrence of the ultra-high ionization lines associated with a super-hot wind.
In the UV spectra, there is no hint as to ongoing mass loss. There is neither blueshift of nor asymmetry in the resonance line profiles (doublets of C iv, N v, O vi, Si iv, P v, S vi) or other features like O v 1371 Å and He ii 1640 Å (for a possible exception concerning the C iv line, see Sect. 5.5). This is not unexpected because mass-loss rates predicted from radiation-driven wind theory are so low (log() ; Unglaub & Bues 2000) that they cannot be detected spectroscopically in these lines. On the other hand, if we believe that the uhe line features are signatures of a superionized wind, then the question arises where these features are formed and how the wind is heated to temperatures on the order K. The situation is reminiscent of the occurrence of ‘superionization’ in the winds of extreme helium (EHe) stars (Hamann et al. 1982), albeit at a lower temperature scale. For example, Jeffery & Hamann (2010) in their investigation of mass loss in the very thin wind of BD ( = 18 500 K, = 2.6), the observed wind profile of the C iv resonance line could not be reproduced by the models because at that low they predicted that carbon recombines to C iii and C ii. It was concluded that some ‘superionization’ keeps the ionization higher than predicted. As a viable mechanism these authors discussed frictional heating in a multicomponent wind. In fact, stellar wind models for subluminous hot stars confirm that this is well possible (Unglaub 2006; Krtička et al. 2016). In the present context of the much hotter WDs, such ‘superionization’ is observed, albeit involving higher temperatures and, thus, higher ionization stages.
It has been predicted by models that the process of frictional heating can occur in thin radiation-driven winds of hot stars (Springmann & Pauldrach 1992). Radiation pressure accelerates only metal ions while the bulk matter (hydrogen and/or helium) stays inert. In models for such multicomponent wind models for OB stars, temperatures on the order K were predicted (Krtička & Kubát 2001). Particularly interesting for our discussion here are investigations of stellar winds with low metallicity because in the WDs of the present paper, the abundances of light metals are well subsolar. These investigations aimed at stars with low metallicity in the early Universe or even at the first stars which, in late evolutionary phases, have CNO driven winds (Krtička et al. 2010). For example, for a massive star with = 40 000 K and 0.001 solar metallicity, Krtička et al. (2003) find a strong increase in temperature of the photon absorbing ions to T 200 000 K close to the stellar surface (1.14 stellar radii), while the non-absorbing bulk component (hydrogen and helium) remains at temperatures below K. It is predicted, that the bulk material either forms clouds around the star or falls back to the stellar surface. We may speculate that the too-deep optical H and He ii lines in our WDs are caused by relatively cool gas in such a circumstellar static cloud, while the uhe lines form in the same region but originate from the frictionally heated metal ions, which were accelerated to develop a superhot high-velocity wind. A possible scenario of pure metallic winds with hydrostatic H and He at log() has been discussed in the context of subdwarf B stars (Unglaub 2008) and this could be relevant in the superionized wind WDs as well.
Systematic studies of multicomponent wind models for hot white dwarfs are necessary to check the possibility of whether the hot-wind phenomenon is indeed caused by frictional heating in radiatively driven winds. In a first study presented by Krtička & Kubát (2005) it can be seen, that a cooling white dwarf crosses a narrow strip in the – diagram where frictionally heated winds occur. The strip edge at low temperature is defined by the complete decoupling of the metallic wind from the bulk H+He matter, while the strip edge at high temperature results from the transition to chemically homogeneous winds because of high mass-loss rates. This strip could explain the fact that the hot-wind WD phenomenon is restricted to WDs in the range = 65 000–120 000 K. Such a systematic study could also answer the question why this phenomenon predominantly affects helium-dominated WDs, while only one affected (He/C/O-dominated) PG1159 star and one H-rich WD are known.
We close by mentioning that the first example of a star with a fractionated wind is the Bp star Ori E (Groote & Hunger 1997). This star is an oblique magnetic rotator whose field supports two corotating circumstellar clouds, fed by the photospheric wind, and located at the intersections of the magnetic and rotational equators. The gas temperature in the clouds is similar to the stellar effective temperature and the clouds are opaque in the lines and continuum (Smith & Bohlender 2007), as derived from variations of high-level Balmer lines first discussed by Groote & Hunger (1976, 1977). The gas further expands into an outer, rotational-phase independent, coronal wind and, according to Havnes & Goertz (1984), could attain temperatures of K. We may speculate that such a rigidly rotating magnetosphere model with an ambient, very hot coronal wind might be related to the uhe lines in the WDs discussed in the present paper.
Ori E is variable, both spectroscopically and photometrically. The period of about 1.19 days (Hesser et al. 1976; Pedersen & Thomsen 1977) today is explained to be the rotation velocity of the star and light variations are considered as due to star spots (see the most recent analysis of Oksala et al. 2015). In fact, it is intriguing that the Catalina Sky Survey found the uhe DO HS 0727+6003 (discussed in Sect. 5.4) to be variable in light with a period of 0.284 days and a photometric amplitude of 0.14 mag (Drake et al. 2014). This short period could well be the rotation period implying that the star may be spotted as well. In fact, Reindl et al. (in prep.) reported both spectral and photometric variability of uhe DOs.
Acknowledgements.
We thank R. Napiwotzki for putting the SPY survey spectra at our disposal. T. Rauch was supported by the German Aerospace Center (DLR) under grant 50 OR 1507. The TMAD service (http://astro.uni-tuebingen.de/~TMAD) used to compile atomic data for this paper and the TIRO service (http://astro.uni-tuebingen.de/~TIRO), used to generate the model atoms for the iron-group elements, were constructed as part of the activities of the German Astrophysical Virtual Observatory. This research has made use of the SIMBAD database, operated at CDS, Strasbourg, France, and of NASA’s Astrophysics Data System Bibliographic Services. Some of the data presented in this paper were obtained from the Mikulski Archive for Space Telescopes (MAST). This work had been carried out using the profile fitting procedure OWENS developed by M. Lemoine and the FUSE French Team.References
- Allard et al. (2001) Allard, F., Hauschildt, P. H., Alexander, D. R., Tamanai, A., & Schweitzer, A. 2001, ApJ, 556, 357
- Aller et al. (1982) Aller, L. H., Appenzeller, I., Baschek, B., et al., eds. 1982, Landolt-Börnstein: Numerical Data and Functional Relationships in Science and Technology - New Series “ Gruppe/Group 6 Astronomy and Astrophysics ” Volume 2 Schaifers/Voigt: Astronomy and Astrophysics / Astronomie und Astrophysik “ Stars and Star Clusters / Sterne und Sternhaufen
- Althaus et al. (2009) Althaus, L. G., Panei, J. A., Miller Bertolami, M. M., et al. 2009, ApJ, 704, 1605
- Anderson (1989) Anderson, L. S. 1989, ApJ, 339, 558
- Asplund et al. (2009) Asplund, M., Grevesse, N., Sauval, A. J., & Scott, P. 2009, ARA&A, 47, 481
- Barstow et al. (2014) Barstow, M. A., Barstow, J. K., Casewell, S. L., Holberg, J. B., & Hubeny, I. 2014, MNRAS, 440, 1607
- Bashkin & Stoner (1975) Bashkin, S. & Stoner, J. O. 1975, Atomic energy levels and Grotrian Diagrams - Vol.1: Hydrogen I - Phosphorus XV; Vol.2: Sulfur I - Titanium XXII
- Cartledge et al. (2005) Cartledge, S. I. B., Clayton, G. C., Gordon, K. D., et al. 2005, ApJ, 630, 355
- Dere et al. (1997) Dere, K. P., Landi, E., Mason, H. E., Monsignori Fossi, B. C., & Young, P. R. 1997, A&AS, 125, 149
- Drake et al. (2014) Drake, A. J., Graham, M. J., Djorgovski, S. G., et al. 2014, ApJS, 213, 9
- Dreizler et al. (1995) Dreizler, S., Heber, U., Napiwotzki, R., & Hagen, H. J. 1995, A&A, 303, L53
- Gianninas et al. (2010) Gianninas, A., Bergeron, P., Dupuis, J., & Ruiz, M. T. 2010, ApJ, 720, 581
- Good et al. (2005) Good, S. A., Barstow, M. A., Burleigh, M. R., et al. 2005, MNRAS, 363, 183
- Groote & Hunger (1976) Groote, D. & Hunger, K. 1976, A&A, 52, 303
- Groote & Hunger (1977) Groote, D. & Hunger, K. 1977, A&A, 56, 129
- Groote & Hunger (1997) Groote, D. & Hunger, K. 1997, A&A, 319, 250
- Hamann et al. (1982) Hamann, W.-R., Schönberner, D., & Heber, U. 1982, A&A, 116, 273
- Havnes & Goertz (1984) Havnes, O. & Goertz, C. K. 1984, A&A, 138, 421
- Hébrard et al. (2002) Hébrard, G., Friedman, S. D., Kruk, J. W., et al. 2002, Planet. Space Sci., 50, 1169
- Hébrard & Moos (2003) Hébrard, G. & Moos, H. W. 2003, ApJ, 599, 297
- Hesser et al. (1976) Hesser, J. E., Walborn, N. R., & Ugarte, P. P. 1976, Nature, 262, 116
- Hoyer et al. (2017) Hoyer, D., Rauch, T., Werner, K., Kruk, J. W., & Quinet, P. 2017, A&A, 598, A135
- Hügelmeyer et al. (2006) Hügelmeyer, S. D., Dreizler, S., Homeier, D., et al. 2006, A&A, 454, 617
- Jeffery & Hamann (2010) Jeffery, C. S. & Hamann, W.-R. 2010, MNRAS, 404, 1698
- Krtička & Kubát (2001) Krtička, J. & Kubát, J. 2001, A&A, 377, 175
- Krtička & Kubát (2005) Krtička, J. & Kubát, J. 2005, in Astronomical Society of the Pacific Conference Series, Vol. 334, 14th European Workshop on White Dwarfs, ed. D. Koester & S. Moehler, 337
- Krtička et al. (2016) Krtička, J., Kubát, J., & Krtičková, I. 2016, A&A, 593, A101
- Krtička et al. (2003) Krtička, J., Owocki, S. P., Kubát, J., Galloway, R. K., & Brown, J. C. 2003, A&A, 402, 713
- Krtička et al. (2010) Krtička, J., Votruba, V., & Kubát, J. 2010, A&A, 516, A100
- Kurucz (1991) Kurucz, R. L. 1991, in NATO ASIC Proc. 341: Stellar Atmospheres - Beyond Classical Models, ed. L. Crivellari, I. Hubeny, & D. G. Hummer, 441
- Kurucz (2009) Kurucz, R. L. 2009, in American Institute of Physics Conference Series, Vol. 1171, American Institute of Physics Conference Series, ed. I. Hubeny, J. M. Stone, K. MacGregor, & K. Werner, 43
- Kurucz (2011) Kurucz, R. L. 2011, Canadian Journal of Physics, 89, 417
- Landi et al. (2013) Landi, E., Young, P. R., Dere, K. P., Del Zanna, G., & Mason, H. E. 2013, ApJ, 763, 86
- Lemoine et al. (2002) Lemoine, M., Vidal-Madjar, A., Hébrard, G., et al. 2002, ApJS, 140, 67
- Napiwotzki (1997) Napiwotzki, R. 1997, in The Third Conference on Faint Blue Stars, ed. A. G. D. Philip, J. Liebert, R. Saffer, & D. S. Hayes, 207
- Napiwotzki et al. (2003) Napiwotzki, R., Christlieb, N., Drechsel, H., et al. 2003, The Messenger, 112, 25
- Napiwotzki & Rauch (1994) Napiwotzki, R. & Rauch, T. 1994, A&A, 285, 603
- Oksala et al. (2015) Oksala, M. E., Kochukhov, O., Krtička, J., et al. 2015, MNRAS, 451, 2015
- Pedersen & Thomsen (1977) Pedersen, H. & Thomsen, B. 1977, A&AS, 30, 11
- Rauch & Deetjen (2003) Rauch, T. & Deetjen, J. L. 2003, in Astronomical Society of the Pacific Conference Series, Vol. 288, Stellar Atmosphere Modeling, ed. I. Hubeny, D. Mihalas, & K. Werner, 103
- Rauch et al. (2017) Rauch, T., Gamrath, S., Quinet, P. Löbling, L., et al. 2017, A&A, 599, A142
- Reindl et al. (2014a) Reindl, N., Rauch, T., Werner, K., et al. 2014a, A&A, 572, A117
- Reindl et al. (2014b) Reindl, N., Rauch, T., Werner, K., Kruk, J. W., & Todt, H. 2014b, A&A, 566, A116
- Seaton et al. (1994) Seaton, M. J., Yan, Y., Mihalas, D., & Pradhan, A. K. 1994, MNRAS, 266, 805
- Smith & Bohlender (2007) Smith, M. A. & Bohlender, D. A. 2007, A&A, 475, 1027
- Sofia et al. (2005) Sofia, U. J., Wolff, M. J., Rachford, B., et al. 2005, ApJ, 625, 167
- Springmann & Pauldrach (1992) Springmann, U. W. E. & Pauldrach, A. W. A. 1992, A&A, 262, 515
- Unglaub (2006) Unglaub, K. 2006, Baltic Astronomy, 15, 147
- Unglaub (2008) Unglaub, K. 2008, A&A, 486, 923
- Unglaub & Bues (2000) Unglaub, K. & Bues, I. 2000, A&A, 359, 1042
- Voigt (2012) Voigt, H.-H. 2012, Abriss der Astronomie. 6. Auflage, Wiley-VCH
- Werner (1996) Werner, K. 1996, ApJ, 457, L39
- Werner et al. (2003a) Werner, K., Deetjen, J. L., Dreizler, S., et al. 2003a, in Astronomical Society of the Pacific Conference Series, Vol. 288, Stellar Atmosphere Modeling, ed. I. Hubeny, D. Mihalas, & K. Werner, 31
- Werner & Dreizler (1999) Werner, K. & Dreizler, S. 1999, Journal of Computational and Applied Mathematics, 109, 65
- Werner et al. (1997a) Werner, K., Dreizler, S., Heber, U., & Rauch, T. 1997a, in Astrophysics and Space Science Library, Vol. 214, White dwarfs, ed. J. Isern, M. Hernanz, & E. Garcia-Berro, 207
- Werner et al. (1995) Werner, K., Dreizler, S., Heber, U., et al. 1995, A&A, 293, L75
- Werner et al. (2003b) Werner, K., Dreizler, S., Kruk, J. W., & Sitko, M. L. 2003b, in NATO ASIB Proc. 105: White Dwarfs, ed. D. de Martino, R. Silvotti, J.-E. Solheim, & R. Kalytis, Vol. 105, 171
- Werner et al. (2012) Werner, K., Dreizler, S., & Rauch, T. 2012, TMAP: Tübingen NLTE Model-Atmosphere Package, Astrophysics Source Code Library
- Werner et al. (1999) Werner, K., Dreizler, S., Rauch, T., et al. 1999, in Astronomical Society of the Pacific Conference Series, Vol. 169, 11th European Workshop on White Dwarfs, ed. S.-E. Solheim & E. G. Meistas, 511
- Werner et al. (1997b) Werner, K., Dreizler, S., Rauch, T., & Heber, U. 1997b, in The Third Conference on Faint Blue Stars, ed. A. G. D. Philip, J. Liebert, R. Saffer, & D. S. Hayes, 227
- Werner et al. (2014) Werner, K., Rauch, T., & Kepler, S. O. 2014, A&A, 564, A53
- Werner et al. (2015) Werner, K., Rauch, T., & Kruk, J. W. 2015, A&A, 582, A94
- Werner et al. (2017) Werner, K., Rauch, T., & Kruk, J. W. 2017, A&A, 601, A8
- Ziegler et al. (2012) Ziegler, M., Rauch, T., Werner, K., Köppen, J., & Kruk, J. W. 2012, A&A, 548, A109