A Relationship between the Solar Rotation and Activity Analysed by Tracing Sunspot Groups
keywords:
differential rotation sunspot groups activity cycle1 Introduction
Solar activity manifests itself as many diverse phenomena (sunspots, flares, coronal mass ejections, etc.) which vary on several distinct timescales. The most prominent manifestation of solar activity is the 11 year Schwabe cycle. Extensive reviews on the long-term behaviour of the solar activity and the Schwabe cycle are given by Hathaway (2010) and Usoskin (2017).
It is generally accepted that the solar cycle is magnetic in nature and generated by dynamo processes within the Sun. The Sun’s magnetic field is maintained by its interaction with plasma motions, i.e., differential rotation of the convective zone. The physical processes underlying the complex magnetohydrodynamical system are still not fully understood and a large number of dynamo models have been considered. An extensive review of solar-dynamo models is given by Cameron, Dikpati, and Brandenburg (2016). Precise measurements of the solar differential rotation, its variations, and its correlation with the solar activity give important observational constraints on the modelling of the solar dynamo.
The determination of the solar differential rotation has been performed by many authors using various methods. Most often sunspots and sunspot groups have been used as tracers because they are well-defined structures with sufficient lifetime and long series of observations are available. Their disadvantages are complex structure and evolution, limb-effects and narrow latitudinal distribution. Most extensively, the Greenwich Photoheliographic Results (GPR) were used, e.g., by Newton and Nunn (1951), Balthasar, Vazquez, and Wöhl (1986), Brajša et al. (2002), Ruždjak et al. (2005), among many others. The GPR data were often extended by US Air Force Solar Optical Observing Network and National Oceanographic and Atmospheric Administration (USAF/NOAA) data (Pulkkinen and Tuominen, 1998; Zuccarello and Zappalá, 2003; Ruždjak et al., 2004; Brajša, Ruždjak, and Wöhl, 2006; Sudar et al., 2014; Javaraiah and Bertello, 2016). Besides GPR and USAF/NOAA sunspot data, a number of other datasets were also frequently used, e.g., the Mt. Wilson dataset (Howard, Gilman, and Gilman, 1984; Gilman and Howard, 1984) which consists from the areas and positions of the sunspots measured on the white-light photographs of the Sun taken with the 30-cm diameter lens at the Tower Telescope at Mt. Wilson Observatory, Kodaikanal data (Gupta, Sivaraman, and Howard, 1999), Kanzelhöhe data (Lustig, 1983; Poljančić Beljan et al., 2014; Poljančić-Beljan et al., 2017) and Debrecen Photoheliographic Data (DPD) (Sudar et al., 2017). Apart from sunspots and sunspot groups, other data were used for determination of solar differential rotation: for instance, Doppler shifts (Howard, 1976), coronal holes (Nash, Sheeley, and Wang, 1988), faculae (Meunier, Nesme-Ribes, and Collin, 1997), H filaments (Brajša et al., 1997), global magnetic fields (Obridko and Shelting, 2001), helioseismology (Howe et al., 2000; Antia and Basu, 2001; Komm, Howe, and Hill, 2017), solar radio emission (Li et al., 2012), coronal bright points (CBP) (Wöhl et al., 2010; Sudar et al., 2015, 2016), and coronal green line emmision (Rybak, 1994; Badalyan and Obridko, 2017).
The inferred solar rotation was often analysed for long-term changes or changes within a cycle (see, e.g., Howard, 1976; Gilman and Howard, 1984; Gupta, Sivaraman, and Howard, 1999). More recently Brajša, Ruždjak, and Wöhl (2006), using rotation-rate residuals calculated from sunspot groups, found secular deceleration of rotation and faster rotation at the minimum than at the maximum of the solar cycle. Jurdana-Šepić et al. (2011), using rotation rates obtained by tracing CBP, investigated a relationship between the solar-rotation parameters and solar activity expressed by the sunspot number, and they found a significant correlation for parameter and a small, statistically insignificant, negative correlation for differential-rotation parameter . Li et al. (2014) revisited already published solar-rotation data obtained from H charts and sunspots and confirmed the secular deceleration and negative correlation between the differential-rotation parameter and solar activity. Most recently, Badalyan and Obridko (2017) analysed the coronal green-line data from 1943 up to the present and found that the equatorial rotation rate increases in the epochs of minimum between the even and odd-numbered solar cycles and reaches its minimum between the odd and even cycles, and that the differential gradient increases in the even cycles, with its largest values near the maximum of the activity cycle. On the other hand, theoretical calculations (Brun, 2004; Brun, Miesch, and Toomre, 2004; Lanza, 2006, 2007) predict that the Sun should rotate more rigidly at the maximum than at the minimum of activity.
To gain insight into these discrepancies between the observations and theoretical predictions, in this work we examine the relationship between solar activity and differential-rotation parameters determined from the sunspot-group position data from GPR, USAF/NOAA, and DPD in the period from 1874 to 2016. The sunspot-group position data were used to calculate yearly differential-rotation parameters and the obtained parameters are then compared with the solar activity. Further, during 2011 – 2014 a series of four workshops was organized with the goal of providing a community-vetted time series of sunspot numbers for use in long-term studies (Cliver, Clette, and Svalgaard, 2013; Cliver et al., 2015). This effort resulted in recalibration of sunspot and group numbers (Clette et al., 2014, 2015, 2016). The revised sunspot numbers are used as a measure of solar activity in this work.
2 Data and Reduction
In this work the sunspot-group data from GPR (1874 – 1976), USAF/NOAA Sunspot Data, and DPD (Baranyi, Győri, and Ludmány, 2016; Győri, Ludmány, and Baranyi, 2017) sunspot database (1977 – 2016) were used. Our own GPR digital dataset was used, while USAF/NOAA and DPD data were downloaded from their websites (solarscience.msfc.nasa.gov/greenwch.shtm and fenyi.solarobs.csfk.mta.hu/DPD/, respectively). The given daily positions of the sunspot groups have been used to obtain the rotational velocities. For the groups for which the central meridian distance (CMD) was less than 58∘, which corresponds to about 0.85 of projected solar radius (see Balthasar, Vazquez, and Wöhl, 1986), the rotation rate was calculated by division of CMD differences by elapsed time. The obtained synodic rotation velocities were then transformed to sidereal ones by the procedure described by Roša et al. (1995), Brajša et al. (2002) and Skokić et al. (2014). Finally the sidereal rotation velocities amounting to less than 8∘ day-1 and exceeding 19∘ day-1 have been regarded as erroneous and have not been considered in the analysis. The constraints described left 92,762 rotation velocities (out of 161,714 sunspot position data) obtained from GPR, 58,219 rotation velocities (out of 106,981) and 48,814 (out of 84,449) for the DPD and USAF/NOAA sunspot databases respectively.
The solar differential rotation is usually represented by
| (1) |
where is the sidereal angular rotation velocity, is the heliographic latitude and , , are differential-rotation parameters. Because of the latitudinal distribution of sunspots, the last term can be neglected when using sunspot motions to derive the parameters, i.e., . Differential-rotation parameters and were obtained by fitting the resulting equation to all points in the data set. The results for individual datasets are presented in Table \irefrotpar. The parameters and were also calculated separately for each year in the timespan of the datasets (1874 – 2016). Data from both of the solar hemispheres were treated together to give a statistically significant number of data points for the determination of differential-rotation coefficients in the years near minimum of activity.
The solar-activity data (total sunspot number) were taken from WDC-SILSO (sidc.oma.be/silso/), Royal Observatory of Belgium, Brussels. The version 2.0 of the data containing a new entirely revised data series, available since 1 July 2015, was used. The yearly mean total sunspot number, obtained by taking a simple arithmetic mean of the daily total sunspot number over all of the days of one year, was taken as the measure for the solar activity of a given year.
| Timespan | [∘ day-1] | [∘ day-1] | Dataset |
|---|---|---|---|
| 1874-1976 | 14.5280.006 | -2.770.05 | 1 |
| 1977 – 2016* | 14.440.01 | -2.540.08 | 2 |
| 1977 – 2016 | 14.4030.009 | -2.440.08 | 3 |
| 1874 – 2016* | 14.5010.005 | -2.710.05 | 4 |
| 1874 – 2016 | 14.4830.005 | -2.670.05 | 5 |
3 Results
3.1 Secular Changes of the Solar Rotation and Activity
changessec
For illustration of the secular changes of solar rotation and activity, we present in Figure \irefaintime the yearly values of the differential-rotation coefficient (equatorial rotation velocity) together with the yearly mean total sunspot number. Rotation rates are denoted with circles and mean sunspot numbers with asterisks. The lines represent the linear fits to the data in the 1880 to 2016 period. Only the GPR and DPD rotation data are shown. During the last 150 years, on average, solar activity was growing, reaching its maximum in the second half of the 20th century and has been decreasing since. This can be noted by examining the amplitude (strength) of the maxima of Solar Cycles 12 – 24, which are represented by the yearly mean total sunspot numbers in the lower part of Figure \irefaintime. This increase/decrease would be monotonic, but the strength of the Cycle 14, 16, and 20 maxima are too low to support this interpretation. On the other hand, the solar equatorial rotation shows a steady decrease during this period. The exceptions are the data for first six years (1874 – 1879), whose values (except 1878) are systematically lower than the rest of the data. Those data (circled points in the left side Figure \irefaintime) were excluded from the calculation of the secular trend. Linear fits give for the increase of activity 0.20.1 year-1 and -0.00140.0003∘ day-1 year-1 between 1880 and 2016 and -0.00120.0003∘ day-1 year-1 for 1880 – 2013 for the decrease of the equatorial rotation rate. The obtained value is the same as the values obtained by Brajša, Ruždjak, and Wöhl (2006) for rotation rate residuals and by Li et al. (2014) for comparison of previous results for different methods and data sets.
It is worth pointing out that the equatorial rotation-velocity minimum in 2014 – 2016 (circled points in the right side of Figure \irefaintime) is not present in the USAF/NOAA data. In fact the USAF/NOAA data give a rise of equatorial rotation of 0.0040.002∘ day-1 year-1, for the 1977 – 2016 interval, but it has suspicious small values of the coefficient for the first two years (1977 – 1978). These results show how difficult it can be to determine the secular trend when it is ”obscured” by the cycle-related variations. It is unfortunate that all of the datasets have some extreme points near the edges. Besides the suspiciously low values at the beginning, due to cycle-related variations the GPR dataset has its maximal yearly value of 14.900.15∘ day-1 near the end of observing period (1965), which also makes the determination of the secular trend more complicated. To work around this problem, besides omitting the suspicious points, all further analyses are made by taking into account the errors of yearly values of solar differential-rotation parameters. The results are similar if the ”problematic” points are omitted or all data are considered, but with errors taken into account. Similar deceleration is obtained (-0.00160.0002∘ day-1 year-1) for 1874 – 2016 when the errors are considered. Individual sets yield: -0.00070.0003∘ day-1 year-1 (GPR 1874 – 1976),-0.00070.0010∘ day-1year-1 (DPD 1977 – 2016), and 0.0040.001∘ day-1year-1 (USAF/NOAA 1977 – 2016). These results indicate that the secular decrease of the rotation velocity stopped sometime in the second half of 20th century.
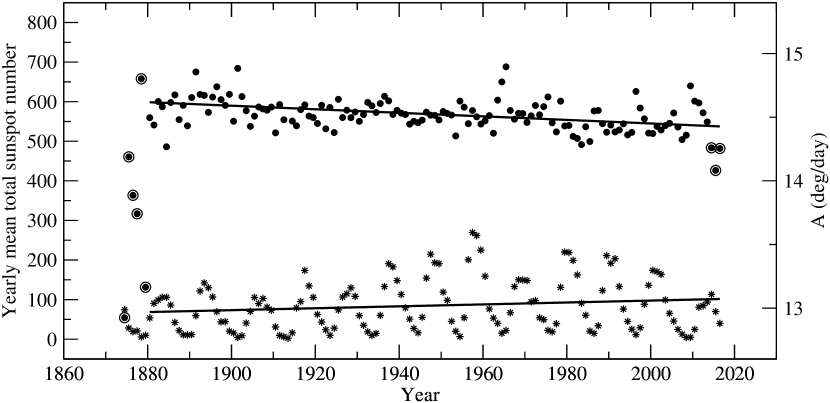
It was mentioned that the maximal equatorial rotation rate was observed in 1965. The peak of equatorial rotation is observed during the minimum of Solar Cycle 20. The (weighted) mean value of equatorial rotation during minimum (14.690.05, 1963 – 65) is significantly (2) higher than the value for the preceding and following years (14.470.03, 1960 – 62 and 14.520.03, 1966 – 68). The similar value of 14.880.18∘ day-1 was observed during minimum of Solar Cycle 14. It can be noted in Figure \irefaintime that Solar Cycles 14 and 20 have a smaller amplitude than ”expected” (smaller than what is needed for the envelope to be monotonic). Similar peaks of rotation velocity are visible for Cycles 23 and 24 but the peak is not observed for Cycle 16 (although there is 0.25∘ day-1 jump during the previous minimum). Therefore, it can be concluded that if the peak of the equatorial rotation velocity is observed during minimum, the following maximum is weaker than the previous one.
The secular variation of the differential-rotation parameter is shown in upper panel of Figure \irefBintime.
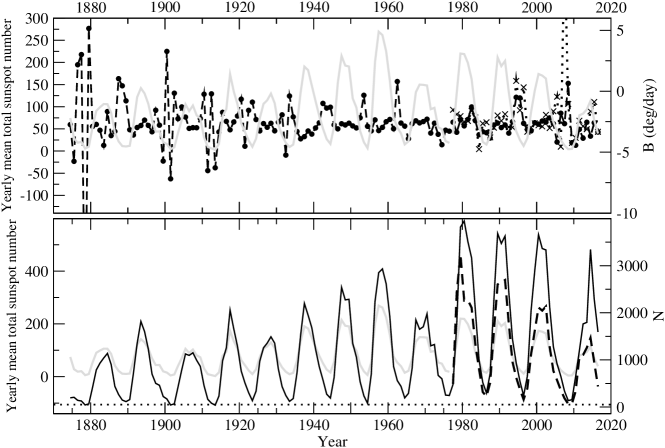
By inspection of the figure it is hard to see any correlation between the changes of solar activity and differential-rotation parameter . During the maximum of activity has values near to its average value, while it oscillates during the solar-activity minima. This behaviour is due to the small number of data in years near minimum. This is illustrated in the lower panel of the figure where the total number of data is shown. It can be seen that in some solar minima this number is lower than 50 (dotted-horizontal line in the figure). In Table \irefminmax the values for differential-rotation parameters for several minima and maxima are presented. Inspecting the values in the table two conclusions can be drawn. First, the values of equatorial rotation velocity are on the average higher at the minimum than at the maximum of activity (weighted means are 14.570.04∘ day-1 and 14.440.02∘ day-1, for the minimum and maximum of activity, respectively, which is above the 2 level). Second, about 50 % of the values for differential-rotation parameter in the years near minimum of activity have large errors. In the analysis of such a dataset it is vital that errors of individual values are considered.
Finally we would like to draw attention to the differential-rotation parameters for individual sets presented in Table \irefrotpar. The equatorial rotation velocity from GPR is significantly higher than the one in USAF/NOAA and DPD data. The difference between USAF/NOAA and DPD is (just 0.001∘ day-1) inside the 2 range. The absolute value of the parameter for the GPR data is 2 larger than the value for DPD and 1.77 larger than the value for the USAF/NOAA, while DPD and USAF/NOAA have values within 1. This means that the equatorial rotation rate is on average larger during 1874- 1976 than in the 1977 – 2016 period and maybe the Sun rotated more differentially in the earlier epoch.
| minimum | maximum | |||||||
|---|---|---|---|---|---|---|---|---|
| Year | Year | |||||||
| 1878 | 14.800.39 | -2019 | 43 | 1884 | 14.270.07 | -1.71.2 | 1138 | 1 |
| 1890 | 14.650.24 | -3.21.5 | 158 | 1893 | 14.670.04 | -2.80.4 | 1817 | 1 |
| 1902 | 14.660.29 | -0.22.2 | 68 | 1906 | 14.580.06 | -3.10.8 | 1096 | 1 |
| 1986 | 14.550.10 | -2.50.9 | 226 | 1989 | 14.380.05 | -2.00.4 | 2602 | 2 |
| 1986 | 14.550.08 | -3.40.8 | 297 | 1989 | 14.380.04 | -2.60.3 | 3685 | 3 |
| 1996 | 14.470.14 | 0.31.6 | 158 | 2000 | 14.490.05 | -2.80.4 | 2113 | 2 |
| 1996 | 14.700.09 | -2.61.2 | 238 | 2000 | 14.370.04 | -2.70.3 | 3658 | 3 |
| 2008 | 14.630.27 | -1.01.9 | 66 | 2014 | 14.460.05 | -1.70.7 | 1467 | 2 |
| 2008 | 14.360.15 | 0.61.1 | 137 | 2014 | 14.260.05 | -3.70.6 | 3344 | 3 |
3.2 Correlation Between Solar Activity and Rotation
In Figure \irefcornoaa the dependence of solar differential-rotation parameters on yearly mean total sunspot number is presented. The USAF/NOAA dataset, which has the highest correlation, is shown. Solid lines represent the least-square fits. To account for the errors of the solar differential-rotation parameters the data were fitted using an implementation of the least-squares Marquardt–Levenberg algorithm. The results of fits for the different datasets are summarized in Table \ireffits. As expected, the most significant values are obtained for the set with the highest correlation. The results, although not statistically significant for all datasets, show negative correlation between solar equatorial rotation rate and solar activity. The results for differential-rotation parameter are different for the various datasets. The GPR data result in an insignificant negative trend, while the data from USAF/NOAA and DPD result in a positive correlation with 2 statistical significance. Note that the values of are negative, so the positive correlation means a smaller absolute value during the maximum of activity. The results could imply that the correlation of differential-rotation parameter has changed. In the period 1977 – 2016 there is a positive correlation between differential-rotation parameter (significant on 2 level) and there is an (insignificant) negative correlation during 1874 – 1976. When the sets are combined the more numerous GPR dataset prevails.


| Dataset | slope (YMTSN) [10 day-1] | slope(YMTSN) [10 day-1] |
|---|---|---|
| 1 | -0.10.1 | -1.60.9 |
| 2 | -0.60.2 | 3.01.5 |
| 3 | -0.20.2 | 3.41.7 |
| 4 | -0.30.1 | -0.60.8 |
| 5 | -0.20.1 | -0.20.8 |
4 Discussion and Conclusion
Our results show that the Sun rotates faster at low latitudes and more differentially at the minimum than at the maximum of activity. This result is in agreement with the result of Eddy, Gilman, and Trotter (1976) who measured solar surface rotation from sunspot drawings during Maunder minimum and found that solar equatorial rotation was 3- 4 % faster than today and that the differential rotation between Equator and latitudes of 20∘ was about three times larger. However, Abarbanell and Wöhl (1981) using two original prints of Hevelius’ book, while Eddy, Gilman, and Trotter (1976) used a copy, found that the solar rotation was at the same level as today. The gradient of the differential rotation was found to be slightly steeper and not significantly different. More pronounced differential rotation during the Maunder minimum was also found by Ribes and Nesme-Ribes (1993). Here, both secular and cycle-related changes of equatorial rotation rate that are anticorrelated with solar activity were found. This is not so clear for the differential-rotation parameter where no secular changes were found. The larger average rotation velocities in minimum than in other phases of cycle, i.e., inverse correlation between solar equatorial-rotation rate and activity, was found by many authors using different methods and data (Lustig, 1983; Gilman and Howard, 1984; Balthasar, Vazquez, and Wöhl, 1986; Gupta, Sivaraman, and Howard, 1999; Zuccarello and Zappalá, 2003; Brajša, Ruždjak, and Wöhl, 2006; Jurdana-Šepić et al., 2011; Li et al., 2014; Badalyan and Obridko, 2017).
Brun (2004) numerically modelled the interaction of convection and rotation with magnetic field in deep spherical shells and found that the increase of magnetic field would result in the reduction of differential rotation. The reduction of differential rotation is due to the braking effect exerted by non-axisymmetric magnetic fields. This means that in the presence of strong magnetic fields net transport of angular momentum towards the Equator is less efficient. A similar result was obtained by Lanza (2006, 2007) by analytically solving the angular momentum transport equation within the convection zone of a rotating star. This provides the explanation of the observed effect. At the minimum of activity when the magnetic field is weaker, the angular momentum is transported more efficiently towards the Equator, which results in the observed increased equatorial rotation and more pronounced differential rotation at the minimum of activity.
The changes of the differential-rotation profile (differential-rotation parameter ) are much harder to detect than the changes of equatorial rotation. Jurdana-Šepić et al. (2011) analysed relationship between solar activity and differential-rotation parameters obtained by tracing CBPs. They found inverse correlation of equatorial rotation rate with several times larger slope then obtained here and no significant correlation between parameter and activity. They attributed the lack of correlation for parameter to the errors of their data, which are more pronounced at high latitudes. The reduction of differential rotation in this work is detected (at the two- level) in the 1977 – 2016 period, but not in the 1874 – 1976 epoch. This is most probably due to the errors, which are more pronounced at the beginning of the dataset where the amount of available data in years near minima is low. Badalyan and Obridko (2017) examined the 22-year cycle of differential rotation and the rule of Genevyshev–Ohl by using the green coronal line brightness data from 1943 onward and obtained a result consistent with inverse correlation of both differential-rotation parameters and activity (see Figures 3 and 4 in Badalyan and Obridko, 2017). Their finding of larger increases of equatorial rotation velocity between even and odd cycle than between odd and even is not visible in our data (see Figure \irefaintime). They did not find the difference between even and odd-cycle variation of differential-rotation parameter and their results show that the differential rotation is strongest just before maximum and weakest somewhere in between minimum and maximum of activity. A similar result, although with much smaller statistical significance, is obtained in the GPR data. However, both amplitude and phase of the curve depend on the sampling, i.e., how the phase of the cycle was chosen.
On examining the strength of solar maxima, it was noted that if the peak of equatorial rotation velocity is observed during minimum, then the next maximum is weaker than the preceding one. The solar activity is high for 1950 – 2000, which can be regarded as the modern grand maximum of solar activity (Usoskin, 2017). If the magnetic energy were to exceed about 20 % of the total kinetic energy, Maxwell stresses and magnetic torques may become strong enough to suppress the differential rotation almost entirely (Brun, Miesch, and Toomre, 2004, and references therein). This is not observed, so the Sun must have ways of avoiding this by expelling some of its magnetic flux. The observed stronger peaks of equatorial rotational velocity might be a signature of such a process. The most significant such event is observed during the minimum following the maximum of the Solar Cycle 19, which was the strongest one in the studied epoch. Cycle 20 is much weaker than the three previous and three following cycles, as if magnetic energy was expelled or consumed. No significant change of differential-rotation parameter can be observed accompanying the event.
Main result of our investigation is the finding that the Sun rotates more differentially at the minimum than at the maximum of activity during the 1977 – 2016 epoch. This is in agreement with theoretical predictions of reduced differential rotation in the presence of strong magnetic fields. Inverse correlation between equatorial rotation and solar activity was found by many authors before and is corroborated here regardless of the recent revision of sunspot number. The secular decrease of rotation velocity accompanying the increase of activity stopped in the last part of the 20th century when solar activity started to decrease. It was noted that when the significant peak of equatorial rotation velocity is observed during minimum of activity the strength of next maximum is smaller then the previous one. It was suggested that this finding might be connected to a decrease of the magnetic energy of the Sun.
Acknowledgments
The authors wish to thank Hubertus Wöhl for useful sugestions and careful reading of the manuscript. We acknowledge the staff of Royal Observatory of Belgium, Brussels and the staff of Heliophysical Observatory, Debrecen, Hungary for maintaining and organizing the WDC-SILSO and DPD databases, respectively. This work was partly supported by the Croatian Science Foundation under the project 6212 ”Solar and Stellar Variability”, and in part by the University of Rijeka under project number 13.12.1.3.03.
Disclosure of Potential Conflicts of Interest
The authors declare that they have no conflicts of interest.
References
- Abarbanell and Wöhl (1981) Abarbanell, C., Wöhl, H.: 1981, Solar Rotation Velocity as Determined from Sunspot Drawings of Hevelius, J. in the 17th-Century. Sol. Phys. 70, 197. DOI. ADS.
- Antia and Basu (2001) Antia, H.M., Basu, S.: 2001, Temporal Variations of the Solar Rotation Rate at High Latitudes. ApJ 559, L67. DOI. ADS.
- Badalyan and Obridko (2017) Badalyan, O.G., Obridko, V.N.: 2017, 22-year cycle of differential rotation of the solar corona and the rule by Gnevyshev-Ohl. MNRAS 466, 4535. DOI. ADS.
- Balthasar, Vazquez, and Wöhl (1986) Balthasar, H., Vazquez, M., Wöhl, H.: 1986, Differential rotation of sunspot groups in the period from 1874 through 1976 and changes of the rotation velocity within the solar cycle. A&A 155, 87. ADS.
- Baranyi, Győri, and Ludmány (2016) Baranyi, T., Győri, L., Ludmány, A.: 2016, On-line Tools for Solar Data Compiled at the Debrecen Observatory and Their Extensions with the Greenwich Sunspot Data. Sol. Phys. 291, 3081. DOI. ADS.
- Brajša, Ruždjak, and Wöhl (2006) Brajša, R., Ruždjak, D., Wöhl, H.: 2006, Temporal Variations of the Solar Rotation Determined by Sunspot Groups. Sol. Phys. 237, 365. DOI. ADS.
- Brajša et al. (2002) Brajša, R., Wöhl, H., Vršnak, B., Ruždjak, D., Sudar, D., Roša, D., Hržina, D.: 2002, Differential Rotation of Stable Recurrent Sunspot Groups. Sol. Phys. 206, 229. DOI. ADS.
- Brajša et al. (1997) Brajša, R., Ruždjak, V., Vršnak, B., Pohjolainen, S., Urpo, S., Schroll, A., Wöhl, H.: 1997, On the Possible Changes of the Solar Differential Rotation during the Activity Cycle Determined Using Microwave Low-Brightness Regions and H Filaments as Tracers. Sol. Phys. 171, 1. DOI. ADS.
- Brun (2004) Brun, A.S.: 2004, On the interaction between differential rotation and magnetic fields in the Sun. Sol. Phys. 220, 333. DOI. ADS.
- Brun, Miesch, and Toomre (2004) Brun, A.S., Miesch, M.S., Toomre, J.: 2004, Global-Scale Turbulent Convection and Magnetic Dynamo Action in the Solar Envelope. ApJ 614, 1073. DOI. ADS.
- Cameron, Dikpati, and Brandenburg (2016) Cameron, R.H., Dikpati, M., Brandenburg, A.: 2016, The Global Solar Dynamo. Space Sci. Rev.. DOI. ADS.
- Clette et al. (2014) Clette, F., Svalgaard, L., Vaquero, J.M., Cliver, E.W.: 2014, Revisiting the Sunspot Number. A 400-Year Perspective on the Solar Cycle. Space Sci. Rev. 186, 35. DOI. ADS.
- Clette et al. (2015) Clette, F., Svalgaard, L., Vaquero, J.M., Cliver, E.W.: 2015, In: Balogh, A., Hudson, H., Petrovay, K., von Steiger, R. (eds.) Revisiting the Sunspot Number, 35. DOI. ADS.
- Clette et al. (2016) Clette, F., Cliver, E.W., Lefèvre, L., Svalgaard, L., Vaquero, J.M., Leibacher, J.W.: 2016, Preface to Topical Issue: Recalibration of the Sunspot Number. Sol. Phys. 291, 2479. DOI. ADS.
- Cliver, Clette, and Svalgaard (2013) Cliver, E.W., Clette, F., Svalgaard, L.: 2013, Recalibrating the Sunspot Number (SSN): The SSN Workshops. Cent. Eur. Astrophys. Bull. 37, 401. ADS.
- Cliver et al. (2015) Cliver, E.W., Clette, F., Svalgaard, L., Vaquero, J.M.: 2015, Recalibrating the Sunspot Number (SN): The 3rd and 4th SN Workshops. Cent. Eur. Astrophys. Bull. 39, 1. ADS.
- Eddy, Gilman, and Trotter (1976) Eddy, J.A., Gilman, P.A., Trotter, D.E.: 1976, Solar rotation during the Maunder Minimum. Sol. Phys. 46, 3. DOI. ADS.
- Gilman and Howard (1984) Gilman, P.A., Howard, R.: 1984, Variations in solar rotation with the sunspot cycle. ApJ 283, 385. DOI. ADS.
- Gupta, Sivaraman, and Howard (1999) Gupta, S.S., Sivaraman, K.R., Howard, R.F.: 1999, Measurement of Kodaikanal White-Light Images - III. Rotation Rates and Activity Cycle Variations. Sol. Phys. 188, 225. DOI. ADS.
- Győri, Ludmány, and Baranyi (2017) Győri, L., Ludmány, A., Baranyi, T.: 2017, Comparative analysis of Debrecen sunspot catalogues. MNRAS 465, 1259. DOI. ADS.
- Hathaway (2010) Hathaway, D.H.: 2010, The Solar Cycle. Living Reviews in Solar Physics 7, 1. DOI. ADS.
- Howard (1976) Howard, R.: 1976, A possible variation of the solar rotation with the activity cycle. ApJ 210, L159. DOI. ADS.
- Howard, Gilman, and Gilman (1984) Howard, R., Gilman, P.I., Gilman, P.A.: 1984, Rotation of the sun measured from Mount Wilson white-light images. ApJ 283, 373. DOI. ADS.
- Howe et al. (2000) Howe, R., Christensen-Dalsgaard, J., Hill, F., Komm, R.W., Larsen, R.M., Schou, J., Thompson, M.J., Toomre, J.: 2000, Dynamic Variations at the Base of the Solar Convection Zone. Science 287, 2456. DOI. ADS.
- Javaraiah and Bertello (2016) Javaraiah, J., Bertello, L.: 2016, Short-Term Variations in the Equatorial Rotation Rate of Sunspot Groups. Sol. Phys. 291, 3485. DOI. ADS.
- Jurdana-Šepić et al. (2011) Jurdana-Šepić, R., Brajša, R., Wöhl, H., Hanslmeier, A., Poljančić, I., Svalgaard, L., Gissot, S.F.: 2011, A relationship between the solar rotation and activity in the period 1998-2006 analysed by tracing small bright coronal structures in SOHO-EIT images. A&A 534, A17. DOI. ADS.
- Komm, Howe, and Hill (2017) Komm, R., Howe, R., Hill, F.: 2017, Solar-Cycle Variation of Subsurface-Flow Divergence: A Proxy of Magnetic Activity? Sol. Phys. 292, 122. DOI. ADS.
- Lanza (2006) Lanza, A.F.: 2006, On the time dependence of differential rotation in young late-type stars. MNRAS 373, 819. DOI. ADS.
- Lanza (2007) Lanza, A.F.: 2007, Angular momentum conservation and torsional oscillations in the Sun and solar-like stars. A&A 471, 1011. DOI. ADS.
- Li et al. (2012) Li, K.J., Shi, X.J., Feng, W., Xie, J.L., Gao, P.X., Zhan, L.S., Liang, H.F.: 2012, Long-term variations of the coronal rotation and solar activity. MNRAS 423, 3584. DOI. ADS.
- Li et al. (2014) Li, K.J., Feng, W., Shi, X.J., Xie, J.L., Gao, P.X., Liang, H.F.: 2014, Long-Term Variations of Solar Differential Rotation and Sunspot Activity: Revisited. Sol. Phys. 289, 759. DOI. ADS.
- Lustig (1983) Lustig, G.: 1983, Solar rotation 1947-1981 - Determined from sunspot data. A&A 125, 355. ADS.
- Meunier, Nesme-Ribes, and Collin (1997) Meunier, N., Nesme-Ribes, E., Collin, B.: 1997, Cycle 19 facula dynamics. II. Meridional circulation, RMS velocity, and Reynolds stresses. A&A 319, 683. ADS.
- Nash, Sheeley, and Wang (1988) Nash, A.G., Sheeley, N.R. Jr., Wang, Y.-M.: 1988, Mechanisms for the rigid rotation of coronal holes. Sol. Phys. 117, 359. DOI. ADS.
- Newton and Nunn (1951) Newton, H.W., Nunn, M.L.: 1951, The Sun’s rotation derived from sunspots 1934-1944 and additional results. MNRAS 111, 413. ADS.
- Obridko and Shelting (2001) Obridko, V.N., Shelting, B.D.: 2001, Rotation Characteristics of Large-Scale Solar Magnetic Fields. Sol. Phys. 201, 1. DOI. ADS.
- Poljančić Beljan et al. (2014) Poljančić Beljan, I., Jurdana-Šepić, R., Čargonja, M., Brajša, R., Hržina, D., Pötzi, W., Hanslmeier, A.: 2014, An analysis of the solar differential rotation from the Kanzelhöhe sunspot drawings. Cent. Eur. Astrophys. Bull. 38, 87. ADS.
- Poljančić-Beljan et al. (2017) Poljančić-Beljan, I., Jurdana-Šepić, R., Brajša, R., Sudar, D., Ruždjak, D., Hržina, D., Pötzi, W., Hanslmeier, A., Veronig, A., , Skokić, I., Wöhl, H.: 2017, Solar diferential rotation in the period 1964-2016 determined by the Kanzelhöhe data set. A&A 606, A72. DOI. ADS.
- Pulkkinen and Tuominen (1998) Pulkkinen, P., Tuominen, I.: 1998, Velocity structures from sunspot statistics in cycles 10 to 22. II. Latitudinal velocity and correlation functions. A&A 332, 755. ADS.
- Ribes and Nesme-Ribes (1993) Ribes, J.C., Nesme-Ribes, E.: 1993, The solar sunspot cycle in the Maunder minimum AD1645 to AD1715. A&A 276, 549. ADS.
- Roša et al. (1995) Roša, D., Brajša, R., Vršnak, B., Wöhl, H.: 1995, The Relation between the Synodic and Sidereal Rotation Period of the Sun. Sol. Phys. 159, 393. DOI. ADS.
- Ruždjak et al. (2004) Ruždjak, D., Ruždjak, V., Brajša, R., Wöhl, H.: 2004, Deceleration of the rotational velocities of sunspot groups during their evolution. Sol. Phys. 221, 225. DOI. ADS.
- Ruždjak et al. (2005) Ruždjak, D., Brajša, R., Sudar, D., Wöhl, H.: 2005, The Influence of the Evolution of Sunspot Groups on the Determination of the Solar Velocity Field. Sol. Phys. 229, 35. DOI. ADS.
- Rybak (1994) Rybak, J.: 1994, Rotational characteristics of the green solar corona: 1964-1989. Sol. Phys. 152, 161. DOI. ADS.
- Skokić et al. (2014) Skokić, I., Brajša, R., Roša, D., Hržina, D., Wöhl, H.: 2014, Validity of the Relations Between the Synodic and Sidereal Rotation Velocities of the Sun. Sol. Phys. 289, 1471. DOI. ADS.
- Sudar et al. (2014) Sudar, D., Skokić, I., Ruždjak, D., Brajša, R., Wöhl, H.: 2014, Tracing sunspot groups to determine angular momentum transfer on the Sun. MNRAS 439, 2377. DOI. ADS.
- Sudar et al. (2015) Sudar, D., Skokić, I., Brajša, R., Saar, S.H.: 2015, Steps towards a high precision solar rotation profile: Results from SDO/AIA coronal bright point data. A&A 575, A63. DOI. ADS.
- Sudar et al. (2016) Sudar, D., Saar, S.H., Skokić, I., Poljančić Beljan, I., Brajša, R.: 2016, Meridional motions and Reynolds stress from SDO/AIA coronal bright points data. A&A 587, A29. DOI. ADS.
- Sudar et al. (2017) Sudar, D., Brajša, R., Skokić, I., Poljančić Beljan, I., Wöhl, H.: 2017, Meridional Motion and Reynolds Stress from Debrecen Photoheliographic Data. Sol. Phys. 292, 86. DOI. ADS.
- Usoskin (2017) Usoskin, I.G.: 2017, A history of solar activity over millennia. Living Reviews in Solar Physics 14, 3. DOI. ADS.
- Wöhl et al. (2010) Wöhl, H., Brajša, R., Hanslmeier, A., Gissot, S.F.: 2010, A precise measurement of the solar differential rotation by tracing small bright coronal structures in SOHO-EIT images. Results and comparisons for the period 1998-2006. A&A 520, A29. DOI. ADS.
- Zuccarello and Zappalá (2003) Zuccarello, F., Zappalá, R.A.: 2003, Angular velocity during the cycle deduced using the sunspot group age selection methodology. Astron. Nachr. 324, 464. DOI. ADS.