How Long Will My Phone Battery Last?
Abstract
Mobile devices are only as useful as their battery lasts. Unfortunately, the operation and life of a mobile device’s battery degrade over time and usage. The state-of-health (SoH) of batteries quantifies their degradation, but mobile devices are unable to support its accurate estimation — despite its importance — due mainly to their limited hardware and dynamic usage patterns, causing various problems such as unexpected device shutoffs or even fire/explosion. To remedy this lack of support, we design, implement and evaluate V-Health, a low-cost user-level SoH estimation service for mobile devices based only on their battery voltage, which is commonly available on all commodity mobile devices. V-Health also enables four novel use-cases that improve mobile users’ experience from different perspectives. The design of V-Health is inspired by our empirical finding that the relaxing voltages of a device battery fingerprint its SoH, and is steered by extensive measurements with 15 batteries used for various commodity mobile devices, such as Nexus 6P, Galaxy S3, iPhone 6 Plus, etc. These measurements consist of 13,377 battery discharging/charging/resting cycles and have been conducted over 72 months cumulatively. V-Health has been evaluated via both laboratory experiments and field tests with multiple Android devices over – months, showing error in SoH estimation.
1 Introduction
Apple announced a free-replacement program of iPhone 6S batteries in Nov. 2016 [1], due to frequent users’ complaints on the phone shutoffs even when showing – remaining power, and concluded faster-than-normal battery degradation to have caused the problem [2]. Similar unexpected phone shutoffs also occurred on devices such as Nexus 6P [3], Galaxy S4 [4], iPhone 5 [5], to name a few.
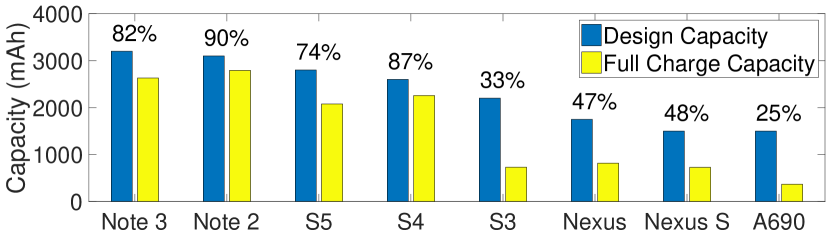
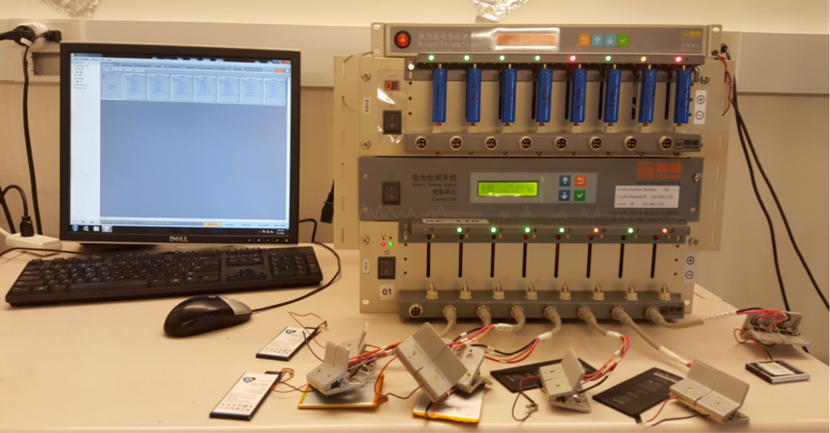
These incidents imply the inability to accurately answer a simple question “how long will my phone battery last?", which means (i) the remaining battery life (e.g., relative to battery degradation and thus its warranty period) or (ii) remaining device operation time until the battery runs out (i.e., the operation time with a single charge). The answer relies on the quantification of battery’s capacity degradation, which is traditionally captured by its state-of-health (SoH), defined as the ratio of the battery’s full charge capacity to the designed capacity [6, 7, 8]. Unfortunately, mobile devices are not equipped with the capability necessary for accurately quantifying its battery’s SoH. For example, Android only specifies battery health as good or dead, without any quantified information [9]. Fig. 1 plots our measurements on the battery SoH of Android phones with a battery tester: all of these batteries are tagged as good although their capacities are observed to have degraded by as much as .
The non-existence of quantified battery SoH introduces errors in estimating the devices’ remaining power (i.e., state-of-charge (SoC)) and thus shutting them off prematurely or unexpectedly [10, 11], as happened to iPhone 6S and other devices, because batteries’ SoC, by definition, is grounded on their SoH [12, 13, 14]. It also prevents the comparison of a device’s battery life against its warranty period, as users will not know whether the shortened device-operation is due to system updates111For example, Android 6.0 Marshmallow is reported to reduce device operation when first launched [15]. and app installations [16, 17], or because of battery degradation. Last but not the least, this inaccurate SoC easily leads to battery over-charge/deep-discharge, accelerating SoH degradation and thus increasing the SoC estimation error [12, 10, 18], thus forming a positive feedback loop between the two [7].
The deficiency of health information on mobile devices’ batteries stems from the non-existence of compatible methods to estimate their SoH. Most existing SoH estimation methods require either battery parameters, determination of which is beyond mobile devices’ capability due to hardware limitation (e.g., impedance [19, 20, 21] and ultrasonic echo [18]), or specific applicable conditions that do not always hold due to devices’ dynamic usage patterns (e.g., small current to fully charge and discharge [22, 14, 23]). Moreover, even Coulomb counting — the most widely-deployed SoH estimation method via current integration [14, 24] — is not supported well on mobile devices because (i) not all power management ICs (PMICs) of mobile devices support electric current sensing [25], making Coulomb counting infeasible; (ii) the PMIC-provided current information is too coarse and lacks real-time capability, even when available [26, 27]. Such unreliable current information on mobile devices is also reported by Ampere, a current sensing app with millions of downloads [28].
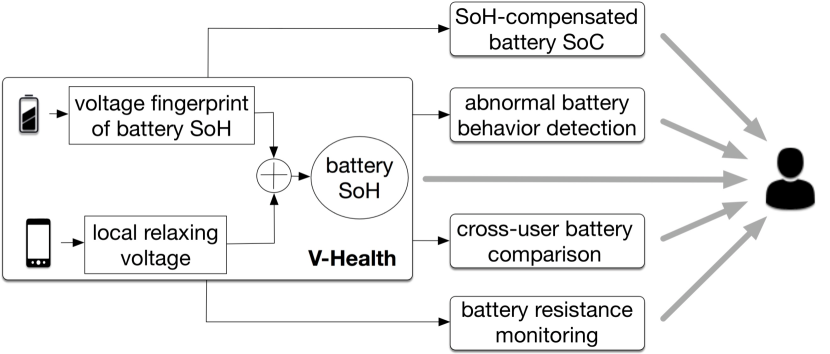
To remedy the above problems, we propose V-Health, a user-level SoH estimation service for mobile devices based solely on their battery voltage, and is thus compatible to all commodity mobile devices with voltage sensing and processing capabilities, such as smartphones, tablets, smartwatches, and even electric vehicles. With the thus-estimated SoH, V-Health also enables 4 novel use-cases that improve user experience: (i) SoH-compensated SoC estimation that alleviates unexpected device shutoffs, (ii) detection of abnormal battery behaviors that reduces safety risks such as thermal runaway, (iii) cross-user battery comparison that identifies battery-friendly/harmful usage patterns, and (iv) battery resistance monitoring. Fig. 2 presents an overview of V-Health.
The design of V-Health is inspired by our empirical finding: the relaxing battery voltages — a time series of battery voltages when resting it after its charge/discharge — fingerprinting its SoH, and this voltage–SoH relationship holds reliably for all same-model batteries. We uncover and validate this property via machine learning and based on extensive measurements with 15 batteries used for various mobile devices, such as Nexus 6P, Nexus 5X, Xperia Z5, Galaxy S3, iPhone 6 Plus, etc., consisting of a total of 13,377 discharging/charging/resting cycles and have been collected over 72 months cumulatively.
Resting battery to collect its relaxing voltages is not always feasible for mobile devices because they draw dynamically changing amounts of current from batteries continuously, even when idle [29, 30]. V-Health exploits over-night device charging to collect the relaxing voltages, which (i) rests device battery after fully charging it [31, 32], (ii) offers stable battery conditions in both device operation and thermal environment, (iii) masks the disturbances caused by device usage behaviors, and (iv) is frequently done by users [33, 34, 35] — our dataset of device charging cases collected from users shows that of them are over-night charge lasting + hours and are long enough to rest the battery once fully charged. This way, V-Health does not degrade user experience, as the external charger supplies the power needed for information reading/logging.
This paper makes the following main contributions:
-
•
Discovery of the correlation between relaxing battery voltages and their SoH, uncovering the feasibility of voltage-based SoH estimation (Sec. 4);
- •
-
•
Evaluation of V-Health using both laboratory experiments and field-tests on multiple devices over – months, showing SoH estimation error (Sec. 7);
-
•
Demonstration of 4 novel use-cases enabled by V-Health (Sec. 8).
2 Related Work
Accurate SoH estimation is crucial for battery management [37, 38], which has been studied extensively based on various battery parameters such as voltage [12, 7, 39], current [40, 41, 42, 10, 43], open-circuit-voltage (OCV) [13, 44, 22], SoC [45, 46], resistance [47], impedance [19, 20, 21], and even ultrasonic echo [18]. These SoH estimation methods, albeit reported to be accurate, cannot be deployed on mobile devices due to their limited hardware support and dynamic operating conditions.
Mobile devices offer limited hardware support for sensing, rendering some of the needed battery information unavailable. For example, the battery impedance needed in [19, 20, 21] requires a specialized equipment to collect, costing as much as $5,000 apiece. Actually, even the relatively easy-to-measure electric current — the foundation of the most widely-deployed SoH estimation method, Coulomb counting — is not always available on mobile devices [25], and suffers from poor accuracy and lacks timeliness even when available. We will elaborate more on the insufficient current sensing on mobile devices in Sec. 3. Also, battery information such as OCV and SoC requires specific conditions to be met for their accurate estimation. For example, OCV and SoC can be accurately estimated only when the battery has been charged/discharged with small current (e.g., less than C) for a long period of time [22, 14, 48], which does not always hold due to devices’ dynamic usage patterns, thus yielding poor estimation accuracy, e.g., an SoC error of is specified for Qualcomm’s PM8916 [49]. We will make two existing solutions requiring SoC and OCV in [45, 46] adopt the over-night charge to improve reliability, and use them as the baselines for comparison in Sec. 7.
In contrast, voltage is the most pervasively/easily available battery information on mobile devices, and hence we choose its use for SoH estimation, i.e., V-Health. To the best of our knowledge, the closest to V-Health are [36] and [50].
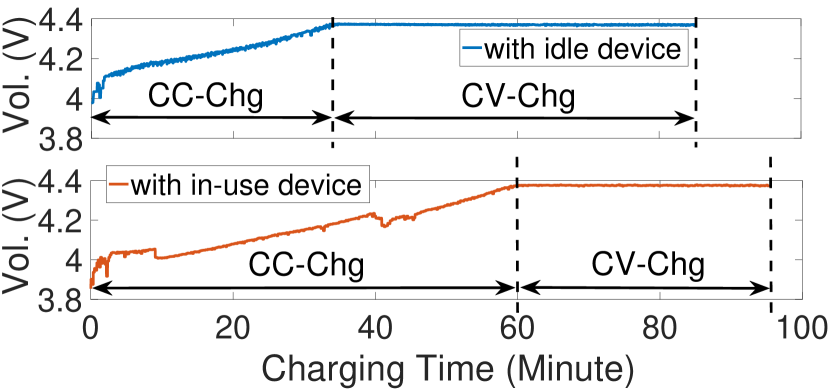
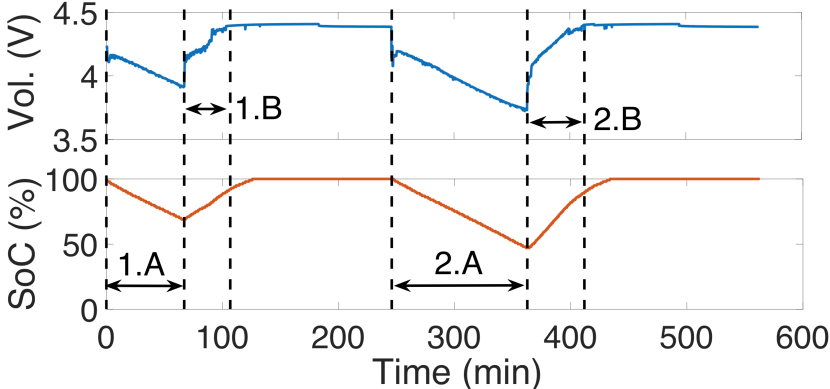
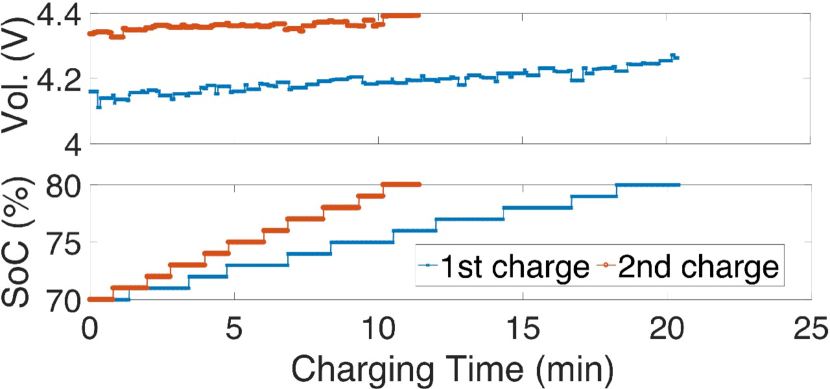
Guo et al. [36] estimates battery SoH based on its voltage–time relationship during charging. Such a voltage–time relationship, however, depends strongly on device usage behavior, making it unreliable on mobile devices. First, usage behavior during charging affects the voltage–time relationship. Fig. 4 plots the voltage curves during two consecutive charges of a Galaxy S6 Edge phone — the phone is left idle during the first charge and operates actively during the second, showing clear dependency of the voltage curve on device operation. Second, the usage behavior before device charge affects the voltage–time relationship, making [36] unreliable even when only applying it during over-night charge, as V-Health does. Fig. 4(a) plots two consecutive charges of an idle Nexus 6P phone after discharging it to 69% (1.A) and 31% SoC (2.A), respectively. Their charging phases during the [70%, 80%] SoC range (part of 1.B and 2.B in Fig. 4(a)) are compared in Fig. 4(b), showing significant differences in both durations and voltage levels and thus dependency on before-charging device usage.
He et al. [50] explores the voltage-based SoH estimation based on (i) a power model of battery voltage (i.e., ) and (ii) a linear model between the power factor and battery SoH. Clearly, the accuracy of [50] depends on the model accuracy and the empirically-identified model parameters, which we observed to vary over battery aging. V-Health reduces such model dependency with a machine learning approach, which is further assisted by a set of data pre-processing techniques including filtering, smoothing, and dimension reduction. We will use [50] as another baseline method for comparison in Sec. 7.
In summary, existing SoH estimation methods are not applicable to, or inaccurate for, mobile devices because of the non-existence of required battery information or the inability of meeting the required conditions.222As an alternative, some commodity phones use a counter of battery’s complete charge/discharge cycles to indicate its health. This, however, is not reliable as battery degradation depends heavily on how it is cycled, such as charging/discharge rates, discharge depth, and temperature [51, 52, 53, 54]. For example, Choi et al. [55] showed that battery health, even with the same cycle count, could differ as much as 3x due to different discharge rates. To remedy this problem, we propose V-Health which estimates SoH based only on voltage information and is enabled on mobile devices with the common usage pattern of over-night charge.
3 Motivation
This section provides the motivation behind V-Health.
3.1 What is Battery SoH?
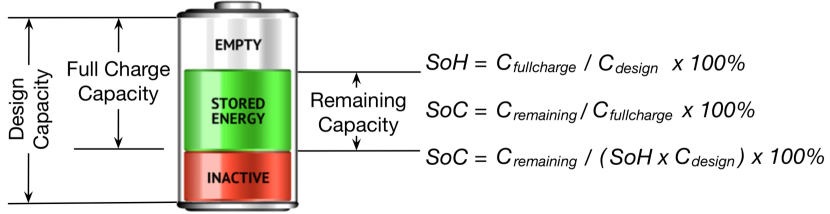
SoH is one of the most critical battery parameters (Fig. 5), quantifies battery’s capacity degradation, and is defined as the ratio of battery’s full charge capacity to its designed levels [6, 7, 8], i.e.,
| (1) |
SoH is also the key in estimating a battery’s real-time SoC:
| (2) |
where is the real-time remaining capacity.
is the foundation of SoH estimation, which is usually estimated via Coulomb counting [14, 56], i.e., integrating the current when discharging/charging the battery between two SoC levels to calculate the discharged/charged capacity as
where is the current at time . This way we know
3.2 Why is SoH Absent from Mobile Devices?
Commodity mobile devices do not support Coulomb counting well in terms of availability, accuracy, and timeliness, thus making it difficult to estimate their battery SoH. First, not all the PMICs, or more specifically their fuel gauge components [58], of mobile devices support current sensing [25, 50]. Moreover, the PMIC-provided current information, even when available, is very coarse [27]. Our measurement with a Nexus 5X phone shows that its PMIC’s current reading deviates from the true value — collected with the Monsoon power meter — by an average of 4% even at room temperature. Last but not the least, the current information may lack timeliness, which is crucial for Coulomb counting because of devices’ dynamic currents, i.e., varying from tens to thousands of milliamps in a few milliseconds [30]. A counting error due to insufficient sampling rates is reported in [50].
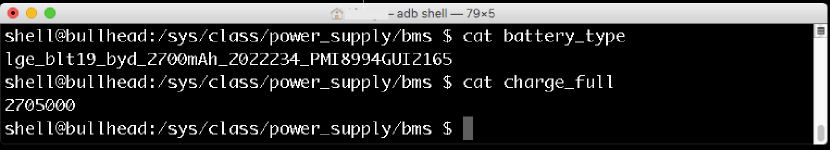
As a real-life evidence of mobile devices’ deficiency in supporting Coulomb counting and their limited SoH information, Fig. 6 shows the full-charge capacity of a Nexus 5X phone provided by its fuel-gauge chip, saying its battery, with a design capacity of mAh, can still deliver mAh capacity upon being fully charged and thus an SoH of about , even though the phone has been used extensively for months and observed to have a shorter operation time. This motivates us to explore current-free SoH estimation, i.e., V-Health.
4 Overview
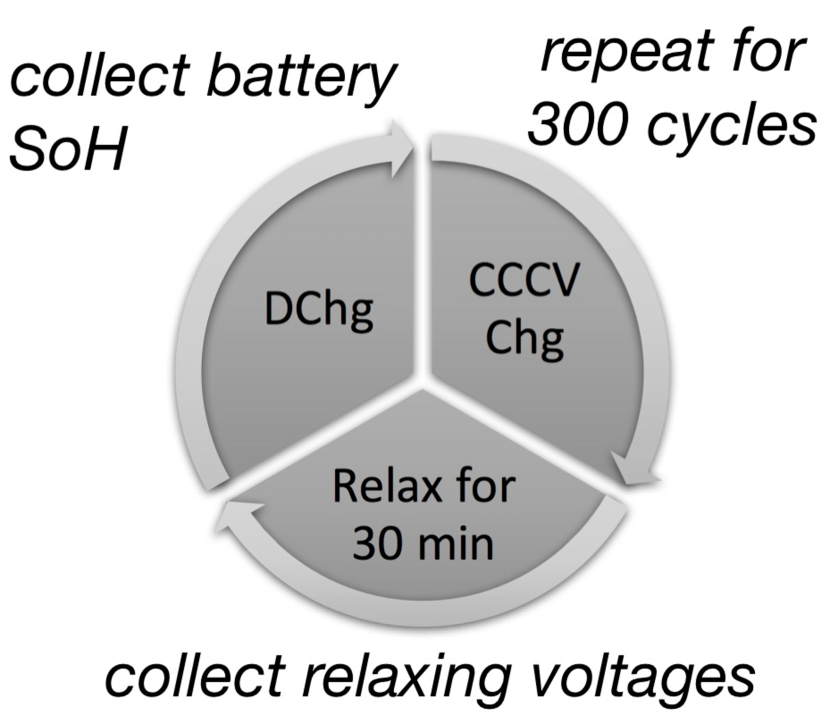
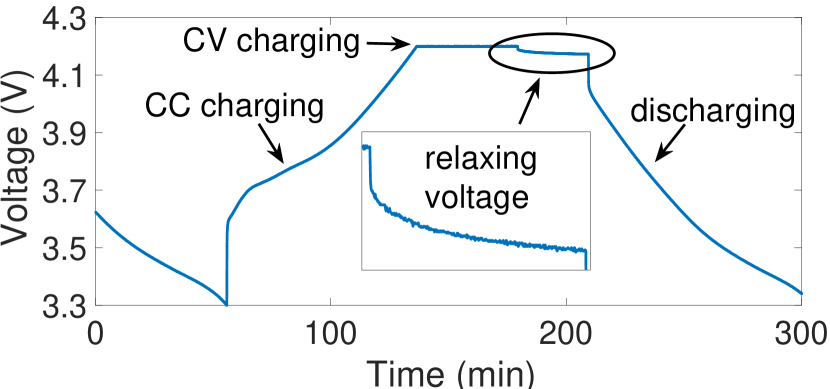
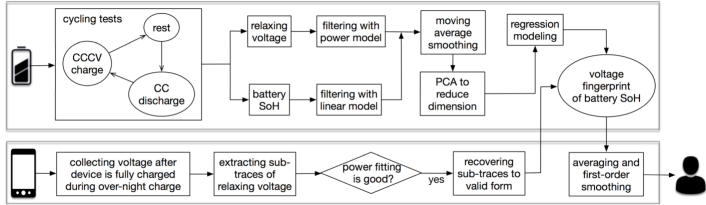
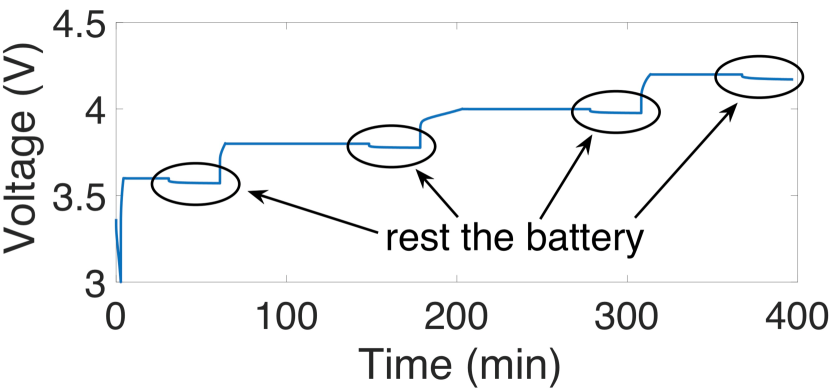
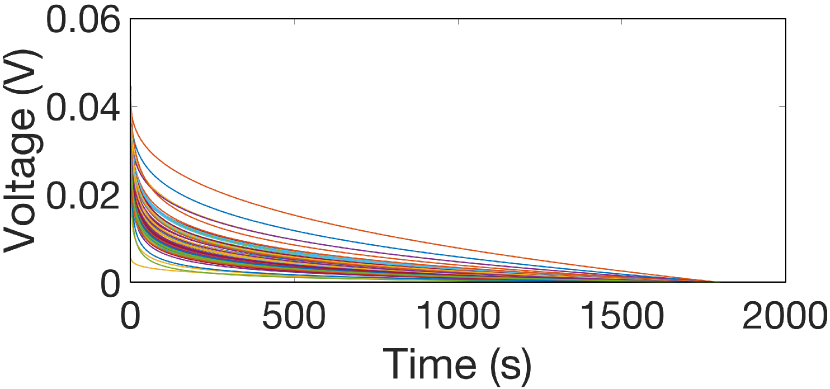
V-Health is built on our key finding that batteries’ relaxing voltages fingerprint their SoH.333Relaxing voltages also facilitate battery SoC estimation [59, 60]. We demonstrate this finding with a mAh Galaxy S3 battery. Specifically, we test the battery by (i) fully charging it with a constant-current constant-voltage (CCCV) profile of 0.5C, 4.2V, 0.05Ccccv as commonly specified in Li-ion battery datasheet [61, 62],444CCCV is widely used to charge mobile devices [10], described by cccv: charge the battery with a constant current until its voltage reaches (i.e., CC-Chg), and then charge it further with a constant voltage until the current reduces to (i.e., CV-Chg), as observed in Fig. 4 with the Galaxy S6 Edge phone. Also, battery charge/discharge is often expressed in C-rate: at 1C-rate, the current drains the battery completely in hour, e.g., mA for the battery used here. (ii) resting it for minutes, (iii) fully discharging it at C-rate until reaching a cutoff voltage of V, at which mobile devices normally shut off, and (iv) repeating the process for cycles, as summarized in Fig. 8. This measurement is made with the NEWARE BTS4000 battery tester [57] as shown in Fig. 8, and the cycling process (i.e., current, voltage, timestamp) is logged at Hz. Fig. 9(a) plots the battery voltage during one such charging/resting/discharging cycle, and highlights the relaxing voltages during resting. The relaxing voltage drops instantly upon resting and then decreases gradually further until it converges.
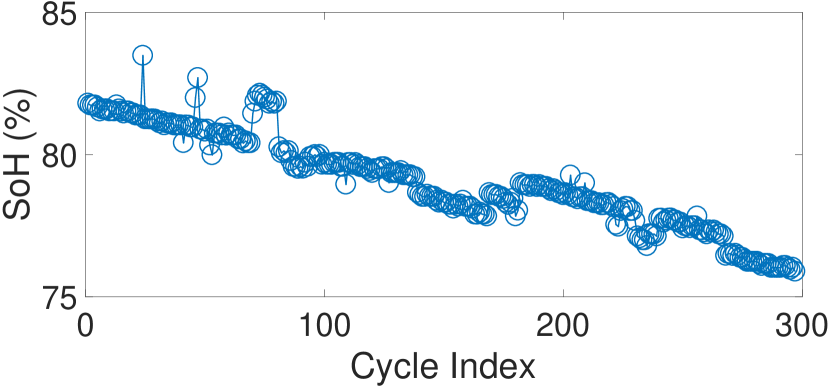
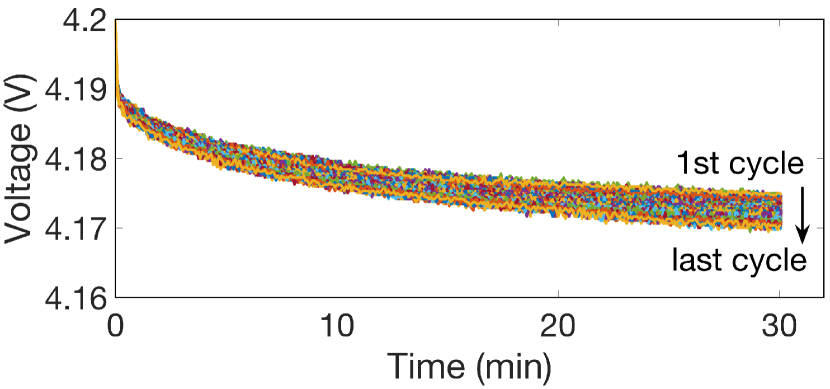
We collect the battery’s full charge capacity (and thus its SoH according to Eq. (1)) via Coulomb counting during each discharge, thus recording its degradation process during the cycling measurement, as shown in Fig. 9(b). Also, time series of relaxing voltages are collected, each during one of the -minute resting period (Fig. 9(c)). Comparison of Figs.9(b) and 9(c) shows that the battery SoH degrades over the cycling measurement due to its capacity degradation, while during the same measurement, its relaxing voltage decreases, exhibiting the possibility to fingerprint battery SoH with the relaxing voltages.
V-Health exploits this voltage–SoH relationship to estimate the SoH of device batteries by checking their relaxing voltages with an offline-constructed fingerprint map. Fig. 10 presents an overview of V-Health, which we will elaborate in the next two sections.
| Battery | Rated Capacity | # of Tests | # of Cycles | Per-Cycle Profile | Covered SoH (%) |
| Nexus 6P x 1 | 3,450mAh | 5 | 1,300 | 0.50C, 4.35V, 0.05Ccccv; 30min rest; 0.5C DChg to 3.3V | [0, 93.6] |
| Nexus 5X x 2 | 2,700mAh | 3 | 1,104 | 0.50C, 4.35V, 0.05Ccccv; 30min rest; 0.5C DChg to 3.3V | [59.2, 94.0] |
| Nexus S x 1 | 1,500mAh | 3 | 150 | 0.50C, 4.20V, 0.05Ccccv; 30min rest; 0.5C DChg to 3.2V | [49.9, 54.3] |
| Xperia Z5 x 1 | 2,900mAh | 5 | 655 | 0.50C, 4.20V, 0.05Ccccv; 30min rest; 0.5C DChg to 3.2V | [12.4, 87.1] |
| iPhone 6 Plus x 1 | 2,900mAh | 2 | 100 | 0.50C, 4.35V, 0.05Ccccv; 30min rest; 0.5C DChg to 3.3V | [67.6, 79.1] |
| Galaxy Note 2 x 1 | 3,100mAh | 5 | 1,350 | 0.50C, 4.20V, 0.05Ccccv; 30min rest; 0.5C DChg to 3.2V | [21, 96.6] |
| Galaxy S5 x 1 | 2,800mAh | 3 | 964 | 0.50C, 4.35V, 0.05Ccccv; 30min rest; 0.5C DChg to 3.3V | [73.1, 91.8] |
| Galaxy S4 x 3 | 2,600mAh | 8 | 2,374 | 0.50C, 4.20V, 0.05Ccccv; 30min rest; 0.5C DChg to 3.0V | [2.8, 93.2] |
| Galaxy S3 x 4 | 2,200mAh | 12 | 4,800 | 0.50C, 4.20V, 0.05Ccccv; 30min rest; 0.5C DChg to 3.3V | [69.5, 97.0] |
| — | 4 | 580 | 0.25C, 4.20V, 0.05Ccccv; 30min rest; 0.5C DChg to 3.3V | [87.8, 92.3] |
5 Voltage Fingerprinting of SoH
We now empirically characterize the voltage fingerprint map of battery SoH.
5.1 Data Collection
Knowledge of batteries’ SoH degradation and relaxing voltages is necessary to characterize their relationship with extensive battery cycling tests. Such tests are readily available for smartphone OEMs, such as Samsung and Apple when testing their products,555This also makes V-Health ideally suitable as an OEM service. but are not available for non-OEM researchers. Therefore, we have conducted extensive battery cycling measurements with 15 batteries used for various mobile devices as summarized in Table 1 (including the one shown in Fig. 9): collecting the relaxing voltages during each resting period and logging batteries’ SoH degradation based on their capacity delivery during each discharge. These measurements consist of 13,377 cycles in total and last over 72 months cumulatively. In these measurements, the settings of 0.5C, 4.2V, 0.05Ccccv and V are commonly used to specify battery properties in industry during battery testing [36, 61, 62], and V and of –V specify more device characteristics: mobile devices are normally charged to a maximum voltage of –V and shut off when their battery voltage reduces to –V [30].
These 72 -month measurements are long enough to identify the voltage–SoH relationship within the SoH range users experience most (e.g., users rarely switch to new batteries/devices until the old ones degrade to SoH). Moreover, the thus-identified voltage–SoH relationship can be extended to the SoH ranges not covered by these measurements, as we will explain later.
5.2 Construction of Fingerprint
Next we use of such measurements based on Galaxy S3 batteries to elaborate on the construction of a voltage-based SoH fingerprint map. Each of these measurements consists of charging/resting/discharging cycles, logged at Hz. This way, we collected SoH-degradation traces, each from one measurement, and also recorded time series of relaxing voltages, each from the resting period within a cycle. The same approach of fingerprint map construction is applied to all the batteries in Table 1 and evaluated, as we will explain in Sec. 7.
Data Filtering and Smoothing. Variance/noise exists in the measurements of SoH degradation and relaxing voltages (as observed in Fig. 9), which are likely due to battery dynamics, especially when considering the stable laboratory environment (i.e., with an UPS connected and room temperature control) and the battery tester’s high accuracy (i.e., less than error in controlling the cycling processes). Such a variance in battery measurements has also been reported in [36], necessitating pre-processing (i.e., filtering and smoothing) of data before constructing the fingerprint map. The collected data were filtered and smoothed using two empirically established models for the SoH degradation and relaxing voltages.
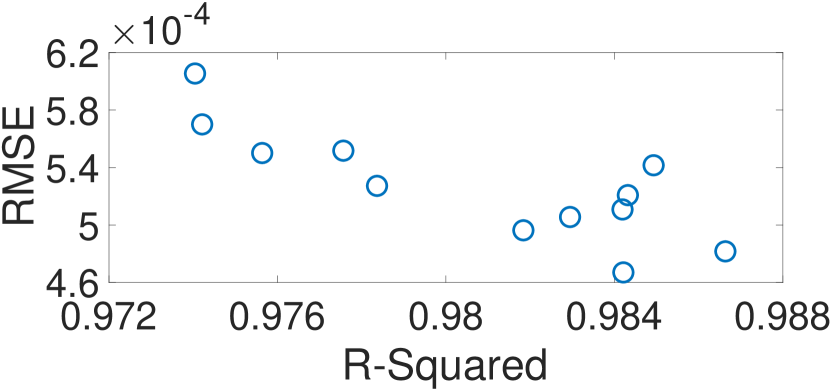
The battery health is shown to degrade approximately linearly (as observed in Fig. 9(b)) until it really becomes bad [47, 51]. To further validate this linear degradation, we tried a linear fit of the collected SoH degradation processes, and all of them have an excellent goodness-of-fit in terms of root-mean-square error (RMSE) and R-Squared, as shown in Fig. 12 where each point represents the goodness-of-fit for a particular SoH degradation process. V-Health removes outlier SoH samples based on this linear model — those SoH samples deviating too much from the linear fitting (e.g., SoH) are tagged as outliers and removed, and then the remaining samples are smoothed with a moving average.
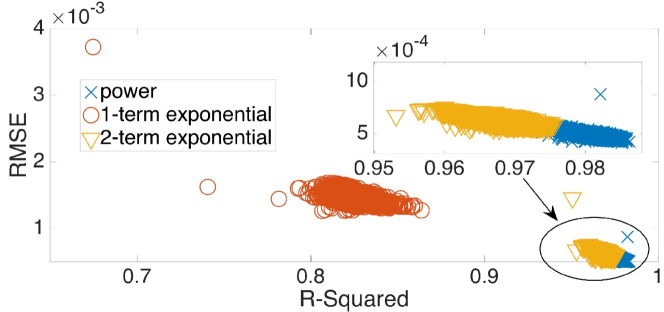
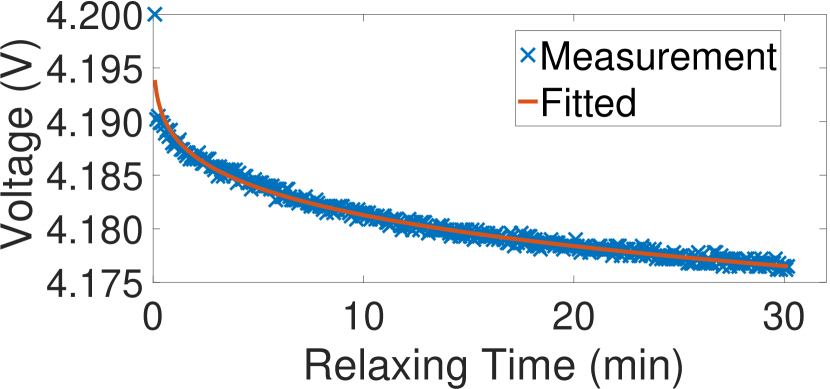
Similarly, V-Health filters and smooths the relaxing voltages based on another empirical observation that the relaxing voltages conform to a power function , where is the time since resting, as illustrated in Fig. 12. We apply the power fitting to the collected relaxing voltage traces to statistically verify this observation. Fig. 13 summarizes the goodness-of-fit — the fitting RMSE is bounded below and the R-Squared above , showing excellent fitting accuracy. Note that this power model differs from existing models with exponential-shape relaxing voltages [63]. Fig. 13 also plots the goodness-of-fit when fitting the same set of relaxing voltages as -term and -term exponential functions, i.e., and , showing reasonably good accuracy, but not as good as the power fitting. V-Health filters the relaxing voltages with this power model, e.g., tagging the relaxing voltage traces with the bottom 5% goodness-of-fit as outliers. The moving average smoother is then used again to smooth the remaining valid relaxing voltage traces.
Note that if an SoH sample is tagged as an outlier, so is the relaxing voltage in the same cycle, and vice versa. Also, V-Health only filters out the outliers based on these empirical models, instead of using the model fitting results to construct the fingerprint map, thus alleviating its dependency on model accuracy — a clear advantage over [50]. As an example, SoH samples and relaxing voltage traces are selected after the data pre-processing from the -cycle measurement shown in Fig. 9.
| Battery | Linear SVM | Qua. SVM | Cub. SVM | Fine KNN | Med. KNN | Coarse KNN | Tree |
|---|---|---|---|---|---|---|---|
| #1 | 94 | 94 | 90 | 67 | 73 | 71 | 95 |
| #2 | 98 | 94 | 97 | 92 | 95 | 95 | 95 |
| #3 | 93 | 92 | 76 | 91 | 94 | 90 | 96 |
| #4 | 91 | 84 | 70 | 83 | 92 | 89 | 97 |
| Battery | #1 | #2 | #3 | #4 |
|---|---|---|---|---|
| #1 | 1 | 0.99 | 0.98 | 0.98 |
| #2 | 0.99 | 1 | 0.99 | 0.98 |
| #3 | 0.98 | 0.99 | 1 | 0.98 |
| #4 | 0.98 | 0.98 | 0.98 | 1 |
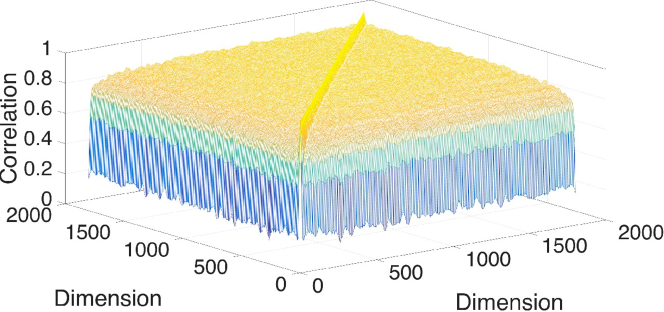
Dimension Reduction. Each of the collected relaxing voltages covers a -minute resting period logged at Hz, yielding dimensions of data. Also, the voltage values in each of these dimensions are correlated. Fig. 14 plots the correlations between each pair of the dimensions of the relaxing voltages selected from Fig. 9, where strong correlations (with correlation coefficients or higher) are observed in most cases. Such highly-correlated, high-dimension relaxing voltages justify V-Health’s use of the principal component analysis (PCA) for reduction of dimensions, lowering the computational effort in constructing the fingerprint map. Again, taking the measurements in Fig. 9 as an example, applying PCA reduces the relaxing voltage dimensions from to with a variance of .
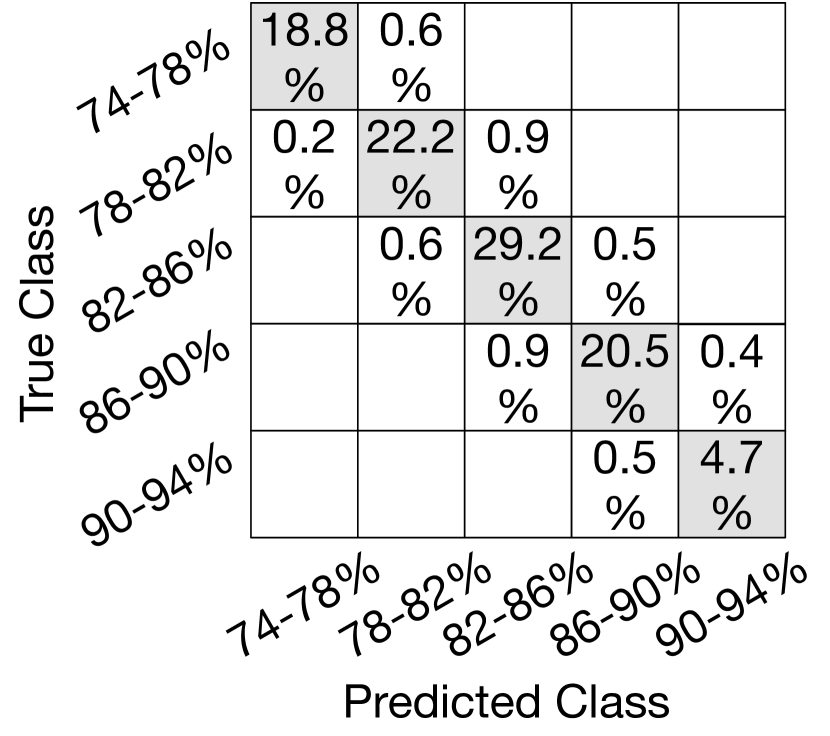
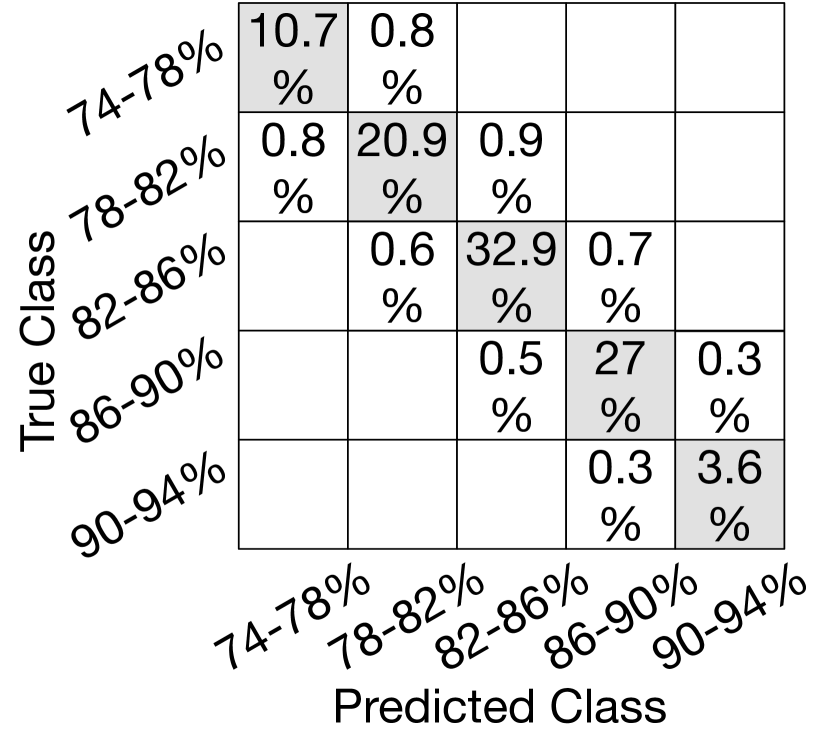
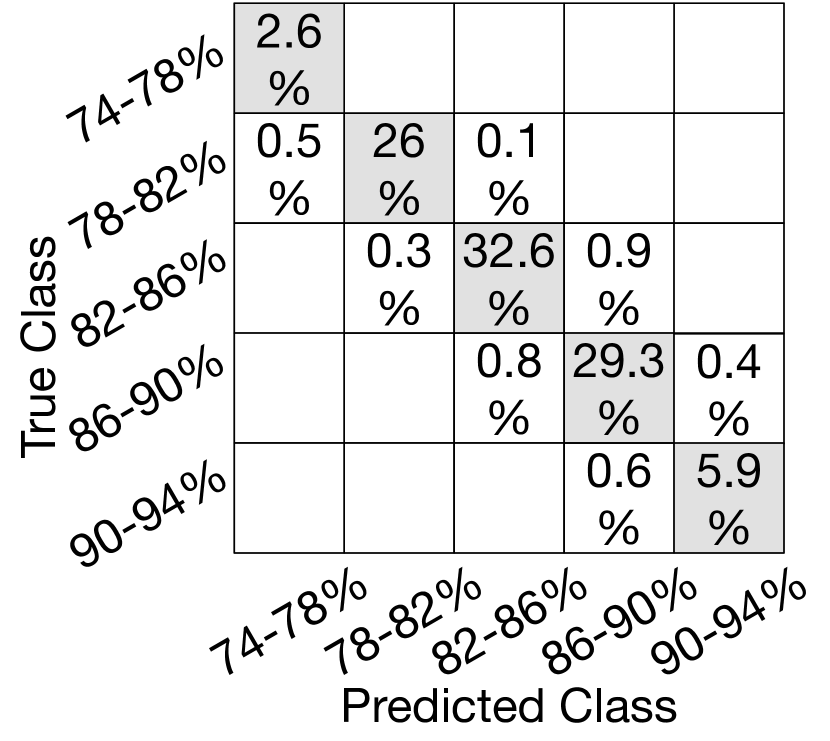
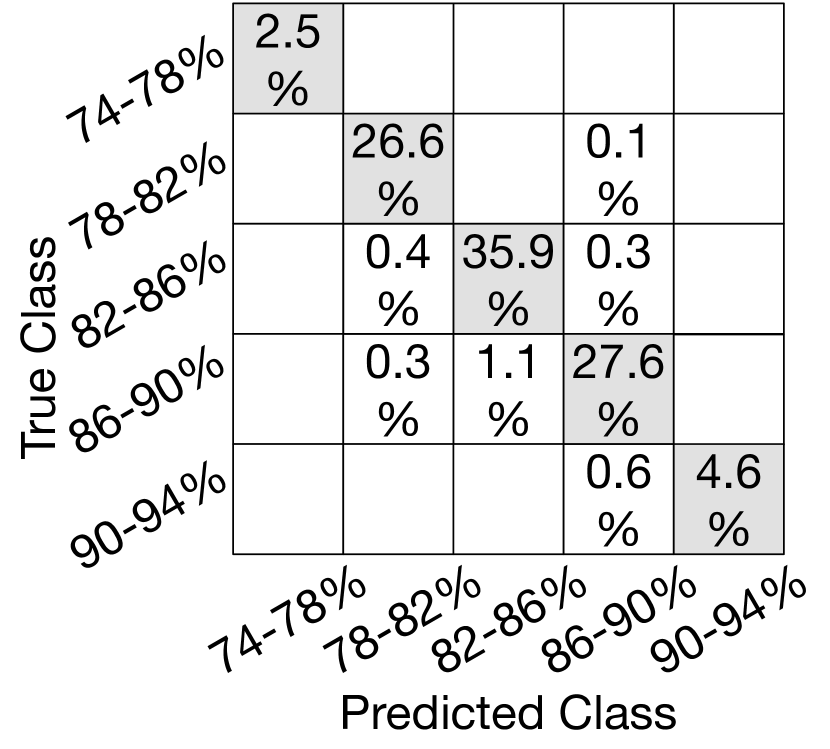
Regression Modeling. Finally, V-Health uses a regression tree to construct the fingerprint map, with the above-obtained principal components as predictors and the corresponding SoH as response. Fig. 15 plots the confusion matrices when validating the constructed regression model for each battery, showing over classification accuracy when forming SoH categories with step-size. Note that this step-size is only for visual clarity, and a more fine-grained step-size of SoH is used for the evaluation of V-Health in Sec. 7. We have also tried other regression methods such as SVM, KNN, and their variations, but have not observed any clear advantages over the regression tree in accuracy, as summarized in Table 3. Thus, the regression tree is used for its simplicity and high interpretability.
5.3 Generality Analysis
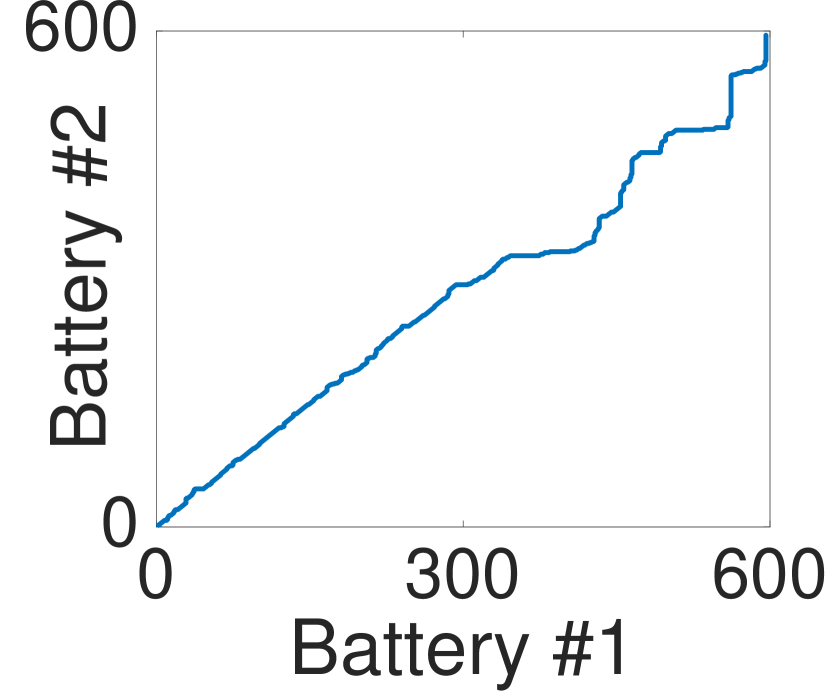
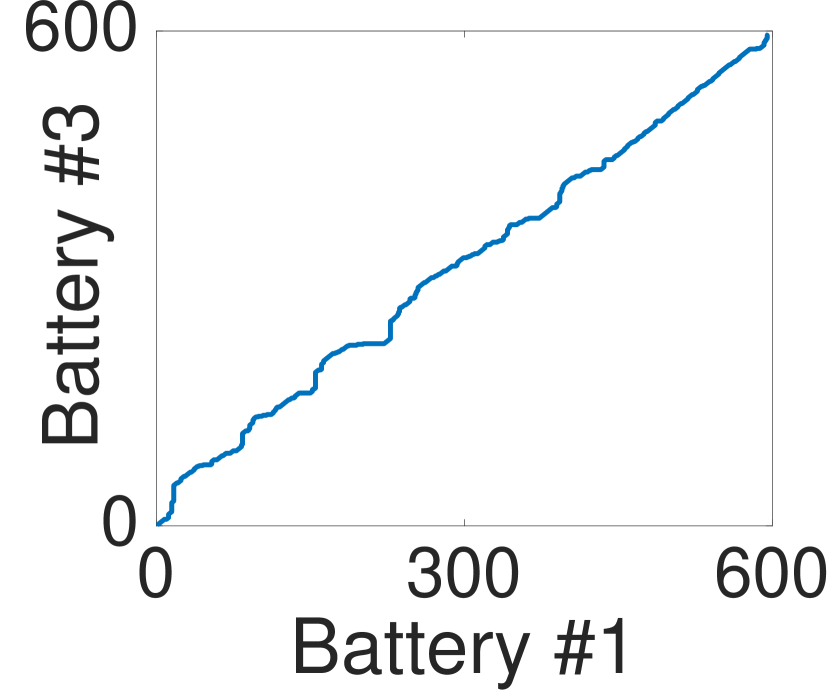
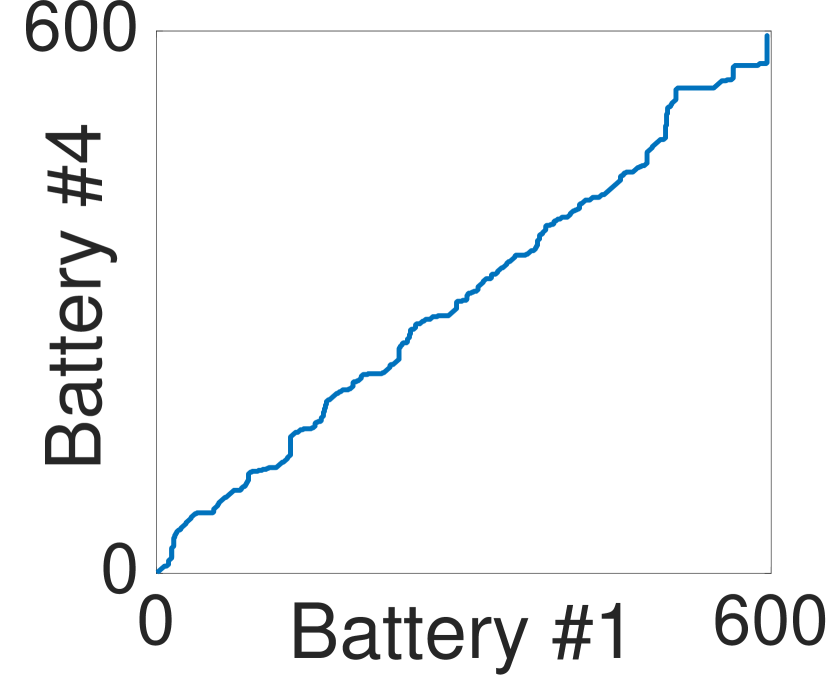
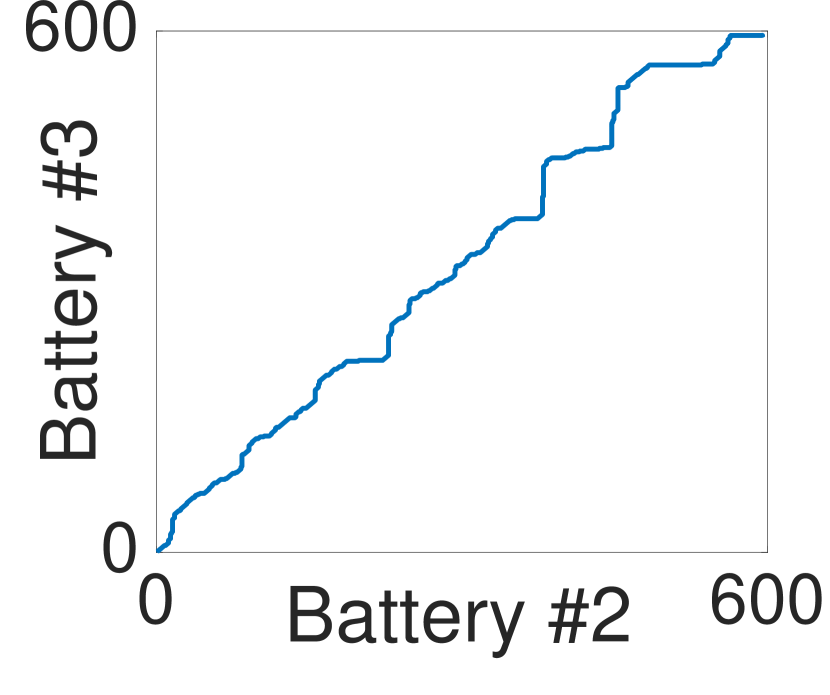
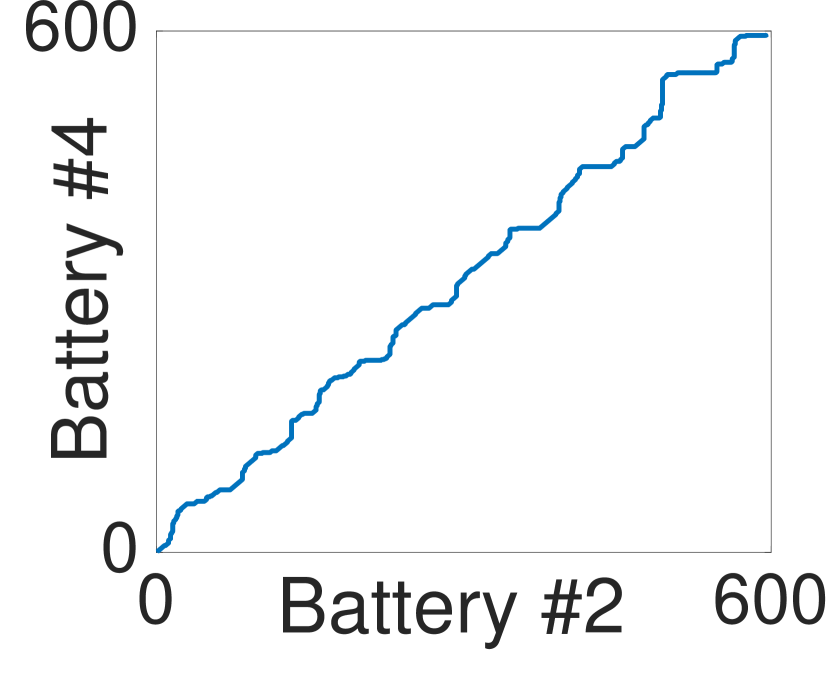
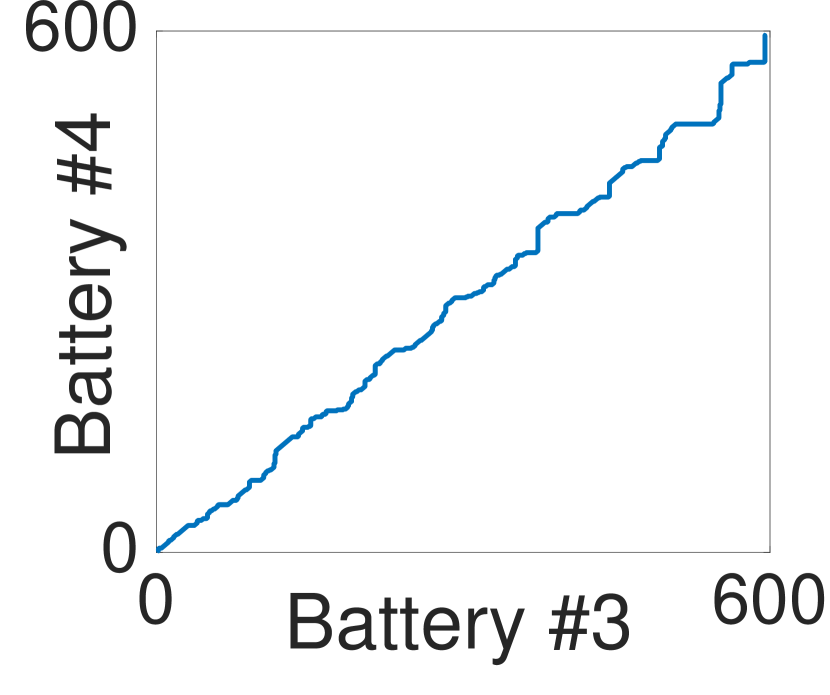
The constructed fingerprint map has to be applicable for all same-model batteries, which can be verified with the following two statistical observations. First, we evaluated the similarity between the SoH degradation processes of the four batteries via dynamic time warping [64], and the resultant warping paths are close to the diagonal of the degradation matrix for each battery pair (as shown in Fig. 16), exhibiting strong similarity. Second, the SoH degradation of the four batteries used in the measurements are highly correlated, as shown in Table 3. These insights support V-Health’s generality of training the fingerprint map with one (or more) battery and its application to other same-model batteries, which is reasonable as same-model batteries are expected to perform similarly — a goal all battery manufactures aim to achieve [65]. We will further evaluate the cross-battery estimation accuracy in Sec. 7.
5.4 Extending Dataset
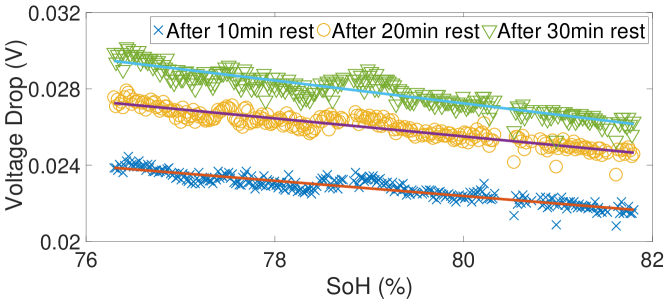
Ideally, V-Health is to be provided by OEMs because of their accessibility to battery cycling datasets, e.g., covering a complete battery SoH range. In case only a limited dataset is available, it can be extrapolated based on the linearity between voltage drop during resting and battery SoH. Again, we used the cycling measurements in Fig. 9 to show this observation. Fig. 17 plots the voltage drop after the battery is rested for , and minutes during the resting period of each cycle, together with the corresponding battery SoH during that cycle. We can see clear linearity in all three traces of dropped voltages, with RMSE in the order of after linear fitting. This observation enables to identify the linear coefficients based on the available cycling dataset, generate relaxing voltages that correspond to uncovered SoH, and then construct the complete voltage fingerprint map.
6 Collection of Relaxing Voltages on Mobile Devices
We now describe how to collect local relaxing voltages on mobile devices.
6.1 Collection During Over-Night Charge
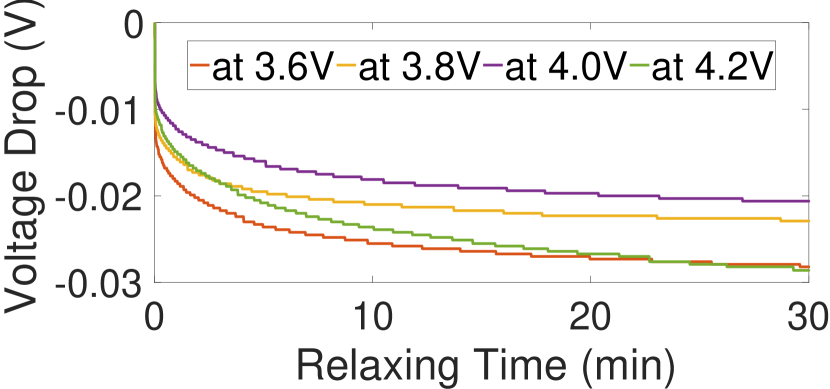
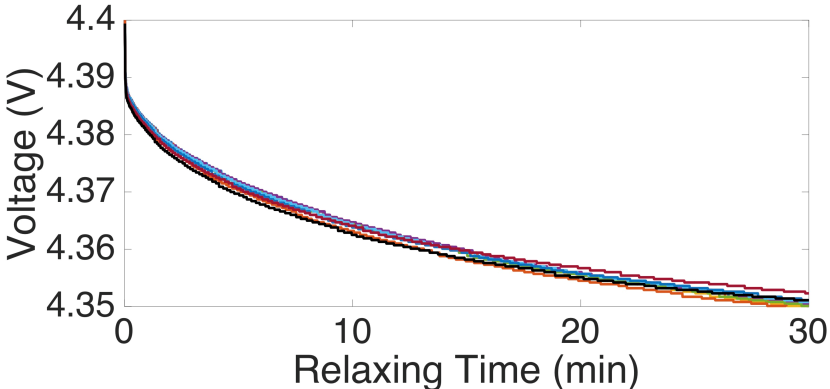
The relaxing voltages are not always collectable on mobile devices for the following reasons. First, the relaxing voltage requires batteries to be idle (i.e., the -minute resting period in our cycling measurements). Mobile devices, however, discharge their batteries with continuous and dynamic currents even in idle mode, due to device monitoring and background activities [29, 30, 66]. Also, battery voltage is temperature-dependent [67, 68, 69], so a stable thermal environment is required to collect the relaxing voltages. This is challenging due to the well-publicized device overheating problem [70]. Last but not the least, the relaxing voltage is affected by its starting voltage. Fig. 21 compares the relaxing voltage when resting the battery at different voltages within [, ]V, showing a clear dependency between the relaxing voltage and its starting voltage level. Such dependency requires a unified starting voltage for the collection of relaxing voltages.
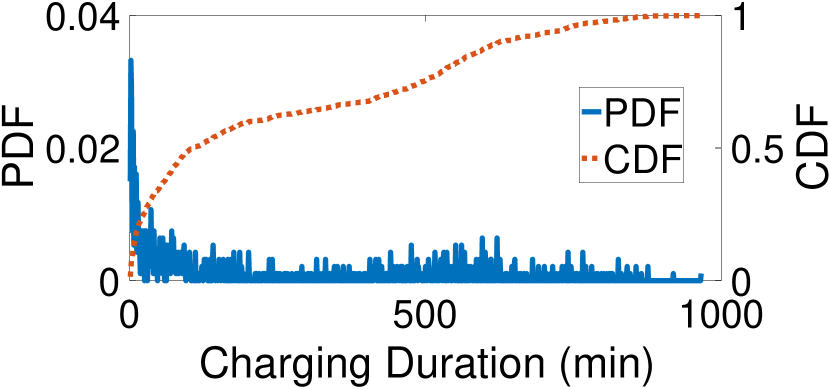
V-Health mitigates these challenges based on the fact that users often charge their devices over-night — the charging duration is so long that the charger is kept connected even after the device is fully charged. Fig. 21 plots the charging time (i.e., the time from the charger’s connection to disconnection) distribution of charge cases collected from users over – months,666One of the user-traces was collected from our data-collection campaign and the other six traces were obtained from the sample dataset of Device Analyzer from Cambridge University [34]. showing of them lasted over hours and are long enough to keep the charger connected after the device was fully charged, due to the common over-night charge [33, 34, 35]. V-Health starts to collect the relaxing voltage once the battery reaches SoC during over-night charge, and stops it when the charger is disconnected. This collection of relaxing voltages mitigates all the above-mentioned challenges.
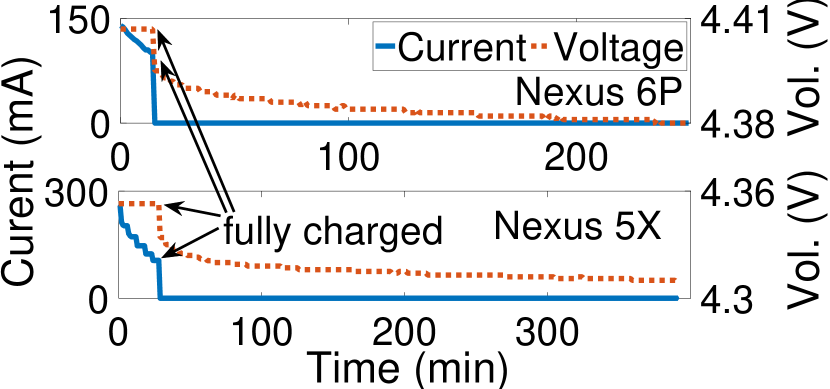
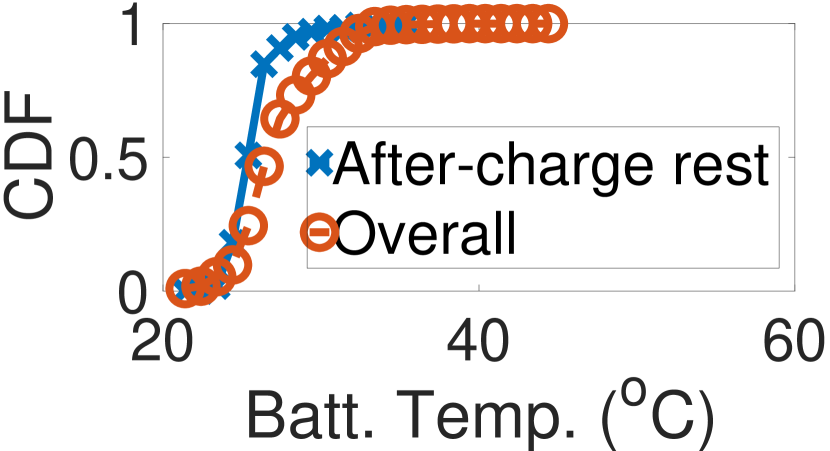
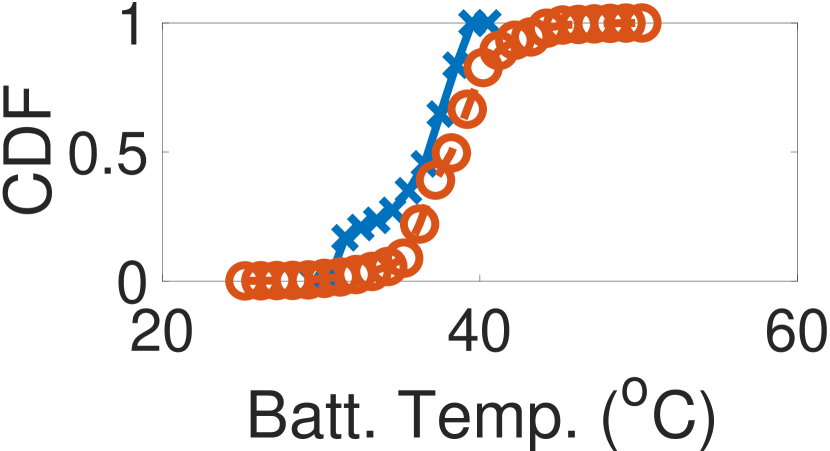
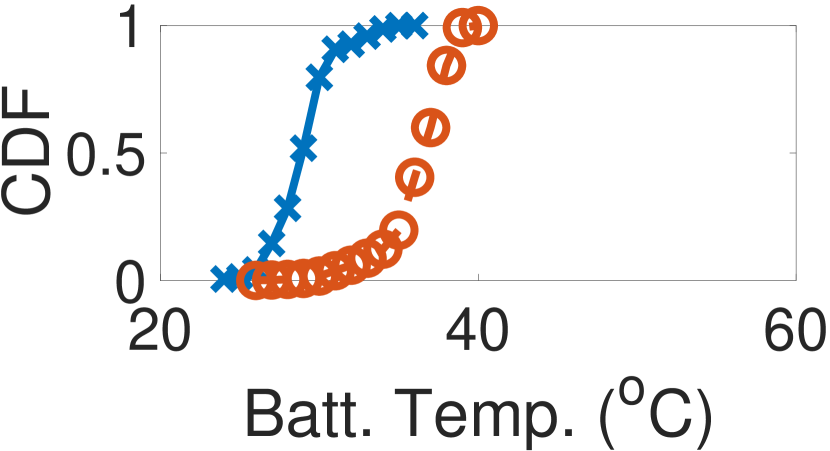
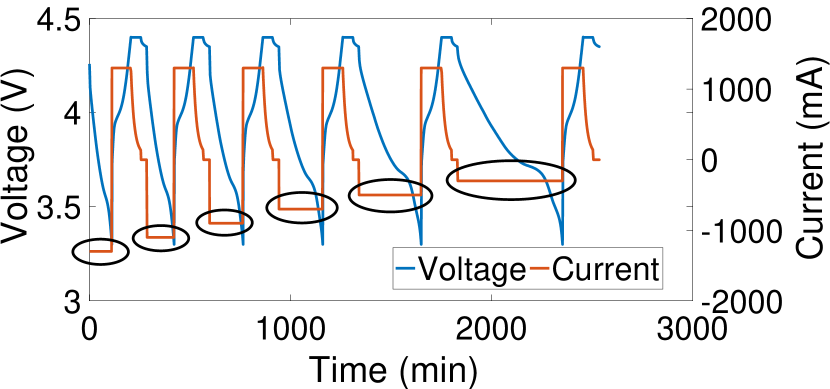
First, over-night device charge rests its battery by powering the device operation with the charger. Commodity chargers use separate power paths to charge the battery and power the device [31], resting the battery if the charger is kept connected even after the battery reaches SoC, as in over-night charge. Fig. 21 shows such rested batteries by keeping the chargers connected after fully charging a Nexus 6P and a Nexus 5X phone — the current reduces to, and stays at mA after fully charging the battery and thus resting the battery; the battery voltage first instantly and then gradually drops, agreeing with Fig. 9. Second, over-night charge provides battery a relatively stable thermal environment. Most mobile devices charge their batteries with CCCV [10], during which the CV-Chg phase takes long at a low charging rate, thus not heating the battery much and allowing for its equilibration. This way, the battery operates in a stable thermal environment during the resting period after the CV-Chg phase completes (and thus, the battery is fully charged). To verify this, we monitor the battery temperature of a Galaxy S6 Edge, a Nexus 5X, and a Nexus 6P during an -day real-life usage. Fig. 21 compares the temperature distribution during the resting periods after fully charging them with that under normal usage, showing reduced thermal variations, e.g., the temperature range of the Nexus 5X battery is narrowed from –oC in normal case to –oC when resting. Last but not the least, collecting relaxing voltages after the battery is fully charged unifies the starting voltage at the fully charged level, e.g., V for Galaxy S6 Edge.
We must also consider if a device’s usage pattern (i.e., how its battery is discharged) affects its after-charging relaxing voltages. To this end, we discharge, charge, and then rest a Galaxy S4 battery for (i) cycles with different discharge currents within [, ]mA (Fig. 22(a)), and (ii) another cycles with a different cutoff voltage within [, ]V (Fig. 22(b)). The thus-collected relaxing voltage traces during each resting period are plotted in Fig. 22(c). These relaxing voltages are very close to each other (e.g., in comparison with Fig. 21), exhibiting their insensitivity to previous discharge and thus reliability — a key advantage over [36] as shown in Fig. 4. Again, this is because the charge, especially CV-Chg, of the battery masks the disturbance caused by their previous discharge from the resting period after being fully charged.
6.2 Mitigating Trickle Charge
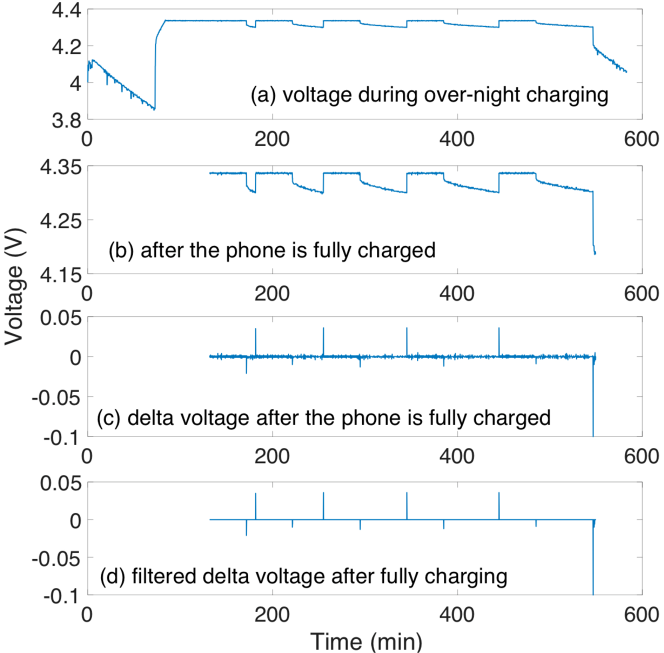
Certain mobile devices (e.g., Galaxy S6 Edge, Galaxy S4, etc.) use trickle charge — charging a fully charged battery under no-load at a rate equal to its self-discharge rate — to keep their battery at SoC, which invalidates the battery resting and thus pollutes the collected relaxing voltages.777A simple mitigation is to prevent trickle charge by disabling charge once the battery reaches SoC. For example, for Nexus 5X and Nexus 6P, this can be done by setting the battery_charging_enabled flag to , located at sys/class/power_supply/battery. This approach, however, lacks generality as the root privilege is needed. Specifically, these devices trigger trickle charge once the voltage of a fully-charged battery has dropped for a pre-defined value, e.g., mV for Galaxy S6 Edge and mV for Galaxy S4, and stop the trickle charge until the battery is fully charged again. Fig. 23(a) plots the voltage of a Galaxy S4 phone during an over-night charge, during which trickle charge is triggered times after the phone is fully charged, as shown in Fig. 23(b). The duration between two consecutive trickle charges increases because the battery OCV approaches the fully-charged level.
Trickle charge prevents battery from resting and thus pollutes the relaxing voltages. V-Health extracts relaxing sub-traces from the polluted trace with a simple observation that a sudden increase/drop of battery voltage indicates the triggering/stopping of trickle charge. Specifically, V-Health calculates the 1-lag delta voltage after the device is fully charged (Fig. 23(c)), and passes it through a low-pass filter (Fig. 23(d)). This way, V-Health extracts the relaxing sub-traces by locating the peaks and valleys in the trace.
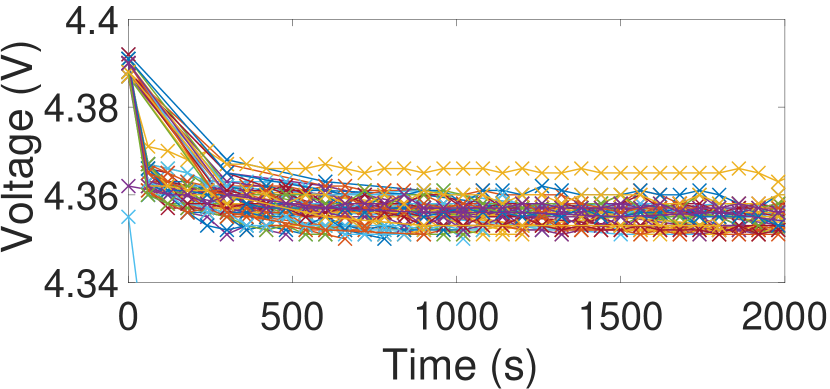
Fig. 24(a) plots of thus-extracted sub-traces with a Galaxy S5 phone, showing the power shape but with significant variance. To further improve trace quality, V-Health applies power fitting to each of these traces, concluding them to be valid if the goodness-of-fit is acceptable. Moreover, the sub-traces may not be long enough to form a fingerprint. To remedy this problem, V-Health recovers the sub-traces to, e.g., -minute traces, based on the power fitting, which is then used for fingerprint checking. Last but not the least, V-Health uses the dropped voltages upon resting as the fingerprint to remove its dependency on the specific values of fully-charged voltage. Fig. 24(b) plots the processed traces based on the raw data in Fig. 24(a).
6.3 Post-Processing of SoH Estimations
Multiple relaxing traces are likely to be collected and recovered during a single over-night charge (as in Fig. 23), and thus multiple SoH estimations may result. V-Health averages such estimations as the battery SoH during that charge. Also, there may be fluctuations among SoHs obtained from different over-night charges. V-Health uses a first-order smoother (i.e., estimating the current SoH by linear fitting current and previous raw SoH estimations) to smooth such fluctuations, and reports the smoothed result as the final battery SoH to users. Such smoothing of fluctuations is also used in the SoC estimation of mobile devices [14].
7 Evaluation
We evaluate V-Health using both laboratory experiments and field-tests on multiple Android phones.
7.1 Laboratory Experiments
We first evaluate V-Health based on the measurements summarized in Table 1. Relaxing voltages covering a -minute resting period are used as the fingerprint unless specified otherwise. For the purpose of comparison, we also implement the following three baseline methods:
-
•
Casals’: the final battery voltage after 5-min relaxation is linear in its SoH [45];
-
•
Bond’s: the final battery voltage after 30-min relaxation is quadratic in its SoH [46];
-
•
V-BASH: the power-factor of battery voltage is linear in its SoH [50].
Note that Casals’ and Bond’s are not always feasible on phones for field-tests as the required voltage after a fixed-duration relaxation may not be available due to the trickle charge.
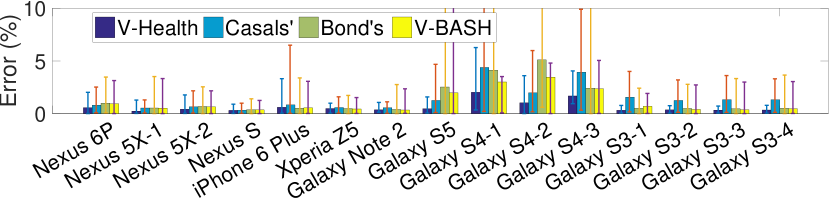
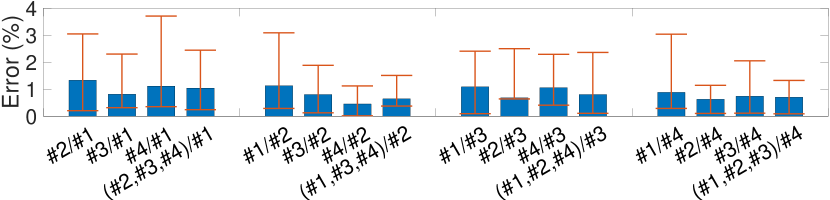
We first evaluate V-Health based on the dataset collected with each of the batteries, whose results are summarized in Fig. 25(a), in terms of the -th and -th percentiles of estimation errors (in absolute value) and their mean. V-Health estimates battery SoH with mean error, and most of them are bounded by , outperforming the three baselines in all the explored cases. More importantly, V-Health significantly reduces the variance in estimation error and thus is much more reliable when compared to the baseline methods.
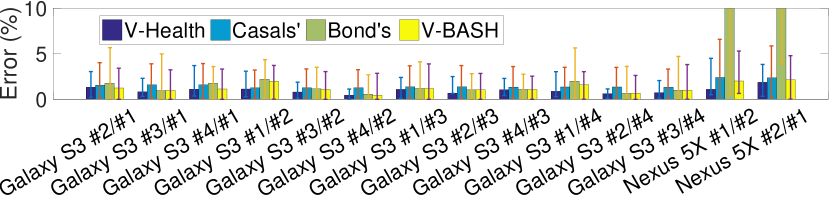
We also evaluate V-Health by training the fingerprint map with a battery and validate its accuracy with the traces collected with other same-model batteries, i.e., cross-battery validation. This is the real-life analogy of estimating battery SoH of local devices based on an offline-trained fingerprint map. Fig. 25(b) plots the validation results with four Galaxy S3 and two Nexus 5X batteries, the symbol denotes training with battery- and validating with battery-. The estimation error, albeit larger than the same-battery evaluation, is still bounded by in most cases.
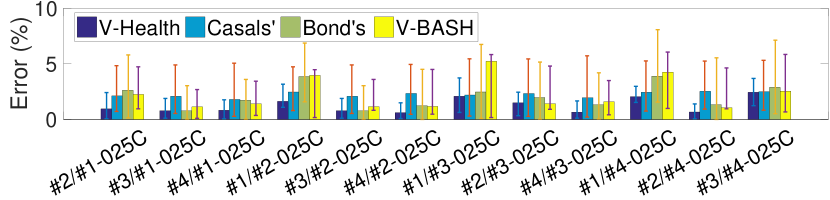
Users may charge their devices with different chargers from day to day, e.g., using USB or DC chargers. Next we use cross-profile evaluation to verify if V-Health is tolerable in such heterogeneous charger cases, with the four Galaxy S3 batteries as shown in Fig. 25(c). Specifically, we train V-Health with the dataset collected when charging with 0.5C, 4.20V, 0.05Ccccv, and validating its accuracy with the dataset collected when charging with 0.25C, 4.20V, 0.05Ccccv, i.e., with a constant charge current of mA, approximately same as when charging with standard downstream USB 2.0 ports. Comparison of Figs. 25(b) and 25(c) shows no clear evidence of degraded SoH estimation due to different charge profiles — although a few cases resulting in estimation error, the errors in most cases are comparable to Fig. 25(b) and some are even smaller, verifying V-Health’s robustness against charger heterogeneity.
V-Health’s reliability can be improved further by training it with multiple batteries. Fig. 25(d) plots the SoH estimation error when training V-Health with three of four Galaxy S3 batteries and using the fourth one for validation, and compares it with cases of single-battery training. The results show that training with multiple batteries reduces the variance in SoH estimation and thus improves V-Health’s reliability, at the cost of slightly increased error as compared to the best case achieved with single-battery training. Note that such best cases, however, are rather random in terms of the battery used for training, as shown in Fig. 25(d).
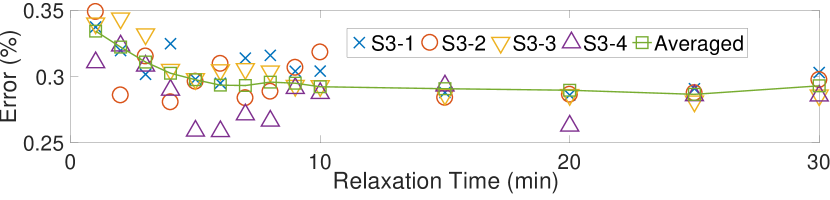
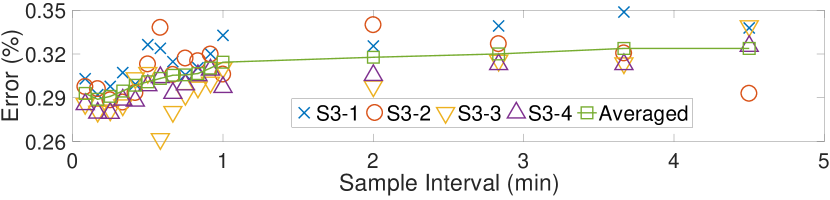
We have also explored the impact of relaxing time duration and the voltage sampling rates on V-Health’s accuracy in SoH estimation, as shown in Figs. 25(e) and 25(f), respectively. The results show the relaxing time need not be very long, e.g., the estimation error converges with -minute relaxation, but the -minute relaxation in Casal’s is not enough. Also, V-Health prefers higher sampling rates for fine-grained relaxing voltages.
7.2 Field-Tests on Android Devices
We have also implemented V-Health on multiple Android phones, including Galaxy S5, Galaxy S4, Galaxy Note 2, Nexus 6P, and Nexus 5X, and evaluated them over – months. To emulate real-life usage, these devices are discharged with various combinations of Youtube, flashlight, and an app called BatteryDrainer [71] that support different discharge rates, at an adaptive screen brightness, to a random SoC in the range of –. The devices are then charged for – hours (mostly over-night) during which the relaxing voltages are collected by sampling the system file /sys/class/power_supply/battery/voltage_now. We use additional batteries for each device module to train their respective fingerprint maps. The ground truth of the battery SoH of Galaxy S5, Galaxy S4, and Galaxy Note 2 are collected by removing the battery from the phones and fully charging/discharging them with the battery tester, with the same profile as the case of training their respective fingerprint maps. The SoH ground truth of Nexus 6P and Nexus 5X, whose batteries are not removable, is collected via Coulomb counting based on their current log during discharging, located at /sys/class/power_supply/battery/current_now. Although the thus-estimated ground truth may not be perfectly accurate due to the limitation of current sensing, this is the best estimation one can get as non-OEM researchers.888A non-removable battery can only be connected to the battery tester if an additional wire is soldered on to it, as we did when collecting the training traces with additional batteries. This, however, prevents putting the battery back to the phone.
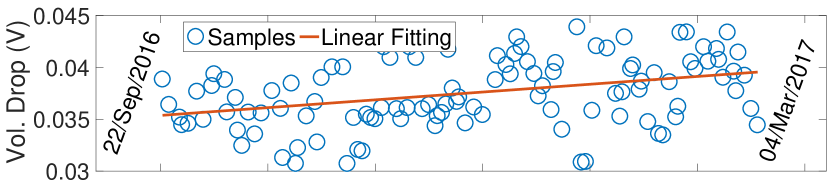
We first examine if the voltage-SoH relationship (as in Fig. 9) still holds on smartphones. Fig. 26 plots the voltage drop of a Galaxy S5 phone after -minute relaxation upon fully charged, during a period of over months. Note that the voltage after -minute relaxation may not be available due to trickle charge, in which case we use power fitting to predict such voltage. The voltage drop increases over usage, during which the battery SoH decreases, agreeing with Fig. 9. Significant variance, however, is observed in such voltage drops, indicates methods such as Bond’s and Casals’ — which estimate SoH based on a single voltage reading — may be unreliable. Also, the much pronounced variance in Fig. 26 when compared with those in Fig. 17 shows a clear difference between in-laboratory measurements and field-tests on mobile devices, due to the dynamic device operation.
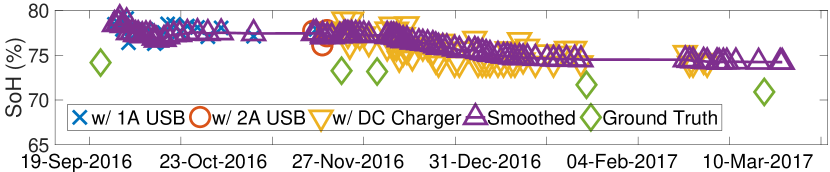
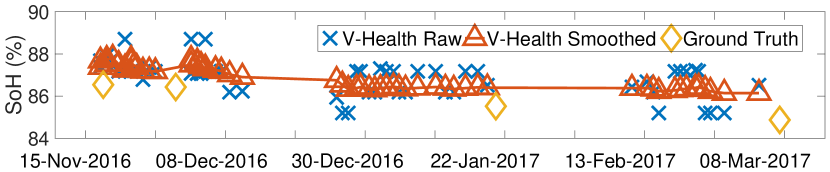
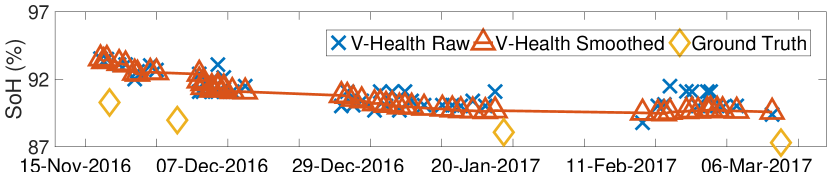
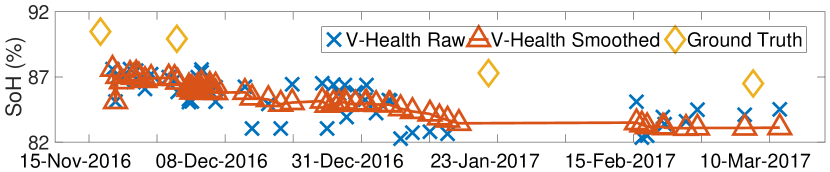
Next we check if V-Health can mitigate such variance and estimate SoH reliably. Fig. 27(a) summarizes the estimated battery SoH with Galaxy S5 from 22/09/2016 to 10/03/2017, together with the five ground truth SoHs measured on different dates, showing errors in SoH estimation. Also, as stated above, users may charge their devices with different chargers. To cover such cases, we charged the phone with different chargers during the evaluation, namely, A USB (22/09/2016 – 11/11/2016), A USB (11/11/2016 – 17/11/2016), and its associated DC charger (18/11/2016 – 10/03/2017). No clear dependency on SoH estimation accuracy and the charger selection is observed, demonstrating V-Health’s robustness against heterogeneous chargers. Finally, the first-order smoother reduces the variance and thus the fluctuations of SoH reported to users, as compared to the per-charge estimations. The evaluation results with Galaxy S4 and Note 2 phones are plotted in Figs. 27(b) and 27(c), showing – estimation error.
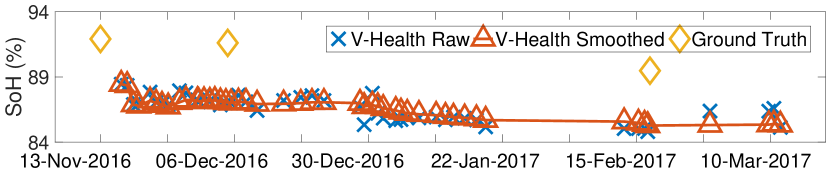
Figs. 27(d) and 27(e) plot the evaluation results with Nexus 6P and Nexus 5X, showing – error in SoH estimation. This relatively large error could be due partially, besides the inaccurate PMIC-provided current information, to battery’s rate-capacity effect — batteries deliver more capacity when discharged with less currents [72, 58]. The two phones have an average discharge current of mA when collecting their SoH ground truth, much less than the C discharge rate (i.e., mA for Nexus 6P and mA for Nexus 5X) used in training the fingerprint maps, thus leading to the over-estimation of the batteries’ full charge capacity and their SoH. Note that the first-order smoother needs at least samples, causing the initial fluctuation in the smoothed SoH in Fig. 27(e).
| Galaxy S5 | Galaxy S4 | Note 2 | Nexus 5X | Nexus 6P | |
|---|---|---|---|---|---|
| Casals’ | 52.5% | ||||
| Bond’s | 59.3% |
We have also tried to estimate these phones’ battery SoH with the two baseline methods Casals’ and Bond’s based on the same sets of collected relaxing voltages, as summarized in Table 4. Again, note that the required voltage after - or -minute relaxation may not be available due to trickle charge, in which case we use power fitting to predict such voltage and then use it to estimate SoH. The SoHs estimated by the two baseline methods have much larger error than V-Health, and even exceed or below in many cases, showing their unreliability on phones.
8 Use-Cases
V-Health also enables four novel use-cases that improve user experience from different perspectives.
8.1 SoH-Compensated SoC Estimation
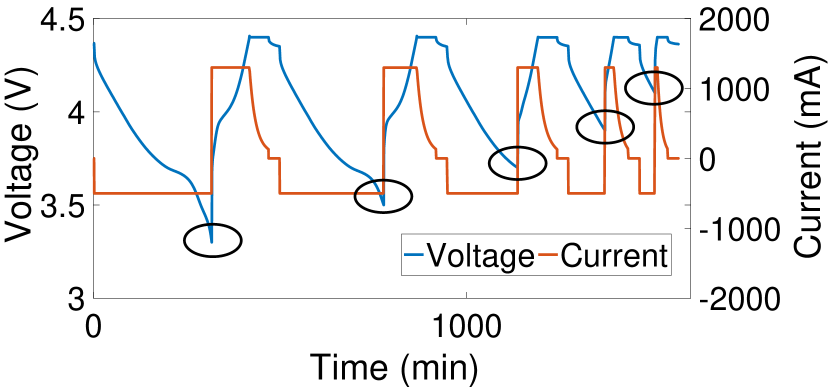
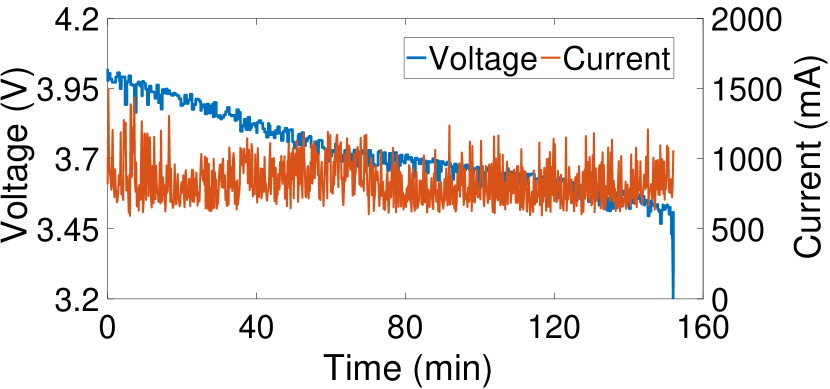
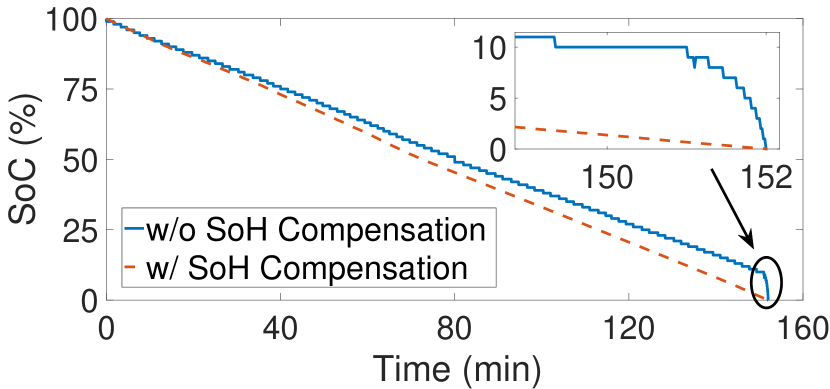
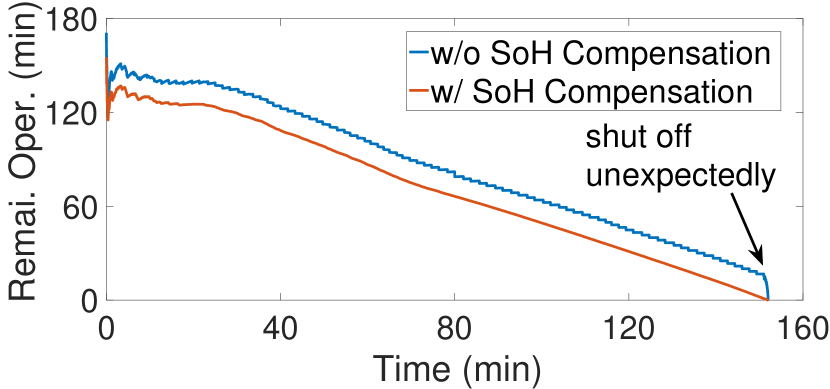
Besides answering the question “how long will my phone battery last?" with the interpretation of battery lifetime, V-Health also addresses this question in the remaining device operation time, by facilitating the SoH-compensated SoC estimation and thus the accurate estimation on phones’ remaining power supply. Fig. 28(a) plots the voltage and current when running a fully-charged Xperia Z phone with the BatteryDrainer until shutting off, delivering mAh capacity in total and thus indicating an SoH of . Fig. 28(b) plots the battery SoC shown to the user during the same discharge process — the phone shuts off with remaining SoC. Also plotted in Fig. 28(b) is the battery SoC compensated with the captured SoH degradation, e.g., by V-Health, based on Eq. (2), which provides users more accurate SoC estimation and thus alleviating shutting the phone off unexpectedly. Fig. 28(c) plots the thus-estimated remaining operation time based on the same approach used in TI’s Impedance Track [14] — the phone shuts off when thinking it can operate minutes longer due to battery degradation, which can be reliably mitigated with the SoH-compensated SoC estimation, enabled by V-Health.
8.2 Abnormal Battery Behavior Detection
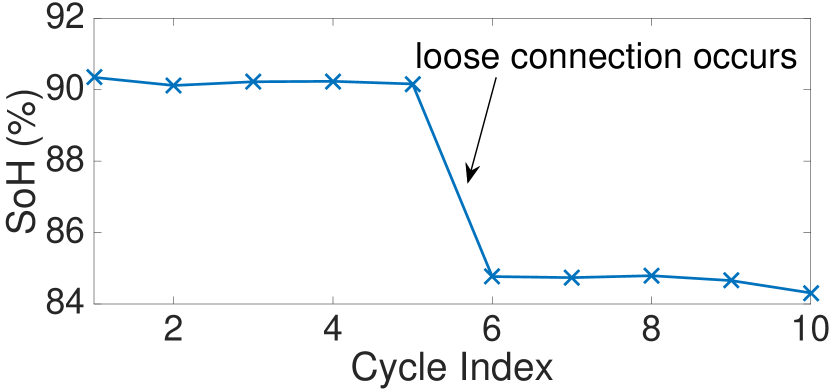
The battery SoH monitoring, enabled by V-Health, also allows to detect battery’s abnormal behavior. We show this with the example of detecting the loose connection between battery and the device, an issue found on devices such as Lumia 920 [73], iPhone 5 [74], and Note 4 [75]. Such loose connection increases the connecting resistance and thus device heating, pronouncing the risks of thermal runaway and even battery explosion if not detected in time [76]. The increased connecting resistance reduces battery’s usable capacity; in V-Health, this is observed as an unusual SoH drop and thus detectable. We charge/rest/discharge a Galaxy S5 battery for cycles to validate this: the battery is firmly connected to the tester in the first cycles; in the last cycles, a m resistor is inserted between the battery and the tester to emulate their loose connection. Fig. 31 plots the battery SoH reported by V-Health during these cycles. A clear SoH drop is observed when switching from the firm- to loose-connection settings, validating its detectability of V-Health. Such an unusual battery SoH drop is also explored and verified by Sood et al. [18], but with the assistance of an additional ultrasonic pulser and a nanofocus radiographic system.
8.3 Cross-User Battery Comparison
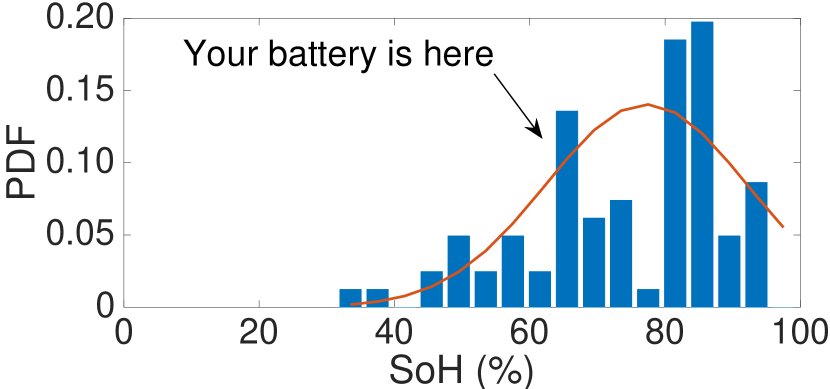
Another use-case enabled by V-Health is the cross-user comparison among batteries of same-model devices, as illustrated in Fig. 31 based on Li-ion batteries used in our laboratory. Such comparison not only allows users to locate their batteries’ strength among others, but also facilitates characterization of battery-friendly/harmful usage patterns, when coupled with energy diagnosis services that monitor devices’ daily usage, e.g., Carat [77].
8.4 Battery Resistance Monitoring
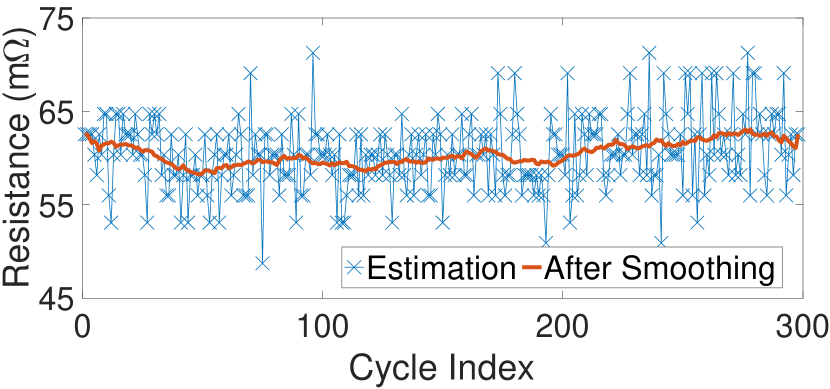
Batteries’ internal resistance increases as they age, reducing their usable capacity and pronouncing device heating. Battery resistance is traditionally estimated based on the voltage change when the current switches between two stable levels, i.e., [25, 48]. The requirements on stable current is to eliminate the influence of dynamic current on voltage response, which, however, does not hold on mobile devices in most cases. V-Health, by collecting the relaxing voltage — the current before the relaxation changes gradually and is small (i.e., during CV-Chg) and no current is applied to the battery after entering relaxation, allows for estimation of battery resistance as a by-product. Fig. 31 plots the estimated resistance of a Galaxy S3 battery based on after s relaxation [48], according to the relaxing voltages collected in Fig. 9. The battery resistance increases from m to m during the measurements, agreeing with the m ground truth measured with a BVIR battery resistance tester [78] afterwards these measurements. This resistance information helps users/OEMs diagnose their device batteries from another angle.
9 Conclusions
In this paper, we have designed, implemented, and evaluated V-Health, a low-cost user-level battery SoH estimation service for mobile devices based solely on their voltage, and thus is deployable on all commodity mobile devices. V-Health is inspired by our empirical finding that the relaxing battery voltage fingerprints its SoH, and is steered by 50 battery measurements, consisting of 13,377 charging/resting/discharging cycles in total and lasting over 72 months cumulatively. We have also presented four novel use-cases enabled by V-Health, improving mobile users’ experience in SoC estimation, abnormal behavior detection, cross-user comparison, and resistance monitoring. We have evaluated V-Health using both laboratory experiments and field-tests with multiple Android devices over - months, showing error in SoH estimation. A main takeaway from V-Health is the necessity to integrate physical battery properties with device usage behaviors in the battery management of user-centric systems such as smartphones.
References
- [1] iPhone 6s Program for Unexpected Shutdown Issues, 2017, https://www.apple.com/support/iphone6s-unexpectedshutdown/ .
- [2] Apple finally reveals the cause of its iPhone 6s "unexpected shutdown" bug, 2017, http://www.dailymail.co.uk/sciencetech/article-4000774/Apple-FINALLY-reveals-cause-iPhone-6s-unexpected-shutdown-bug-Chinese-website.html.
- [3] Nexus 6P goes from to almost straight away, 2017, https://productforums.google.com/forum/#!topic/nexus/SeB67voFk38.
- [4] Samsung Galaxy S4 turns off but still has battery life, 2017, http://forums.androidcentral.com/samsung-galaxy-s4/303065-samsung-galaxy-s4-turns-off-but-still-has-30-battery-life.html.
- [5] iPhone 5 shuts down with plenty of battery life left, 2017, https://discussions.apple.com/thread/5451794?start=45&tstart=0.
- [6] B. Xu, “Degradation-limiting Optimization of Battery Energy Storage Systems Operation,” Master Thesis, ETH, 2013.
- [7] Y. Zou, X. Hu, H. Ma, and S. E. Li, “Combined state of charge and state of health estimation over lithium-ion battery cell cycle lifespan for electric vehicles,” Journal of Power Sources, vol. 273, pp. 793 – 803, 2015.
- [8] G. L. Plett, “Recursive approximate weighted total least squares estimation of battery cell total capacity,” Journal of Power Sources, vol. 196, no. 4, pp. 2319 – 2331, 2011.
- [9] Android BatteryManager, 2017, https://developer.android.com/reference/android/os/BatteryManager.html.
- [10] H. M. A. and T. Sasu, “Understanding smartphone state of charge anomaly,” in HotPower’15, 2015.
- [11] A. Pathak, Y. C. Hu, and M. Zhang, “Bootstrapping energy debugging on smartphones: A first look at energy bugs in mobile devices,” in HotNets’11, 2011.
- [12] D. Andre, C. Appel, T. Soczka-Guth, and D. U. Sauer, “Advanced mathematical methods of soc and soh estimation for lithium-ion batteries,” Journal of Power Sources, vol. 224, pp. 20 – 27, 2013.
- [13] M. E. Lakkis, O. Sename, M. Corno, and D. B. Pietri, “Combined battery soc/soh estimation using a nonlinear adaptive observer,” in ECC’15, 2015.
- [14] M. Yu, Y. Barsukov, and M. Vega, “Theory and implementation of Impedance Track battery fuel-gauging algorithm in bq2750x family,” Application Report, SLUA450, 2008.
- [15] M. Brewis, “How to fix poor battery life on android 5.0 lollipop and android 6.0 marshmallow,” TechAdvisor, 2016.
- [16] C. Min, Y. Lee, C. Yoo, S. Kang, S. Choi, P. Park, I. Hwang, Y. Ju, S. Choi, and J. Song, “Powerforecaster: Predicting smartphone power impact of continuous sensing applications at pre-installation time,” in SenSys’15.
- [17] T. A. Dao, I. Singh, H. V. Madhyastha, S. V. Krishnamurthy, G. Cao, and P. Mohapatra, “Tide: A user-centric tool for identifying energy hungry applications on smartphones,” IEEE/ACM Transactions on Networking, vol. PP, no. 99, pp. 1–16, 2017.
- [18] B. Sood, M. Osterman, and M. Pecht, “Health monitoring of lithium-ion batteries,” in ISPCE’13, 2013.
- [19] J. Christophersen, J. Morrison, W. Morrison, and C. Motloch, “Rapid impedance spectrum measurements for state-of-health assessment of energy storage devices,” SAE Int. J. Passeng. Cars - Electron. Electr. Syst., vol. 5, no. 1, pp. 246–256, 2012.
- [20] A. Eddahech, O. Briat, N. Bertrand, J.-Y. DelAtage, and J.-M. Vinassa, “Behavior and state-of-health monitoring of li-ion batteries using impedance spectroscopy and recurrent neural networks,” International Journal of Electrical Power and Energy Systems, vol. 42, no. 1, pp. 487 – 494, 2012.
- [21] A. Widodo, M.-C. Shim, W. Caesarendra, and B.-S. Yang, “Intelligent prognostics for battery health monitoring based on sample entropy,” Expert Systems with Applications, vol. 38, no. 9, pp. 11 763 – 11 769, 2011.
- [22] C. Weng, J. Sun, and H. Peng, “A unified open-circuit-voltage model of lithium-ion batteries for state-of-charge estimation and state-of-health monitoring,” Journal of Power Sources, vol. 258, pp. 228 – 237, 2014.
- [23] MAX 17040/17041 Fuel Gauge, 2017, https://datasheets.maximintegrated.com/en/ds/MAX17040-MAX17041.pdf.
- [24] K. S. Ng, C.-S. Moo, Y.-P. Chen, and Y.-C. Hsieh, “Enhanced coulomb counting method for estimating state-of-charge and state-of-health of lithium-ion batteries,” Applied Energy, vol. 86, no. 9, pp. 1506 – 1511, 2009.
- [25] F. Xu, Y. Liu, Q. Li, and Y. Zhang, “V-edge: Fast self-constructive power modeling of smartphones based on battery voltage dynamics,” in NSDI’13, 2013.
- [26] M. M. m3 Fuel Gauge, 2017.
- [27] B. Giovino, “Making sense of current sensing,” While Paper, 2015.
- [28] Ampere the charging meter, 2017, http://forum.xda-developers.com/android/apps-games/app-ampere-charging-meter-t3012890.
- [29] X. Chen, N. Ding, A. Jindal, Y. C. Hu, M. Gupta, and R. Vannithamby, “Smartphone background activities in the wild: Origin, energy drain, and optimization,” in MobiCom’15, 2015.
- [30] L. He, G. Meng, Y. Gu, C. Liu, J. Sun, T. Zhu, Y. Liu, and K. G. Shin, “Battery-aware mobile data service,” IEEE Transactions on Mobile Computing, vol. 16, no. 6, pp. 1544–1558, 2017.
- [31] Y. Barsukov and J. Qian, “Battery power management for portable devices,” Artech House, p. 67, 2013.
- [32] L. He, Y.-C. Tung, and K. G. Shin, “User-interactive charge of mobile devices,” in MobiSys’17, 2017.
- [33] D. Ferreira, A. K. Dey, and V. Kostakos, “Understanding human-smartphone concerns: A study of battery life,” in Pervasive’11, 2011.
- [34] D. Wagner, A. Rice, and A. Beresford, “Device analyzer: Understanding smartphone usage,” in MOBIQUITOUS’13, 2013.
- [35] N. Banerjee, A. Rahmati, M. Corner, S. Rollins, and L. Zhong, “Users and batteries : Interactions and adaptive energy management in mobile systems,” in Ubicomp’07, 2007.
- [36] Z. Guo, X. Qiu, G. Hou, B. Y. Liaw, and C. Zhang, “State of health estimation for lithium ion batteries based on charging curves,” Journal of Power Sources, vol. 249, pp. 457 – 462, 2014.
- [37] W. Waag, C. Fleischer, and D. U. Sauer, “Critical review of the methods for monitoring of lithium-ion batteries in electric and hybrid vehicles,” Journal of Power Sources, vol. 258, pp. 321 – 339, 2014.
- [38] J. Zhang and J. Lee, “A review on prognostics and health monitoring of li-ion battery,” Journal of Power Sources, vol. 196, no. 15, pp. 6007 – 6014, 2011.
- [39] T. Kim, W. Qiao, and L. Qu, “Online soc and soh estimation for multicell lithium-ion batteries based on an adaptive hybrid battery model and sliding-mode observer,” in ECCE’13, 2013.
- [40] H. Singh, T. G. Palanisamy, R. B. Huykman, and W. C. Hovey, “Systems and method for determining battery state-of-health,” Patent US, 6,469,512 B2, 2002.
- [41] A. R. Papana, H. N. ingh, H. A. Kojori, S. Keshri, and D. Lazarovich, “Method and apparatus for online determination of battery state of charge and state of health,” Patent US, 9,157,966, 2015.
- [42] Y.-H. Chiang and W.-Y. Sean, “Apparatus for estimating battery state of health,” Patent US, 2011/0 148 424 A1, 2011.
- [43] A. Zenati, P. Desprez, H. Razik, and S. Rael, “A methodology to assess the state of health of lithium-ion batteries based on the battery’s parameters and a fuzzy logic system,” in IEVC’12, 2012.
- [44] A. Marongiu and D. U. Sauer, “On-board aging estimation using half-cell voltage curves for LiFePO4 cathode-based lithium-ion batteries for EV applications,” International Journal of Automotive Technology, vol. 17, no. 3, pp. 465–472, 2016.
- [45] L. C. Casals, A. M. S. Gonz lez, B. A. Garc a, and J. Llorca, “Phev battery aging study using voltage recovery and internal resistance from onboard data,” IEEE Transactions on Vehicular Technology, vol. 65, no. 6, pp. 4209–4216, June 2016.
- [46] J. Bond, J. Dermott, and E. Listerud, “Systems and methods for determining battery state-of-health,” Patent US, 9,244,132, 2016.
- [47] K.-H. Tseng, J.-W. Liang, W. Chang, and S.-C. Huang, “Regression models using fully discharged voltage and internal resistance for state of health estimation of lithium-ion batteries,” Energies, vol. 8, no. 4, p. 2889, 2015.
- [48] H.-G. Schweiger, S. Obidi, O. Komesker, A. Raschke, M. Schiemann, C. Zehner, M. Gehnen, M. Keller, and P. Birke, “Comparison of several methods for determining the internal resistance of lithium ion cells,” Sensors, vol. 10, pp. 5604 – 5625, 2010.
- [49] Qualcomm, “PM8916 Device Specification,” 2015.
- [50] L. He, E. Kim, K. G. Shin, G. Meng, and T. He, “Battery state-of-health estimation for mobile devices,” in ICCPS’17, 2017.
- [51] Y. Zhang and C.-Y. Wang, “Cycle-Life Characterization of Automotive Lithium-Ion Batteries with Cathode,” Journal of The Electrochemical Society, vol. 156, no. 7, pp. A527–A535, 2009.
- [52] H. Song, Z. C. an Xiong Chen, H. Lu, M. Jia, Z. Zhang, yanqing Lai, J. Li, and Y. Liu, “Capacity fade of /graphite cell at elevated temperature,” Journal of Solid State Electrochem, vol. 17, pp. 599–605, 2013.
- [53] G. Ning and B. N. Popov, “Cycle Life Modeling of Lithium-Ion Batteries,” Journal of The Electrochemical Society, vol. 151, no. 10, pp. A1584–A1591, 2004.
- [54] L. Lam and P. Bauer, “Practical Capacity Fading Model for Li-Ion Battery Cells in Electric Vehicles,” IEEE Transactions on Power Electronics, vol. 28, no. 12, pp. 5910–5918, 2013.
- [55] S. S. Choi and H. S. Lim, “Factors that affect cycle-life and possible degradation mechanisms of a li-ion cell based on licoo2,” Journal of Power Sources, vol. 111, no. 1, pp. 130 – 136, 2002.
- [56] M. Yu and M. Vega, “Impedance track fuel gauge accuracy test for gsm phone applications,” Application Report, SLUA455, 2008.
- [57] NEWARE BTS4000, 2017, http://www.newarebattery.com/index.php/products/bts3000.
- [58] A. Badam, R. Chandra, J. Dutra, A. Ferrese, S. Hodges, P. Hu, J. Meinershagen, T. Moscibroda, B. Priyantha, and E. Skiani, “Software defined batteries,” in SOSP’15, 2015.
- [59] R. Melichar, “State of charge tracking systems for battery systems based on relaxation voltage,” Patent US, 7,453,238, 2008.
- [60] T. C. Greening, J. G. Koller, N. E. Mattisson, and P. J. Ungar, “Estimating state of charge (SoC) and uncertainty from relaxing voltage measurements in a battery,” Patent US, 9,128,162, 2015.
- [61] TENERGY Li-ion Battery, 2017, http://www.jameco.com/Jameco/Products/ProdDS2144243.pdf.
- [62] Panasonic Li-ion Battery, 2017, https://www.math.ubc.ca/ wetton/papers/NCR18650B.pdf.
- [63] C. Weng, J. Sun, and H. Peng, “An open-circuit-voltage model of lithium-ion batteries for effective incremental capacity analysis,” in DSCC’13, 2013.
- [64] M. Muller, “Information retrieval for music and motion,” Springer, pp. 69 – 84, 2007.
- [65] C. Zhang, Y. Jiang, J. Jiang, G. Cheng, W. Diao, and W. Zhang, “Study on battery pack consistency evolutions and equilibrium diagnosis for serial- connected lithium-ion batteries,” Applied Energy, 2017. [Online]. Available: http://www.sciencedirect.com/science/article/pii/S0306261917307298
- [66] N. Balasubramanian, A. Balasubramanian, and A. Venkataramani, “Energy consumption in mobile phones: a measurement study and implications for network applications,” in IMC’09, 2009.
- [67] Temperature on Battery Voltage, 2017, http://www.trojanbattery.com/Tech-Support/FAQ/Temperature.aspx.
- [68] O. Erdinc, B. Vural, and M. Uzunoglu, “A dynamic lithium-ion battery model considering the effects of temperature and capacity fading,” in ICCEP’09, 2009, pp. 383–386.
- [69] S. Mendoza and H. K. Fathy, “Entropy coefficient and thermal time constant estimation from dynamic thermal cycling of a cylindrical lifepo4 battery cell,” in DSCC’14, 2014.
- [70] R. Tyrsina, “What Causes Android Heating Issues and How to Avoid,” 2017, http://techpp.com/2011/08/18/android-heating-issues-causes-and-how-to-avoid/.
- [71] Battery Drainer, 2017, https://play.google.com/store/apps/details?id=com.batterydrainer&hl=en.
- [72] D. Rakhmatov, S. Vrudhula, and D. A. Wallach, “Battery lifetime prediction for energy-aware computing,” in ISLPED’02, 2002.
- [73] Loose/wobble battery fixed, 2017, http://forums.windowscentral.com/nokia-lumia-920/215447-loose-wobble-battery-fixed.html.
- [74] Battery Loose Inside iPhone 5, 2017, http://forums.macrumors.com/threads/battery-loose-inside-iphone-5.1471386/.
- [75] Charging port loose, 2017, http://forums.androidcentral.com/samsung-galaxy-note-4/502269-charging-port-loose.html.
- [76] J. Rocci and W. Wilczewski, “Battery connection resistance,” 2015.
- [77] A. J. Oliner, A. P. Iyer, I. Stoica, E. Lagerspetz, and S. Tarkoma, “Carat: Collaborative energy diagnosis for mobile devices,” in SenSys’13, 2013.
- [78] BVIR – Portable AC Resistance Tester, 2017, http://www.newarebattery.com/index.php/products/bvir.