Quantum mechanics, universal scaling and ferroelectric hysteresis regimes in the giant squid axon propagating action potential: a Phase Space Approach
Abstract
Hodgkin and Huxley described sodium and potassium currents with empirical parameters obtained with voltage clamp experiments of the squid axon membrane. Their reconstruction of the action potential is somewhat inaccurate, especially in the recovery region. We have analyzed a simpler experiment, the steady propagation by the fully functioning action potential and have described the sodium and potassium currents in terms of the corresponding ionic time rates, the maximum conductance and fractions of open channels. Time derivatives of the experimental action potential and its velocity of propagation, the radius of the axon and its capacitance, and the resistivity of axoplasm, yield the capacitive, membrane, and total ionic currents of the charge conserving cable equation. Plots of currents as functions of potential in the recovery region of the action potential reveal the presence of outgoing overlapping potassium and sodium currents with quasilinear segments. We have redefined the elusive Avrami parameter as where is the dimensionless and temperature independent fine-structure constant = 0.007297352… , is the temperature dependent X channel’s time rate and is the Avrami exponent. Fits of fractions of open channels with so modified Avrami equations reveal the partial overlap of the incoming sodium current in the rising edge segment and a small, but physically significant, sodium polarization current straddling the peak of the action potential. Our fits reveal two different lattices of sodium channels separated by a continuous phase changes, one from the inception of the action potential to its peak and the other in the recovery region. We find that the propagation of the action potential leads with its own excitation triggered by the continuous phase change of sodium channels lattice coinciding with the initiation of the incoming sodium current, flipping the resting potential sodium’s channels lattice symmetry to the excited symmetry lattice. The polarization flip at the peak of the action potential reverts the symmetry to the resting potential symmetry. Plots of ionic time rates as Boltzmann kinetic rates yield activation energies of the same order as the rate-limiting biochemical metabolic reactions indicating that the passage of ions through the membrane is mediated by biochemical reactions. Evidence is presented that action potential traverses a heat releasing ferroelectric hysteresis loop. The heat released by the ferroelectric hysteresis loop at 19.8 oC is estimated to be twice as large as the heat released at 4.5 oC. Also, the fact that the propagation constant from the cable equation and the maximum sodium conductance have similar exponential behavior with temperature allows to calculate the optimum sodium channel density that is close to the observed density. The existence of sodium channels domains with two different symmetries, albeit only one being stable in squid axon, suggests the existence of neurons with at least 2 stable states, the necessary condition for storage and retrieval of memories. The critical role of ferroelectric sodium channels lattice behavior has far reaching implications for neuron excitability and, encoding and storing of memories. It is expected that presented results will provide the framework for further analysis of biological excitability, ion channels lattice structure, thermodynamic phase changing behavior, and the role of quantum mechanics in biochemical reactions mediating the flow of ions trough ion channels.
I Introduction
The initiation and propagation of the action potential in the giant squid axon has been described by the Hodgkin-Huxley [1, 2] empirical equations in terms of sodium, potassium and leak currents traversing the membrane. The experimental input for the H-H approach comes from separate voltage clamp experiments for sodium and potassium currents fitted in part with with empirical parameters. However, a description of the squid axon behavior based on first-principles physics has yet to be achieved.
A 2018 review by Drukarch et al. [3] describes alternative models that include non-electrical phenomena accompanying nerve impulse propagation and calls for a multidisciplinary approach to tackle the nerve impulse behavior.
In the present work, using the Rosenthal-Bezanilla [4] experimental data, we present a Phase Space based phenomenological theory for the steady propagation of the action potential that includes elements of thermodynamics such as first order and continuous phase transitions, Boltzmann’s kinetics, and heat release. (Note that Kepler’s planetary orbits are phase space trajectories.) The first and second time derivatives of the experimentally functioning action potential and its velocity of propagation, the capacitance of the axon and its radius, and the resistivity of axoplasm, yield the capacitive, membrane, and total ionic currents of the charge conserving cable equation. Identified quasilinear segments of the capacitive and ionic currents yield the time rates and related maximum conductance for sodium and potassium currents. Plotting ionic time rates as Boltzmann’s kinetic rates yields ionic activation energies of the same order as the average of 0.65 eV rate-limiting metabolic biochemical reactions. The propagation constant and sodium maximum conductance have similar temperature dependance allowing the evaluation of a realistic optimum density of sodium ions.
Cope [5] fitted the experimental potassium conductance data of Hodgkin and Huxley [2] with Avrami equation [6, 7, 8] and posited that ”the excitation of nerve axon impulse involves a phase transition”.
In the present work, we have introduced the ionic time rates and given physical meaning to the temperature dependent Avrami parameter as . The fractions of open ionic and polarization channels are fitted with the so modified Avrami (mAvrami) equations seeded with the value of the dimensionless and temperature independent fine-structure constant (FSC): = 0.007297352 ..(See what Richard Feynman said about the FSC [9]). Bertil Hille wrote [10] : ”Ion channels are found in the membranes of all cells,..”. It follows that ion channels are essential for life. Our phenomenological fitting of fractions of open channels in the lab frame points to the universal role of the FSC in the flow of ions through channels. We conclude that the FSC is essential for life as we know it and plays an exacting role in the rate-limiting biochemical reactions mediating the passage of ions through ion channels.
We have also fitted fractions of open sodium and potassium channels as functions of potential. The fractions of open channels at a given potential and temperature are interpreted as the fraction of time that the corresponding single channel is stochastically open.
Continuous phase transitions at the inception of incoming sodium current and its reversal at the peak of the action potential involve symmetry change of sodium channels lattice/domains. The resulting ferroelectric hysteresis loop is described in terms of effective ionic reversal potentials. The estimated heat released at 19.8 oC is about double of heat released at 4.5 oC.
The crucial role of sodium channels domains in the propagation of the action potential suggests their role in excitation in general and in optical phenomena, heat release and raises questions of their pharmacological implications.
Furthermore, the existence of sodium channels domains with two different symmetries, albeit only one being stable in squid axon, suggests the existence of neurons with more than one stable state. This is a necessary condition for storage and retrieval of memories. J. J. Hopfield in his paper [11] ”Neural networks and physical systems with emergent collective computational abilities” writes the following: ”A study of emergent collective effects and spontaneous computation must necessarily focus on the nonlinearity of the input-output relationship. The essence of computation is nonlinear logical operations.” and ”Thus, we consider a network of ”on or off” neurons, …”. ”On or off” neurons implies neurons with two different stable states. The last reference in Hopfield paper is ”Kandel, E. R. (1979) Sci. Am. 241, 61-70”. Over a period of many years Eric Kandel and collaborators experimented with the sea slug Aplysia californica and showed that short-term memory is created by strengthening existing synapses and that long-term memory is stored by the creation of new synapses. These processes require morphological changes in neurons and synapses. See Kandel’s Nobel Lecture ”The Molecular Biology of Memory Storage: A Dialog Between Genes and Synapses” [12].
II Analysis
Is the propagating action potential a thermodynamic system with an equation of state? A thermodynamic system in equilibrium is described by a functional relationship, called equation of state, among Temperature and pairs of intensive and extensive thermodynamic parameters: Pressure, Volume; Magnetic Field, Magnetic Susceptibility; Electric Field, Polarization; etc (see [13]).
The steady state propagating action potential is described in the laboratory by the charge conserving cable equation. See [14]) for an example of its derivation:
| (1) |
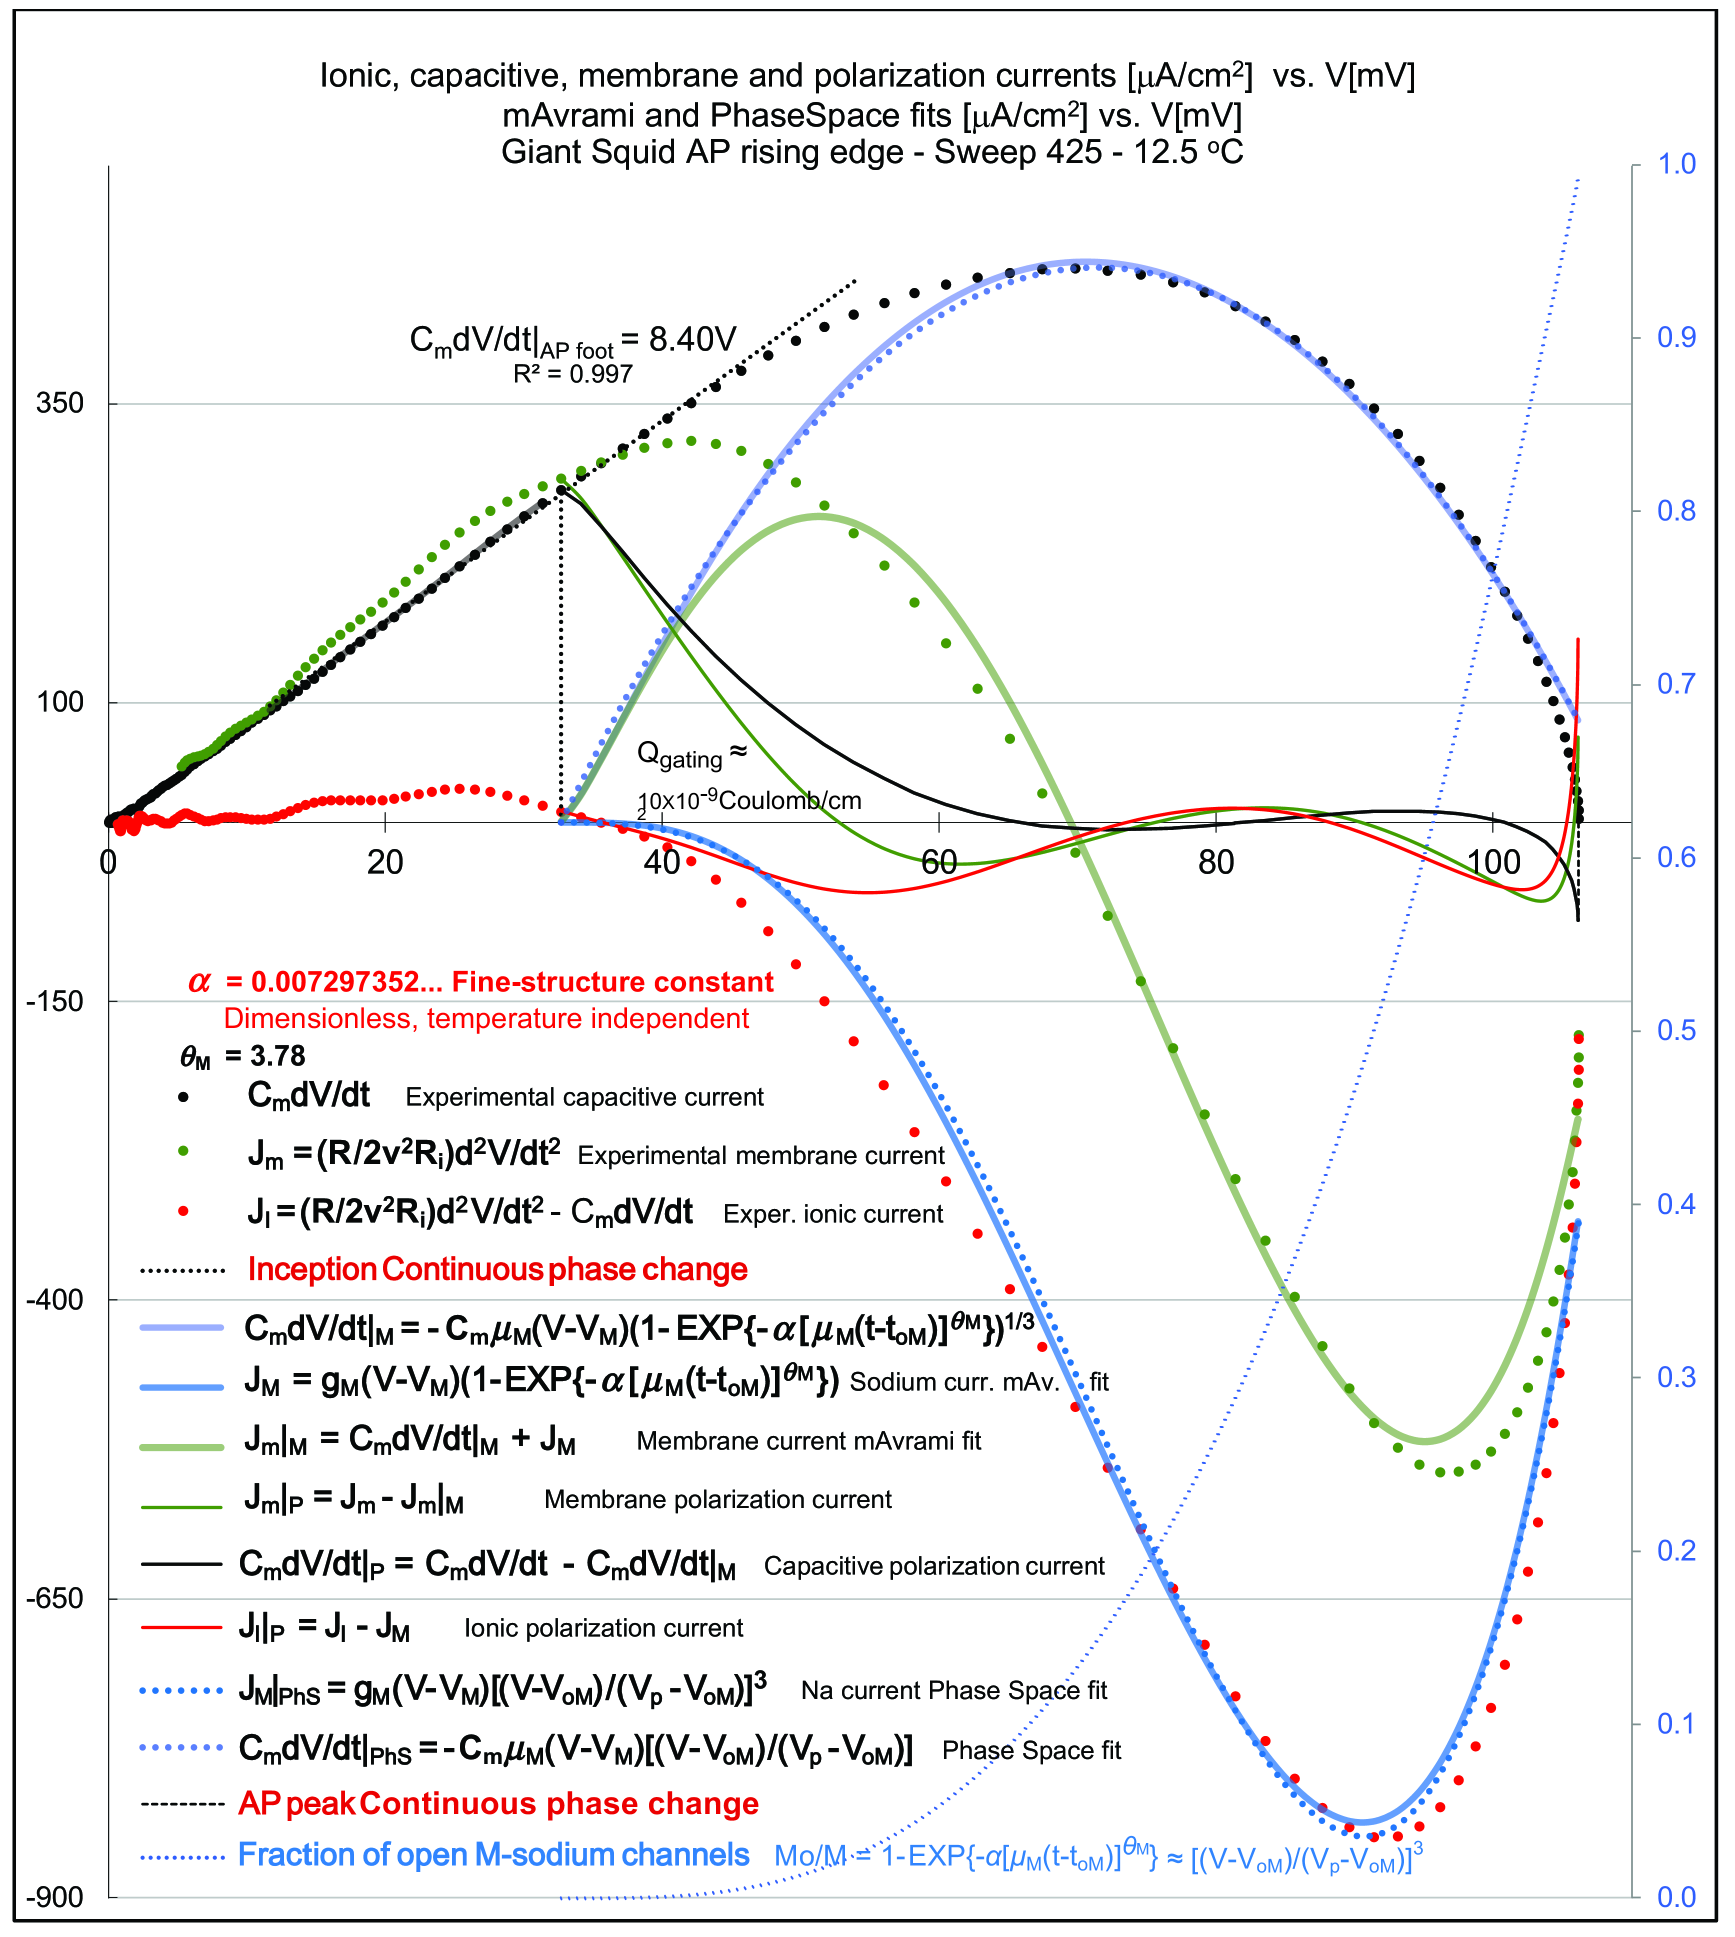
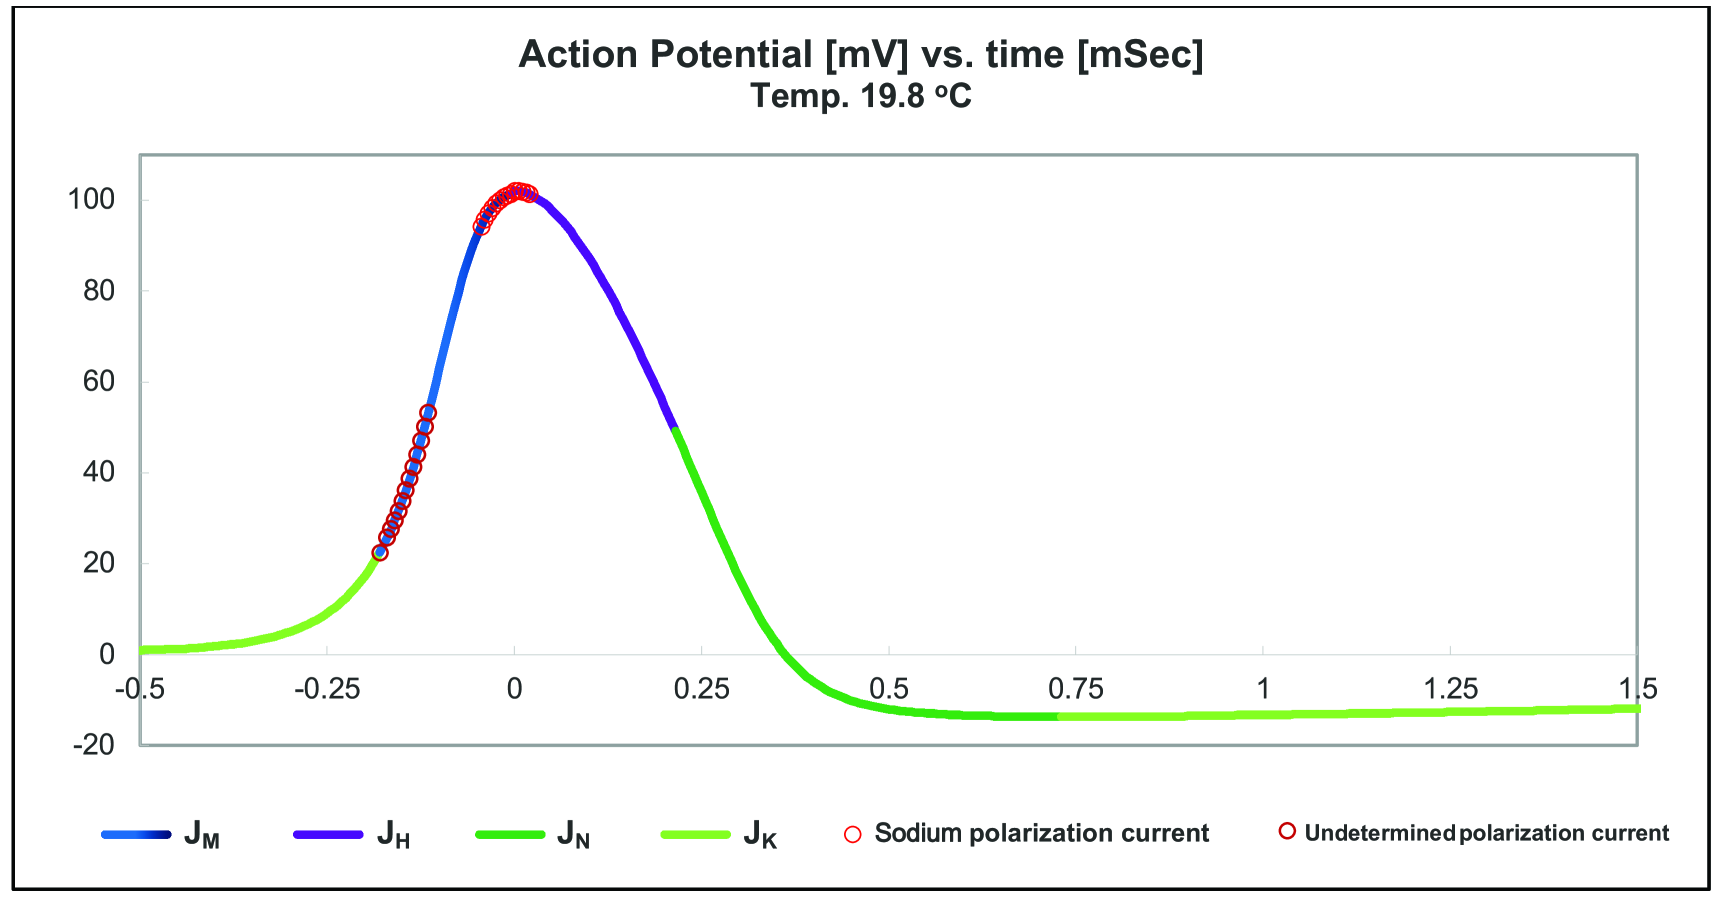
where the experiment provides the action potential as a function of time (See Fig. 1), is the membrane capacitance per , is the axon radius, is the temperature dependent resistivity of the axoplasm and is the temperature dependent velocity of propagation for the action potential. The first and the third term of Eq. (1) are the capacitive and the so-called membrane current respectively. is the total ionic current traversing the membrane of the axon. According to Eq. (1) the total ionic current is equal to the membrane current minus the capacitive current. Thus, the total ionic current is determined by the first and the second derivative of the action potential data of a fully functioning axon and by the propagation constant = 2. By contrast, the total ionic current in the H-H approach is the sum of empirically fitted sodium and potassium currents obtained from separate voltage clamp experiments plus an ad hoc leak current. The reconstructed H-H action potential is somewhat inaccurate, especially in the recovery region.
The steadily propagated action potential appears at rest in the frame of reference moving with velocity along the axis of its motion and it is independent of time. Furthermore, the potential and the total ionic current are invariant under Lorentz transformation connecting the two frames. The action potential propagating with constant velocity is interpreted as a thermodynamic system in equilibrium. The induced polarization is function of electrical field which is proportional to the potential measured across the thickness of the axon’s membrane. The ferroelectric equation of state for the propagating action potential takes the form of f(Temperature, Electric Field, Polarization) = 0. The two dimensional nature of the axon membrane renders the ferroelectric equation of state to be a function of temperature and electric potential.
All three terms of Eq. (1) are time dependent in Lab. However, since there is a one to one relationship between potential and time, the propagating steady state is conveniently described in Phase Space [15] without explicit time dependance. Differently colored regions of the graph in Fig. 1 correspond to specifically identifiable regions in the phase space of currents vs. potential .
The phase space trajectories represent the time evolution of the system and its shape can expose properties of the system that might not be obvious otherwise. In particular we shall identify and describe the diverse colored segments of vs. from Fig. 1 in the phase space graphs Figures 2, 3 and 4 and in Fig. 13(b) and Fig. 13(d) of the hysteresis phase space trajectory. The colored segments correspond to
-
1.
At the foot of the action potential a small quasi linear outgoing current, mostly potassium, chloride and sodium-potassium exchange transport. Keynes [16] demonstrated that chloride is actively transported in squid axons and concluded: ”….that there is a separate channel for active inward transport of chloride”. The reversal potential of chloride ionic channel is about 15 mV above the resting potential. Chloride and potassium channels stabilize the membrane potential.
-
2.
The continuous (second order) phase transition from H-Lattice symmetry into M-Lattice symmetry is triggered while keeping the total currents continuous. The H-Lattice region holds an unresolved combination of mostly potassium, chloride and sodium currents. The continuous phase change results in the inception of three charge conserving mAvrami currents: the incoming sodium, capacitive current and membrane current all three starting from zero, and the three corresponding charge conserving polarization currents. The capacitive polarization currents, known as gating currents, were detected in 1973-1974 (See [17], [18] and [19]). The simultaneous inception of the incoming sodium current and the capacitive polarization current (gating current) is consistent with the conclusion reached with experiments as reported by Armstrong and Bezanilla [18]: ”Gating Current is Associated with Na Activation”. The surface under the capacitive polarization current vs. time is the so called gating charge, Coulomb/cm2 at all temperatures (see Fig. 6 and Supplemental Material SM Fig. 16). By comparison, the total gating charge deduced from Fig. 8 of reference [20] is approximately Coulomb/cm2, although the two distributions with potential differ. Note that in our phenomenological theory the dependence of the gating charge with potential is instantaneous while in direct experimental measurements the gating charge is obtained by averaging potential segments. While the inception of six currents is simultaneous, the capacitive polarization current (’gating current’) precedes in size the total incoming ionic current. In other words, a sizable ’gating’ charge moves before a detectable ionic current is developed (see also Fig. 12 of reference [20] with data for potassium channel gating current). The capacitive polarization current is triggered by sodium channels lattice continuous (second order) phase change as the potential increases. Its existence is associated with the polarization membrane current and the ionic polarization current that eventually turns incoming and increases the potential across the membrane which, in turn, proceeds to increase the mAvrami incoming sodium current (Tinder current? What ion channel? Not sodium?!) In the present theory the gating current and the the first segment of ionic polarization current taper off at approximately the maximum rate of rise of the action potential at about 60 mV when the fraction of open sodium channels is about 0.2.
- 3.
-
4.
ionic polarization currents straddling the continuous phase transition from M-Lattice to H-Lattice at the peak of the action potential (see Fig. 4). (What ion channel? Possibly sodium!?)
-
5.
First incoming and then outgoing sodium mAvrami current and 1st order phase transition from open to closed sodium H-channels (see Fig. 3).
-
6.
Outgoing potassium current with 1st order phase transition from open to closed potassium N-channels, overlapping with closing of sodium H-channels (see Fig. 3).
-
7.
Slow climb from potassium reversal potential to the resting potential of the action potential mediated by sodium-potassium pump.
In sum, sodium M-Lattice region covers the region from the H-M polarization flip at the inception potential to the M-H polarization flip at the AP peak, while the sodium H-Lattice region covers the region from the M-H polarization flip the AP peak to the H-M polarization flip at the inception potential.
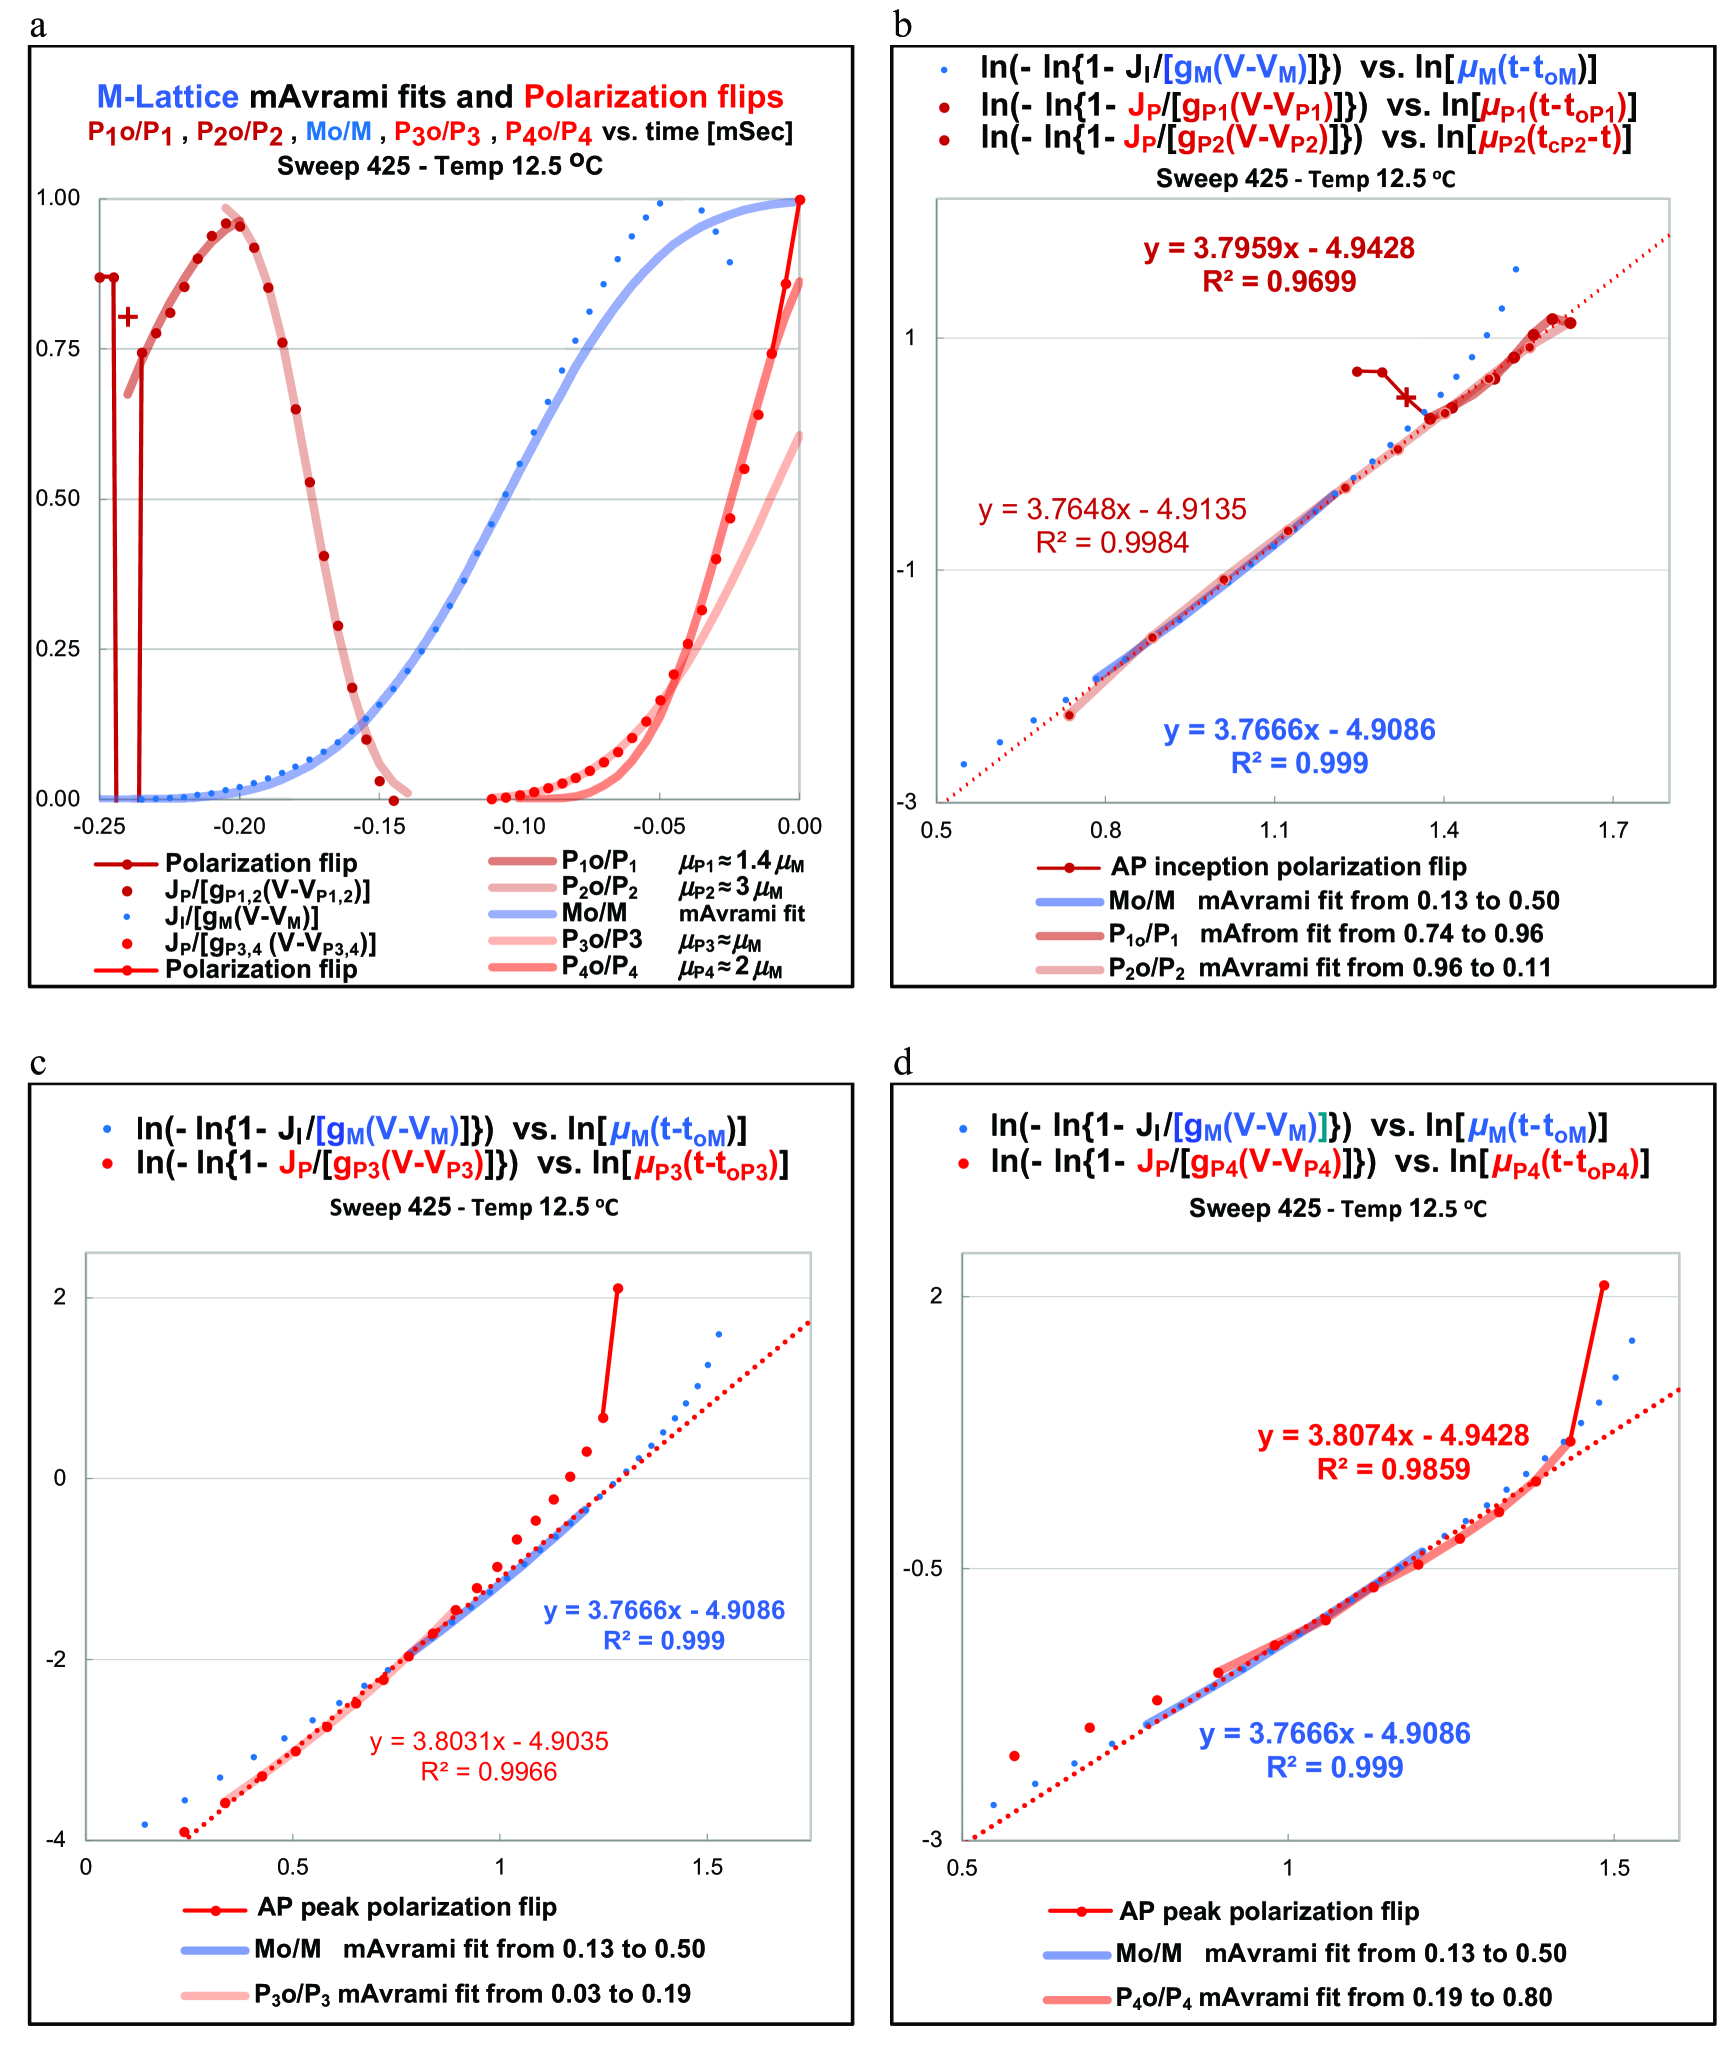
We parse the experimental ionic current from Eq. (1) in the M-Lattice region of the rising edge into sodium mAvrami current and mAvrami polarization currents (see Fig. 2, SM Figures 14 and 15). Similarly, we parse the total ionic current in the recovery H-Lattice region into sodium current , potassium current , polarization current (see Figures 3 and 4), and in the H-lattice region of the rising edge the mainly potassium current . The currents are present in two separate segments: the first one, , starts at the inception of excitation and ends at the maximum derivative of the capacitive current CmdV/dt, and the second segment, , covers the negative resistance region of the rising edge. The current occurs right after the peak of the action potential. The ionic currents , , , and ionic polarization currents are taken to have the familiar structure, displayed by Eq. 2, as the product of maximum conductance , driving force ), and fraction of open channels for ionic currents or fractions of open channels for polarization currents. Our fittings reveal that: a) polarization currents are very small compared to the mAvrami current except in the immediate vicinity of the inception point where the reverse is true; b) the Avrami exponents = 3.78 are equal to ; c) the reversal potential is close to the inception potential, very different from the reversal potential; d) the reversal potential is very close to the sodium reversal potential and to AP peak , but different from the reversal potential; e) both polarization segments include incoming and outgoing currents; f) the conductance is small compared to sodium conductance (but equal for Sweep170); g) the conductance is comparable to if one ignores the narrow polarization flip segment; and h) the time rates , are approximate multiples of sodium time rate .
We modified the Avrami equation Eq.(6) by incorporating into it the temperature dependent ionic time rate and we fitted the fractions of open channels , and with the so modified Avrami (mAvrami Eq.(7) ) equations seeded with the value of the FSC. We also fitted the fractions of open channels in Phase Space as functions of the potential . Fitting of polarization channels fractions with mAvrami equations reveals the polarization flip from H-Lattice to M-Lattice and the polarization flip from M-lattice to H-lattice (see Figures 10, 17, and 18).
Also listed are the capacitive current corresponding to ionic current at the foot of the action potential, sodium and potassium capacitive currents and that are structured as a product of the time rate, the driving force and some function of the fraction of open channels. In particular for the M-channels this function is the fraction of open channels exponentiated to 1/3, 1/3. The exponent 1/3 is an ad hoc parameter that yields the same mAvrami or Phase Space parameters for the fraction in Eq. 2c and Eq. 2d.
The resting potential = 0 is determined by sodium, potassium and chloride permeabilities and their concentrations inside and outside of the axon with potassium contributing most to determine the resting potential. Potassium ’s Nernst potential is slightly on the negative side of the resting potential. Chloride’s reversal potential is around the resting potential. Sodium’s reversal potential is much higher on the positive side. As a result, the total ionic current at the foot of the action potential is a complex superposition of ionic and diffusion potassium, chloride, some sodium and ionic polarization current. The capacitive current slope of the action potential foot is the time rate of the current and the slope of is the conductance . The corresponding fraction of completed process is included in Eq. 2a and Eq. 2b to account for the negative slope segment of current where the excitation inception occurs. We have not attempted the fitting of this factor. In the traditional H-H picture, the negative slope of the total ionic current at the foot of the action potential is reached when the incoming sodium current overtakes the outgoing potassium current. H-H model also requires a leak current, that is presumably chloride current. In our interpretation of experimental data the current includes unresolved parsing of ionic and ionic polarization currents up to the inception potential. The total ionic current is continuous passing through the inception point. The post inception region starts with the three discontinuous polarization currents and the inception of , and currents. The ionic polarization current segment starts as an outgoing decreasing current, equal to the total ionic current at the inception potential, switching to incoming after crossing its reversal potential and thus depolarizing the axon and promoting the incoming sodium current (see Fig. 2, SM Figures 14 and 15). The ionic polarization current extends approximately up to the inflection point of the AP. Through charge conservation, the quasilinear segments of capacitive currents , and are closely related to corresponding quasilinear segment of , and through Eq. (3). No such simple relationship exists between and because and intercept the zero current axis at different potentials (see Fig. 4).
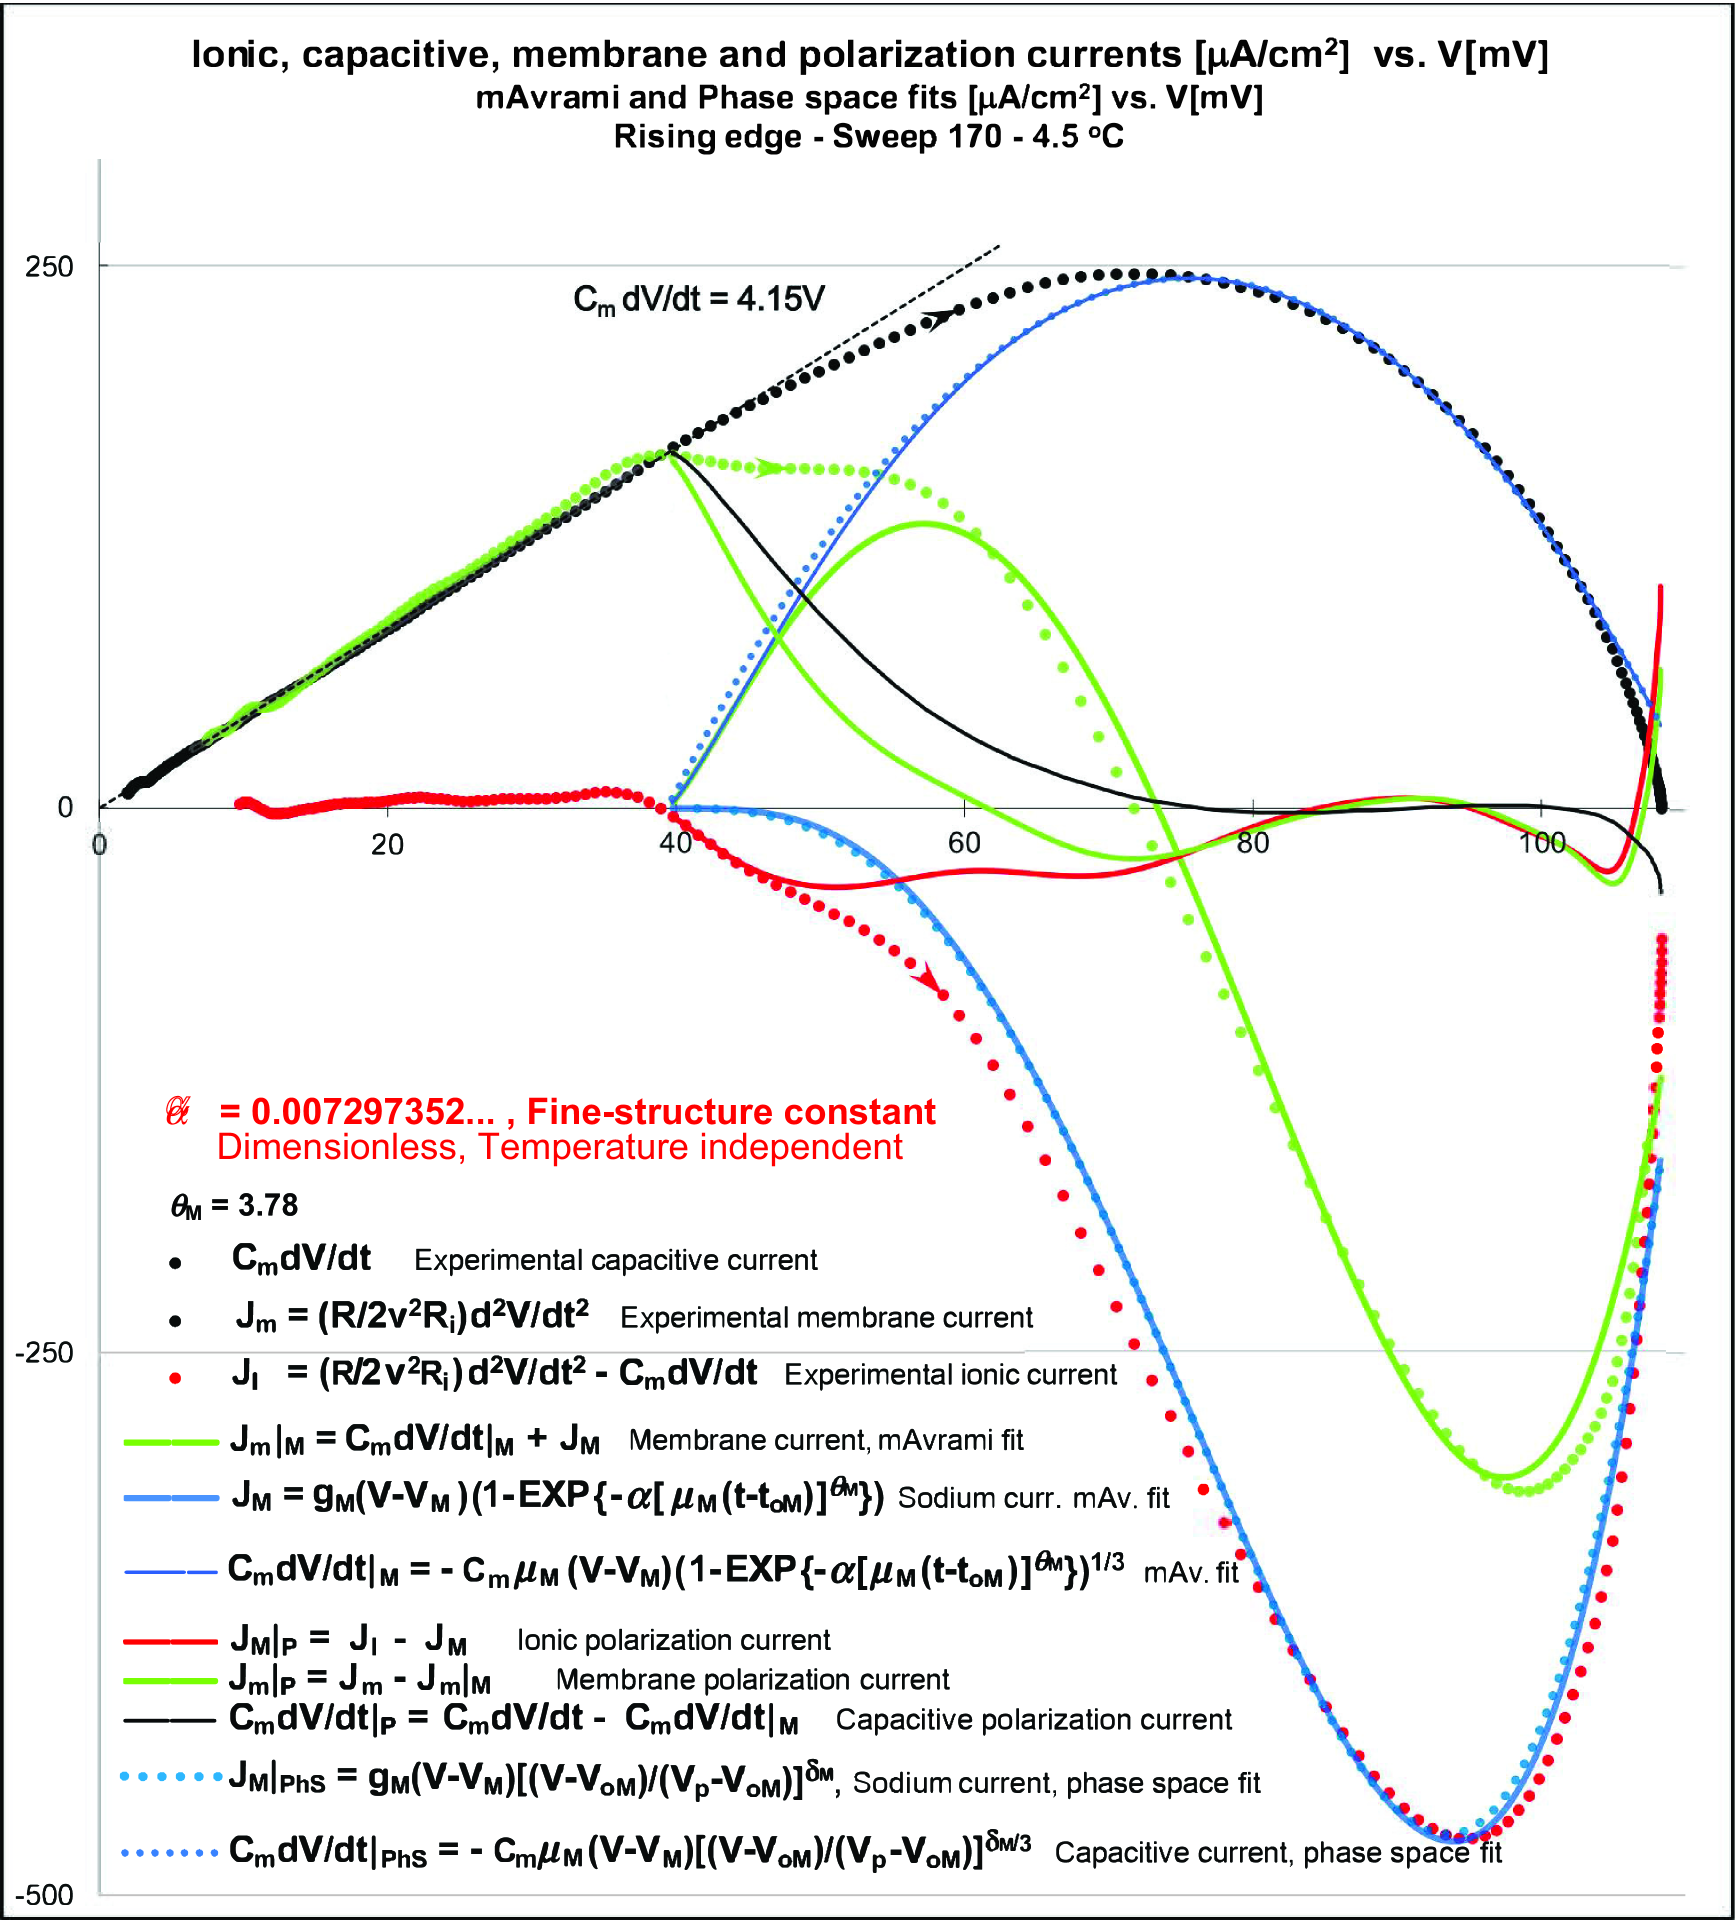
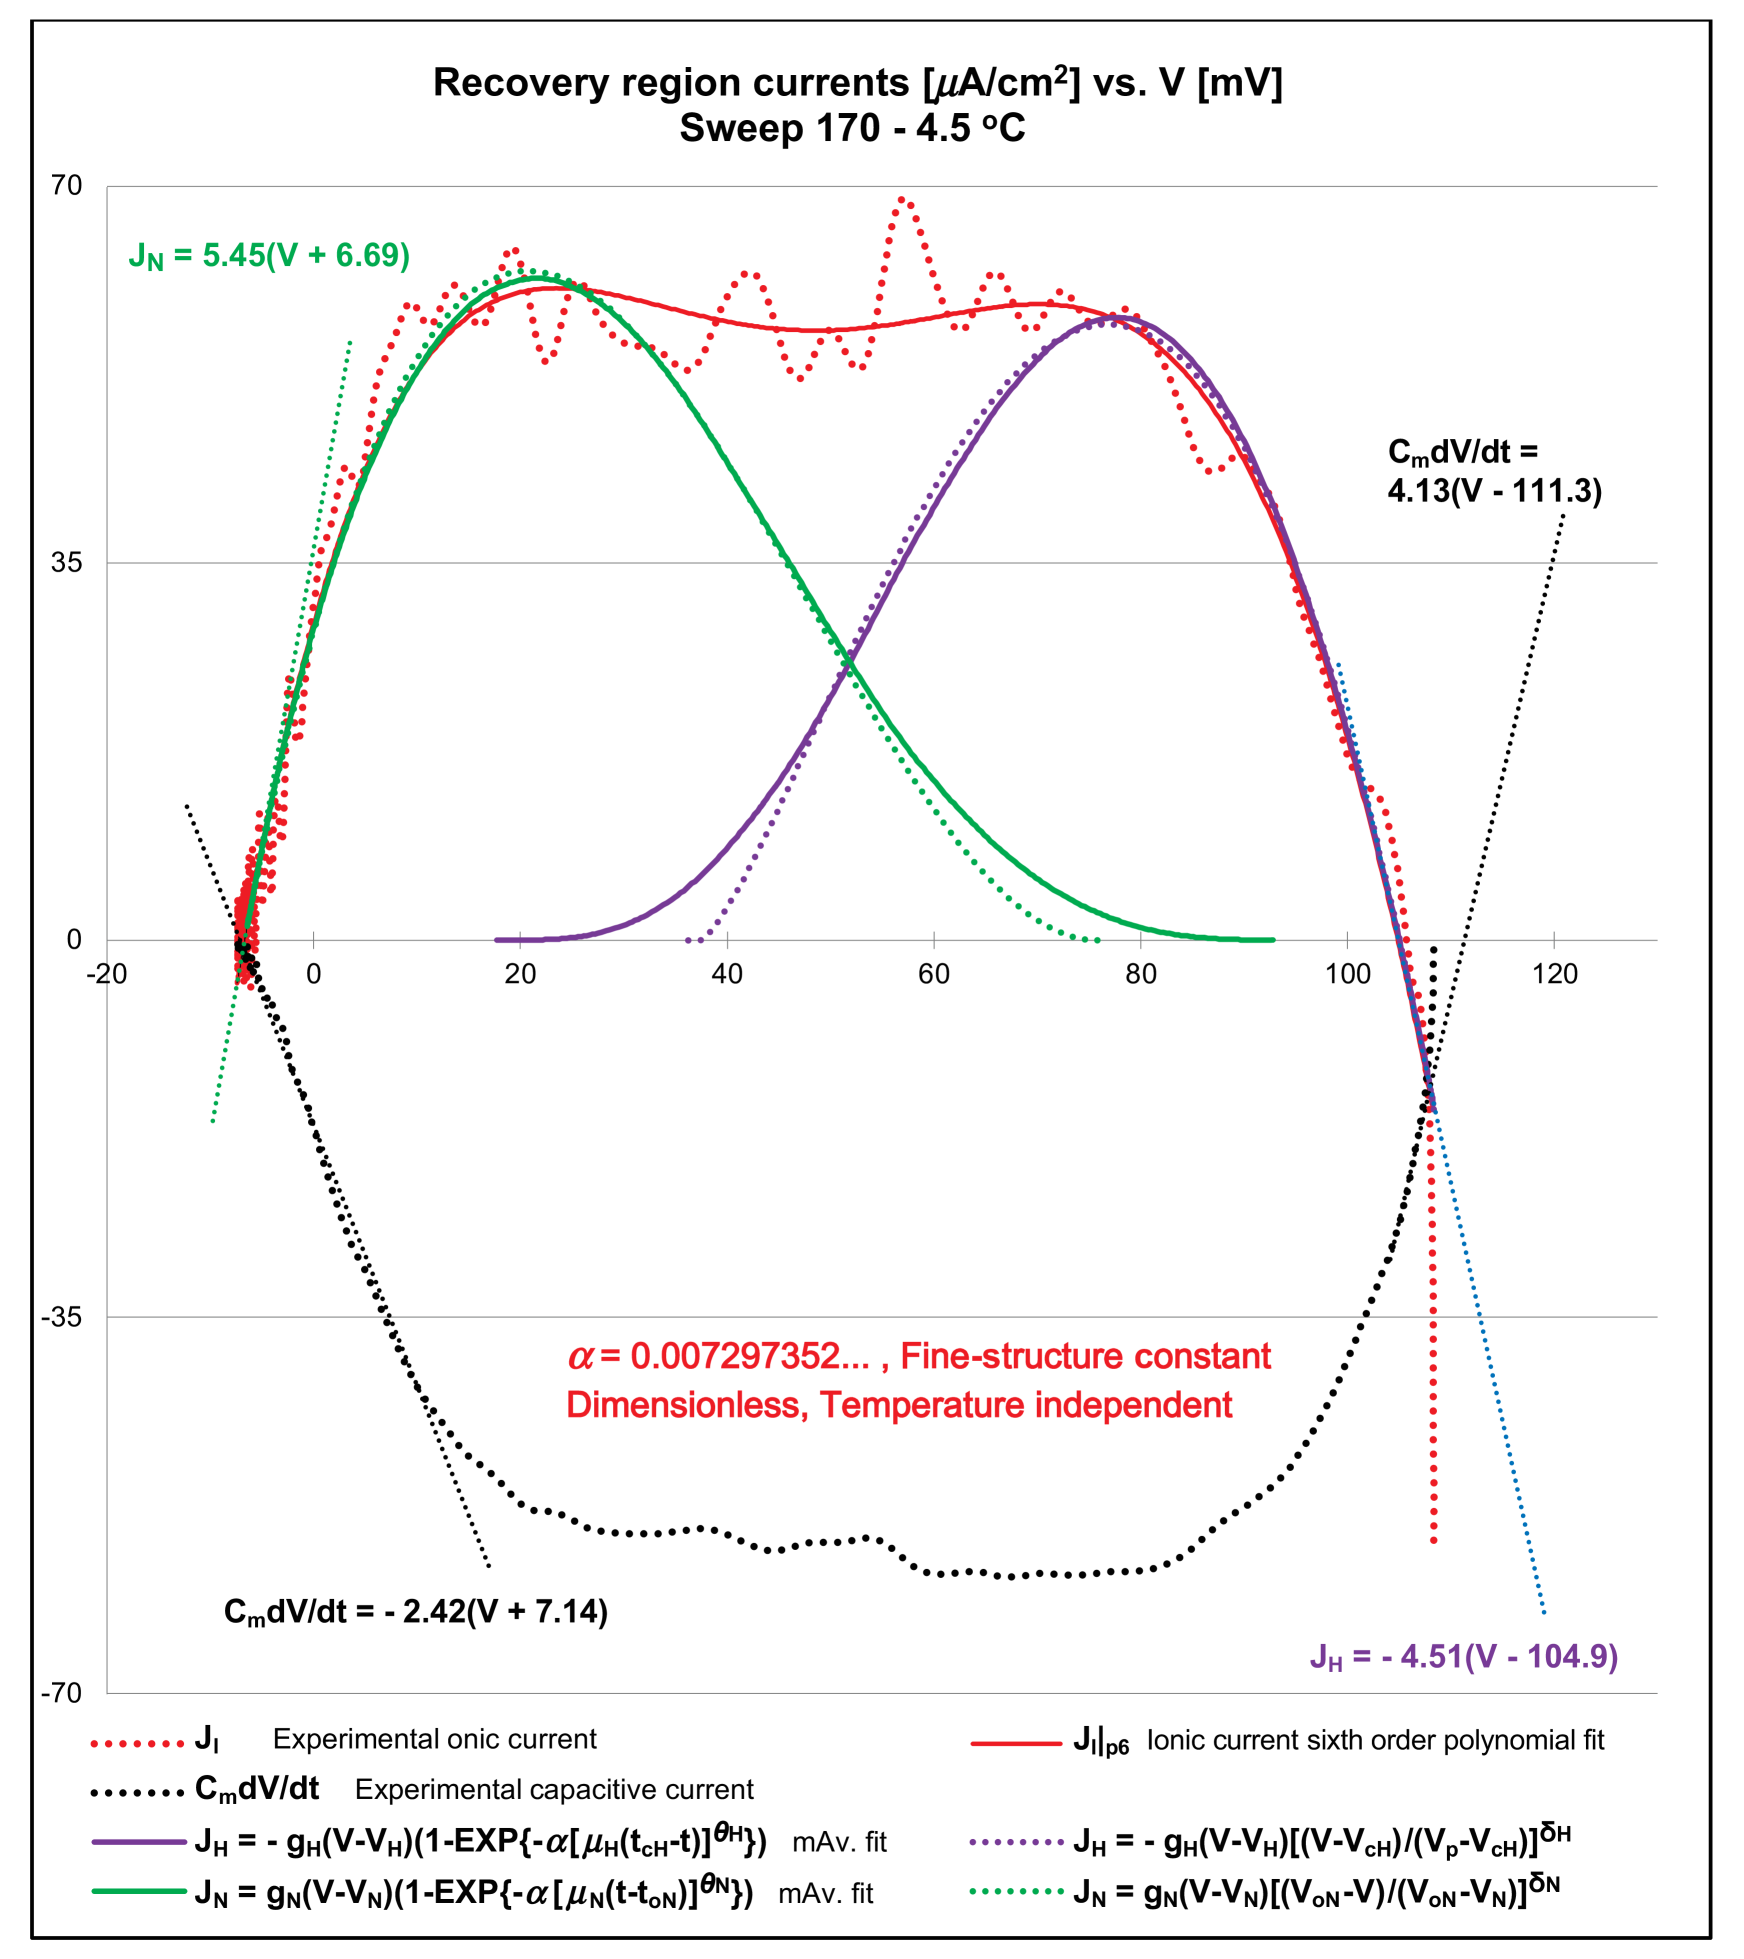
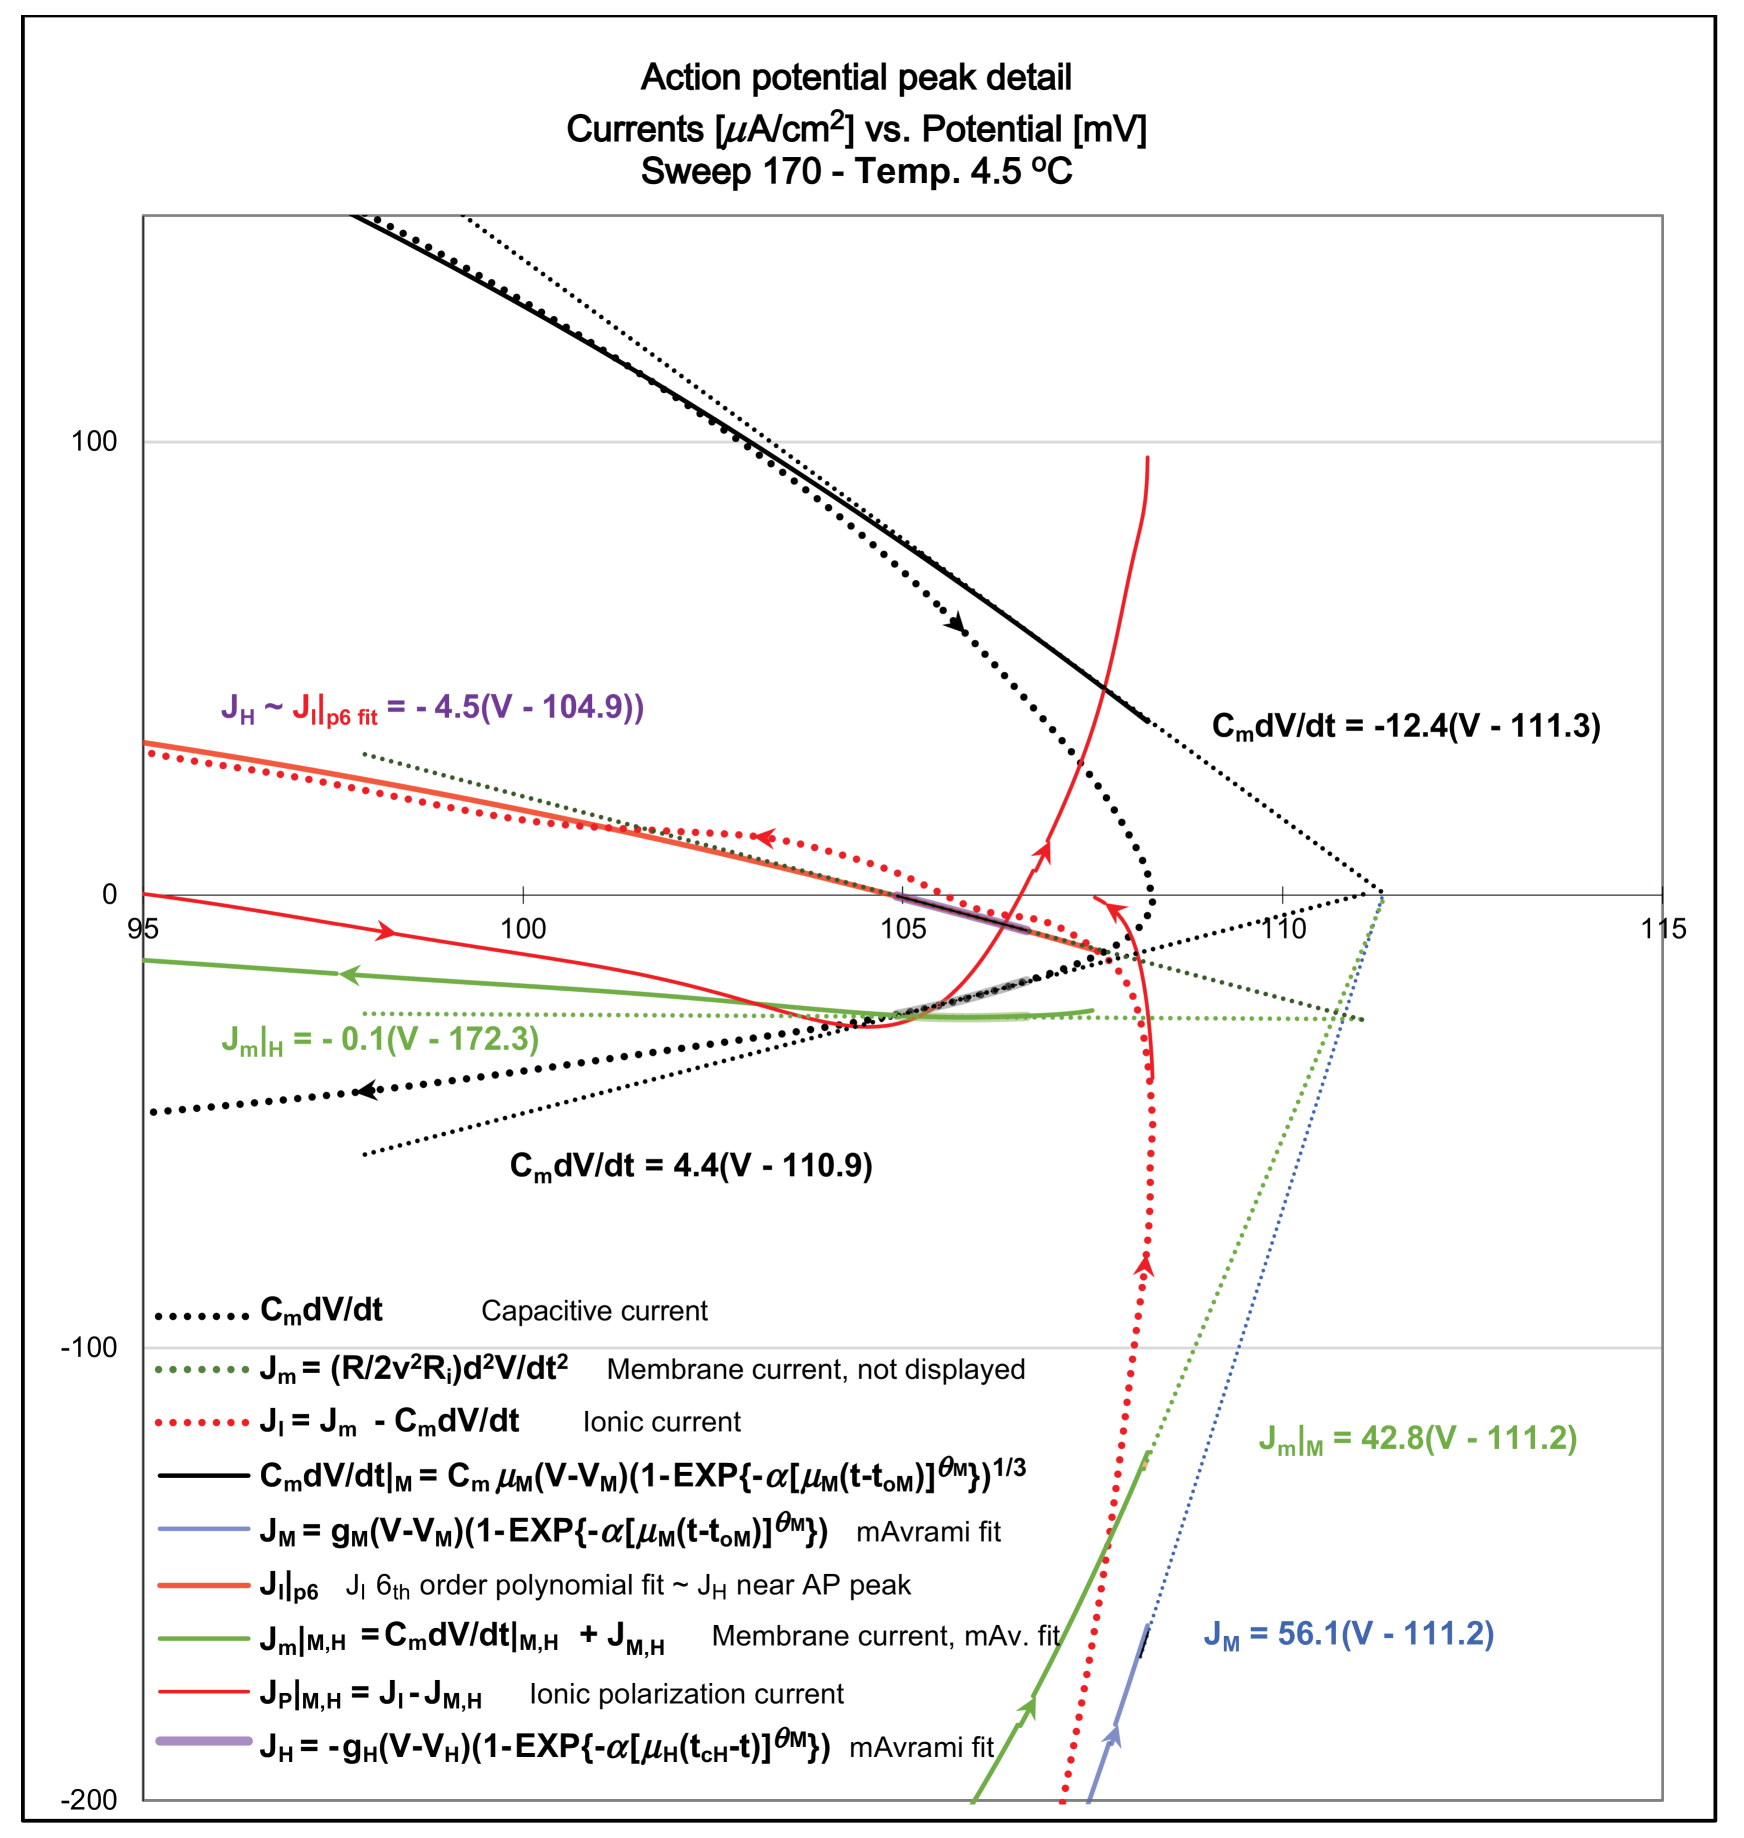
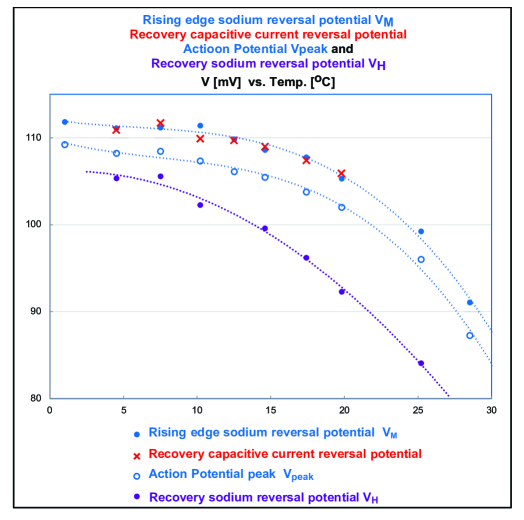
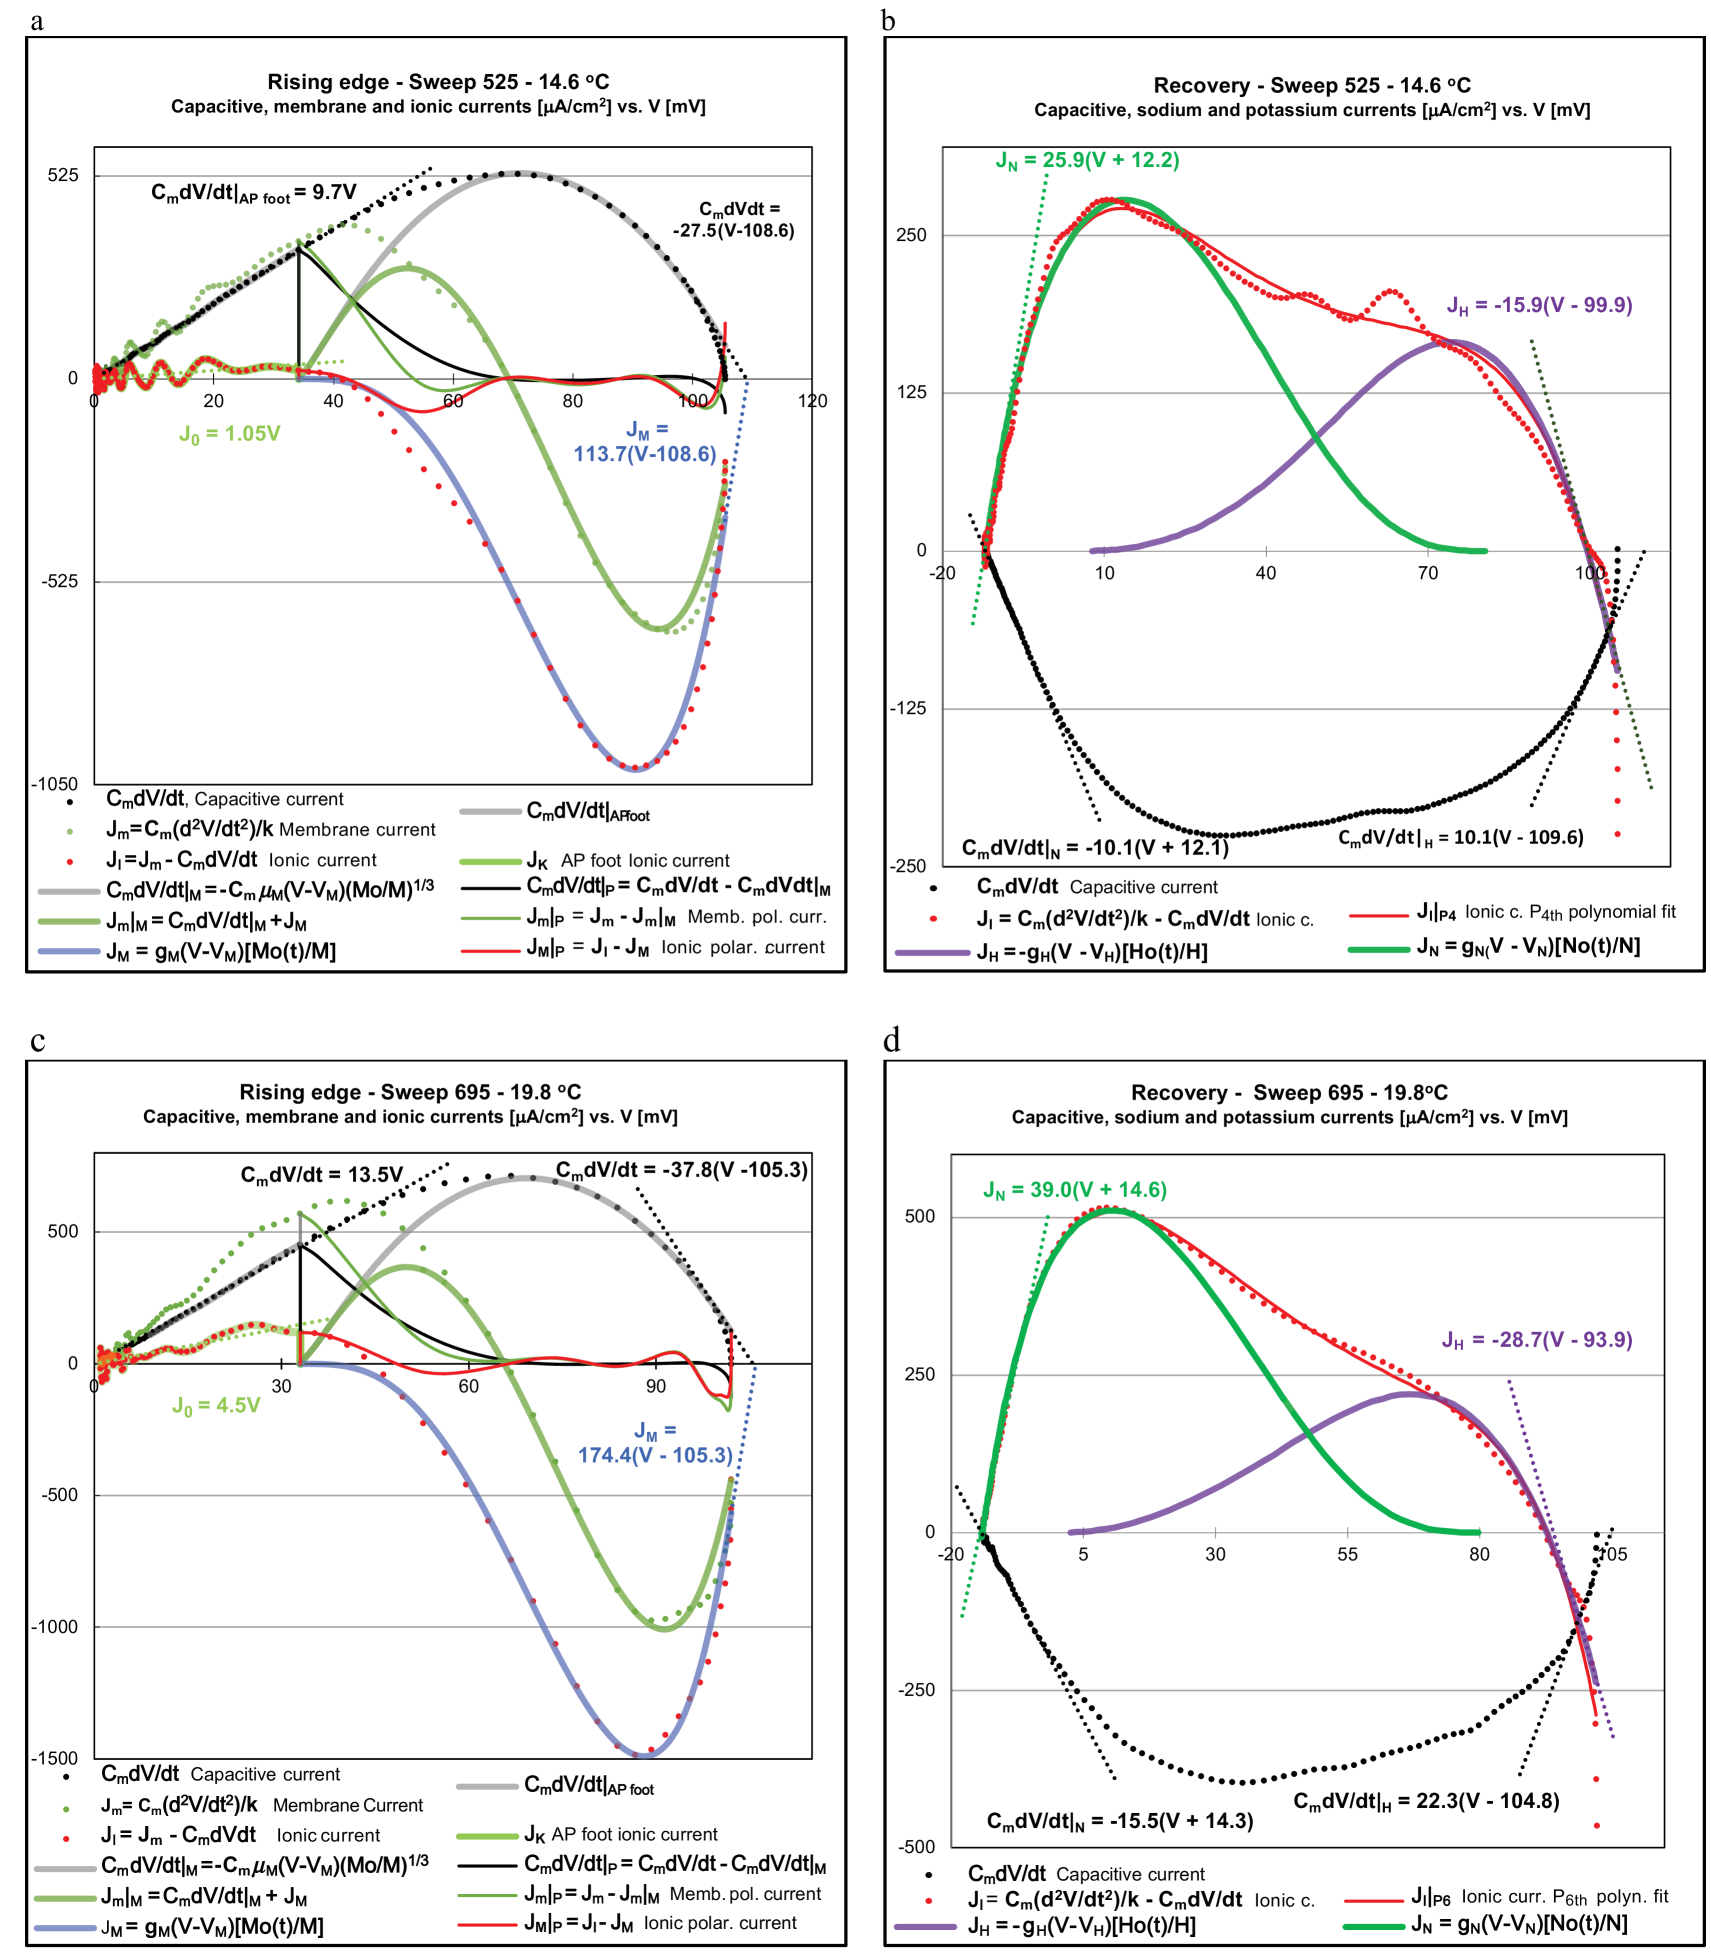
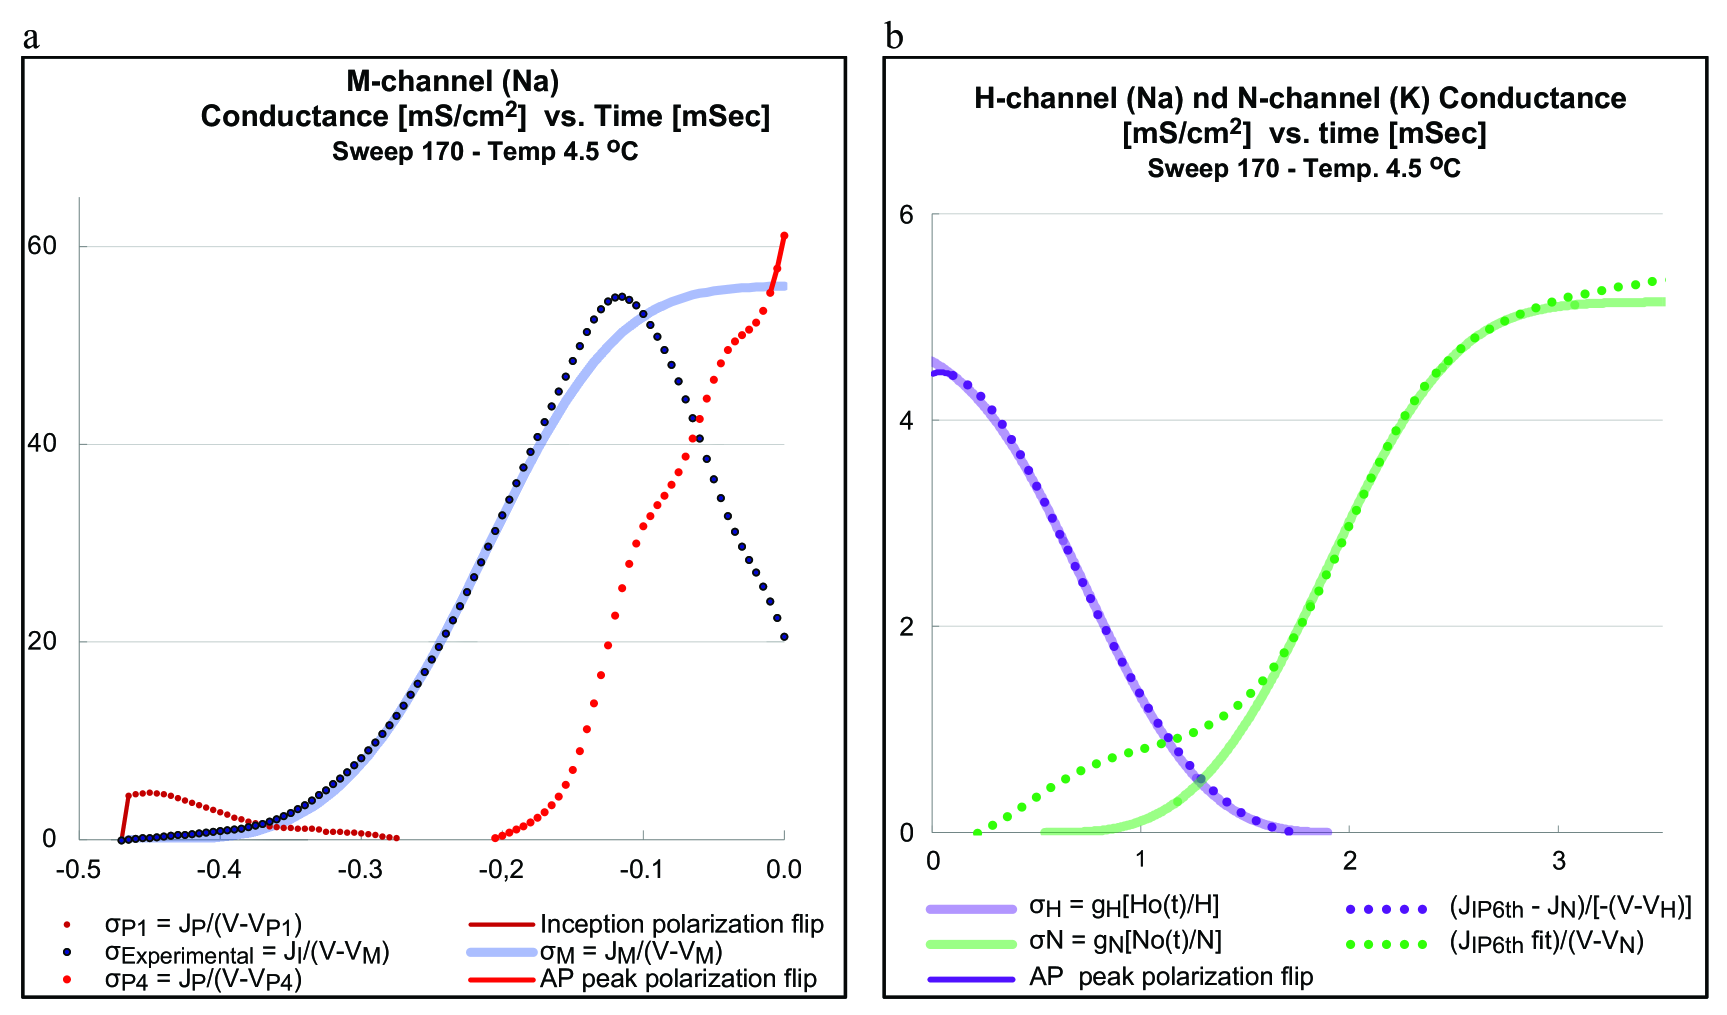
Fig. 2 and Fig. 3 display the capacitive current and the ionic current as functions of the potential at 4.5 oC for the rising edge and the recovery regions of the action potential respectively. In the recovery region, the currents and overlap adding to the total outgoing current. Also displayed are the mAvrami and Phase Space fits for and , respectively incoming sodium M-channel current, incoming and outgoing sodium H-channel current, and outgoing potassium N-channel current. Similarly, SM Figures 14 and 15 display the currents at 12.5 oC, 14.6 oC and 19.8 oC.
The sudden polarization flip from H-Lattice to M-Lattice at the inception of , , currents and the corresponding polarization currents keeps the total ionic, capacitive and membrane currents contimuous. However, the corresponding polarization currents are discontinuous at the inception point. The maximum conductance for each current , and is a function of its time rate and the propagation constant as given by Eq. (3). Several segments of the Eq. 2e for , the rising edge ionic polarization current, are displayed in Figures 2, 4, 6, and SM Figures 14, 15, 16. The first term starts and the fourth term finishes with a polarization current discontinuity (polarization flip).
| (2a) | |||
| (2b) | |||
| (2c) | |||
| (2d) | |||
| (2e) | |||
| (2f) | |||
| (2g) | |||
| (2h) | |||
Eq. 2e accounts for at least two consecutive, and , polarization current segments associated with the inception polarization flip and for at most two, and , associated with the AP peak flip (see Fig. 10 for a typical sweep).
The post inception ionic polarization current covers the region from the inception to the inflection of the AP. It starts outgoing and decreasing as it crosses the inception potential and then turns incoming furthering the depolarization of the membrane and thus furthering the opening of sodium M-channels. We make the case that the inception ionic polarization current is not a sodium current. The post inception ionic polarization current has a small maximum conductance = . The reversal potential = decreases from about 40 mV to about 30 mV as temperature increase and it is much closer to the resting potential than to sodium reversal potentials . The inception ionic polarization current is not a sodium current.
The pre AP peak ionic polarization current covers the negative resistance region of the AP and has a reversal potential close and below the AP peak polarization flip. Its conductance, excluding the polarization flip region, is of the same order of sodium M-channels maximum conductance. Also, the polarization time rate = 20.6e0.065T has the same exponential temperature dependance as the sodium M-channel time rate = 10.4e0.063T indicating the same thermodynamic origin. And, the polarization Avrami exponent is equal to . The channel activation energy = 0.46 eV is slightly larger than the M channel activation energy = 0.44. The main difference between sodium M-channels and the AP peak polarization channels is that M-channels start opening at the inception potential while the AP peak polarization channels start opening at the beginning of the negative resistance region at a potential close to , the peak of the AP. We conclude that the AP peak ionic polarization current is a sodium current.
Note that Eq. 2e is only approximately valid because the first and the last segments of include the polarization flips at the inception point and at the peak of the action potential respectively (see Fig. 10 and SM Fig. 17). Similarly for Eq. 2f which includes the polarization flip at the peak of the action potential.
Immediately after the peak of the action potential, the total ionic current is parsed into and that is smaller and covers smaller region than its counterparts and (see Fig. 3 and Fig. 4). Only the incoming part of the polarization current covering a region of less than one mV, mainly the polarization flip portion, is displayed.
Fig. 4 displays a detail around the peak of the action potential for Sweep 170 at 4.5 oC. The extension of the linear segment of the recovery capacitive current is displayed showing that it intercepts the zero current axis at the same point as the rising edge linear segments of and . However, the linear segment of the current intercepts the zero current axis at that is significantly lower than the reversal potential , and its extension intercepts the slope of the recovery linear segment of the membrane current at the potential but below the zero current axis. Fig. 5 displays the same behavior at all temperatures. These facts support the conclusion that is in fact sodium current with its reversal potential modified from to by properties of the sodium channels H-Lattice.
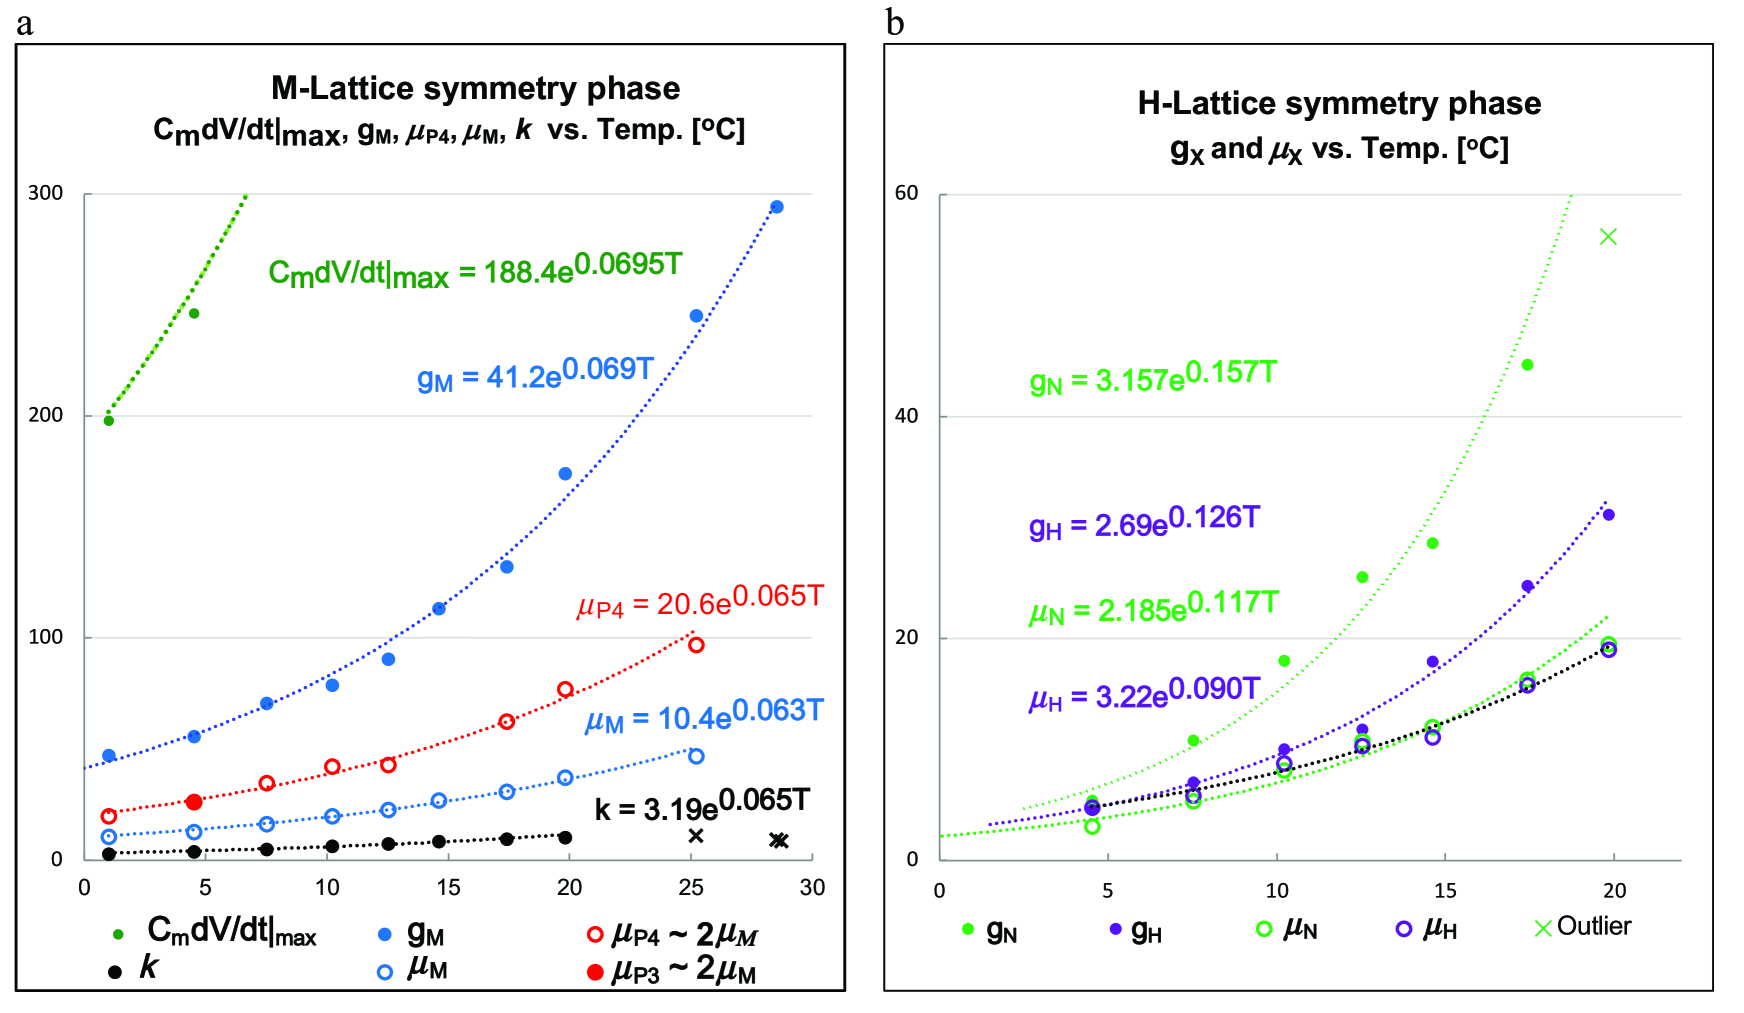
Linear segments of and and , apparent at once in Figures 2, 3, 4, and SM Figures 14, 15, correspond to fractions of open channels equal to one; i.e. all channels open. The slopes of the capacitive linear segments correspond to time rate parameters , , , , and the slopes of the ionic current linear segments correspond to maximum conductance , , and . Maximum conductance and time rates vs. Temperature are plotted in Fig. 7.
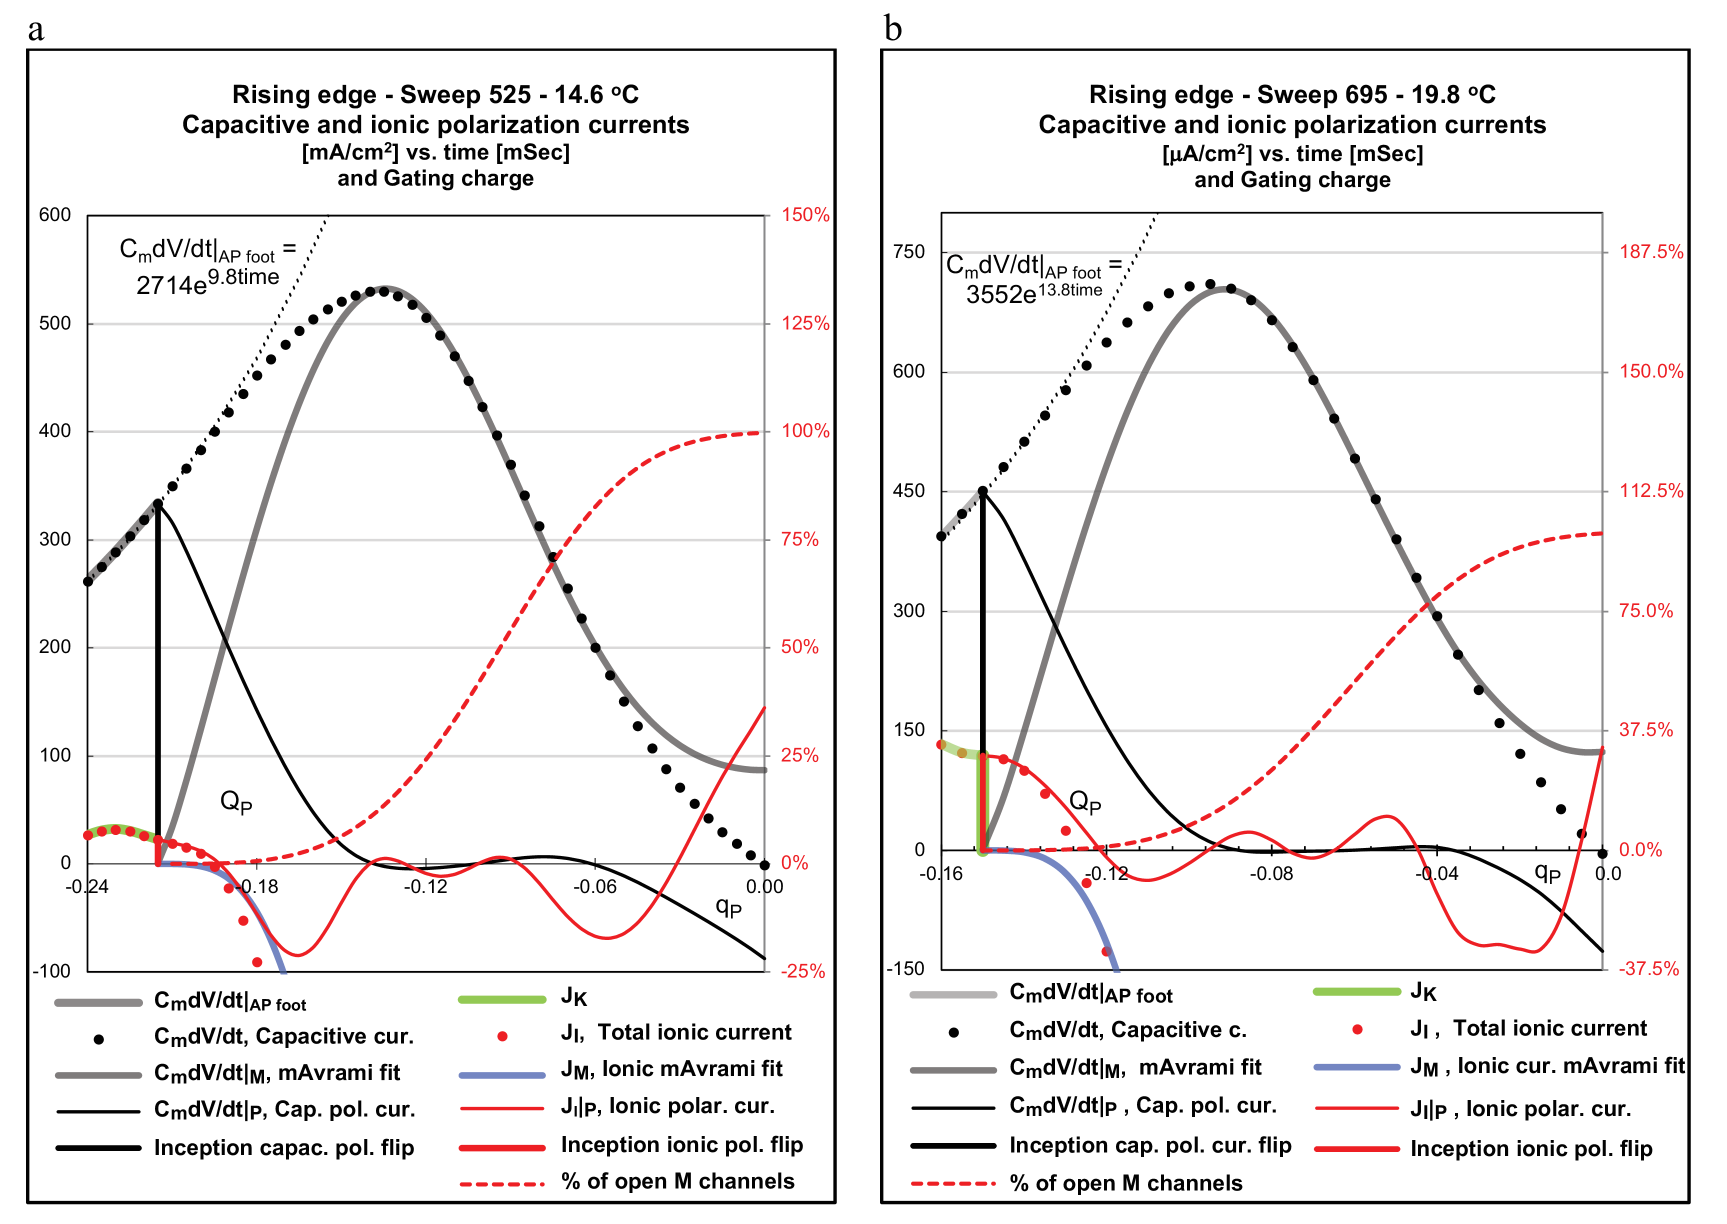
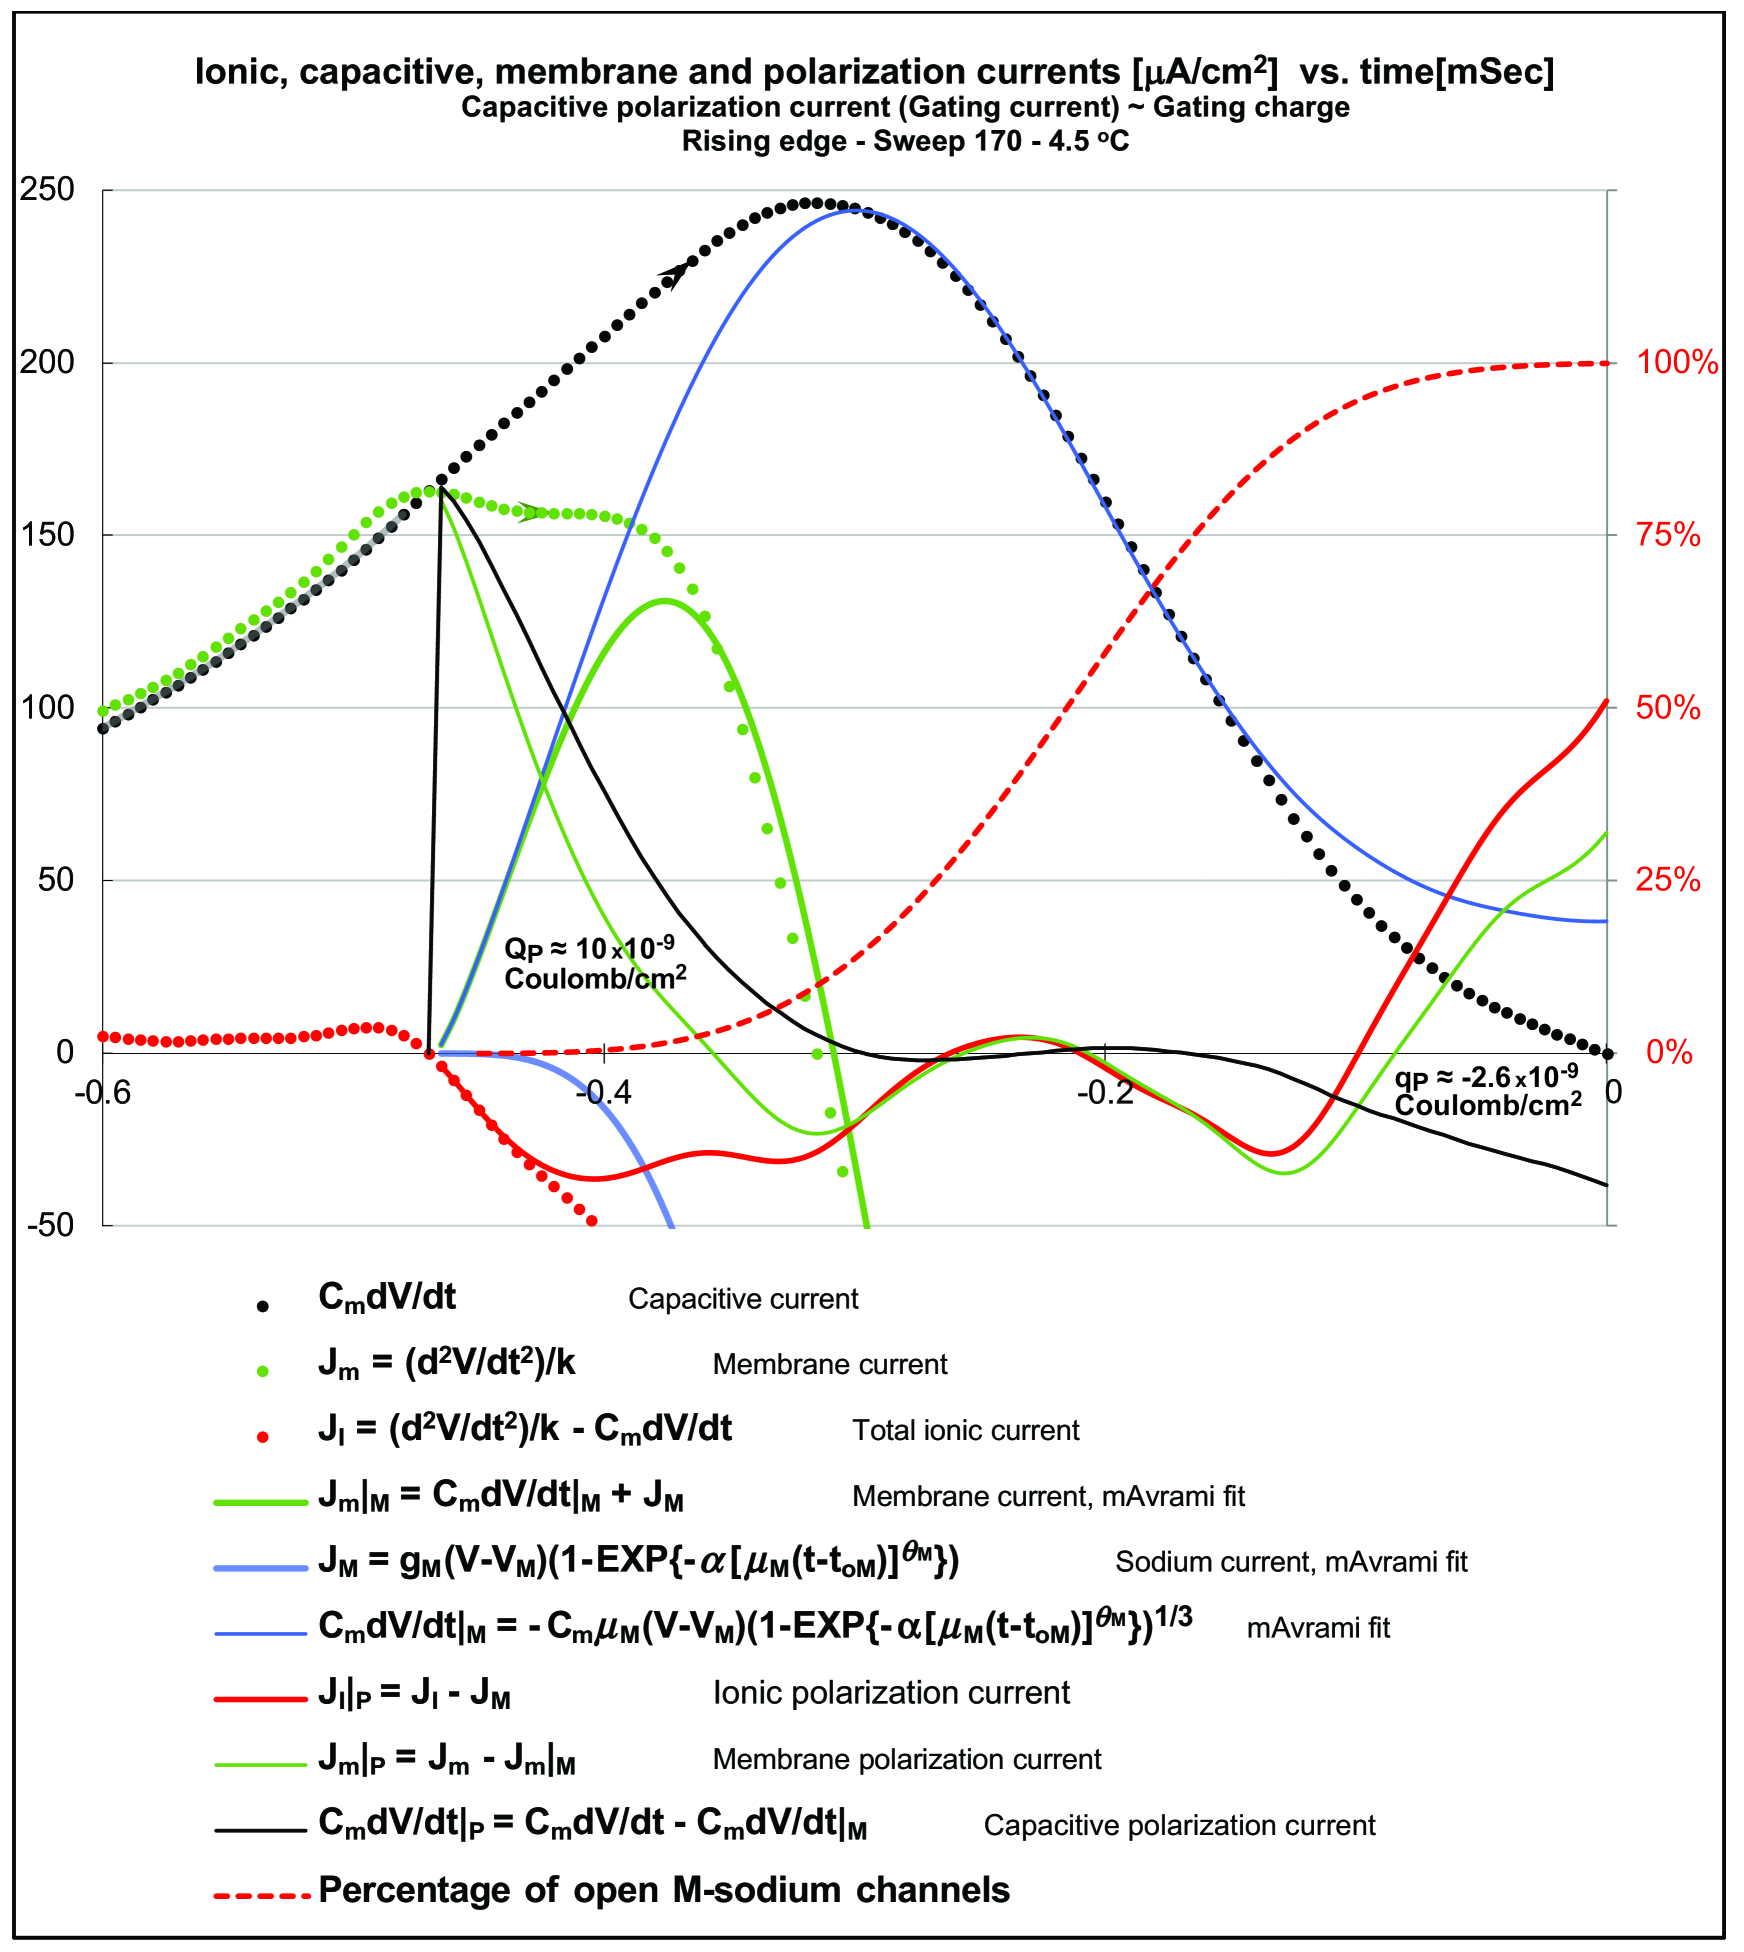
Fig. 6 displays the rising edge currents and the percentage of open sodium M-channels plotted against time for Sweep170. The three mAvrami fitted currents , , , and the curve begin and intersect the zero-current axis at the inception point , the start time of the first order phase change, i.e. the start of sodium M-channels opening. Capacitive and membrane polarization currents, and start with large abrupt jumps at and then decay mostly canceling each other as prescribed by Eq.(1), while the corresponding ionic polarization current starts outgoing and promtly turns incoming (see also SM Fig. 16 for Sweep525 and Sweep695.) The surface under the first segment of capacitive polarization curve is equal to the polarization charge Coulomb/cm2 moved across the membrane (a.k.a. gating charge). The flip from H-Lattice to M-Lattice symmetry and the transfer of charges across but within the membrane in conjunction with the ionic polarization current precedes the start of sodium M-channel current . In the present theory the motion of gating charges tapers off at approximately the maximum rate of rise of the action potential at about 60 mV when the percentage of open sodium channels is about . The value of the charge remains approximately the same at all temperatures. By comparison, the total gating charge deduced from [20] Fig. 8 of frequency domain analysis of gating currents is Coulomb/cm2 although the distributions and the two potential ranges differ. Note that, while the inception of six currents is simultaneous, the capacitive polarization current (’gating current’) initially dwarfs the total incoming ionic current. In other words, a sizable ’gating’ charge moves before a detectable sodium current is developed (see also Fig. 12 of [20] with data for potassium channel gating current). Towards the peak of the action potential, preceding the flip from M-Lattice to H-lattice at the peak, there is an opposite charge transfer across and also within the membrane amounting to Coulomb/cm2.
Linear segments of ionic currents , and intersect the zero current axis at the same point as the corresponding linear segments of capacitive and membrane currents. The cable Eq. (1) yields for these linear segments the relationships between maximum conductance and corresponding time rate. See also [21]:
| (3a) | |||
| (3b) | |||
| (3c) | |||
| where is the so called propagation constant | |||
| (3d) | |||
Fig. 7(a) and Fig. 8(a) show that up to 20 oC sodium channels time rate , propagation constant rate and polarization channels rate have essentially the same exponential temperature dependance, indicating a common underlying thermodynamic cause. (Polarization channels time rates are displayed in Fig. 10(a), SM Fig. 17(a) and SM Fig. 18(a)). The maximum conductance also has the same dependence, as it should according to Eq. (3b). This fact allows to estimate the optimum density of channels in the axon (see Appendix: Optimum channel density).
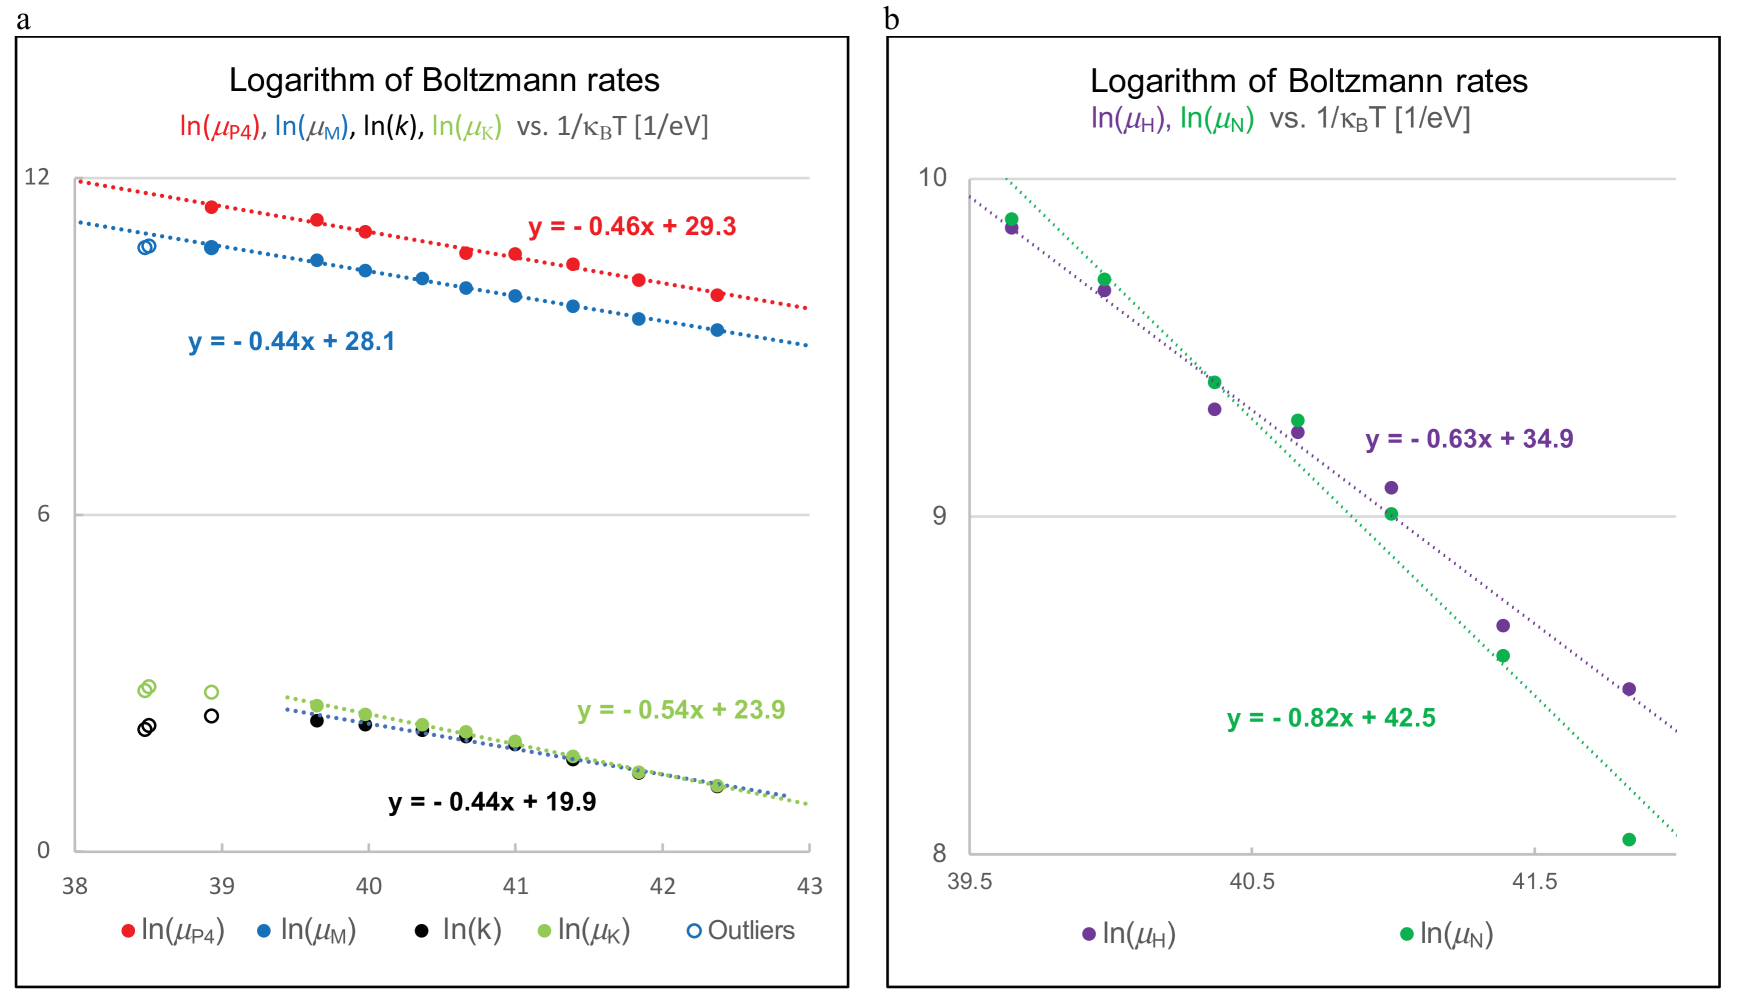
Time rates can be expressed as Boltzmann kinetic rates as given by the Arrhenius equation. See for example [22]:
| (4a) | |||
| (4b) |
where is the temperature in Kelvin degrees, is the Boltzmann constant. and are respectively the so called activation energy and the Boltzmann time rate. See Fig. 8 for graphs of Eqs. (5) for the ions traversing sodium and potassium channels and for the propagation constant . All fits are linear for up to about C.
| (5a) |
| (5b) |
| (5c) |
| (5d) |
| (5e) |
| (5f) |
The values of activation energies from Eqs. (5) and Fig. 8 are consistent with the average activation energy of 0.65 eV from research predicting a joint universal mass and temperature scaling law for rate-limiting biochemical metabolic reactions[23]: Mass-1/4 . We conclude that the passage of ions through axon’s membrane is mediated by rate-limiting biochemical reactions.
We have fitted the fraction of open channels with two different versions of , the first one directly in the laboratory frame with Avrami equation [6, 7, 8]. In particular, the Avrami equation for the fraction of open M-channels is:
| (6) |
where is the inception time, the time when sodium channels start opening, and and are Avrami parameters. The Avrami equation is best known for describing isothermal phase changing in solids and crystallization processes. The particular value of the exponent is said to have contributions from three dimensions of growth and one representing a constant nucleation rate. Avrami parameter is typically very temperature dependent. In particular, for sodium’s fraction of open channels it varies exponentially from about 40 at C to 50000 at C.
The modified Avrami (mAvrami) Eqs. (7) are more meaningful for the propagated action potential:
| (7a) | |||
| (7b) | |||
| (7c) | |||
| (7d) | |||
| (7e) |
where and are the temperature dependent times when sodium M and potassium N channels start to open, is the time when sodium H channels close, are the times when polarization segments channels open and is the time when the segment channels close. We did not attempt the detailed fitting of Ko/K. The very small ionic current at the foot of action potential is a dynamical equilibrium of potassium, chloride and sodium currents.
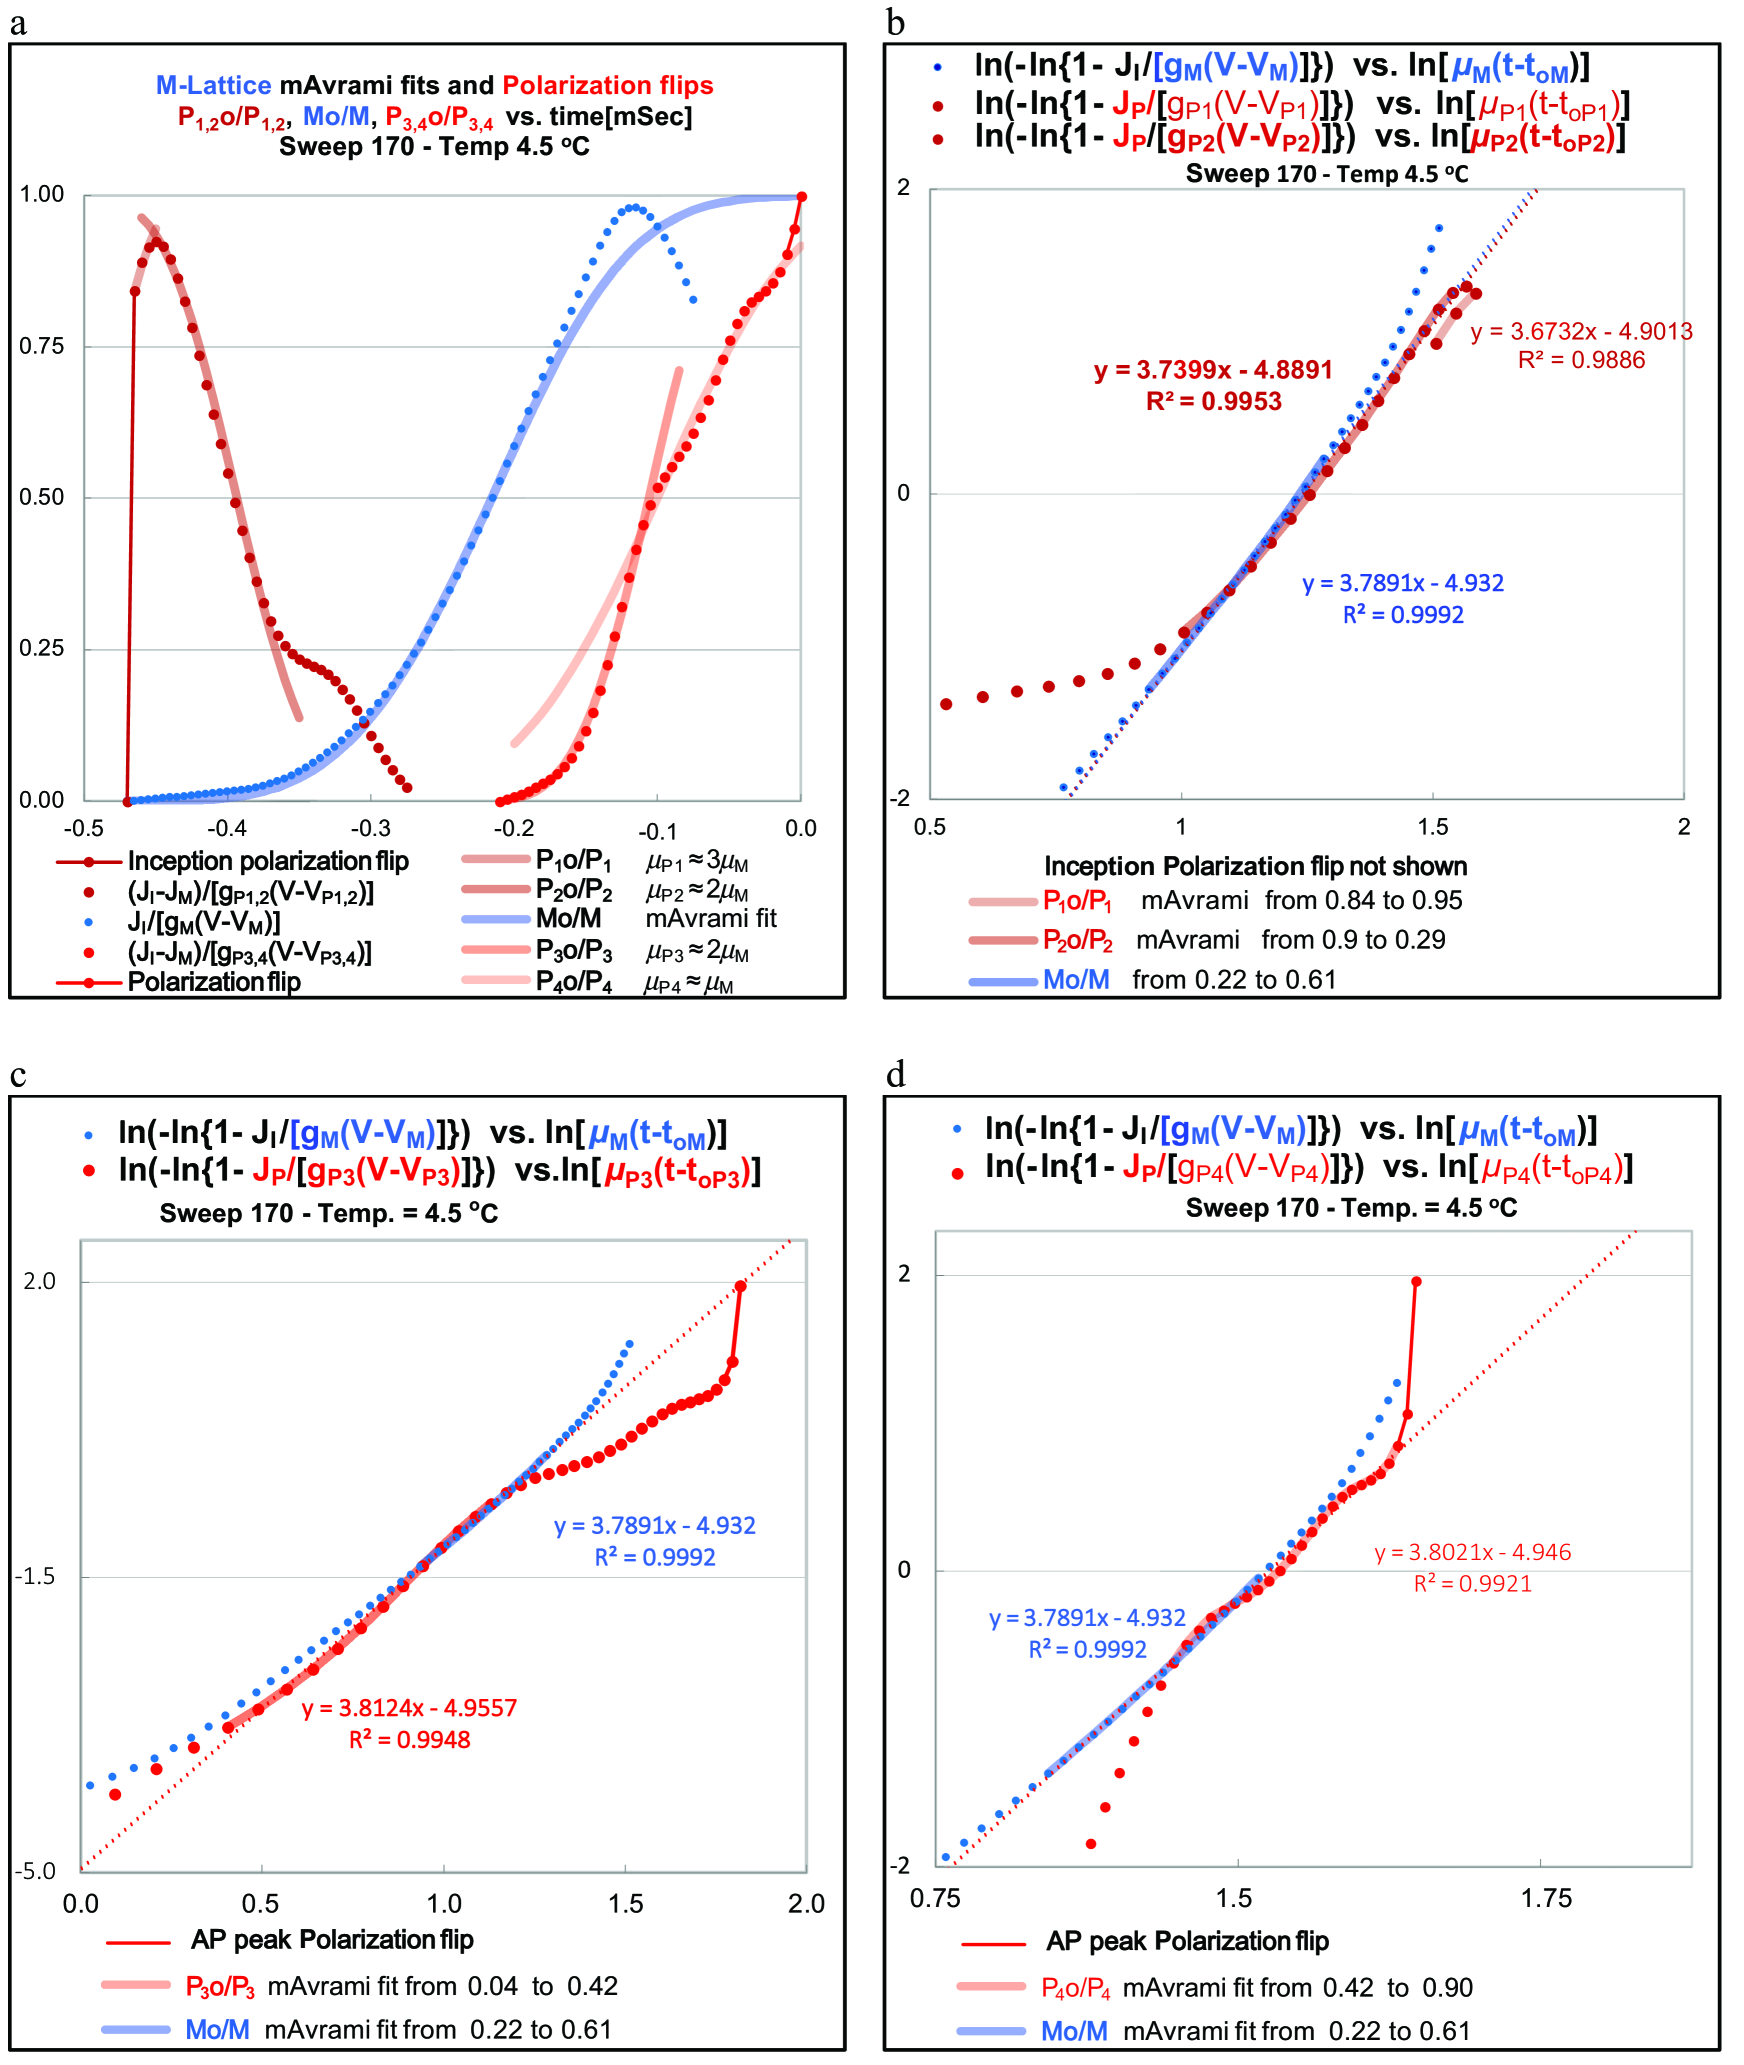
The incorporation of temperature dependent time rate parameters into Avrami equations yields temperature independent dimensionless constants for each ion channel. Allowing all parameters to vary, the average values of mAvrami parameters over a range of temperatures, are close to the value of the fine-structure constant . In what follows, all the mAvrami parameters , , and , are seeded with the value of the FSC . Similarly, we have seeded the values of and with the value 3.78. The average values of Avrami exponents in the recovery region are: = 3.01 and = 3.02 for 7 sweeps from 4.5 oC and 19.8 oC. We did not fit the polarization currents in the recovery region.
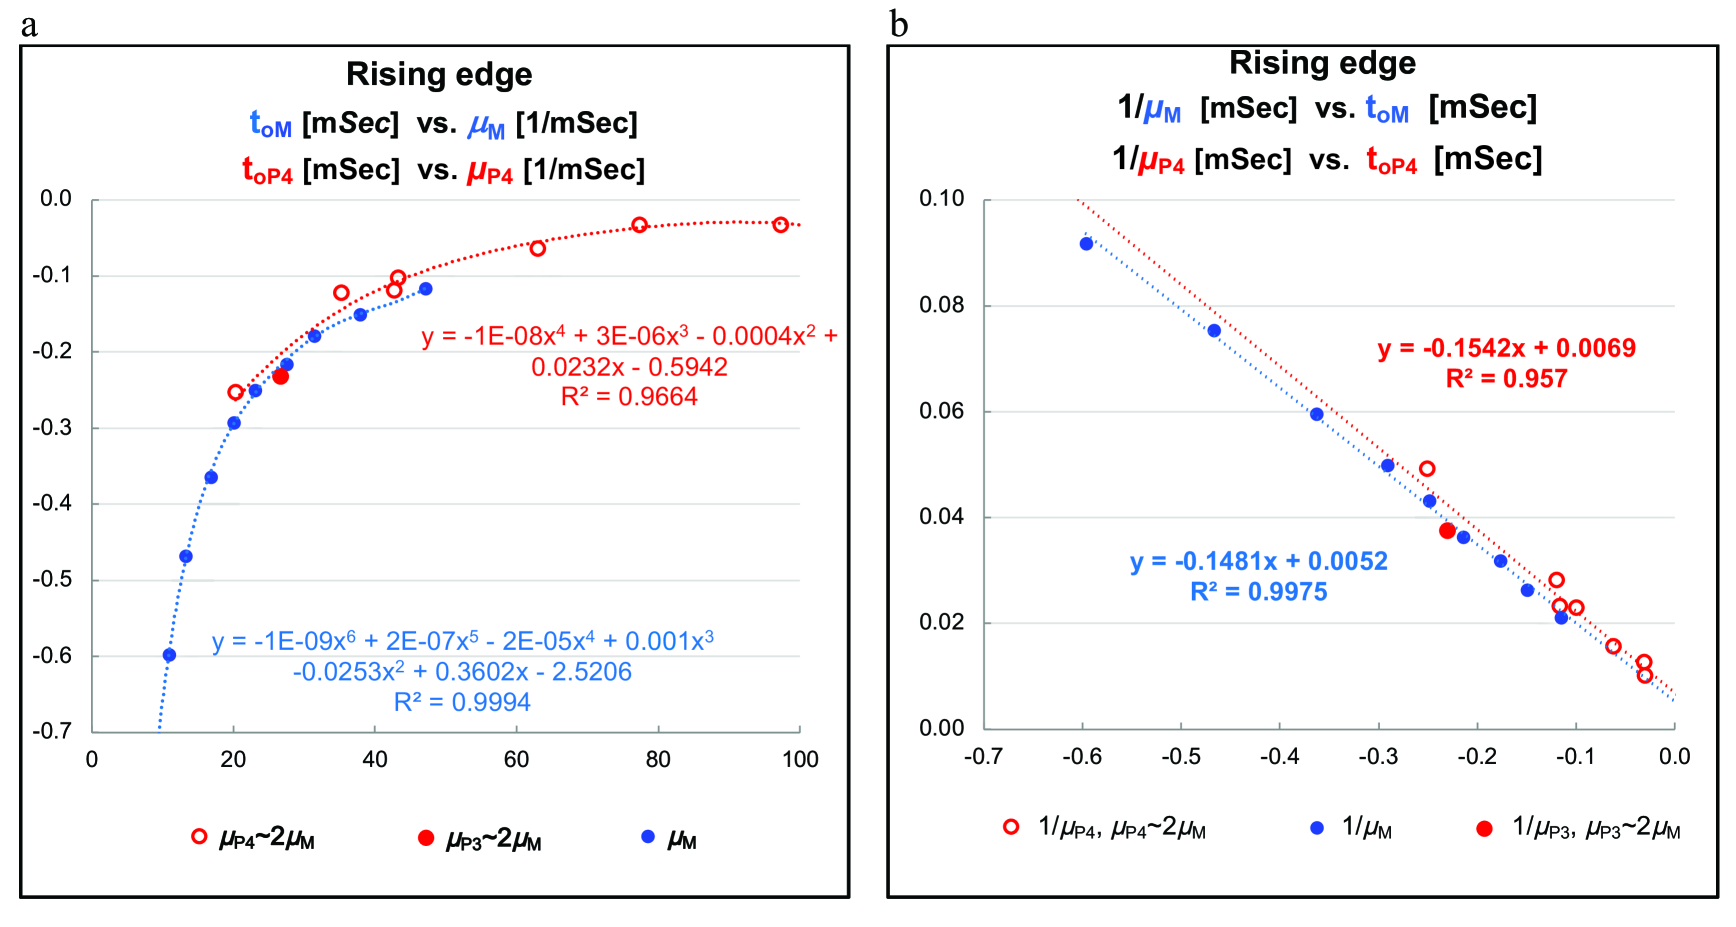
Approximate time rate parameters , and and maximum conductance , and can be read from Fig. 2, Fig. 3 and Fig. 4; or, the maximum conductance can be determined by Eqs. (3a), (3b) and (3c) respectively if the corresponding time rate is known (or vice versa). There is no such relation for sodium H-channel currents. Both, the rate and maximum conductance are to be read separately from Fig. 4. Quasilinear segments in phase space are segments of all corresponding ion channels open and as such are amenable to fittings by the usual expressions for ionic currents Eq. 2d, Eq. 2g, and Eq. 2h where the fractions of open channels are fitted by corresponding mAvrami equations which describe a completion process by the S curve in time. Fittings, by mAvrami equations Eq.(7a), Eq.(7b) and Eq.(7c) are very sensitive to values of time parameters , , and the corresponding time rates , and less so to values of and . Similarly, the fraction of completed polarization process, as approximated by the mAvrami Eq.(7d) is also fitted by seeding the values of with the value of the fine-fine-structurestructure constant. In what follows, for lack of known constraints, are independent parameters in our fitting. In fact, the fitting reveals that polarization time rates , with some exceptions, are close multiples of sodium’s M-channel time rate . Incidentally, there is a linear relationship between 1/, 1/ and , respectively, see SM Fig. 19. Knowing the time rate (or conductance ), the relationship predicts the total time to open all M-channels or vice versa. There is experimental evidence [24] for the existence of a first-order phase transition (involving volume and temperature changes) in nerve cells, fibers and synapses. While the role of quantum effects in first order transitions is not ruled out, there are no known examples [25]. The modified Avrami (mAvrami) Eqs. (7) for open-close ion channels are possibly the first example of first order phase transition involving quantum effects. The current is about three times larger at 19.8 oC than at 4.5 oC since is about three times larger at 19.8 oC than at 4.5 oC and the factor is moderately temperature dependent. And, M channels open completely in a time interval about three times shorter at 19.8 oC than at 4.5 oC. Therefore, the total number of incoming sodium ions, at 4.5 oC and up to 19.8 oC, is about the same at all temperatures.
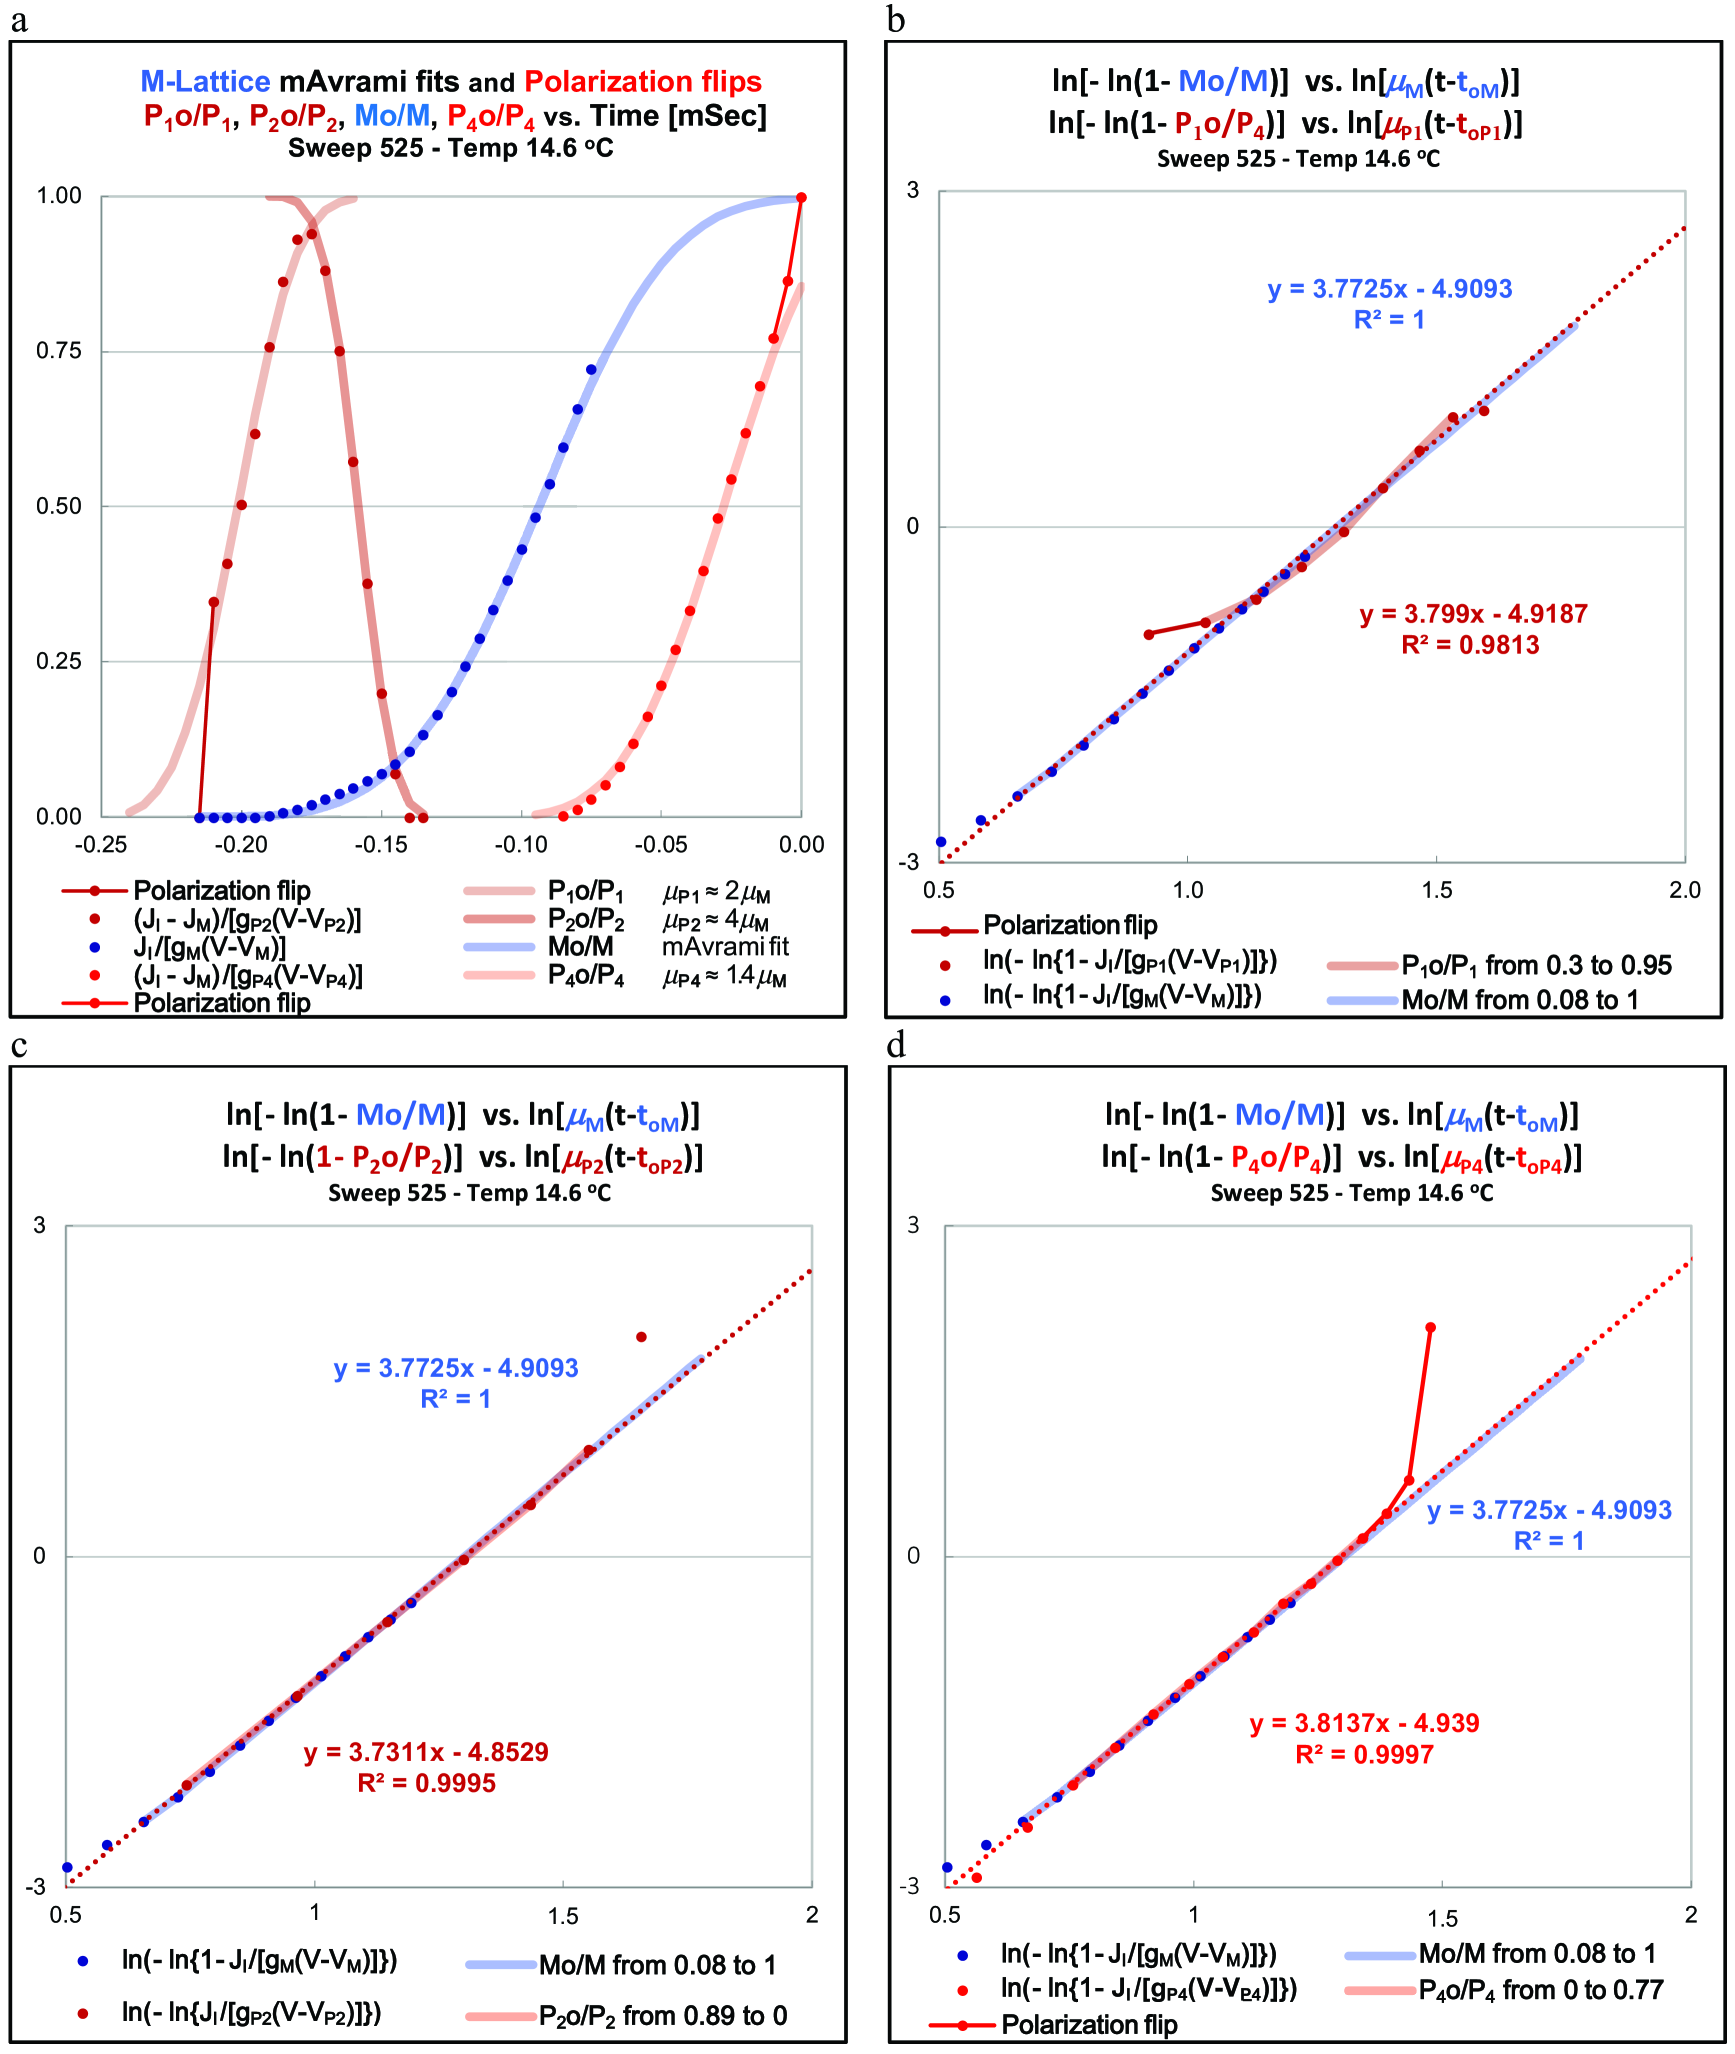
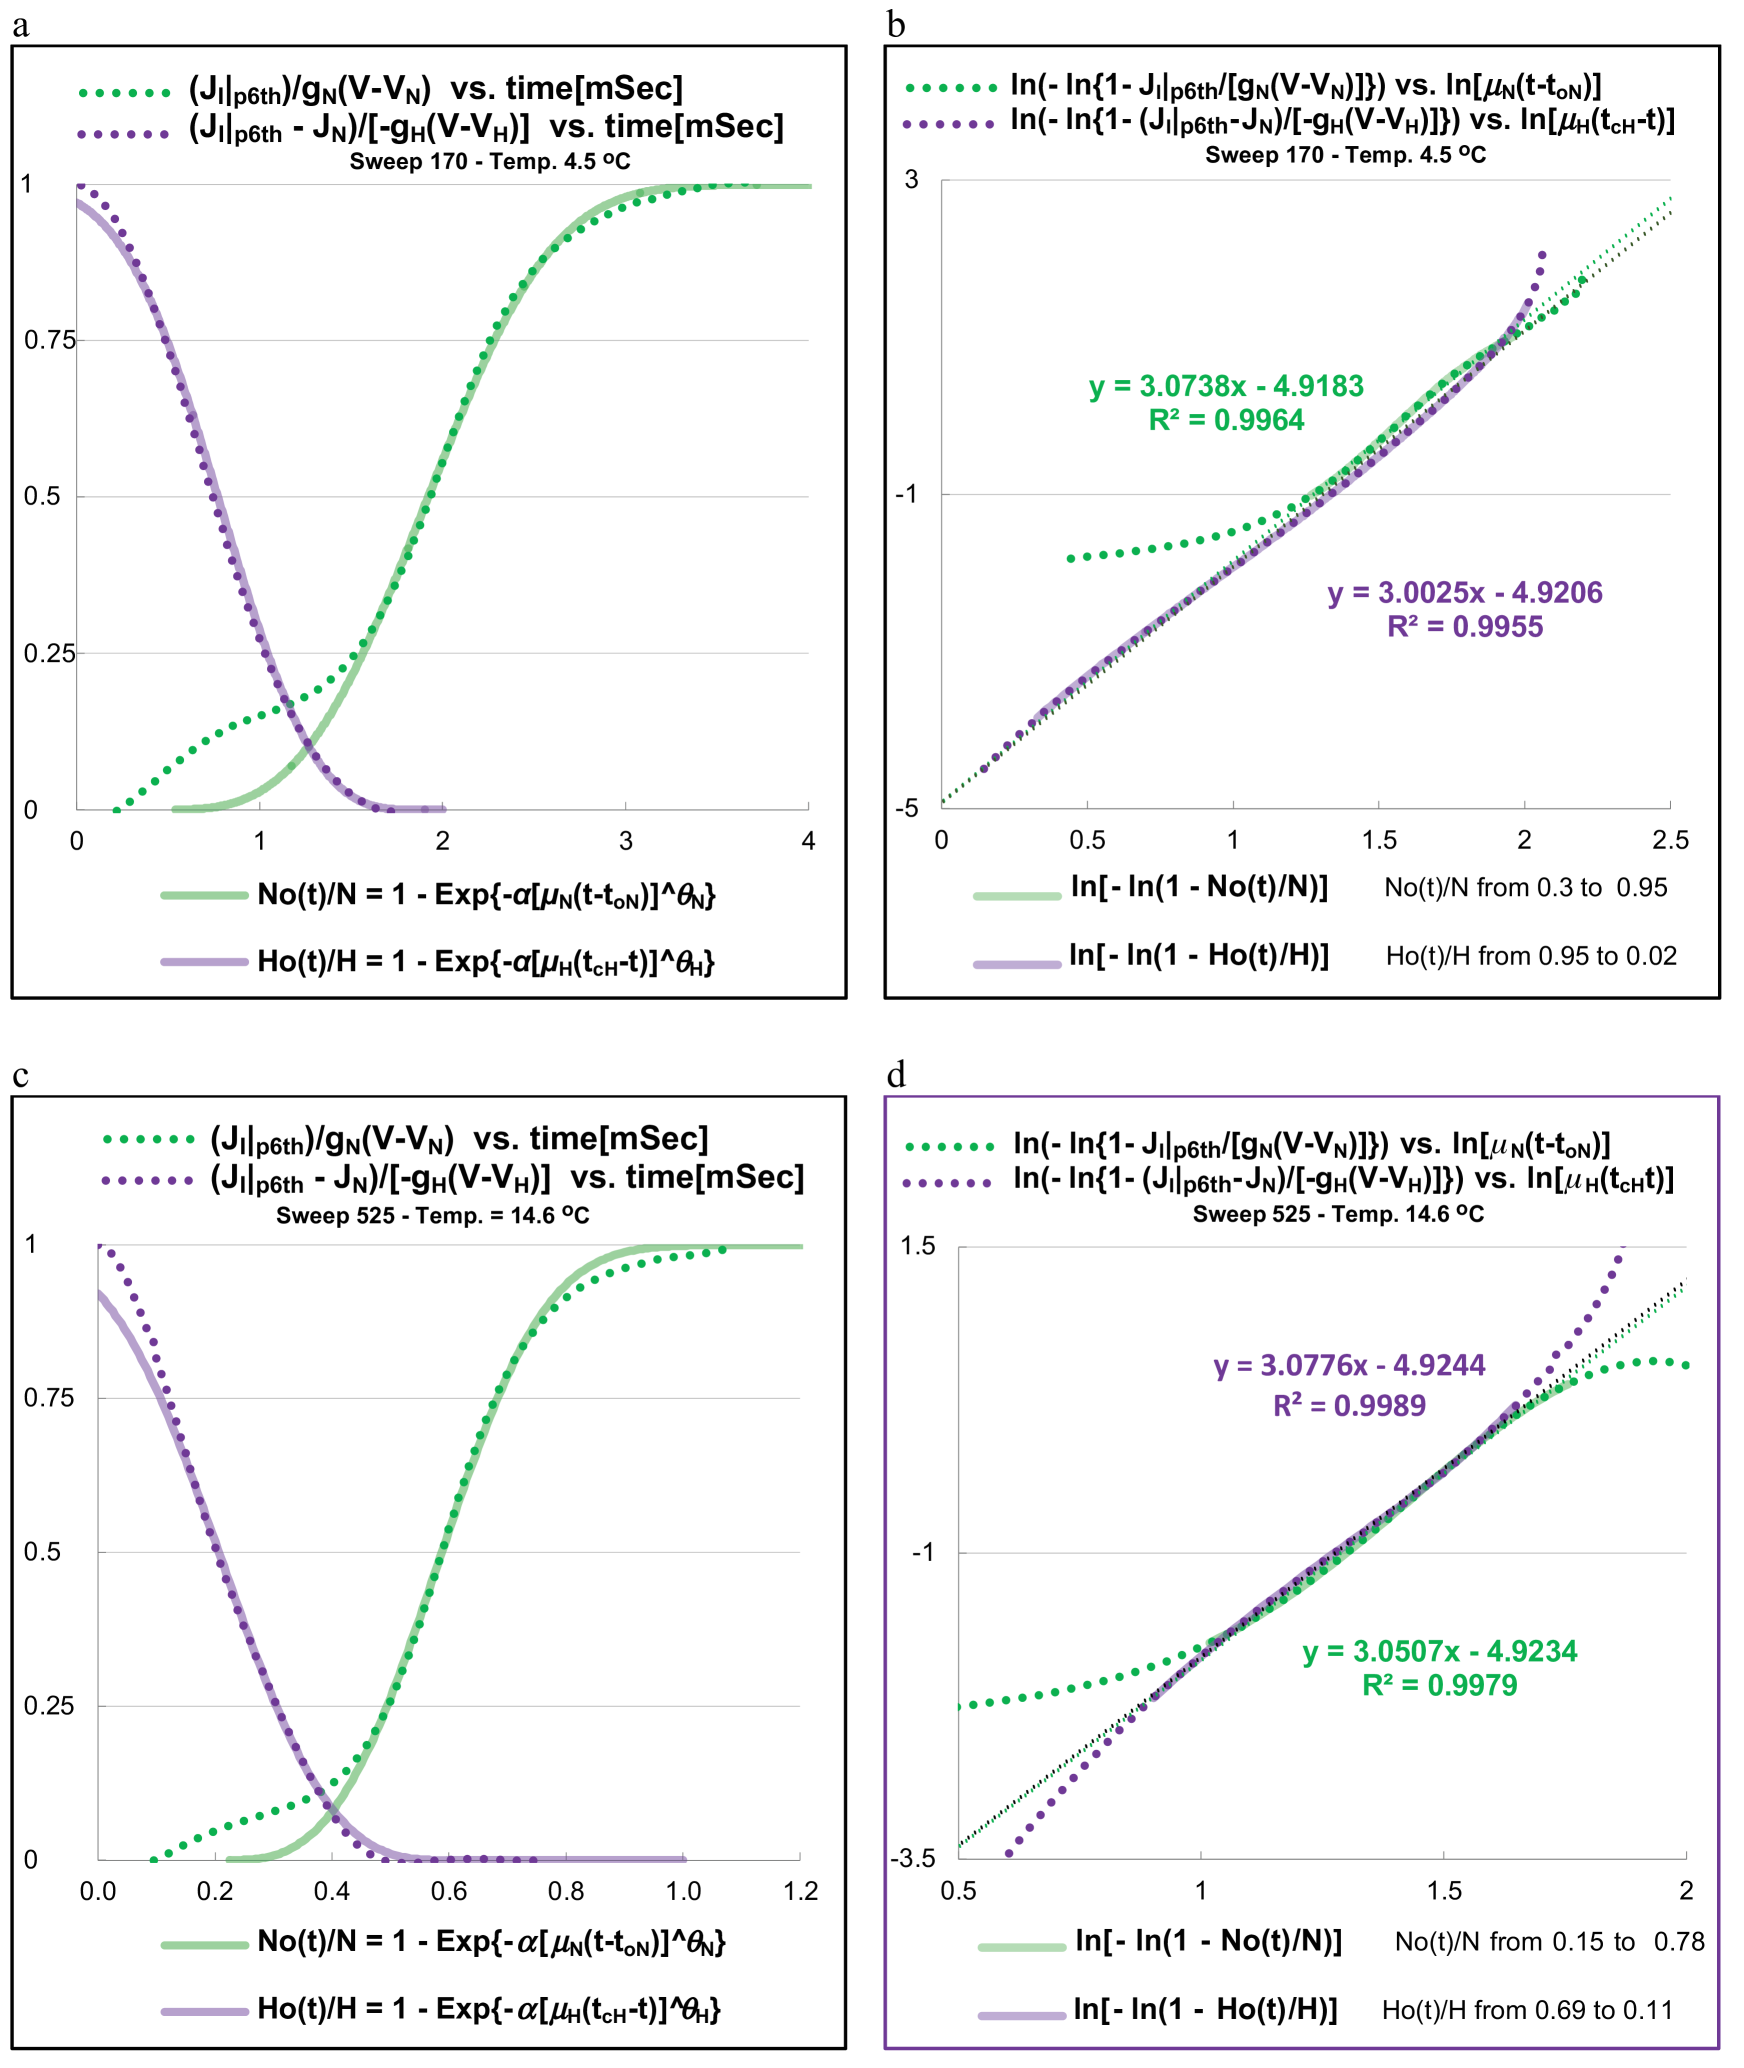
Fig. 10, and SM Figures 17, 18 display, as functions of time, the mAvrami fits for Mo/M and for and , the fraction of open sodium M-channels and fractions of completed polarization processes at 12.5 oC, 4.5 oC and 14.6 oC respectively. These figures also display the plots of ln[-ln(1-Mo/M)] vs. ln[ and ln[-ln(1-o/)] vs. ln[ for and ln[-ln(1-o/)] vs. ln[. Note that the fraction of open channels at a particular time or corresponding potential is the same as the fraction of time that a single ionic sodium M-channel is open.
The ionic polarization current has two stages in the post inception polarization segment, both with same maximum conductance and with same reversal potential . The polarization segment with the time rate starts with the lattice polarization flip from H-symmetry to M-symmetry. The second segment with the time rate follows shutting down the inception ionic polarization current. Among 11 sweeps at different temperatures, only Sweep170 appears to close the inception ionic polarization current via two different time rates. We have fitted only the first one (see SM Fig. 17. For a typical sweep see Fig. 10. In the negative resistance segment, polarization channels also act via two consecutive stages, both with the same maximum conductance , and with the same reversal potential . Note that if one exclude the polarization flip. The time rate leads to the AP peak polarization flip and has the same temperature dependance as the time rate . The two time rates are: and 2. The exceptions are Sweep170 and Sweep525. For Sweep170, the lower time rate precedes the polarization flip while 2. For Sweep525, there is only one polarization segment, with time rate 1.36 leading to the flip (see SM Fig. 18). Fits for , , and , follow mAvrami S curves that involve quantum effects. Both polarization flips, the HM flip and the MH flip, are displayed in Figures 9, 10, and SM Figures 17, 18.
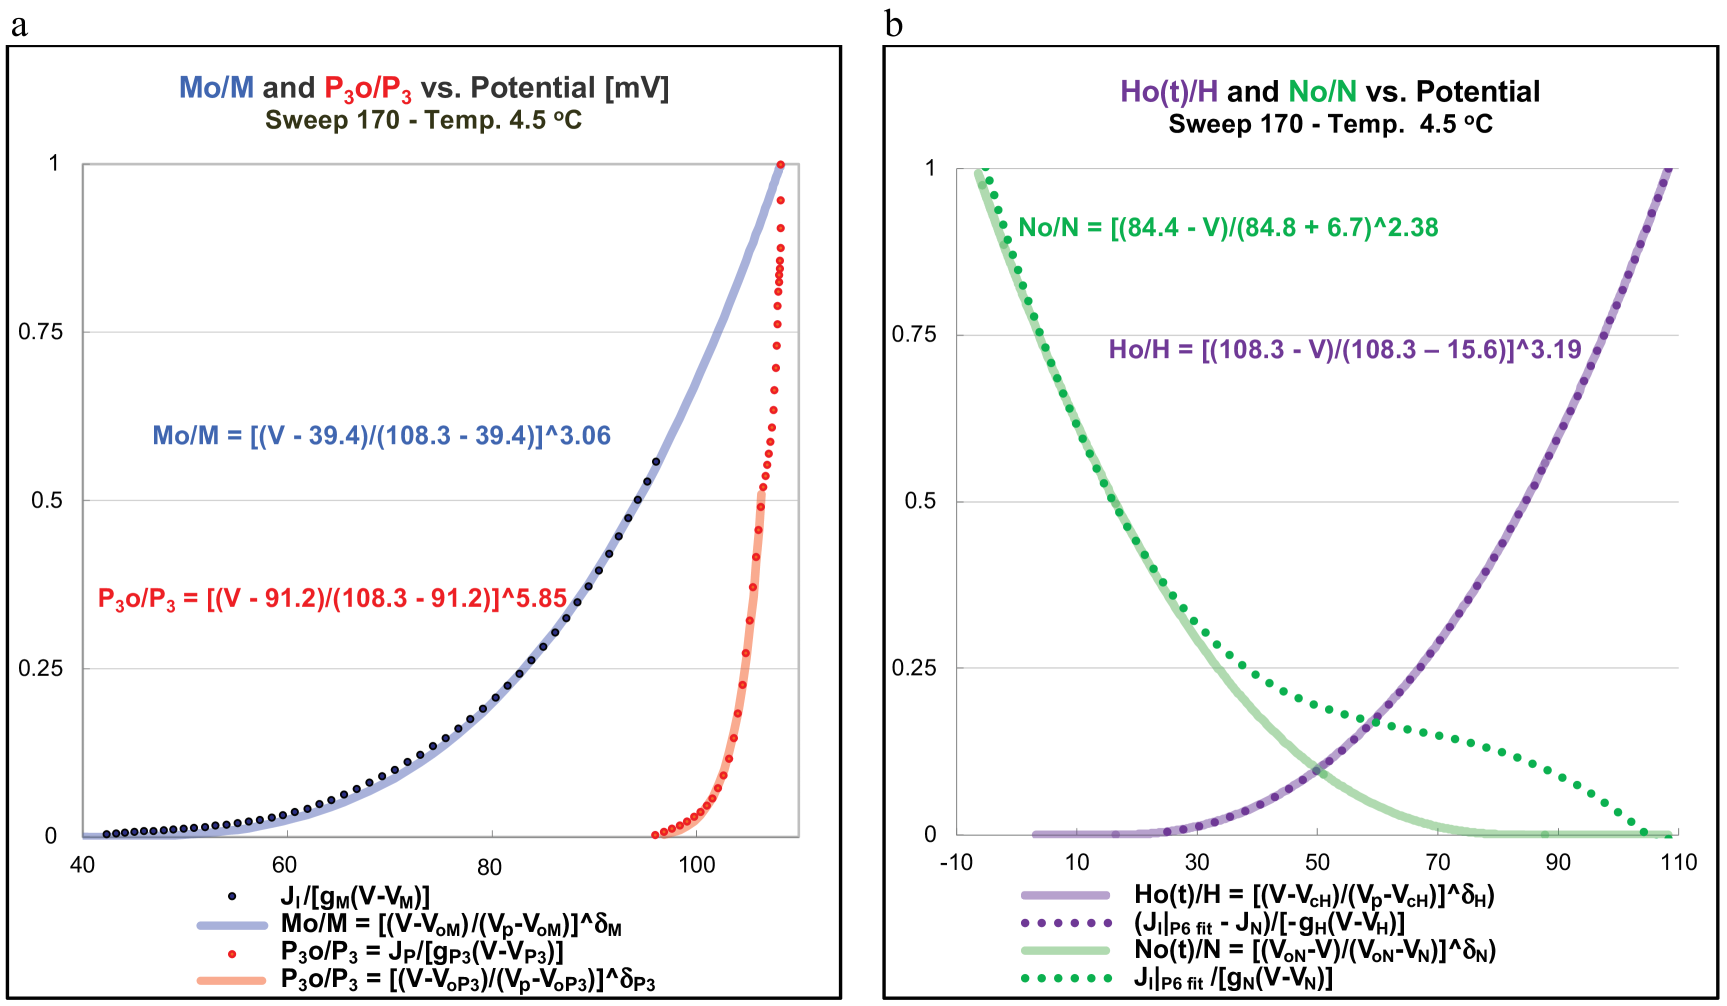
Fig. 11 displays mAvrami fits for sodium and potassium currents in the recovery region for 4.5 oC and 14.6 oC. We have also fitted the experimental data for the fraction of open channels in the phase space. Fig. 12 displays phase space open channels fractions fits of Equations (8), for Sweep170 at 4.5 oC.
| (8a) | |||
| (8b) | |||
| (8c) | |||
| (8d) |
where is the value of the potential at the peak of the action potential, and are the respective potentials at which sodium M-channels and potassium N-channels start to open, is the potential at which sodium H-channels close, and is the potential at which the polarization channels start opening. Fits for fractions are seeded with the value corresponding to . The average value of the exponent for ten sweeps from C to C is = 3.07. Fits for fractions Ho(V)/H and No(V)/N have been done with values and as free parameters. Note that the fractions of open channels , and at any given time can be interpreted as the fraction of time that the corresponding single M-channel, H-channel or N-channel is stochastically open. The corresponding phase space ionic currents fits for Sweep 170 are plotted in Fig. 2 and Fig. 3. AP peak polarization segments, with steep tangents in the proximity of the peak and with more than one time rate, are less amenable to phase space fitting.
III Discussion and Conclussion
Nature has designed the giant squid axon to propagate a steady action potential along its length. The axon exists to provide communication between the external stimulus and squid’s physiological response. In general, Nature provides various ways to initiate the all or nothing pulse. At the synapse, the release of acetylcholine by the action potential at the end of the nerve initiates the signal at the connecting nerve. In the lab, injecting current into the axon will generate an all or nothing action potential depending on the magnitude of the stimulus. Hodgkin and Huxley used the detailed voltage clamp experimental data for sodium and potassium currents in conjunction with the cable equation to describe the initiation and propagation of the action potential caused by a sufficient injection of charge into the axon. This approach, while providing an empirical description for the generation of the action potential did not provide deeper physical insight into it.
The excitation process involves time and electrical potential evolution of the non-linear all or nothing event. However, once initiated and propagating, the action potential has no memory of how it was generated. Steady state propagation is a much simpler physical phenomenon to analyze than the all or nothing particular way of excitation leading to propagation.
In the present work we have analyzed the simplest giant squid axon experimental data that measures the steadily propagating action potential at two separate points at a given temperature. The time elapsed between signals at the two points provides the values of the velocity of propagation. All other results stem from values of axoplasm’s resistivity , axon’s capacitance , axon’s radius and the shape of the action potential in space along the axon and from the time evolution of the action potential when observed at a fixed point along the axon in conjunction with the charge conserving cable equation.
Steady state propagating action potential allows the display of all three currents from the cable equation - capacitive, ionic and membrane current - in phase space as functions of temperature and electrical potential. These displays clearly exhibit three distinct currents with quasilinear segments: mainly potassium’s at the foot of action potential, sodium’s at the beginning of the recovery and potassium’s ending in the undershoot of the action potential. We have parsed the rising edge ionic current as the sum of currents , the mAvrami sodium current and the polarization currents . The current exhibits its own quasi linear segment and the polarization currents and follow the inception and lead to AP peak polarization flips respectively. The recovery region currents are parsed into mAvrami currents , with quasi linear segments and polarization current . The current is much smaller in value and extension than its counterparts . We have not attempted to fit it. The cable equation separately conserves charge for the three mAvrami components and the corresponding three polarization currents for sodium M-channels and H-channels.
Our phenomenological fittings reproduce the experimental data for the propagating action potential fairly accurately and yield a number of conclusions, some comparing and some differing from the H-H empirical model:
1. The nature of the AP inception. Both, the outgoing potassium and incoming sodium currents are present at the foot of the AP in H-H models. As the potential increases, sodium current overcomes potassium current and the derivative of the total current becomes negative. Any perturbation in this region triggers the further opening of sodium channels.
In our model the perturbation that starts the inception of incoming ionic sodium current is a continuous phase change with a polarization flip followed by the current and a small polarization current which depolarizes the membrane after crossing the zero current axis furthering the opening of sodium M-channels and thus increasing the incoming sodium current. What ion carries the inception ionic polarization current? We have fitted the polarization current leading to the AP peak with some of sodium current signature properties: same Avrami exponent 3.78, time rates that are multiples of sodium current time rate , conductance = if one excludes the narrow region of the polarization flip, the activation energy slightly smaller than , the reversal potential = but somewhat close to . The AP peak polarization flip takes the sodium M-Lattice symmetry into sodium H-Lattice symmetry. It follows that the inception AP polarization flip must take the sodium H-Lattice symmetry into sodium M-Lattice symmetry triggering the action potential. The fitted fraction of open inception ionic polarization channels has: same Avrami exponent 3.78 of M-Lattice fraction of open channels , and most time rates rates and are approximate multiples of sodium current time rate . However, the conductance is much smaller than and the reversal potential = is very close to but slightly higher than the inception potential of about 40 mV at . The chloride reversal potential in the axon at rest is reported to be about 15 mV. One should also probably expect a small contribution from polarization channels below the inception potential while in dynamical equilibrium with other players in the AP foot: potassium and sodium permeability, chloride channels current and sodium-potassium pump. However, the present analysis doesn’t provide further insight into the details of the current components.
While the present work deals directly only with the steady propagation of action potential, nevertheless it provides an insight into the excitation itself. The propagation of the action potential would decay without the continuous phase change at the inception. The advancing action potential foot triggers its own continuous phase change involving the ionic lattice/domain and thus perpetuates its propagation. For example, this fact suggests that the release of acetylcholine by the action potential at the end of the nerve initiates the signal at the connecting nerve by triggering a continuous phase change from sodium H-Lattice symmetry into sodium M-Lattice symmetry.
The present work posits that sodium’s channels lattice/domains act as ferroelectric sensors triggering the continuous phase change in response of any number of electro-chemical-mechanical stimuli.
2. Gating current and gating charge. H-H foresaw the existence of moving gating charges inside the membrane as the signature of sodium channels opening. Gating currents were detected [17], [18], [19] and total gating charge Q Coulomb/cm2 was measured. However, no direct correlation between the gating current and the sodium current had been established as one would expect from H-H proposed classical mechanism that posited each channel with its own charge moving gate.
Our model, by parsing the total experimental currents into mAvrami fits plus the corresponding polarization currents separately satisfying the charge conserving cable equation, yields discontinuous polarization currents at the AP inception potential and at the AP peak. The capacitive polarization current, in other words charges moving inside the membrane or simply ’the gating current’, starts discontinuously and large at the inception point and then vanishes at the inflection point of the rising edge of AP. So does the membrane polarization current. Their difference is the small inception polarization current, starting as outgoing and decreasing and then incoming, according to the charge conserving cable equation. Meanwhile, the mAvrami sodium current starts from zero and promptly overtakes the incoming polarization current. The surface under the capacitive polarization current in Lab yields the value of ’the gating charge’, as Q Coulomb/cm2 at all temperatures (see Fig. 6). The capacitive polarization current (’gating current’) precedes in size the incoming sodium current . In other words, a sizable ’gating’ charge moves before a detectable ionic current is developed as seen in Fig. 6 and SM Fig. 16 (see also Figures 8 and 12 of [20]).
In the present model, there is a second region, immediately preceding the AP peak, with a negative capacitive polarization current transferring a charge q Coulomb/cm2 in the opposite direction from the ’gating charge’ associated with inception (see Fig. 6 and SM Fig. 16 ). The motion of capacitive charges in this region is associated with inactivation.
3. Inactivation. In the H-H model inactivation is a process described by the variable h that closes sodium channels during depolarization and it overlaps with activation described by the variable m3. Increasing the delay of potassium conductance onset and delaying sodium channel inactivation reduces the discrepancy between Hodgkin and Huxley’s predicted and observed velocity of propagation [26].
In the present model inactivation is due to the outgoing portion of the ionic polarization current straddling the AP peak during depolarization and the observed velocity of propagation is an input to the model (see Fig. 9 ).
4. The recovery portion. The recovery region of the H-H action potential is not quite right when compared with the experiment. In addition, H-H model features a significant cancellation of opposing sodium and potassium currents straddling the peak of the action potential. This feature of the Hodgkin and Huxley equations results in a decrease of velocity of propagation and waste of energy [26], [27]. Increasing the delay of potassium conductance onset and delaying sodium channel inactivation reduces the discrepancy between Hodgkin and Huxley’s predicted and observed velocity of propagation [26].
The present model fits the action potential experimental data everywhere and doesn’t exhibit cancellation of opposing sodium and potassium currents anywhere. The phase space plot of total ionic current in the recovery region clearly displays the overlap of two non cancelling currents bracing the recovery region with quasilinear segments. The later linear segment intercepts the zero current axis at the potassium reversal potential, while the first segment intercepts the zero current axis in the vicinity of the rising edge sodium reversal potential at a value lower than the value of the potential at the peak. Despite the fact that no outgoing sodium current has been observed experimentally, it is difficult to come up with an alternate ion carrying the outgoing current with a reversal potential close to sodium’s reversal potential. In fact, the corresponding quasilinear segment of the recovery mAvrami capacitive current intercepts the zero current axis very close to the rising edge sodium reversal potential, while the mAvrami ionic and membrane currents intercept each other at the same potential but below the zero current axis (see Fig. 4 and Fig. 5). We conclude that we are dealing with a continuous phase polarization flip from sodium M-Lattice to H-Lattice at the peak of the action potential and with a briefly incoming and then outgoing nAvrami sodium current . The continuous phase polarization flip changes the M-Lattice symmetry into H-Lattice symmetry, decreasing the effective reversal potential of the sodium current from to . Furthermore, the time rate given by the linear segment of the recovery capacitive current is used to fit the fraction with the mAvrami equation Eq. (7b). The constraint Eq. (3b) that holds for the rising edge sodium current parameters is lost for the recovery parameters , and . However, the fitting of the data (see Figs. 4 and 5) suggests that there is a H-Lattice constraint after all: the tangent of recovery capacitive current CmdV/dt intercepts the zero axis current at the M-channel sodium’s potential reversal .
The continuous phase change at the peak, in addition of changing the time rate and the maximum conductance also changes the microscopic (quantum) properties of the sodium channels by changing the Avrami exponent from 3.78 to 3.
5. Sodium channels optimum density. While various approaches to estimate the optimum density of sodium channels using the H-H equations have failed, our model arrives closely at the density observed in nature (see Appendix A).
6. H-H model is built on data at a single temperature. H-H model doesn’t say anything directly about the temperature dependence. This limitation preclude applying thermodynamics to the study of the action potential and by extension it has nothing to say about possible phase changes involved. It is questionable if voltage clamp experiments can detect continuous phase change, even if present in a normally functioning axon.
Rozenthal-Bezanilla [4] data covers a range of temperatures from C to C yielding the exponential temperature dependence for parameters of interest in our phenomenological theory. This fact allows to calculate the temperature independent Arrhenius activation energies for the passage of ions through the membrane. These activation energies are of the same order of magnitude as the rate-limiting activation energies for metabolic processes 0.65 eV [23].
7. Ferroelectric phenomena. The opening of polarization channels and the accompanying polarization current proceeding in the negative resistance region, are manifested by the decrease experimental conductance for the total ionic current , the change in the effective ionic equilibrium potential and possibly by the presence of optic phenomena [29]. At the peak of the action potential the sodium’s M-channel maximum conductance changes abruptly from to with about one order of magnitude smaller than and the effective equilibrium potential change is completed by an abrupt decrease from to while keeping the ionic current continuous. The maximum conductance is usually assumed to be the product of channel density and the conductivity of a single channel, i.e. = . At this point it is not clear if the abrupt change of to is caused by the change in the number of open sodium channels or change in the individual channel conductance or change in both. The abrupt decrease in sodium’s equilibrium potential is caused by the polarization flip put in evidence by the polarization current discontinuity. The sodium’s M-Lattice and H-Lattice have different symmetry and different structure. The transition from M-Lattice to H-Lattice is a continuous phase transition interpreted as a ferroelectric polarization flip mediated by polarization currents straddling the peak of the action potential. This process, involving a region with many channels, is consistent with the view that in ferroelectric phenomena ”The mechanism of switching is understood to take place on scales longer than the unit-cell scale [28].”
Similarly, at the inception of the action potential there is a continuous phase transition from from sodium H-Lattice to M-Lattice. In addition to properties of individual channels, nerve excitability also involves ferroelectric phenomena pertaining to domains/lattices of ion channels [29], [30].
8. Fine-structure constant . The fine-structure constant is associated with quantum electrodynamics rather than materials science. However, unexpectedly, it has been shown that the opacity of suspended graphene [31] is defined solely by it, with authors saying: ”It is remarkable that the fine-structure constant can so directly be assessed practically by the naked eye.” In the present work, unexpectedly, we were able to fit the fractions of open channels by seeding the value of the fine-structure constant for the constants , , and the Avrami exponent , with the value 3.78 while optimizing the parameters , , , , , , and .
We have also fitted the fractions by seeding the value of the fine-structure constant for the constants and the Avrami exponents with the value 3.78, while optimizing the corresponding parameters , and .
The existence of ion channels is essential for life and so is the role of the fine-structure constant .
Passage of ions through a membrane channel involves interactions with the surface of the pore at microscopic distances. The temperature independent Arrhenius activation energies for the passage of ions through the membrane are of the same order of magnitude as the rate-limiting activation energies for metabolic processes 0.65 eV [23]. We posit that the fine-structure constant plays a role of universal scaling parameter across sodium, potassium and polarization channels.
9. Single channel behavior. The fractions of open channels , and at any given time can be interpreted as the fraction of time that any corresponding single M-channel, H-channel or N-channel is stochastically open in the regions where the polarization channels are not open.
10. Memory storing and retrieval. The role of the ferroelectric lattice behavior defined by continuous phase transitions associated with morphological changes in sodium channels lattice described in the present work has implications for encoding of memories. Encoding of memories across invertebrates, insects and mammals are also associated with steplike morphological changes in neuron’s cytoskeleton. It has been suggested that evolution has conserved across species the underlying molecular mechanism involved in encoding of memories. It is accepted that invertebrates and mammalians share many of the same memory encoding properties [32], [33]. In particular, there is an extensive accumulation of research and experimental data on the associative memory storage and retrieval by Drosophila. There is a general agreement as expressed by [34]: ”…that there is a cytoskeletal pathway underlying the very first steps towards associative olfactory memory encoding in Drosophila”. Also, ”… larvae learned in a switch-like (all-or-none two-state quantized) manner. The learning process was better described as a sudden transition between states… [35]”. Also, ”The learning curves for individual subjects show an abrupt, often step-like increase from the untrained level of responding to the level seen in the well trained subject [36]”. At the same time, there is experimental evidence that ”Sodium channels in axons are distributed in a periodic pattern coordinated with the underlying actin-spectrin–based cytoskeleton” [30], implying the existence of sodium channels lattice in general. Also, according to [29]: ”presence of optical changes during nerve excitation are consistent with the view that the process of excitation is accompanied by conformational changes in macromolecules of the nerve”. Polarization flips (continuous phase transitions - CPTs) at the inception and at the peak of the giant squid axon action potential modify the structure of sodium channels lattice in a step like manner. Although the duration of the M-Lattice structure in squid axon is ephemeral lasting only during the rising edge of the action potential while cytoskeleton modifications involving memory encoding’s with definitive lifetimes, minutes/hours short lived or permanent, we posit that memory encodings are also initiated by neuron’s cytoskeletal continuous phase transitions. Note that while domains involved in CPTs are too large in principle to involve quantum effects, the different M and H configurations of sodium’s channels cytoskeletal lattice correspond respectively to different M and H sodium channels time rates, and Avrami exponents.
We posit that these steplike changes of the cytoskeleton structure are initiated by a continuous phase change. The hysteresis loop with two different symmetry states of sodium channels lattice implies the possibility of additional neuronal stable states besides the resting state. Additional neuronal stable states are the physical basis for long term memory formation and retrieval. [11].
11. What is next? The present work presents a coherent and self consistent description of the propagating action potential by parsing the total ionic current into mAvrami sodium, potassium and membrane currents and corresponding polarization currents traversing ion channels exhibiting quantum mechanical properties and by describing the ferroelectric properties of the sodium channels lattice/domains polarization flips. While the fitting results for any one temperature may have some latitude, the synergy of results across several temperature adds confidence to overall results. While the exacting role of the fine-structure constant in the mAvrami equations for all the ion channels considered in the present work instills confidence in the theory, the experimental verification of H-channel current and M-channel current as sodium currents would provide the definitive proof. Reducing the recovery noise would be helpful to fit the small polarization current following the AP peak. Further research is required to determine which ion or ions carrie the inception ionic polarization current.
Presented results will provide a framework for further experimental analysis of excitability role by sodium channels lattice and its thermodynamic phase changing behavior, the role of quantum mechanics in biochemical reactions mediating the flow of ions across ion channels and the plasticity of neuronal stable states essential for memory storage and retrieval mediated by continuous phase changes.
Appendix A Action potential hysteresis loop
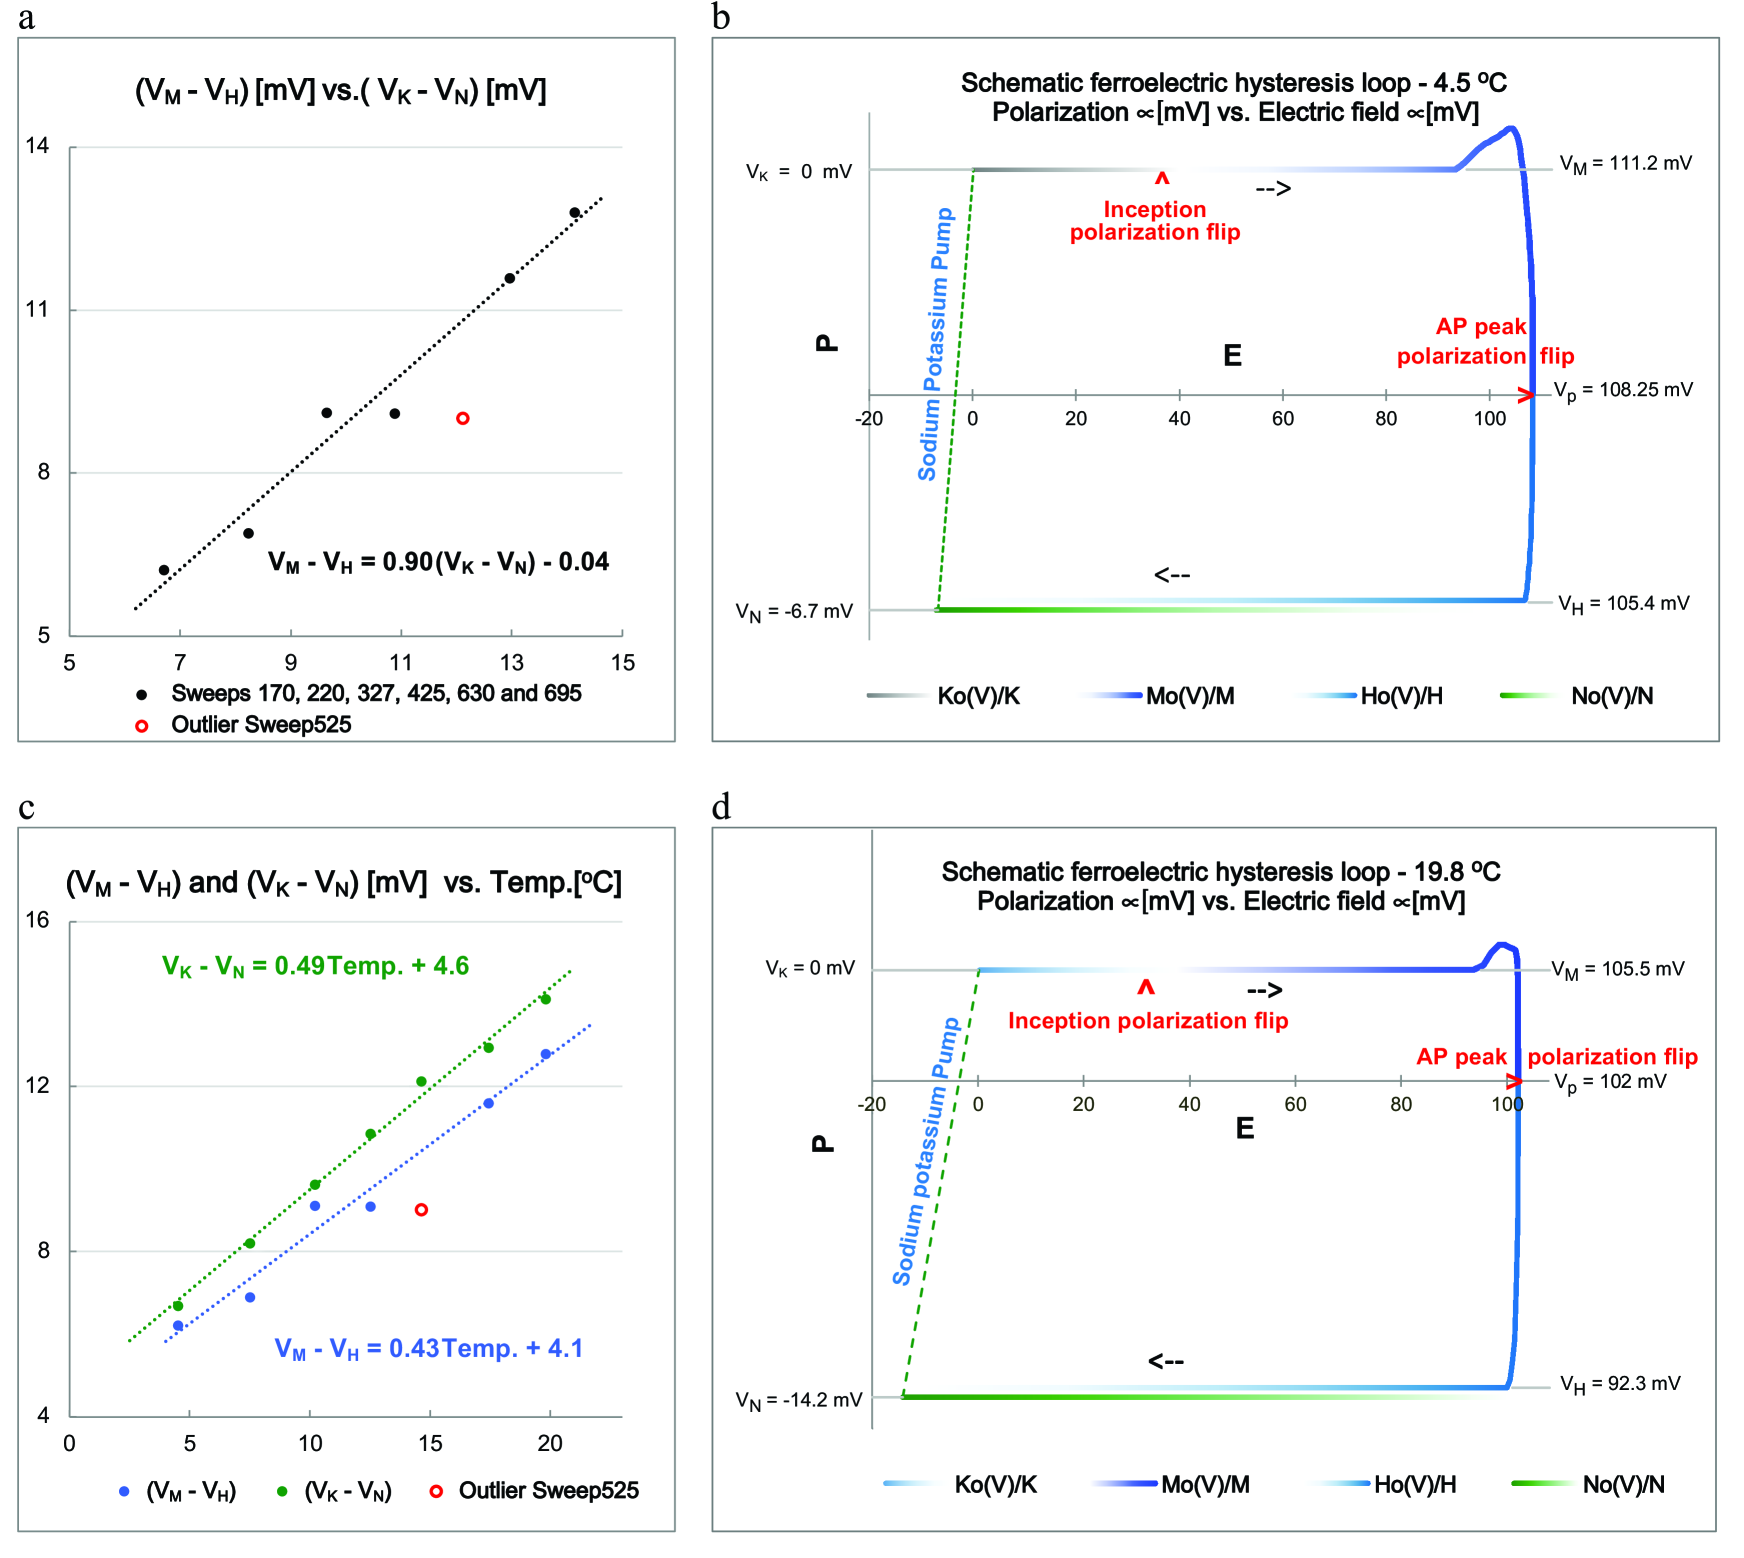
The observation of a propagating AP in the lab starts with the increasing potential and the increasing outgoing small potassium current. At the AP inception there is a polarization flip from H-Lattice to M-Lattice and incoming sodium current with reversal potential is initiated. For the purpose if this Appendix we are neglecting the effects of the ionic polarization current following the inception. At the AP peak, while the potassium channels are closed, the effective sodium reversal potential has an abrupt decrease from to correlated with the polarization flip. As the sodium H-channels with reversal potential are closing, the potassium channels with reversal potential are opening. Potassium current turns incoming after is crossed and the effective potassium reversal potential has a very slow increase from to mediated by the potassium-sodium transport mechanism while sodium channels are closed. Eventually the equilibrium between potassium and chloride permeabilities and sodium-potassium pump determines the resting potential and the effective reversal potential hysteresis loop is closed. Fig. 13(a) shows the linear correlation between and over a range of temperatures. Fig. 13(c) shows that linear fits for and vs. temperature have similar slopes. The average ratio for six sweeps is 0.9. Figs. 13(b) and 13(d) show the schematic hysteresis loops for sweeps at 4.5 oC and 19.8 oC. The surface of the hysteresis loop at 19.8 oC is about twice as large as the surface at 4.5 oC, indicating that the heat generated by the AP is twice as large at 19.8 oC than at 4.5 oC.
Fig. 4 for Sweep 170 at 4.5 oC shows that both, the rising edge polarization current and the recovery polarization current have quasi-linear segments, before reaching the action potential peak and after the action potential peak respectively. Therefore, they can be represented approximately as follows:
| (9a) | |||
| (9b) |
The mAvrami fit fails as the potential nears the peak of the action potential since the derivative of the polarization current, a component of the total ionic current, tends to infinity. As tends to the derivatives of tend to infinity and the total ionic current tends to a finite value.
The rising edge portion of the polarization current displays two distinct segments. The outgoing current’s quasi-linear part intercepts the current axis with the slope 56 mS/cm2 and the value of the intercept is 106.6 mV. Note however that the tangent of the polarization current tends to infinity as the voltage tends to the peak of the action potential, so the quasilinear behavior is only present away from the peak of the action potential. The polarization current at first increases the incoming the total sodiumcurrent and then it decreases it. This implies first an increase and then a steep decrease of sodium’s -channel effective equilibrium potential (Meep). Thus, up to a fraction of a mili-volt from the peak of the action potential, the -channel total ionic current and Meep(V) can be written as follows:
| (10a) | |||
| or | |||
| (10b) | |||
| In the close proximity of the action potential peak we have | |||
| (10c) | |||
| where goes from to infinity (see Fig. 4) as V approaches . Since, respectively, at 4.5 oC and 19.8 oC | |||
| (10d) | |||
| (10e) | |||
The recovery polarization current is much smaller and it covers a smaller region than its counterpart leading to the AP peak. Neglecting the outgoing portion, we have plotted (see Fig. 4) only its incoming part covering about 1.5 mV below the peak of the action potential and where all the H channels are open, Here, away from close proximity of the action potential peak the equivalent of Eq. 10b is
| (11a) | |||
| or | |||
| (11b) | |||
| In the close proximity of the action potential peak we have | |||
| (11c) | |||
| where goes from to infinity (see Fig. 4) as V approaches . Since, respectively, at 4.5 oC and 19.8 oC | |||
| (11d) | |||
| (11e) | |||
As the potential traverses the peak, total ionic current and sodium’s effective equilibrium potential are continuous and the polarization current is discontinuous.
Hippel [37] and Leuchtag [38] have suggested that ferroelectricity plays a role in biological excitability. A hypothesis that a single sodium channel exhibits ferroelectric behavior has been advanced [39] based on measurements by Palti [40] of axon’s capacitance in the temperature region with membrane excitability.
A ferroelectric hysteresis loop is a graph of polarization vs. electrical field. Fig. 13(b) and Fig. 13(d) display the phase space trajectory of the schematic hysteresis loop traversed by the action potential in terms of sodium and potassium effective equilibrium potentials at 4.5 oC and 19.8 oC. Deviation from chemical equilibrium potentials is caused by the polarization that is function of electrical field which in turn is proportional to the potential across the membrane. Note that decreases by 13 mV as temperature increases from 4.5 oC to 19.8oC while decreases by less than 6 mV.
The inception polarization flip closes the potassium channels and changes to and to , and starts to open the M-sodium channels. The polarization flip at the peak of the action potential changes to and to while sodium channels are open as observed in Fig. 4, and changes to while potassium channels are closed. The sodium-potassium pump changes to while potassium channels are open. Fig. 13(a) shows the linear correlation between and over a range of temperatures. Fig. 13(c) shows that linear fits for and vs. temperature have similar slopes. The average ratio for six sweeps is 0.9. Sodium’s M-channel maximum conductance and H-channel maximum conductance are different and so are the respective time rates and . Sodium’s M-Lattice and H-Lattice have different symmetry. These facts are a signature of a continuous (second order) phase transition [41].
The surface enclosed by the hysteresis loop is proportional to energy spent, i.e. it is proportional to heat released. The surface enclosed at 19.8 oC is approximately twice the surface enclosed at 4.5 oC and so is the corresponding heat released. There are many experimental instances reporting heat production associated with electrical excitability; see the review article by I. Tasaki [42].
Appendix B Optimum channel density
Hodgkin [43] hypothesized that there is an optimum sodium channel density to achieve the maximum velocity of propagation and that the maximum sodium conductance , i.e. , is expected to be proportional to the surface density of sodium channels M. His calculation arrives at the optimum density of about 1000 sodium channels per , which is about twice the number measured by Keynes and Rojas [19]. Adrian [44] calculated the maximum velocity of propagation by means of modified Hodgkin-Huxley equations allowing for a sodium gating current, which reduces the velocity of propagation significantly below the observed one.
Assuming as Hodgkin that the maximum sodium conductance is proportional to sodium channel density we have
| (12) |
where is the single channel conductance at a particular temperature. Increasing M increases the velocity of propagation, but at the same time it increases the fraction of the membrane capacitance due to the channels. In the linear region, where all the channels are open, sodium maximum conductance is given by Eq. (3b)
| (13) |
See Fig. 7(a) and note that for up to about 20 oC the temperature rates are approximately the same for , and . The rates and exhibit a constant ratio
| (14) |
for up to about 20 It is reasonable to assume that the rate constant has the same dependency on , , and up to 20 oC as the propagation constant . Using Eq. (14) and the expression Eq. (3d) for , Eq. (13) is written as
| (15) |
or
| (16) |
where is the capacitance of a single channel and is the capacitance of the membrane without channels. If remains fairly constant as M varies, the velocity of propagation has a maximum at the observed velocity when
| (17) |
or specifically m2 when = F and = 1F/cm2. Keynes and Rojas [19] estimated sodium channel density M to be m2 when = 2.5 pS and = F.
Appendix C Fitting Procedure
Rosenthal-Bezanilla data provides the action potential at two points along the axon at different temperatures. The action potential data was analyzed at the point furthest away from the stimulus. Rosenthal measured the resistivity at C and determined that his measurement was consistent with the generally used expression for resistivity, also used in this work,
| (18) |
Rosenthal-Bezanilla experimental data of the action potential at different temperatures are discrete values taken at fixed time intervals. The amount of noise in the data depends on its rate of change and on the temperature. To improve fitting we have used Gauss sigma smoothing while trying to minimize the loss of accuracy. At lower temperatures there is more noise and there are many more data points than at high temperature. Larger Gauss sigma smoothing values are required at low temperature than what is required at higher temperatures. The recovery region, being noisier, required more smoothing than the rising edge at a given temperature.
Approximate time rate parameters , and and maximum conductance , and can be read from Fig. 2, Fig. 3 and Fig. 4; or, the maximum conductance can be determined by Equations (3a), (3b) and (3c) respectively if the corresponding time rate is known (or vice versa). There is no such relation for H-channel currents. Both, the rate and maximum conductance are to be read separately from Fig. 4. Quasilinear segments in phase space are segments of all corresponding ion channels open and as such are amenable to fittings by the usual expressions for ionic currents Eq. 2d, Eq. 2g, and Eq. 2h where the fractions of open channels are fitted by corresponding mAvrami equations describe a completion of a crystallization process from zero to one by the S curve in time. Fittings, by mAvrami equations Eq.(7a), Eq.(7b) and Eq.(7c) are very sensitive to values of time parameters , , and the corresponding time rates , and less so to values of and . As a result, we have seeded all with the value of the fine-structure constant: = 0.007297352. Also, all three Avrami exponents were seeded, = 3.78. While the linear segment of recovery sodium current presents itself clearly and intersects the zero current axis below but close to AP peak, the rising edge total incoming sodium doesn’t present a clear quasilinear segment. Inclusion of points beyond the start of negative resistance region in the fit for fraction of open channels results in a quickly diverging Avrami exponent indicating that incoming sodium current consist of an additional superimposed polarization process in the negative resistance region and up to just before the action potential peak. The fitting region was chosen to be between the inflection point of the action potential (the maximum value of the capacitive current) and the beginning of the negative resistance region. These choices result in the values for sodium’s reversal potential , time rate (and according to Eq. (3b)) and the time for Eq. 2d and (7a). The difference between the experimental current and thus obtained sodium current yields the polarization current = = - . Similarly, the fraction of completed polarization process, as approximated by the mAvrami Eq.(7d) was also fitted by seeding the values of with the value of the fine-structure constant and Avrami exponents were seeded with the value 3.78. For lack of known constraints, are independent parameters in our fitting. In fact, fitting revealed that polarization time rates , with some exceptions, are close multiples of sodium’s M-channel time rate . While all parameters present smooth curves when plotted against temperature, the values of vary up and down greatly from one sweep to another because they include polarization flips. However, prior to a polarization flip, the polarization conductance is at all temperatures.
Capacitive current fitting of Eq. 2c and ionic current fitting of Eq. 2d would be equivalent except for the exponent 1/3 in the capacitive current factor . Both currents have the same reversal potential and the time rate and maximum conductance are related by Eq. (3b). The exponent 1/3 gives a good fit for the capacitive current . We did not try to determine if the factor also holds for recovery capacitive currents.
The fittings of the recovery region were done by approximating total ionic experimental data , already smoothed by Gauss sigma method, with a sixth order polynomial covering the region from the potassium reversal potential to close to reversal potential avoiding the small region of the polarization flip. The recovery region presents itself as an evident superposition of two currents. We separated them by first extracting the potassium current which presents a clear reversal potential at the end of the quasi-linear segment which renders the maximum conductance and time rate . Next, the fraction is fitted and recovery potassium current is obtained. The sodium current is obtained by subtracting the potassium current from the sixth order polynomial fit . The 6th order polynomial fit curve intercepts the zero current axis at the reversal potential . Maximum conductance is obtained by having the reversal potential and the conductance. The fit is completed by optimizing the unconstrained time rate and . Although, the graph Fig. 5 suggests a constraint since the tangent defining intercepts the zero axis current at the value of reversal potential . The fits for vary with most latitude, as they are one step removed from fits and because the region close to action potential peak includes the contribution from polarization of H-channels which we did not fit.
We have also fitted the fractions of open ion channels, for all sweeps with Eq. (8a), and and for Sweep170 with Eq. (8b) and Eq. (8c) with three parameters. For Mo(V)/M, The parameter is known, and was fixed to correspond to previously obtained fitting . The resulting exponent is 3 at all temperatures.
All fittings were done using Gauss sigma smoothing and Excel’s Solver software. All fittings are sensitive to number of points included, the sensitivity increasing with temperature since fewer and fewer points were recorded. In addition, , the outgoing sodium current displays more granularity for sweeps at lower temperatures. In particular there is a prominent bump just above 55 mV (See Fig. 3 and Fig. 15b). Although each fit individually may present some uncertainty and latitude, the cumulative picture gathered over several temperatures presents a precise, exacting, coherent and self-consistent scenario. The exception is Sweep 525 with parameters , and that are outliers while the behavior of others such as , , , and is consistent with parameters at other temperatures.
Acknowledgements.
NJ wants to thank Prof. J. J. C. Rosenthal making the present work possible by giving him in 1999 the electronic copy of Wa05097a.dat file containing the experimental data collected in Reference [3]. He is greatly indebted to him and to Prof. Francisco Bezanilla for sharing their data. NJ wants to thank Dr. Bogdan Mihaila for recommending further study of the role and the meaning of temperature independent dimensionless constants . NJ wants to thank Dr. Andrew Perlman for asking a question about Hodgkin-Huxley equations close to 50 years ago. NJ and FC want to thank Prof. Benjamin Drukarch for helpful comments. NJ and FC want to thank the Santa Fe Institute for its hospitality during the work on the paper. NJ and FC want to thank Prof. Geoffrey West for a helpful comment.References
- [1] Hodgkin, A. L., Huxley, A. F. and Katz, B. 1952. Measurement of current-voltage relations in the membrane of the giant axon of Loligo. J. Physiol. (London)
- [2] Hodgkin, A. L., and A. F. Huxley. 1952. A quantitative description of membrane current and its application to conduction and excitation in nerve. J. Physiol. (Lond.). 117: 500-544.
- [3] B. Drukarch et al. Thinking about the nerve impulse: A critical analysis of the electricity-centered conception of nerve excitability. Progress in Neurobiology Volume 169, October 2018, Pages 172-185
- [4] Rosenthal, J. J. C. and Francisco Bezanilla. Seasonal variation in conduction velocity of action potentials in squid giant axons. 2000. Biol. Bull. 199: 135-143.
- [5] Cope F. W. Solid state physical replacement of Hodgkin-Huxley theory. Phase transformation kinetics of axonal potassium conductance. 1977. Physiol. Chem. Physics. 9: 155-160.
- [6] Avrami, M. 1939. Kinetics of Phase Change. I. General Theory. Journal of Chemical Physics. 7 (12): 1103-1112.
- [7] Avrami, M. 1940. Kinetics of Phase Change. II. Transformation-Time Relations for Random Distribution of Nuclei. Journal of Chemical Physics. 8 (2): 212-224.
- [8] Avrami, M. 1941. Kinetics of Phase Change. III. Granulation, Phase Change, and Microstructure. Journal of Chemical Physics. 9 (2): 177-184.
- [9] Richard P. Feynman (1985). QED: The Strange Theory of Light and Matter. Princeton University Press. p. 129. ISBN 978-0-691-08388-9
- [10] Washington University, 3rd Edition. Bertil Hille (2001). Ionic Channels of Excitable Membranes. p. 5.
- [11] Hopfield, J. J. 1982. Neural networks and physical systems with emergent collective computational abilities. Proc. Natl. Acad. Sci. USA Vol. 79, pp.2534-2558.
- [12] Kandel, E. R. 1982. The Molecular Biology of Memory Storage: A Dialog Between Genes and Synapses. Bioscience Reports, Vol. 21, No. 5, October 2001.
- [13] Huang K., Statistical Mechanics, 1987 2nd Edition.
- [14] Jurisic N., 1987. The propagation of the nerve impulse. Biophysical Journal. 51: 817, 823.
- [15] Landau L. D. and Lifshitz E. M., Statistical Physics, Third Edition, Pergamon Press, 1980. pg. 2.
- [16] Keynes, R. D. 1963. Chloride in the squid giant axon. J. Physiol., Lond. 169: 690-705.
- [17] Armstrong, C. M. and Bezanilla, F. (1973). Currents related to movement of the gating particles of the sodium channels. Nature, Lond. 242, 459-461.
- [18] Armstrong, C. M., and F. Bezanilla. 1974. Charge movement associated with the opening and closing of the activation gates of the Na channels. J. gen. Physiol. 63: 533-552.
- [19] Keynes, R. D., and Rojas, D. 1974. Kinetics and steady-state properties of the charged system controlling sodium conductances in the squid giant axon. J. Physiol., Lond. 239: 393-434.
- [20] F. Bezanilla. Gating curents. J Gen Physiol. 2018 Jul 2;150(7):911-932. doi: 10.1085/jgp.201812090
- [21] Scott, A. C., 1975. The electrophysics of a nerve fiber. Rev. Mod. Phys. 47: 487-533.
- [22] Kenneth A. Connors, Chemical Kinetics, 1990. VCH Publishers. p. 245.
- [23] Gillooly, J. F., J. H. Brown, G. B. West, V. M. Savage, and E. L. Charnov. 2001. Effects of size and temperature on metabolic rate. Science 293:2248–2251.
- [24] I. Tasaki. Evidence for phase transition in nerve fibers, cells and synapses. Ferroelectrics. 1999, Vol.220, No.1, p.305.
- [25] Nigel Goldenfeld, Lectures on Phase Transitions and The Renormalization Group, Frontiers in Physics, 1992. pg. 81.
- [26] Sangrey, T. D., Friesen, W. O. and Levy, W. B. 2004. Analysis of the Optimal Channel Density of the Squid Axon Using a Reparameterized Hodgkin-Huxley Model. J. Neurophysiol. 91: 2541-2550.
- [27] Sengupta B, Stemmler M, Laughlin SB, Niven JE (2010) Action Potential Energy Efficiency Varies Among Neuron Types in Vertebrates and Invertebrates. PLoS Comput Biol 6(7): e1000840. doi:10.1371/journal.pcbi.1000840
- [28] K. Rabe, C. H. Ahn, J.-M. Triscone (Eds.). Physics of Ferroelectrics: A Modern Perspective (Topics in Applied Physics. 105) 2007th Edition.
- [29] I. Tasaki, A. Watanabe, R. Sandlin, and L. Carnay. Proc Natl Acad Sci U S A. Changes in fluorescence, turbidity, and birefringence associated with nerve excitation. 1968 Nov;61(3):883-8.
- [30] Xu, K., Zhong, G., Zhuang, X., 2013. Actin, spectrin, and associated proteins form a periodic cytoskeletal structure in axons. Science 339, 452–456.
- [31] R. R. Nair, et al., 2008. Fine Structure Constant Defines Visual Transparency of Graphene. Science. Vol. 320, Issue 5881, pp. 1308.
- [32] Hawkins, R.D., Kandel, E.R., and Bailey, C.H. (2006). Molecular mechanisms of memory storage in Aplysia. Biol. Bull. 210, 174–191.
- [33] Krashes, J., Keene, A. C., Leung, B., Armstrong, J. D., Waddell, S. Sequential Use of Mushroom Body Neuron Subsets during Drosophila Odor Memory Processing. Neuron, Volume 53, Issue 1, 4 January 2007, Pages 103-115
- [34] Mershin, A., and Nanopoulos D. V. Memory Depends on the Cytoskeleton, but is it Quantum?, Quantum Aspects of Life. Edited by ABBOTT DEREK ET AL. Published by World Scientific Publishing Co. Pte. Ltd., 2008. ISBN 9781848162556, pp. 109-125
- [35] Lesar, A., Tahir, J., Wolk, J., and Gershow, M. Switch-like and persistent memory formation in individual Drosophila larvae. eLife. 2021; 10: e70317. Published online 2021 Oct 12. doi: 10.7554/eLife.70317
- [36] Gallistel, C. R., Fairhurst, S., Balsam, P. The learning curve: implications of a quantitative analysis. Proc Natl Acad Sci U S A . 2004 Sep 7;101(36):13124-31. doi: 10.1073/pnas.0404965101. Epub 2004 Aug 26.
- [37] Hippel, A. R. von. 1970. Do we really understand ferroelectricity? Proceedings, Second Int. Meeting on Ferroelectricity 1969. J. Phys. Soc. Japan 28 (supl), 1.
- [38] Leuchtag, H. R. 1987. Indications of the Existence of Ferroelectric Units in Excitable-membrane Channels. JJ. theor. Biol. 127: 321-340.
- [39] Leuchtag, H. R. 1995. Fit of the dielectric anomaly of squid axon membrane near heat-block temperature to the ferroelectric Curie-Weiss law. Biophysical Chemistry. 53: 197-205.
- [40] Palti, Y. and W. J. Adelman Jr.. (1969). Measurements of Axonal Membrane Conductances and Capacity by Means of a Varying Potential Control Voltage Clamp. J. Membr. Biol. 1: 431-458.
- [41] Landau L. D. and Lifshitz E. M., Statistical Physics, Third Edition, Pergamon Press, 1980. pg. 445.
- [42] Tasaki I., Rapid structural changes in nerve fibers and cells associated with their excitation processes Jpn. J. Physiol., 49 (1999), pp. 125-138
- [43] Hodgkin, A. L., 1975. The optimum density of sodium channels in an unmyelinated nerve. Philos. Trans. R. Soc. Lon. B. 270: 297-300.
- [44] Adrian, R. H., 1975. Conduction velocity and gating current in the squid giant axon. Proc. R. Soc. Lon. B. 189: 81-86.
Appendix D Supplemental Material - Additional Graphs