Anomalous Composition-Induced Crossover in the Magnetic Properties of the Itinerant-Electron Antiferromagnet Ca1-xSrxCo2-yAs2
Abstract
The inference of Ying et al. [EPL 104, 67005 (2013)] of a composition-induced change from -axis ordered-moment alignment in a collinear A-type AFM structure (AFMI) at small to -plane alignment in an unknown AFM structure (AFMII) at larger in Ca1-xSrxCo2-yAs2 with the body-centered tetragonal structure is confirmed. Our major finding is an anomalous magnetic behavior in the crossover region between these two phases. In this region the magnetic susceptibility versus temperature measured with magnetic fields H applied in the plane exhibit typical AFM behaviors with cusps at the Néel temperatures of K, whereas and the low-temperature isothermal magnetization with H aligned along the axis exhibit extremely soft ferromagnetic-like behaviors.
Much research since 2008 has focused on studies of iron-based layered pnictides and chalcogenides due to their unique lattice, electronic, magnetic and superconducting properties Johnston2010 ; Stewart2011 ; Dagotto2013 ; Fernandes2014 ; Dai2015 ; Si2016 . An important family of these materials is comprised of doped and undoped body-centered tetragonal parent compounds ( = Ca, Sr, Ba, Eu) with the -type structure (122-type compounds). The undoped and underdoped compounds exhibit a tetragonal to orthorhombic distortion of the crystal structure at K. They also exhibit itinerant collinear antiferromagnetic (AFM) spin-density-wave ordering at a temperature the same or slightly lower than . The ordered moments in the stripe AFM structure of the orthorhombic phase are oriented in the plane. In 2014 a temperature -induced AFM spin-reorientation transition to a new AFM phase was discovered in the hole-underdoped Ba1-xNa system upon cooling below that can coexist with superconductivity Avci2014 . A subsequent investigation by polarized and unpolarized neutron diffraction determined that the ordered moments in the new phase are aligned along the axis instead of along the plane as in the stripe AFM structure Wasser2015 . The work on the Ba1-xNa system was followed by the observation of the same AFM phase in the Ba1-xK Bohmer2015 ; Mallett2015a ; Mallett 2015b , Sr1-xNa Allred2016 ; Taddei2016 , and Ca1-xNa Taddei2017 systems. These results are important to understanding the mechanism of superconductivity and other aspects of the hole-doped iron arsenides Kang2015 ; Gastiasoro2015 ; Christensen2015 ; Fernandes2016 ; Hoyer2016 ; Scherer2016 ; Christensen2016 .
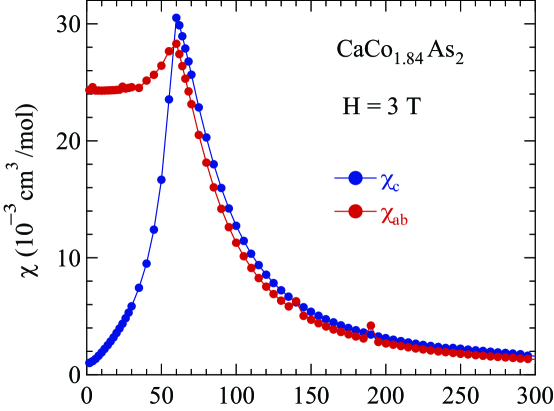
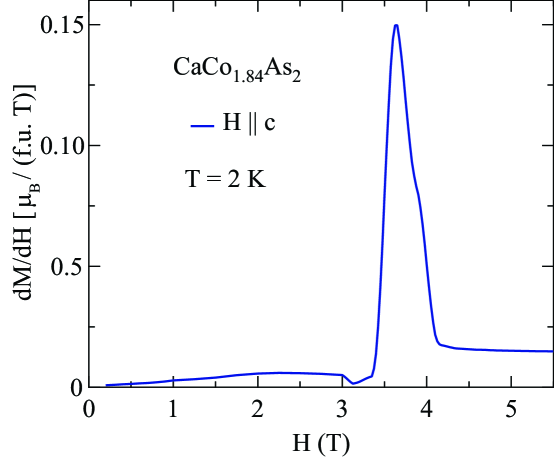
A similar but composition-induced moment realignment was suggested to occur in the isostructural CoAs-based system Ca1-xSrxCo2-yAs2 Ying2013 . CaCo2-yAs2 has a so-called collapsed-tetragonal (cT) structure with As–As bonding along the axis between adjacent CoAs layers Anand2012 and has % vacancies on the Co sites Quirinale2013 ; Anand2014 . It exhibits itinerant A-type AFM ordering below –77 K, depending on the sample, with the ordered moments of –0.4/Co ( is the Bohr magneton) within an -plane Co layer aligned ferromagnetically (FM) along the axis and with AFM alignments between moments in adjacent Co planes Quirinale2013 ; Anand2014 ; Ying2012 ; Cheng2012 ; Jayasekara2017 . The dominant interactions are found to be FM from the positive Weiss temperature obtained by fitting the magnetic susceptility versus measurements above by the Curie-Weiss law Ying2012 ; Cheng2012 ; Anand2014 , indicating that interplane AFM interactions responsible for the A-type AFM ordering are much weaker than the intraplane FM ones. Electronic structure calculations are consistent with the itinerant A-type AFM ground state and the small ordered moment Korotin2015 . Spin-flop transitions in single crystals of CaCo2-yAs2 with the magnetic field applied parallel to the axis occur at –3.7 T Ying2012 ; Anand2014 ; Cheng2012b ; Zhang2015 . On the other hand, metallic exhibits no magnetic transitions versus Pandey2013 . However, single-crystal data for both -axis and -plane magnetic field alignments show broad maxima at K, suggesting the presence of dynamic AFM correlations. Indeed, inelastic neutron scattering measurements on single crystals revealed strong AFM correlations with the same stripe wave vector as seen in the parent and doped Fe-based compounds Jayasekara2013 .
In view of the A-type AFM of CaCo2-yAs2 where strong FM correlations dominate and the contrasting strong AFM correlations in paramagnetic (PM) detected by neutron scattering, studies of the magnetic properties of Ca1-xSrxCo2-yAs2 crystals have the potential to reveal additional interesting physics. This system is metallic with the -type structure over the entire composition range Ying2013 . On the basis of magnetization versus magnetic field and electrical resistivity measurements on Ca1-xSrxCo2-yAs2 crystals, the authors of Ref. Ying2013 inferred A-type -axis AFM for (AFMI), a -axis FM phase for , -plane AFM ordering for (AFMII), and a PM phase for , with one crystal defining each of the FM and AFMII phase regions. A first-order transition from the cT to the uncollapsed-tetragonal (ucT) structure at was suggested from the variation in the -axis lattice parameter with , which the authors suggested was important to the evolution of the magnetic structure with Ying2013 .
Here we present a detailed study of the magnetic properties and phase diagram of the Ca1-xSrxCo2-yAs2 system that was carried out using ten single crystals with Sr compositions in the range . For crystals with in the intermediate crossover regime between the -axis and -plane AFM moment orientations of the AFMI and AFMII phases, respectively, we discovered that exhibits a cusp at the magnetic ordering temperature typical of an -plane AFM transition, whereas the response of and to a -axis field is extremely soft, suggesting instead a -axis FM structure in this region as proposed in Ref. Ying2013 . This divergence between the magnetic responses in the two field directions is highly anomalous. We also established that the moment realignment between the AFMI and AFMII phases results from a continuous composition-induced evolution of the magnetocrystalline anisotropy field from -axis to -plane orientations; and that the structural parameters versus , [defined as the cusp temperature in ], the low- saturation moment , and the effective moment in the PM state at all vary continously with for . Details about the crystal growth together with elemental analyses and single-crystal structure determinations are given in Ref. SupplMat . and data were obtained using a Quantum Design Magnetic Properties Measurement System and Physical Properties Measurement System, respectively.
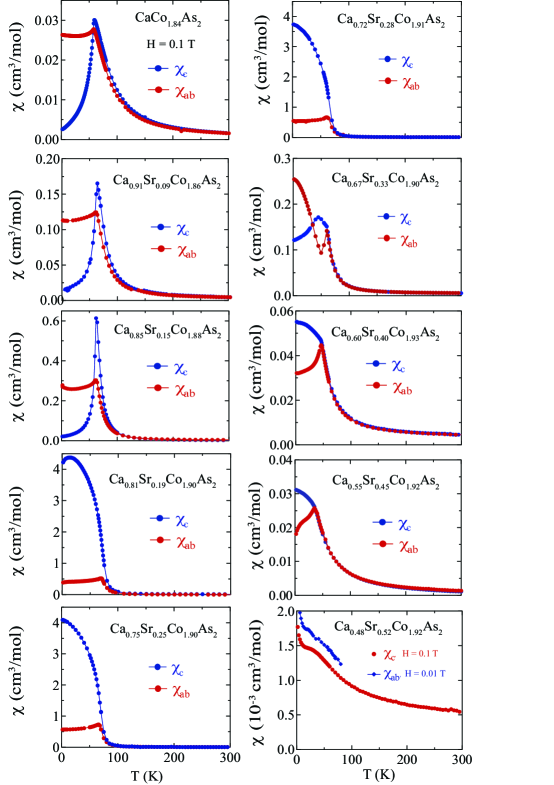
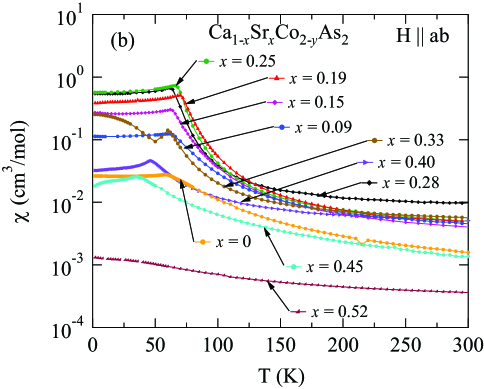
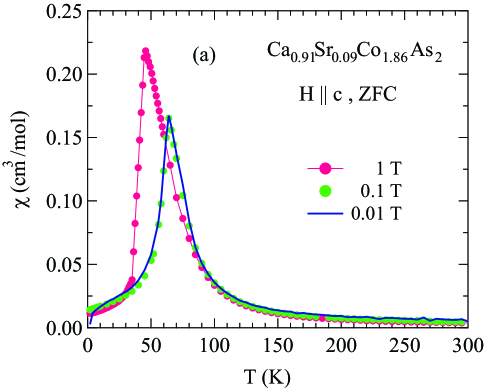
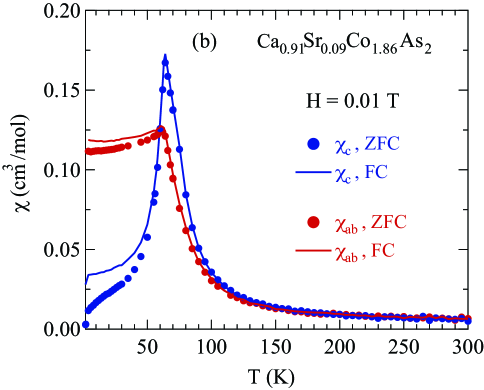
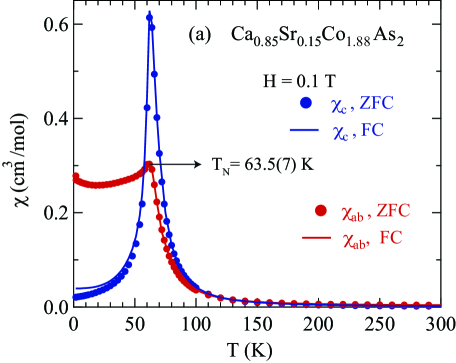
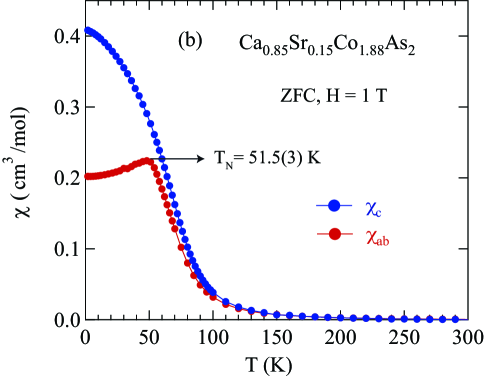
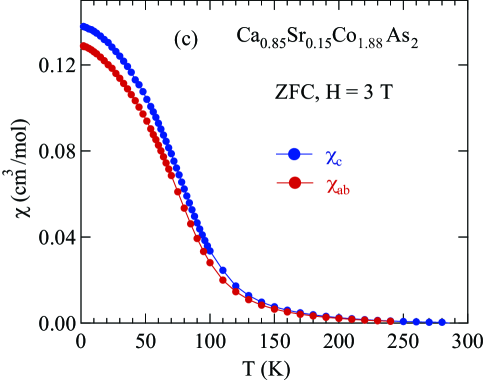
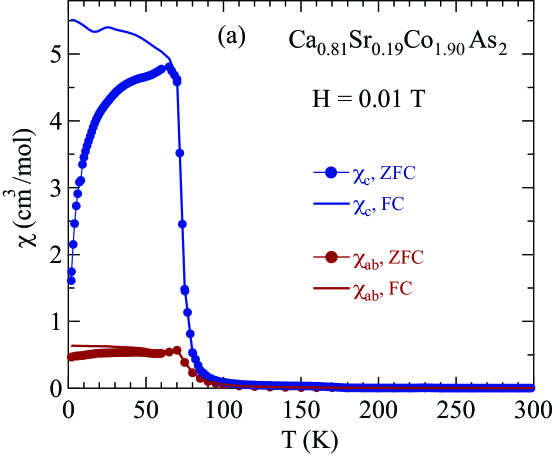
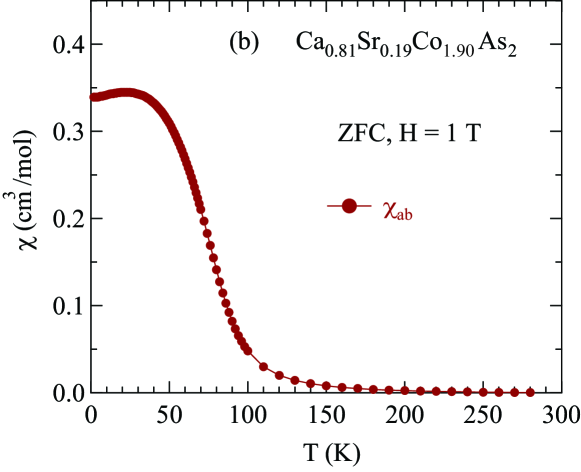
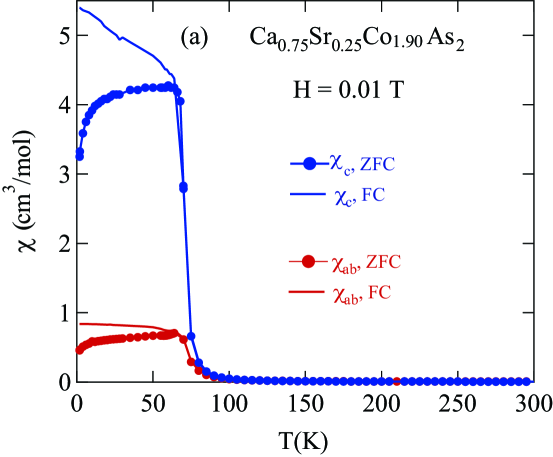
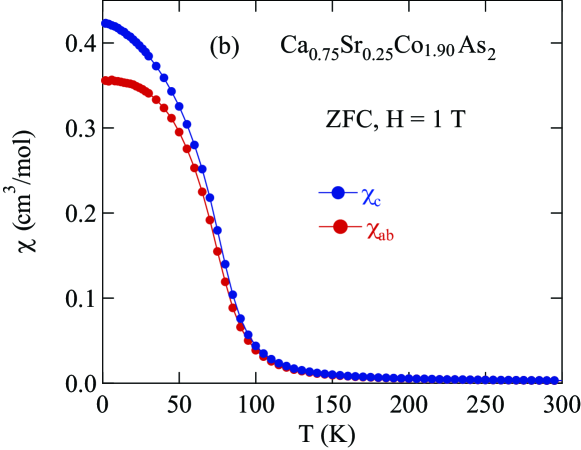
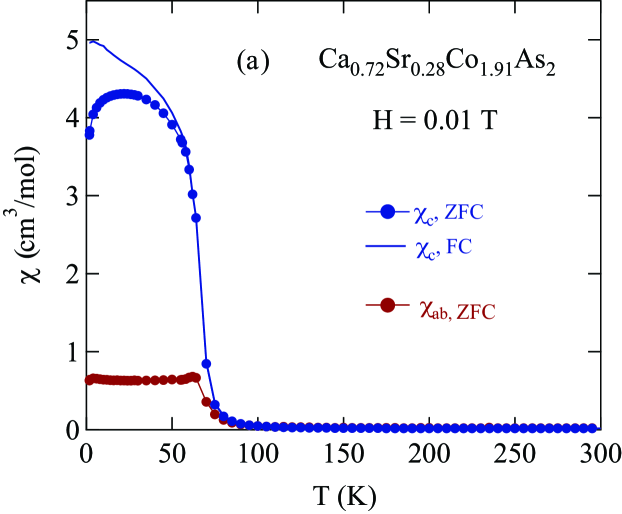
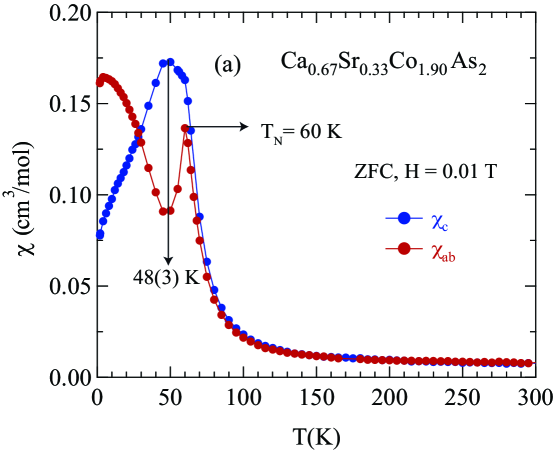
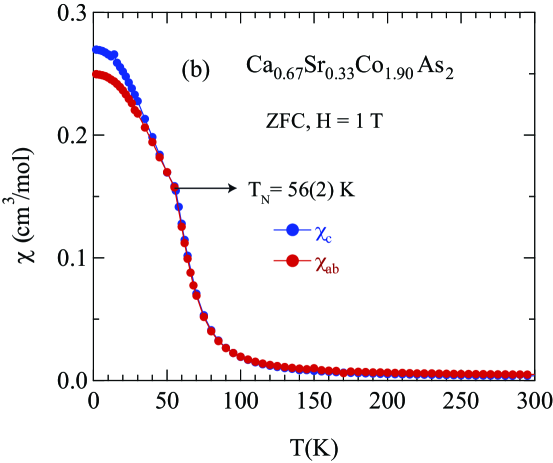
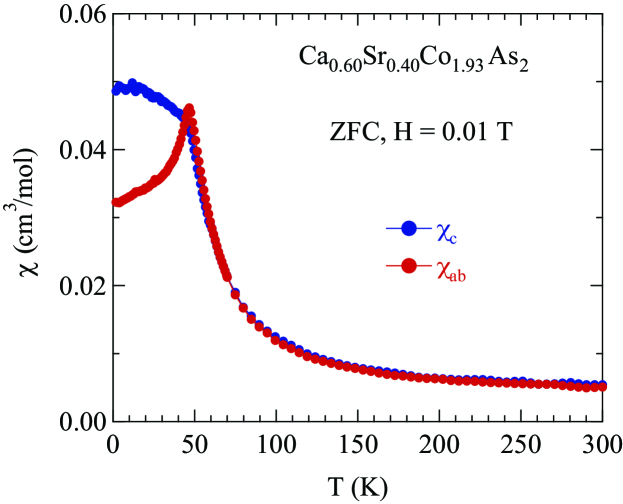
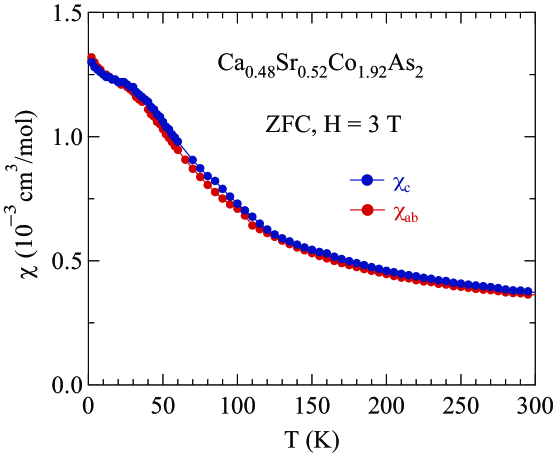
Shown in Fig. 1 are zero-field-cooled data in T applied both parallel and perpendicular to the axis for . For to 0.15 one sees that for K, suggesting A-type collinear -axis ordering as already established for . Here exhibits a cusp at and is approximately independent of below , as expected for an AFM transition. Even though is nearly independent of in this region, the magnetic system becomes very soft against -axis fields as reflected by the sharp peak in for that appears to be diverging with increasing . This is also reflected by the order of magnitude increase in the maximum from to in Fig. 1. For a -induced spin-reorientation transition appears to occur at about 50 K. This plot is similar to that for reported in Ref. Ying2013 . For and 0.45, the values at low decrease to small values, and the data suggest -plane AFM ordering. Finally, for , a PM behavior is observed. As a point of reference, the magnetic dipole interaction between local moments on a simple-tetragonal lattice with as in CaCo2-yAs2 predicts that the ordered moments should lie in the plane Johnston2016 .
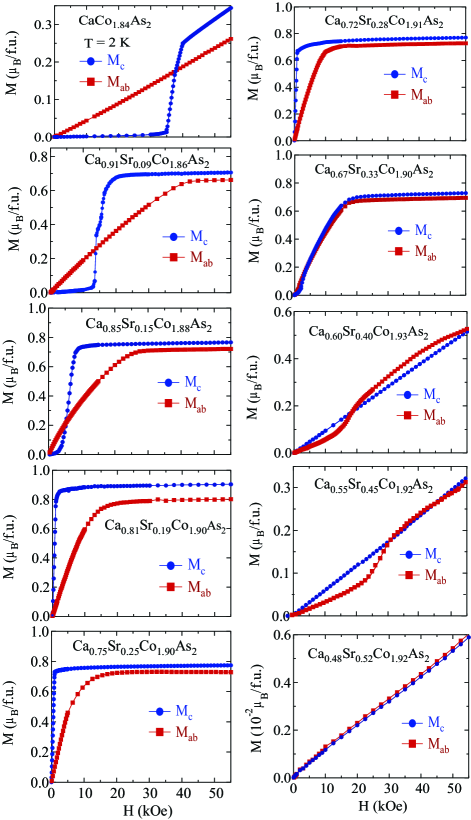
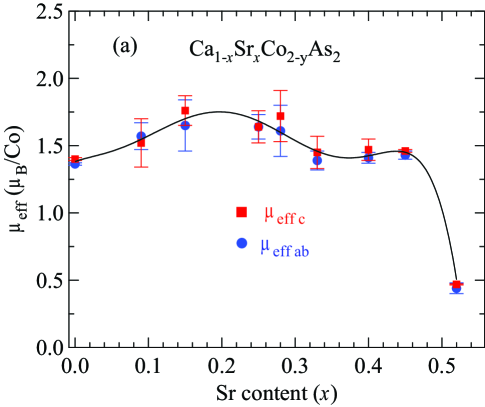
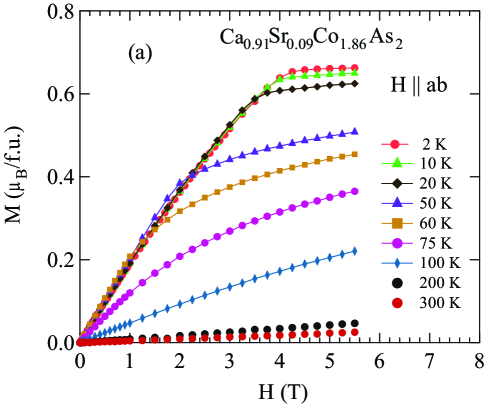
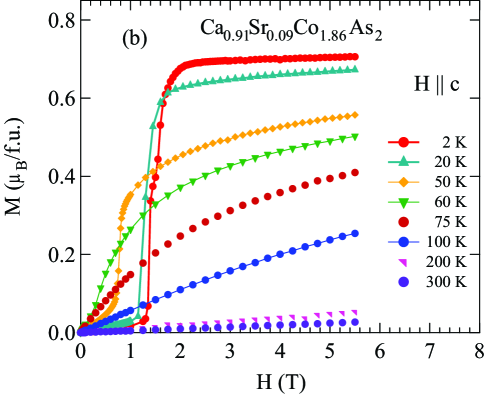
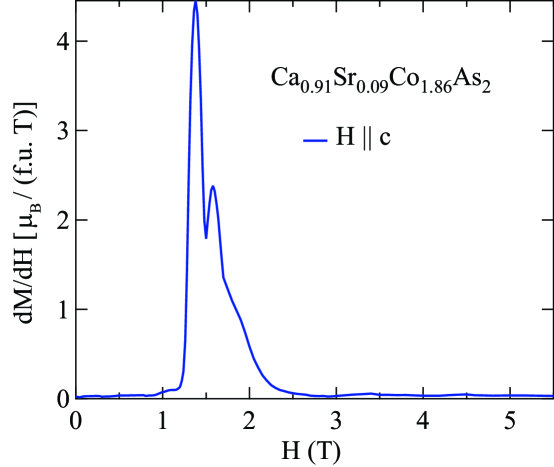
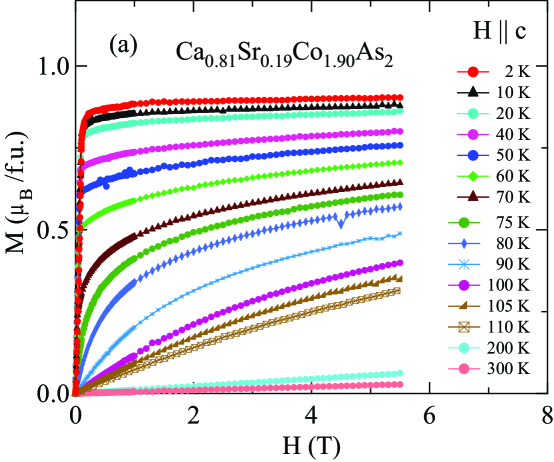
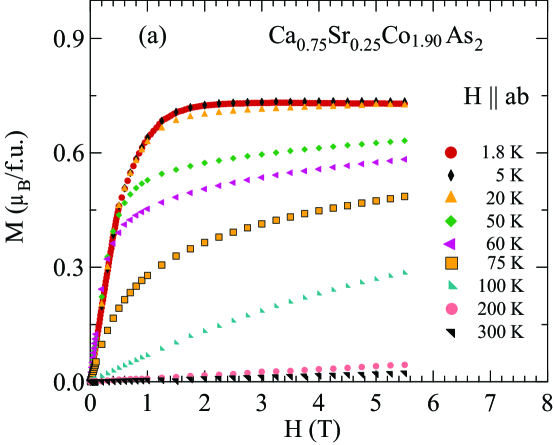
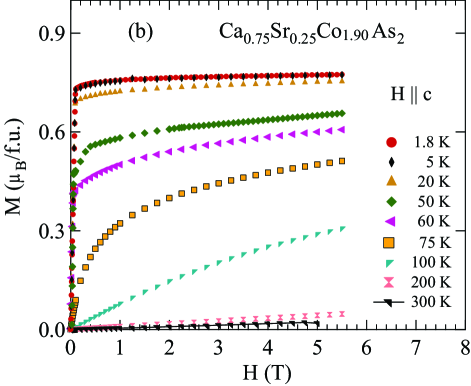
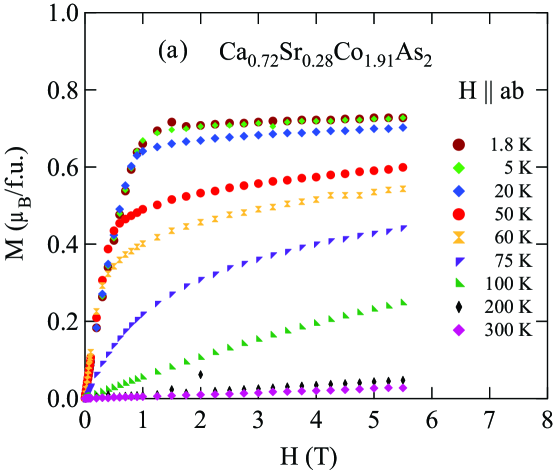
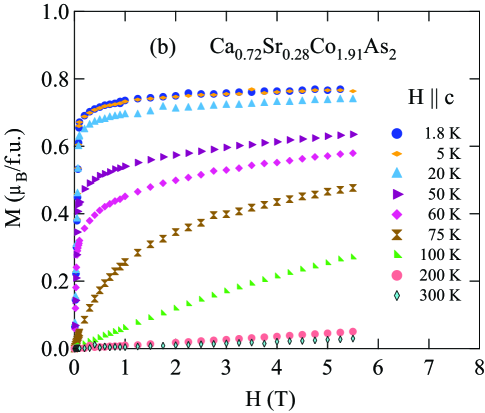
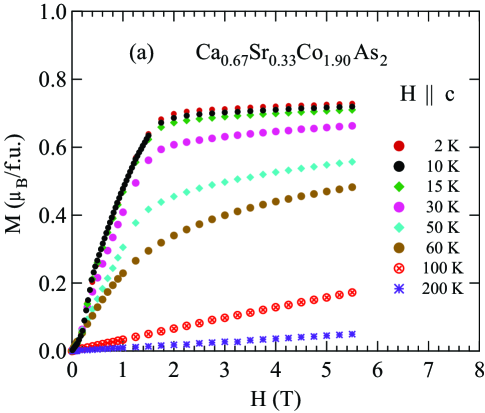
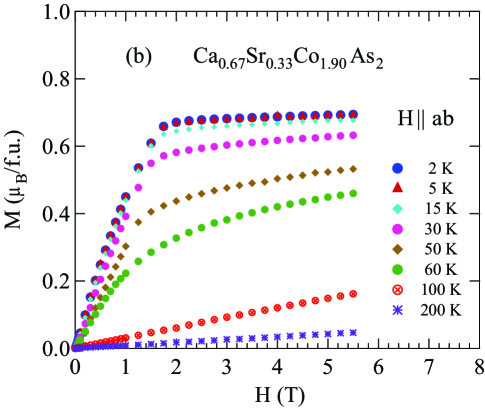
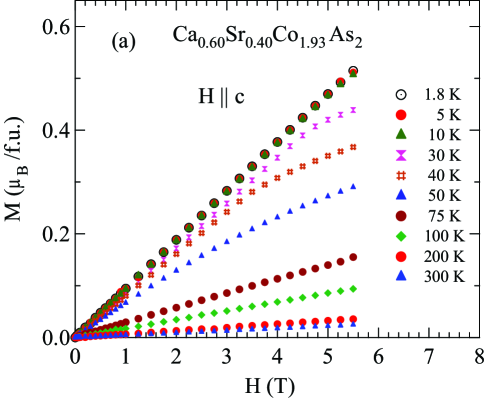
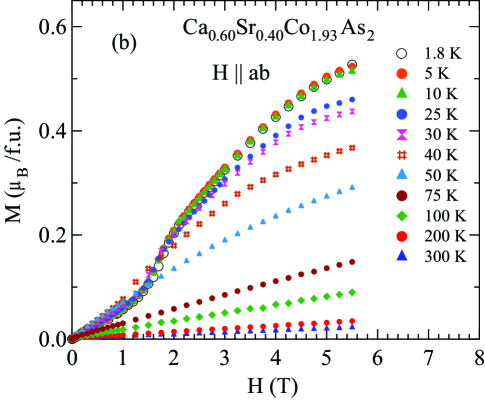
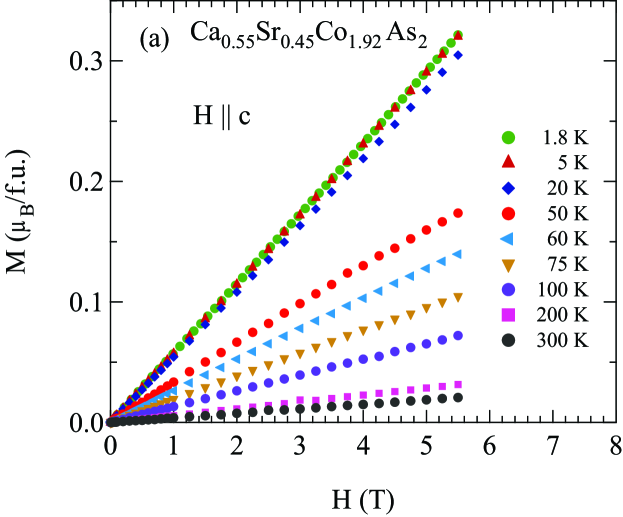
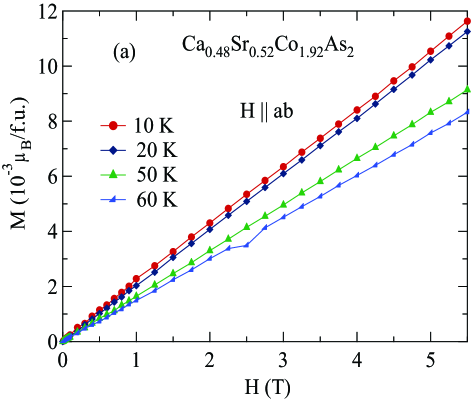
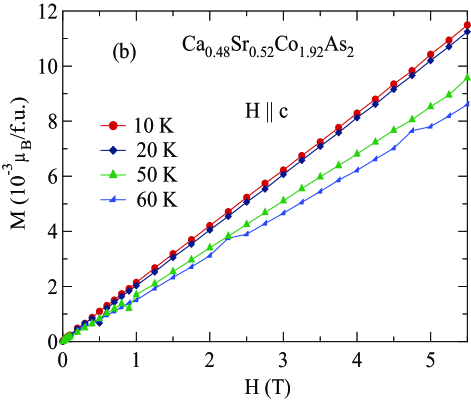
To clarify the origins of the behaviors in Fig. 1 and the magnetic ground state versus , we carried out isothermal measurements on the same set of ten crystals at K and the results are shown in Fig. 2. As expected for A-type -axis collinear AFM ordering for small Quirinale2013 , the crystals with , 0.09, and 0.15 show clear evidence for first-order field-induced spin-flop (SF) transitions for , where the SF fields decrease from T for to T for . The measured saturation moment values at high fields are in the narrow range of to /Co for . Additional magnetic data in Ref. SupplMat show that the effective moment per Co atom in the PM state is also nearly independent of for .
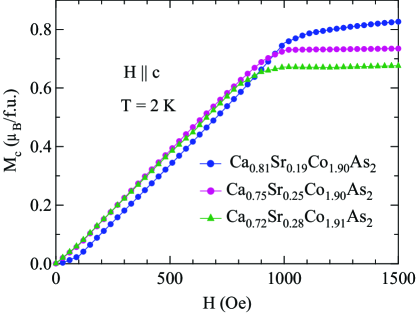
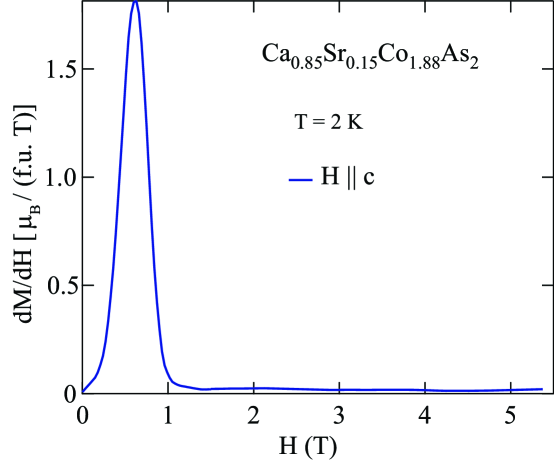
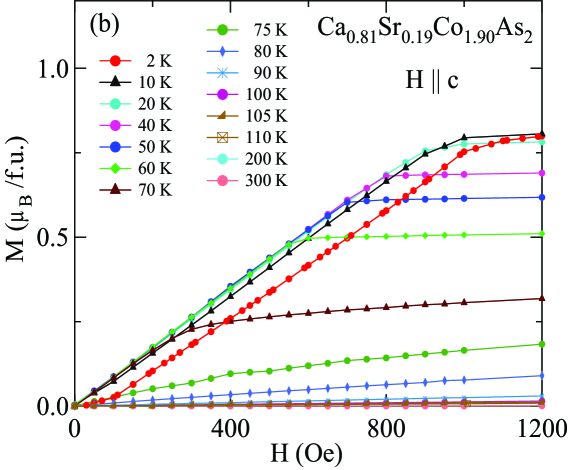
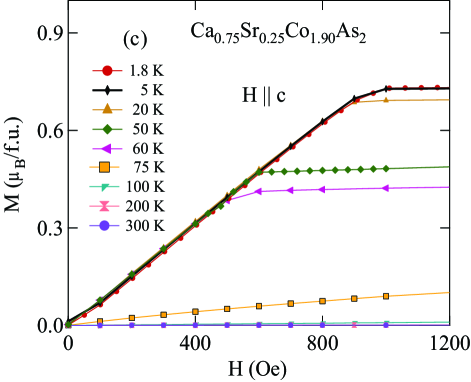
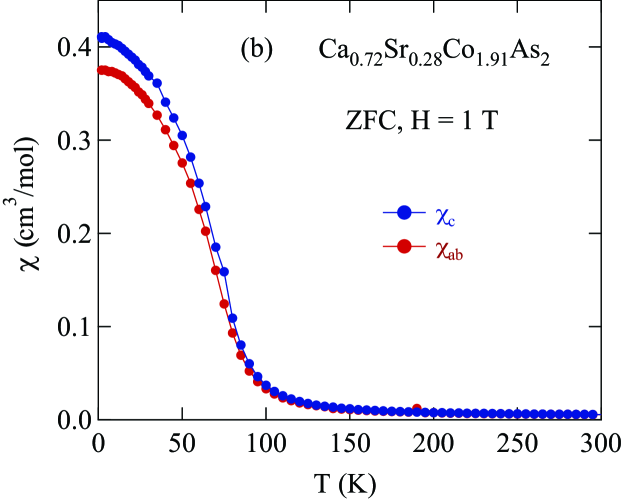
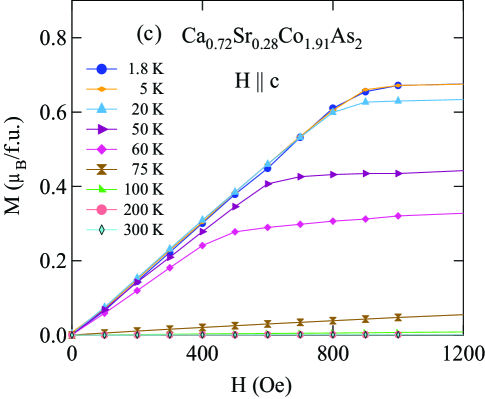
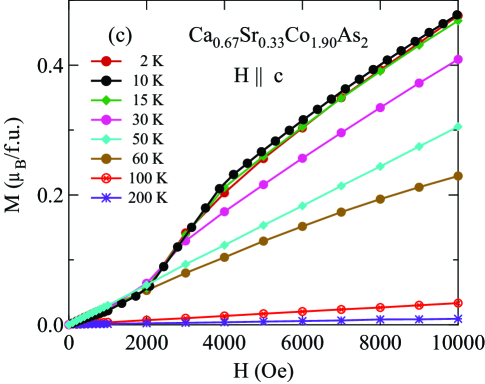
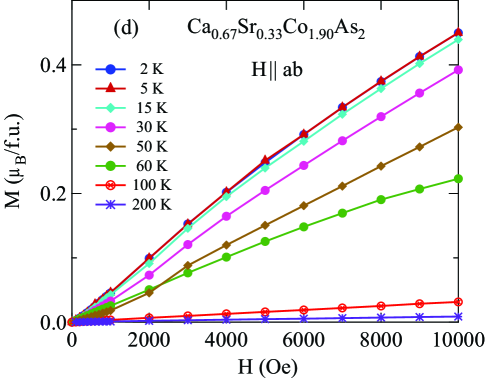
Figure 2 indicates that at 2 K, for , 0.25 and 0.28, where from Fig. 1 and Ref. SupplMat decreases continuously from 71 to 63 K over this composition range. At the same time, the slope of at low fields for these compositions remains high. To examine this low-field dependence in more detail, expanded plots of for Oe are shown in Fig. 3. For a weak SF transition is detected at Oe. One also sees in Fig. 3 that the rapid increase in with at low fields for in Fig. 2 is linear in with nearly the same slope for the three compositions. This effect is expected if the slope is limited by demagnetization effects. The dimensionless volume susceptibility of the data in Fig. 3 up to Oe for all three compositions is . This value is about the same as the value expected if in the absence of demagnetization effects is so large that the observed value is limited by the demagnetization factor Johnston2016 . Hence the magnetic response along the axis is extremely soft for , 0.25 and 0.28, which may be expected if these compositions are in a crossover region in the magnetocrystalline anisotropy field from being parallel to perpendicular to the axis. The rapid growth with increasing of the sharp peak in for and 0.15 in Fig. 1 is an additional indication of the growth of strong FM fluctuations.
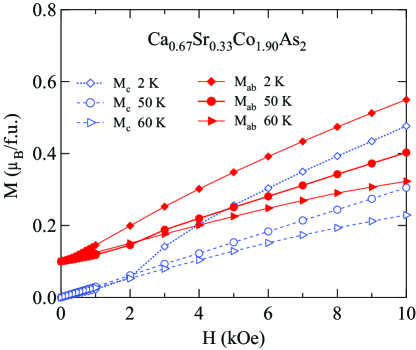
The crystal with Sr composition is unique among the ten Ca1-xSrxCo2-yAs2 crystals, because it exhibits a -induced spin-reorientiation transition as revealed by the data for this composition in Fig 1. On cooling below its K, the anisotropy indicates that the ordered moments are oriented within the plane. But then on further cooling to the range to 50 K, the ordered moment direction switches from the plane to the axis and remains so down to 2 K. This spin-reorientation transition is confirmed by the anisotropy of the magnetization isotherms in Fig. 4, which show a weak metamagnetic transition at about 2.5 kOe at 50 K for H aligned in the plane, and instead a spin-flop transition at kOe at 2 K for H aligned along the axis.
The behavior for in Ref. Ying2013 is about the same as we see for , 0.25 and 0.28 in Fig. 2, which those authors interpreted as a -axis FM region of the phase diagram. However, the behaviors in Fig. 1 for , 0.25 and 0.28 instead suggest that the magnetic structure is AFM in this region. The magnetic behaviors of with a different crystal structure Rosa2015 are similar to our data for Ca1-xSrxCo2-yAs2 in the crossover regime with to 0.3, but no discussion or interpretation of the data were given.
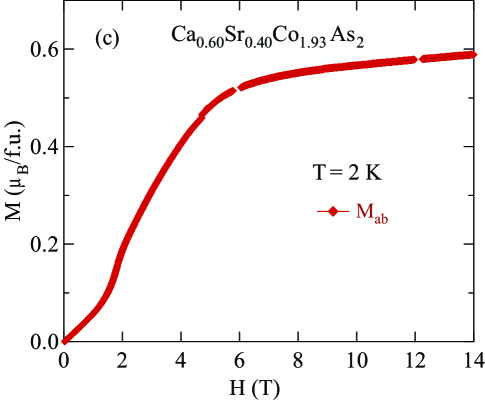
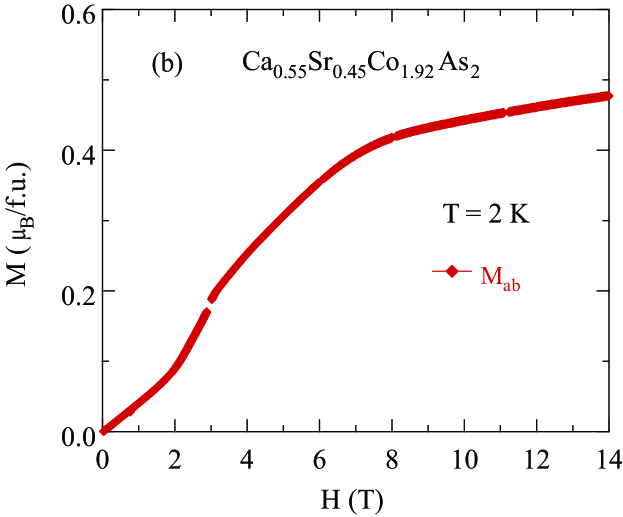
At larger values of 0.40 and 0.45, metamagnetic transitions occur at 2 K with applied in the plane instead of along the axis which indicates -plane AFM ordering (AFMII) as suggested for in Ref. Ying2013 . We interpret this as resulting from a crossover in the anisotropy field from being parallel to the axis for to perpendicular to the axis for . If this ordering is collinear, one expects AFM domains to occur in the plane with orthogonal easy axes, corresponding to an extrinsic noncollinear AFM structure. The data for and 0.45 in Fig. 1, which remain relatively large with respect to at , suggest that the AFM structure in this range is either extrinsically or intrinsically noncollinear Johnston2012 ; Johnston2015 ; Sangeetha2016 . In either case, the high-field behavior is not straightforward to interpret. Therefore we denote the metamagnetic transition field for and 0.45 as instead of . One sees from Fig. 2 that increases from T for to T for before becoming irrelevant in the PM state for .
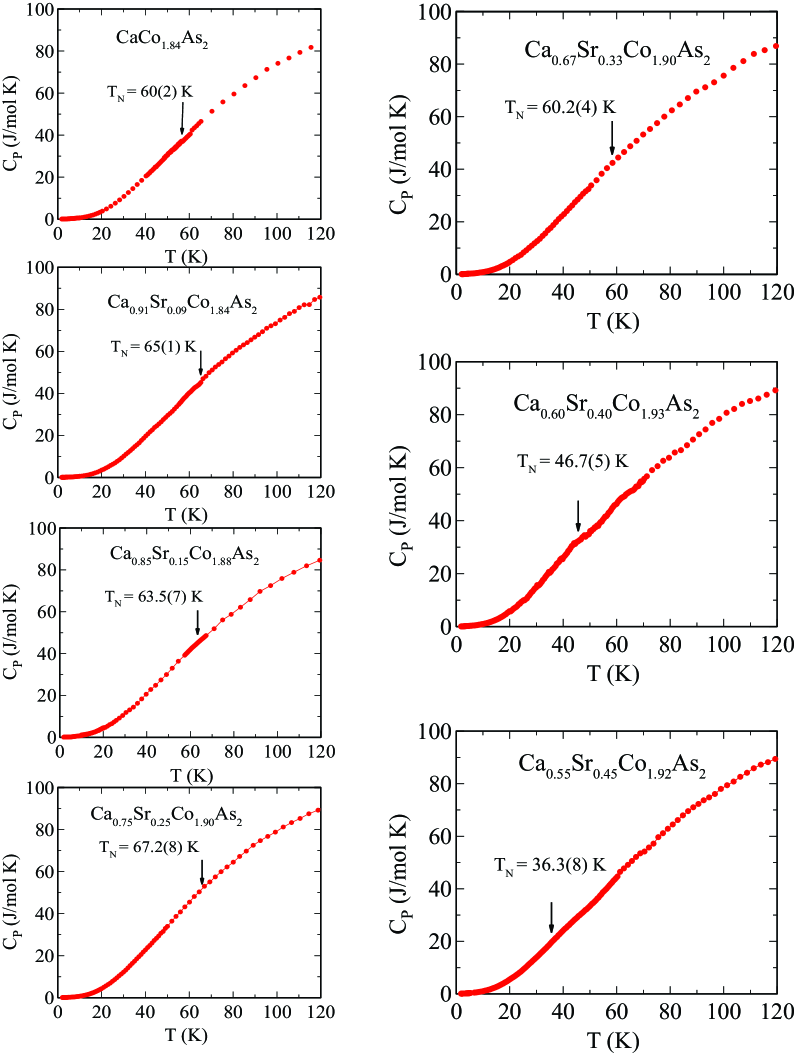
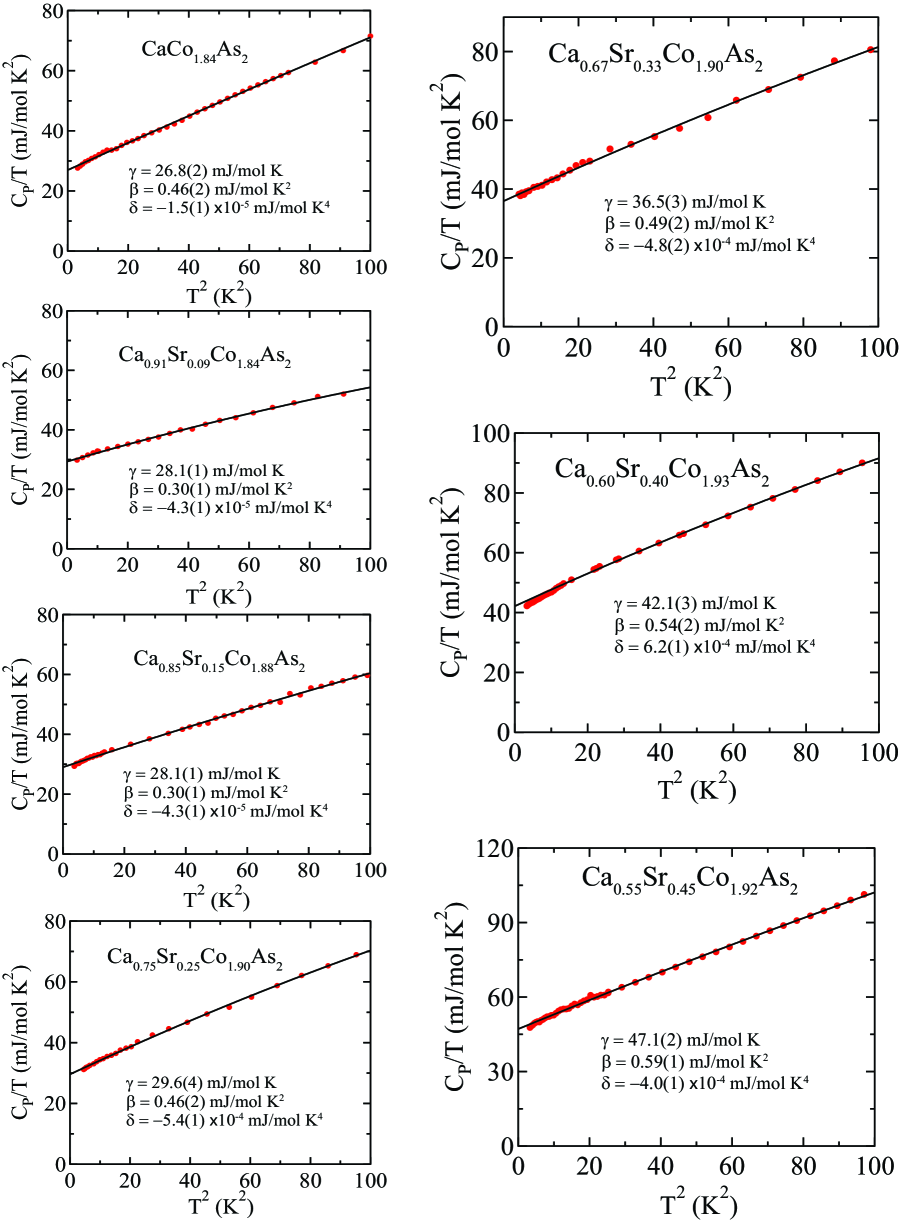
We have also carried out measurements on the Ca1-xSrxCo2-yAs2 crystals in SupplMat . As in the measurements for in Ref. Anand2014 , we see no distinct anomalies in at for any of the Ca1-xSrxCo2-yAs2 crystals. The low- data indicate substantial Sommerfeld coefficients , suggesting enhanced densities of states at the Fermi energy.
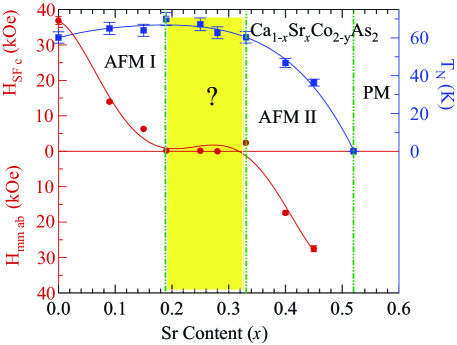
The ground-state magnetic phase diagram of the Ca1-xSrxCo2-yAs2 system derived from the measurements at K of and versus is shown in Fig. 5, where is also plotted. The AFMI phase for is an A-type AFM with -axis moment alignment. The AFM structure in the anisotropy crossover region is unknown. Then an AFMII phase with unknown AFM structure with the ordered moments aligned in the plane occurs for and 0.45, followed by a PM region for . From the data for and 0.45 in Fig. 1 we infer that the AFMII structure is intrinsically noncollinear or else extrinsically noncollinear due to multiple AFM domains aligned in the plane. Since , and over the region do not change appreciably SupplMat , one might infer that a continuous tilting of the ordered moment from -axis to -plane orientation occurs over this region. However, this seems unlikely since the magnetic data for this region do not provide clear evidence for it and the magnetism is itinerant.
In summary, the magnetic and thermal properties of Ca1-xSrxCo2-yAs2 single crystals with were studied and the magnetic phase diagram at K was constructed. We confirm a collinear -axis AFM phase at small and an -plane AFM phase at large and 0.45 Ying2013 . Our major result is the observation of AFM-like transitions from coexisting with strong FM-like -axis correlations from and data in the crossover region between these two phases, an anomalous dichotomy. We also find continuous evolutions with from to 0.52 of the crystal structure, of the anisotropy field at K which results in the composition-induced ordered-moment reorientation between the -axis AFMI and -plane AFMII phases, and of the ordered and effective moments SupplMat . An important feature of this system is that it is isoelectronic and isostructural over the entire composition range , which may simplify theoretical analyses. The itinerant-electron AFM Ca1-xSrxCo2-yAs2 system provides fertile ground for additional experimental and theoretical investigations that may also shed light on the origin of the temperature-induced ordered-moment realignments of the AFM phases in the hole-underdoped 122-type FeAs-based high- superconductors.
Acknowledgements.
We thank Vivek Anand for his contributions to the early stages of this work. Helpful discussions with Andreas Kreyssig, Robert McQueeney, and Makariy Tanatar are gratefully acknowledged. This research was supported by the U.S. Department of Energy, Office of Basic Energy Sciences, Division of Materials Sciences and Engineering. Ames Laboratory is operated for the U.S. Department of Energy by Iowa State University under Contract No. DE-AC02-07CH11358.References
- (1) D. C. Johnston, The puzzle of high temperature superconductivity in layered iron pnictides and chalcogenides, Adv. Phys. 59, 803 (2010).
- (2) G. R. Stewart, Superconductivity in iron compounds, Rev. Mod. Phys. 83, 1589 (2011).
- (3) E. Dagotto, The unexpected properties of alkali metal iron selenide superconductors, Rev. Mod. Phys. 85, 849 (1913).
- (4) R. M. Fernandes, A. V. Chubukov, and J. Schmalian, What drives nematic order in iron-based superconductors? Nat. Phys. 10, 97 (2014).
- (5) P. Dai, Antiferromagnetic order and spin dynamics in iron-based superconductors, Rev. Mod. Phys. 87, 855 (2015).
- (6) Q. Si, R. Yu, and E. Abrahams, High-temperature superconductivity in iron pnictides and chalcogenides, Nat. Rev. Mater. 1, 1 (2016).
- (7) S. Avci, O. Chmaissem, J. M. Allred, S. Rosenkranz, I. Eremin, A. V. Chubukov, D. E. Bugaris, D. Y. Chung, M. G. Kanatzidis, J.-P. Castellan, J. A. Schlueter, H. Claus, D. D. Khalyavin, P. Manuel, A. Daoud-Aladine, and R. Osborn, Magnetically driven suppression of nematic order in an iron-based superconductor, Nat. Commun. 4, 3845 (2014).
- (8) F. Waßer, A. Schneidewind, Y. Sidis, S. Wurmehl, S. Aswartham, B. Büchner, and M. Braden, Spin reorientation in studied by single-crystal neutron diffraction, Phys. Rev. B 91, 060505(R) (2015).
- (9) A.E. Böhmer, F. Hardy, L. Wang, T. Wolf, P. Schweiss, and C. Meingast, Superconductivity-induced re-entrance of the orthorhombic distortion in Ba1-xK, Nat. Commun. 6, 7911 (2015).
- (10) B. P. P. Mallett, Yu. G. Pashkevich, A. Gusev, Th. Wolf, and C. Bernhard, Muon spin rotation study of the magnetic structure in the tetragonal antiferromagnetic state of weakly underdoped Ba1-xK, EPL 111, 57001 (2015).
- (11) B. P. P. Mallett, P. Marsik, M. Yazdi-Rizi, Th. Wolf, A. E. Böhmer, F. Hardy, C. Meingast, D. Munzar, and C. Bernhard, Infrared Study of the Spin Reorientation Transition and Its Reversal in the Superconducting State in Underdoped Ba1-xK, Phys. Rev. Lett. 115, 027003 (2015).
- (12) J. M. Allred, K. M. Taddei, D. E. Bugaris, M. J. Krogstad, S. H. Lapidus, D. Y. Chung, H. Claus, M. G. Kanatzidis, D. E. Brown, J. Kang, R. M. Fernandes, I. Eremin, S. Rosenkranz, O. Chmaissem, and R. Osborn, Double-Q spin-density wave in iron arsenide superconductors, Nat. Phys. 12, 493 (2016).
- (13) K. M. Taddei, J. M. Allred, D. E. Bugaris, S. Lapidus, M. J. Krogstad, R. Stadel, H. Claus, D. Y. Chung, M. G. Kanatzidis, S. Rosenkranz, R. Osborn, and O. Chmaissem, Detailed magnetic and structural analysis mapping a robust magnetic dome in Sr1-xNa, Phys. Rev. B 93, 134510 (2016).
- (14) K. M. Taddei, J. M. Allred, D. E. Bugaris, S. H. Lapidus, M. J. Krogstad, H. Claus, D. Y. Chung, M. G. Kanatzidis, R. Osborn, S. Rosenkranz, and O. Chmaissem, Observation of the magnetic phase in Ca1-xNa and its universality in the hole-doped 122 superconductors, Phys. Rev. B 95, 064508 (2017).
- (15) J. Kang, X. Wang, A. V. Chubukov, and R. M. Fernandes, Interplay between tetragonal magnetic order, stripe magnetism, and superconductivity in iron-based materials, Phys. Rev. B 91, 121104(R) (2015).
- (16) M. N. Gastiasoro and B. M. Andersen, Competing magnetic double- phases and superconductivity-induced reentrance of magnetic stripe order in iron pnictides, Phys. Rev. B 92, 140506(R) (2015).
- (17) M. H. Christensen, Jian Kang, B. M. Andersen, I. Eremin, and R. M. Fernandes, Spin reorientation driven by the interplay between spin-orbit coupling and Hund’s rule coupling in iron pnictides, Phys. Rev. B 92, 214509 (2015).
- (18) R. M. Fernandes, S. A. Kivelson, and E. Berg, Vestigial chiral and charge orders from bidirectional spin-density waves: Application to the iron-based superconductors, Phys. Rev. B 93, 014511 (2016).
- (19) M. Hoyer, R. M. Fernandes, A. Levchenko, and J. Schmalian, Disorder-promoted -symmetric magnetic order in iron-based superconductors, Phys. Rev. B 93, 144414 (2016).
- (20) D. D. Scherer, I. Eremin, and B. M. Andersen, Collective magnetic excitations of -symmetric magnetic states in iron-based superconductors, Phys. Rev. B 94, 180405(R) (2016).
- (21) M. H. Christensen, B. M. Andersen, and P. Kotetes, Unravelling incommensurate magnetism and the path to intrinsic topological superconductivity in iron-pnictides, arXiv:1612.07633 (unpublished).
- (22) J. J. Ying, J. C. Liang, X. G. Luo, Y. J. Yan, A. F. Wang, P. Cheng, G. J. Ye, J. Q. Ma, and X. H. Chen, The magnetic phase diagram of Ca1-xSrxCo2-yAs2 single crystals, EPL 104, 67005 (2013).
- (23) For a review of collapsed and uncollapsed tetragonal phases, see Sec. VII in V. K. Anand, P. Kanchana Perera, A. Pandey, R. J. Goetsch, A. Kreyssig, and D. C. Johnston, Crystal growth and physical properties of , , and , Phys. Rev. B 85, 214523 (2012).
- (24) D. G. Quirinale, V. K. Anand, M. G. Kim, A. Pandey, A. Huq, P. W. Stephens, T. W. Heitmann, A. Kreyssig, R. J. McQueeney, D. C. Johnston, and A. I. Goldman, Crystal and magnetic structure of studied by x-ray and neutron diffraction, Phys. Rev. B 88, 174420 (2013).
- (25) V. K. Anand, R. S. Dhaka, Y. Lee, B. N. Harmon, A. Kaminski, and D. C. Johnston, Physical properties of metallic antiferromagnetic single crystals, Phys. Rev. B 89, 214409 (2014).
- (26) J. J. Ying, Y. J. Yan, A. F. Wang, Z. J. Xiang, P. Cheng, G. J. Ye, and X. H. Chen, Metamagnetic transition in Ca1-xSrxCo2-yAs2 ( = 0 and 0.1) single crystals, Phys. Rev. B 85, 214414 (2012).
- (27) B. Cheng, B. F. Hu, R. Y. Chen, G. Xu, P. Zheng, J. L. Luo, and N. L. Wang, Electronic properties of transitional metal pnictides: A comparative study by optical spectroscopy, Phys. Rev. B 86, 134503 (2012).
- (28) W. T. Jayasekara, A. Pandey, A. Kreyssig, N. S. Sangeetha, A. Sapkota, K. Kothapalli, V. K. Anand, W. Tian, D. Vaknin, D. C. Johnston, R. J. McQueeney, A. I. Goldman, and B. G. Ueland, Suppression of magnetic order in with Fe substitution: Magnetization, neutron diffraction, and x-ray diffraction studies of Ca(Co1-xFeAs2, Phys. Rev. B 95, 064425 (2017).
- (29) M. A. Korotin, Z. V. Pchelkina, N. A. Skorikov, V. I. Anisimov, and A. O. Shorikov, Investigation of electronic structure and magnetic properties of within the CPA method, J. Phys.: Condens. Matter 27, 045502 (2015).
- (30) B. Cheng, B. F. Hu, R. H. Yuan, T. Dong, A. F. Fang, Z. G. Chen, G. Xu, Y. G. Shi, P. Zheng, J. L. Luo, and N. L. Wang, Field-induced spin-flop transitions in single-crystalline , Phys. Rev. B 85, 144426 (2012). The double spin-flop transitions seen in this work are likely due to inhomogeneity in the crystal studied.
- (31) W. Zhang, K. Nadeem, H. Xiao, R. Yang, B. Xu, H. Yang, and X. G. Qiu, Spin-flop transition and magnetic phase diagram in revealed by torque measurements, Phys. Rev. B 92, 144416 (2015).
- (32) A. Pandey, D. G. Quirinale, W. Jayasekara, A. Sapkota, M. G. Kim, R. S. Dhaka, Y. Lee, T. W. Heitmann, P. W. Stephens, V. Ogloblichev, A. Kreyssig, R. J. McQueeney, A. I. Goldman, A. Kaminski, B. N. Harmon, Y. Furukawa, and D. C. Johnston, Crystallographic, electronic, thermal, and magnetic properties of single-crystal , Phys. Rev. B 88, 014526 (2013).
- (33) W. Jayasekara, Y. Lee, A. Pandey, G. S. Tucker, A. Sapkota, J. Lamsal, S. Calder, D. L. Abernathy, J. L. Niedziela, B. N. Harmon, A. Kreyssig, D. Vaknin, D. C. Johnston, A. I. Goldman, and R. J. McQueeney, Stripe Antiferromagnetic Spin Fluctuations in , Phys. Rev. Lett. 111, 157001 (2013).
- (34) See Supplemental Material at http://link.aps.org/supplemental/xxxx for crystal growth details, chemical composition analyses, single-crystal structure determinations, heat capacity, magnetization and magnetic susceptibility data, and includes Refs. [40]–[44].
- (35) D. C. Johnston, Magnetic dipole interactions in crystals, Phys. Rev. B 93, 014421 (2016).
- (36) P. F. S. Rosa, T. M. Garitezi, Z. Fisk, and P. G. Pagliuso, magnetism in single crystals, J. Phys.: Conf. Ser. 592, 012053 (2015).
- (37) D. C. Johnston, Magnetic Susceptibility of Collinear and Noncollinear Heisenberg Antiferromagnets, Phys. Rev. Lett. 109, 077201 (2012).
- (38) D. C. Johnston, Unified molecular field theory for collinear and noncollinear Heisenberg antiferromagnets, Phys. Rev. B 91, 064427 (2015).
- (39) N. S. Sangeetha, E. Cuervo-Reyes, A. Pandey, and D. C. Johnston, : A model molecular-field helical Heisenberg antiferromagnet, Phys. Rev. B. 94, 014422 (2016).
- (40) APEX3, Bruker AXS Inc., Madison, Wisconsin, USA, 2015.
- (41) SAINT, Bruker AXS Inc., Madison, Wisconsin, USA, 2015.
- (42) L. Krause, R. Herbst-Irmer, G. M. Sheldrick, and D. Stalke, Comparison of silver and molybdenum microfocus X-ray sources for single-crystal structure determination, J. Appl. Crystallogr. 48, 3 (2015).
- (43) G. M. Sheldrick. SHELTX – Integrated space-group and crystal-structure determination. Acta Crystallogr. A 71, 3 (2015).
- (44) G. M. Sheldrick. Crystal structure refinement with SHELXL. Acta Crystallogr. C 71, 3 (2015).
*
Appendix A Supplemental Information
Single-Crystal Growth
Single crystals of Ca1-xSrxCo2-yAs2 with nominal compositions ( = 0, 0.1, 0.2, 0.3, 0.4, 0.5, 0.6 and 0.8) were grown using Sn flux. The starting materials were high-purity elemental Ca (99.98%), Co (99.998%), As (99.99999%) and Sn (99.999%) from Alfa Aesar, and Sr (99.95%) from Sigma-Aldrich. The sample and Sn flux taken in a 1:5 molar ratio were placed in an alumina crucible that was sealed under 1/4 atm high purity argon in a silica tube. The sealed samples were preheated at 600 ∘C for 5 h, and then heated to 1150 ∘C at the rate of 50 ∘C/h and held there for 20 h for homogenization. Then the furnace was slowly cooled at the rate of 2.5 ∘C/h to 700 ∘C. The single crystals were separated by decanting the molten Sn flux with a centrifuge at that temperature. Large (46 mm size) shiny platelike single crystals were obtained from each growth. Energy-dispersive x-ray spectoscopy (EDS) was used to determine the compositions of the crystals. We selected several crystals from each batch and performed EDS measurments on both sides of each crystal. We observed a significant inhomogeneity in each crystal except for CaCo1.84As2. Hence, we cleaved each crystal and performed EDS mesurements on both sides of each cleaved crystal until we obtained homogeneous crystals. The result was that the crystals studied in the main text are small platelike crystals with masses of order only a few mg. Measurements such as neutron diffraction requiring much larger samples were therefore not possible. The Sr content and Co content in the homogeneous Ca1-xSrxCo2-yAs2 crystals were determined by EDS and single-crystal x-ray structural analysis below assuming the As site was fully occupied. The results of the composition analyses are given in Table 1 below. The same crystals were used to perform the physical property measurements reported in the main text and in the sections below.
Energy-Dispersive X-ray Spectroscopy and Single-Crystal Structure Determinations
Chemical analysis of the Ca1-xSrxCo2-yAs2 crystals was performed using a JEOL scanning electron microscope (SEM), equipped with an energy dispersive x-ray spectroscopy (EDS) analyzer. The compositions of each side of a platelike crystal were measured at about ten positions on each face, and the results averaged. If the compositions on the two sides were significantly different, the crystal was cleaved and the measurements repeated until the compositions on both sides were the same.
Single-crystal X-ray diffraction (XRD) measurements were performed at room temperature on a Bruker D8 Venture diffractometer operating at 50 kV and 1 mA equipped with a Photon 100 CMOS detector, a flat graphite monochromator and a Mo K IS microfocus source ( Å). The raw frame data were collected using the Bruker APEX3 program [40], while the frames were integrated with the Bruker SAINT software package [41] using a narrow-frame algorithm integration of the data and were corrected for absorption effects using the multiscan method (SADABS) [42]. The occupancies of the CaSr and Co atomic sites were refined assuming random occupancy of the CaSr sites and are presented below assuming complete occupancy of the As site. The atomic thermal factors were refined anisotropically. Initial models of the crystal structures were first obtained with the program SHELXT-2014 [43] and refined using the program SHELXL-2014 [44] within the APEX3 software package.
The chemical compositions obtained from the EDS and XRD analyses for our crystals with are listed in Table 1, and the crystal data are given in Table 2. In the latter table the compositions listed in the first column are duplicated from Table 1, together with additional such data for and 0.87 for which we did not carry out physical property measurements. The crystal data for were obtained from Ref. [32].
| Atomic Ratio from XRD | Atomic Ratio from EDS | Composition | ||||
|---|---|---|---|---|---|---|
| Ca | Sr | Co | Ca | Sr | Co | |
| 1 | 0 | 1.82(2) | 1 | 0 | 1.86(2) | CaCo1.84(3)As2 |
| 0.92(2) | 0.08(2) | 1.84(2) | 0.90(1) | 0.10(1) | 1.88(2) | Ca0.91(2)Sr0.09(2)Co1.86(3)As2 |
| 0.83(2) | 0.17(2) | 1.89(2) | 0.86(1) | 0.14(1) | 1.87(3) | Ca0.85(3)Sr0.15(2)Co1.88(4)As2 |
| 0.81(1) | 0.19(1) | 1.90(1) | 0.81(1) | 0.19(1) | 1.90(2) | Ca0.81(1)Sr0.19(1)Co1.90(2)As2 |
| 0.76(2) | 0.24(2) | 1.92(2) | 0.75(1) | 0.25(1) | 1.89(5) | Ca0.75(2)Sr0.25(2)Co1.90(5)As2 |
| 0.71(1) | 0.29(1) | 1.92(1) | 0.73(1) | 0.27(1) | 1.91(2) | Ca0.72(1)Sr0.28(1)Co1.91(2)As2 |
| 0.68(1) | 0.32(1) | 1.90(1) | 0.66(1) | 0.34(1) | 1.91(2) | Ca0.67(1)Sr0.33(1)Co1.90(2)As2 |
| 0.62(1) | 0.38(1) | 1.93(1) | 0.58(1) | 0.42(1) | 1.92(3) | Ca0.60(2)Sr0.40(2)Co1.93(3)As2 |
| 0.55(2) | 0.45(2) | 1.92(2) | 0.56(3) | 0.44(3) | 1.92(1) | Ca0.55(4)Sr0.45(4)Co1.92(2)As2 |
| 0.48(1) | 0.52(1) | 1.91(2) | 0.48(1) | 0.52(2) | 1.92(2) | Ca0.48(1)Sr0.52(2)Co1.92(3)As2 |
| Compound | (Å) | (Å) | (Å3) | ||
|---|---|---|---|---|---|
| CaCo1.84(3)As2 | 0.3669(1) | 3.9900(7) | 10.2972(19) | 163.93(6) | 2.5807(5) |
| Ca0.91(2)Sr0.09(2)Co1.86(3)As2 | 0.3660(3) | 3.9937(8) | 10.372(2) | 165.43(8) | 2.597(1) |
| Ca0.85(3)Sr0.15(2)Co1.88(4)As2 | 0.3650(2) | 3.9889(2) | 10.4770(7) | 166.70(2) | 2.6265(3) |
| Ca0.81(1)Sr0.19(1)Co1.90(2)As2 | 0.3649(1) | 3.9874(3) | 10.5363(8) | 167.52(3) | 2.6424(4) |
| Ca0.75(2)Sr0.25(2)Co1.90(5)As2 | 0.3642(3) | 3.9852(5) | 10.6406(11) | 168.99(4) | 2.6700(3) |
| Ca0.72(1)Sr0.28(1)Co1.91(2)As2 | 0.3638(2) | 3.980(5) | 10.696(14) | 169.4(4) | 2.687(3) |
| Ca0.67(1)Sr0.33(1)Co1.90(2)As2 | 0.3636(2) | 3.9730(4) | 10.8113(14) | 170.65(4) | 2.7211(1) |
| Ca0.60(2)Sr0.40(2)Co1.93(3)As2 | 0.3628(1) | 3.9721(8) | 10.920(4) | 172.3(1) | 2.749(1) |
| Ca0.55(4)Sr0.45(4)Co1.92(2)As2 | 0.3621(2) | 3.962(2) | 11.058(8) | 173.5(3) | 2.791(3) |
| Ca0.48(1)Sr0.52(2)Co1.92(3)As2 | 0.3614(1) | 3.9593(5) | 11.2024(16) | 175.61(5) | 2.8294(4) |
| Ca0.26(2)Sr0.74(2)Co1.92(2)As2 | 0.3595(2) | 3.949(2) | 11.574(6) | 180.5(2) | 2.931(4) |
| Ca0.13(3)Sr0.87(3)Co1.96(2)As2 | 0.3588(2) | 3.9441(6) | 11.6725(18) | 181.58(6) | 2.9594(5) |
| SrCo2As2 | 0.3587(3) | 3.9466(2) | 11.773(1) | 183.37(3) | 2.9831(4) |
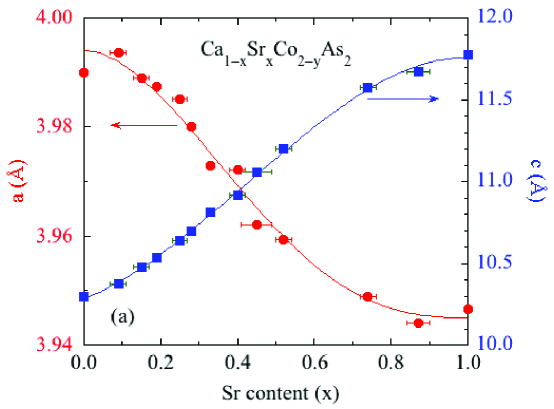
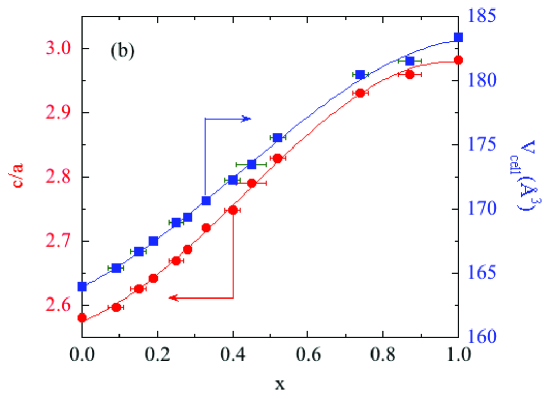
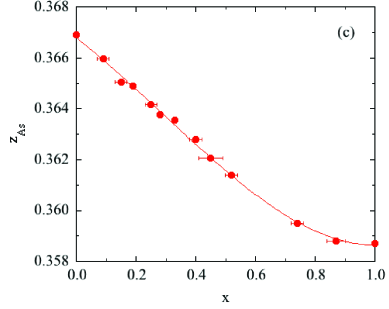
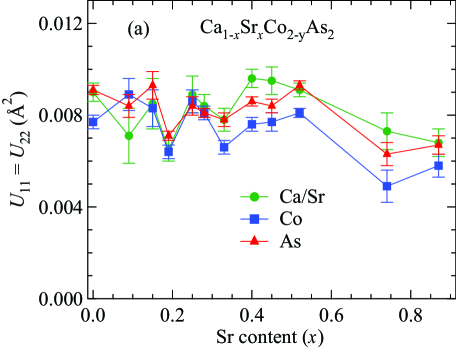
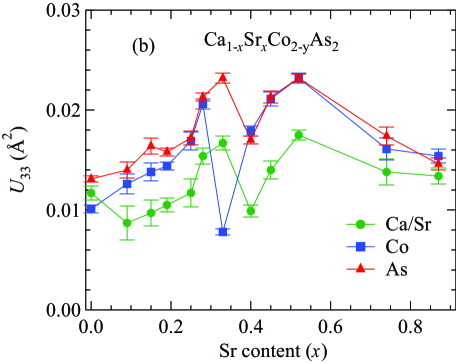
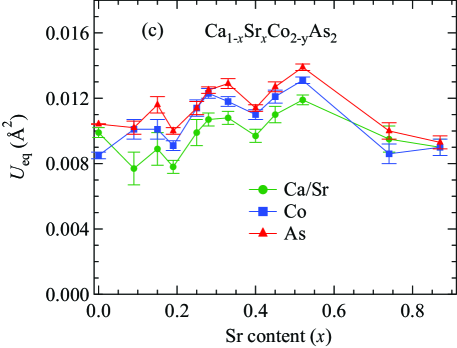
Plots of the composition dependences of and of our crystals of Ca1-xSrxCo2-yAs2 are given in Fig. 6(a), of and the unit cell volume in Fig. 6(b), and of in Fig. 6(c). All parameters show a smooth crossover from the collapsed-tetragonal structure at to the uncollapsed-tetragonal structure at .
| Composition | Ca/Sr | Co | As | (Å2) | ||||||
|---|---|---|---|---|---|---|---|---|---|---|
| (Å2) | (Å2) | (Å2) | (Å2) | (Å2) | (Å2) | Ca/Sr | Co | As | ||
| 0 | 1.84(3) | 0.0090(4) | 0.0117(7) | 0.0077(3) | 0.0101(4) | 0.0091(2) | 0.0131(3) | 0.0099(3) | 0.0085(2) | 0.01042(18) |
| 0.09(2) | 1.86(3) | 0.0071(12) | 0.0087(17) | 0.0089(7) | 0.0126(10) | 0.0084(5) | 0.0140(8) | 0.0077(10) | 0.0101(6) | 0.0102(4) |
| 0.15(2) | 1.88(4) | 0.0085(11) | 0.0097(13) | 0.0083(8) | 0.0138(9) | 0.0093(6) | 0.0164(8) | 0.0089(10) | 0.0101(6) | 0.0116(5) |
| 0.19(1) | 1.90(2) | 0.0065(5) | 0.0105(7) | 0.0064(3) | 0.0144(4) | 0.0071(2) | 0.0158(4) | 0.0078(4) | 0.0091(3) | 0.0100(2) |
| 0.25(2) | 1.90(5) | 0.0089(8) | 0.0117(14) | 0.0086(5) | 0.0169(9) | 0.0084(4) | 0.0172(7) | 0.0099(8) | 0.0114(5) | 0.0114(4) |
| 0.28(1) | 1.91(2) | 0.0084(5) | 0.0154(8) | 0.0081(3) | 0.0206(5) | 0.0081(2) | 0.0213(4) | 0.0107(4) | 0.0123(3) | 0.0125(2) |
| 0.33(1) | 1.90(2) | 0.0078(5) | 0.0167(7) | 0.0066(3) | 0.0078(3) | 0.0078(3) | 0.0232(5) | 0.0108(4) | 0.0118(3) | 0.0129(3) |
| 0.40(2) | 1.93(3) | 0.0096(4) | 0.0099(6) | 0.0076(3) | 0.0179(5) | 0.0086(2) | 0.0170(4) | 0.0097(4) | 0.0110(3) | 0.0114(2) |
| 0.45(4) | 1.92(2) | 0.0095(6) | 0.0140(9) | 0.0077(4) | 0.0211(7) | 0.0084(3) | 0.0213(6) | 0.0110(5) | 0.0121(4) | 0.0127(3) |
| 0.52(2) | 1.92(3) | 0.0091(3) | 0.0175(5) | 0.0081(2) | 0.0232(5) | 0.0093(2) | 0.0232(4) | 0.0119(3) | 0.0131(2) | 0.0139(2) |
| 0.74(2) | 1.92(2) | 0.0073(8) | 0.0138(13) | 0.0049(7) | 0.0161(11) | 0.0063(5) | 0.0174(9) | 0.0095(8) | 0.0086(6) | 0.0100(5) |
| 0.87(3) | 1.96(2) | 0.0068(6) | 0.0134(8) | 0.0058(5) | 0.0154(7) | 0.0067(4) | 0.0146(6) | 0.0090(5) | 0.0090(5) | 0.0093(4) |
Heat Capacity Data
Additional Magnetization and Magnetic Susceptibility Data
In this section, the Tesla (T) is an abbreviation for 10 kOe.
| Compound | |||||||||
|---|---|---|---|---|---|---|---|---|---|
| (K) | (T) | (T) | (T) | (T) | /Co) | /Co) | (K) | (K) | |
| CaCo1.84(3)As2 | 60(2) | 3.69 | 8.9 | 11.2 | 1.40(1) | 1.36(1) | 70(5) | 70(8) | |
| Ca0.91(2)Sr0.09(2)Co1.86(3)As2 | 65.5(3) | 1.4 | 1.80 | 4.31 | 1.52(18) | 1.57(10) | 82(10) | 79(9) | |
| Ca0.85(3)Sr0.15(2)Co1.88(4)As2 | 64.6(2) | 0.63 | 0.875 | 2.57 | 1.76(11) | 1.65(19) | 86(6) | 83(14) | |
| Ca0.81(1)Sr0.19(1)Co1.90(2)As2 | 70.5(5) | 0.015 | 0.143 | 1.40 | |||||
| Ca0.75(2)Sr0.25(2)Co1.90(5)As2 | 67(1) | 0.01 | 0.094 | 0.95 | 1.64(12) | 1.64(9) | 86(7) | 85(9) | |
| Ca0.72(1)Sr0.28(1)Co1.91(2)As2 | 62.7(7) | 0 | 0.084 | 1.06 | 1.72(19) | 1.61(19) | 79(13) | 80(10) | |
| Ca0.67(1)Sr0.33(1)Co1.90(2)As2 | 60.3(5) | 0.24 | 1.62 | 1.69 | 1.45(12) | 1.39(7) | 71(10) | 72(10) | |
| Ca0.60(2)Sr0.40(2)Co1.93(3)As2 | 46.7(9) | 1.74 | 5.25 | 1.47(8) | 1.41(4) | 44(10) | 44(5) | ||
| Ca0.55(4)Sr0.45(4)Co1.92(2)As2 | 36.4(3) | 2.8 | 7.35 | 1.46(1) | 1.43(3) | 26(6) | 27(7) | ||
| Ca0.48(1)Sr0.52(2)Co1.92(3)As2 | 0 | 0.47(1) | 0.44(4) | (6) | (8) | ||||
| SrCo2As2 [32] | 1.8(2)111Spherically-averaged values obtained in Ref. [32] from fits of the modified Curie-Weiss law to the spherically-averaged single-crystal susceptibilities and in the temperature range 200–300 K. | 140(40)111Spherically-averaged values obtained in Ref. [32] from fits of the modified Curie-Weiss law to the spherically-averaged single-crystal susceptibilities and in the temperature range 200–300 K. |
Due to the two-orders-of-magnitude variation in the ordinate scales of the plots for the ten crystals of Ca1-xSrxCo2-yAs2 in Fig. 1 of the main text, in Fig. 10 are shown plots of versus for the same ten crystals on single plots for each of and .
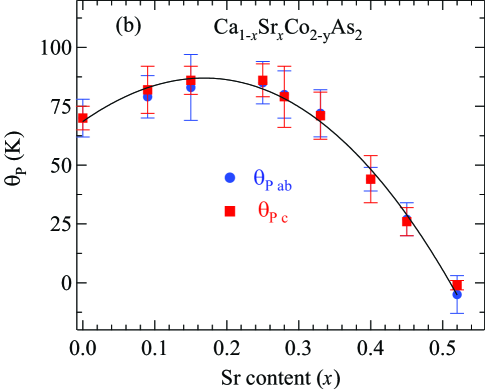
The data for the crystals in the PM state above were fitted from 100 to 300 K by the modified Curie-Weiss law , where is the Curie constant and is the Weiss temperature. The effective moment was calculated from . The results for and are listed in Table 4 and plotted in Fig. 11.

Acknowledgements.
This research was supported by the U.S. Department of Energy, Office of Basic Energy Sciences, Division of Materials Sciences and Engineering. Ames Laboratory is operated for the U.S. Department of Energy by Iowa State University under Contract No. DE-AC02-07CH11358.References [40] APEX3, Bruker AXS Inc., Madison, Wisconsin, USA, 2015. [41] SAINT, Bruker AXS Inc., Madison, Wisconsin, USA, 2015. [42] L. Krause, R. Herbst-Irmer, G. M. Sheldrick, and D. Stalke, Comparison of silver and molybdenum microfocus X-ray sources for single-crystal structure determination, J. Appl. Crystallogr. 48, 3 (2015). [43] G. M. Sheldrick. SHELTX – Integrated space-group and crystal-structure determination. Acta Crystallogr. A 71, 3 (2015). [44] G. M. Sheldrick. Crystal structure refinement with SHELXL. Acta Crystallogr. C 71, 3 (2015).