Crystal field excitations from ions at defective sites in highly stuffed
Abstract
The pyrochlore magnet Yb2Ti2O7 has been proposed as a quantum spin ice candidate, a spin liquid state expected to display emergent quantum electrodynamics with gauge photons among its elementary excitations. However, Yb2Ti2O7’s ground state is known to be very sensitive to its precise stoichiometry. Powder samples, produced by solid state synthesis at relatively low temperatures, tend to be stoichiometric, while single crystals grown from the melt tend to display weak “stuffing” wherein of the , normally at the site of the pyrochlore structure, reside as well at the site. In such samples ions should exist in defective environments at low levels, and be subjected to crystalline electric fields (CEFs) very different from those at the stoichiometric sites. New neutron scattering measurements of in four compositions of Yb2+xTi2-xO7-y, show the spectroscopic signatures for these defective ions and explicitly demonstrate that the spin anisotropy of the moment changes from XY-like for stoichiometric , to Ising-like for “stuffed” B-site , or for A-site in the presence of an oxygen vacancy.
pacs:
71.70.Ch, 75.10.Dg, 75.10.Jm, 78.70.NxExotic magnetic ground states of cubic pyrochlore magnets, with composition , are of great topical interest, as the pyrochlore lattice is one of the canonical architectures supporting geometrical frustration in three dimensions Lacroix et al. (2011); Gardner et al. (2010). Magnetism can reside at either the A3+ site or the B4+ site, and the magnetic moments’ anisotropy and the interactions between the moments conspire to give rise to rich ground state selection. Among the states and materials that have been of recent interest have been the classical spin ice states in Dy and Ho titanate pyrochlores Harris et al. (1997); Ramirez et al. (1959); den Hertog and Gingras (2000); Bramwell and Gingras (2001); Castelnovo et al. (2008), spin liquid and spin glass states in molybdate pyrochlores Clark et al. (2014), and spin fragmentation in Nd based zirconate pyrochlores Petit et al. (2016). The possibility that a quantum analogue of the spin ice ground state, i.e. quantum spin ice (QSI), may exist in certain low moment pyrochlore magnets, including Yb2Ti2O7 and Pr2Zr2O7, has generated much excitement Thompson et al. (2011a, b); Ross et al. (2011a); Savary and Balents (2012); Applegate et al. (2012); Benton et al. (2012); Hayre et al. (2013); Savary and Balents (2013); D’Ortenzio et al. (2013); Kimura et al. (2013); Gingras and McClarty (2014); Pan et al. (2014); Robert et al. (2015); Pan et al. (2016); Hamachi et al. (2016).
At low temperatures Yb2Ti2O7 displays two magnetic heat capacity anomalies: a broad one near 2 K and a sharp anomaly signifying a thermodynamic phase transition near = 0.26 K Blöte et al. (1969); de Réotier et al. (2006); Yaouanc et al. (2011); Ross et al. (2012); Hallas et al. (2017). Below , the ordered structure is thought to be a splayed ferromagnet with moments pointing close to the (100) directions Yasui et al. (2003); Chang et al. (2012); Gaudet et al. (2016); Yaouanc et al. (2016); Scheie et al. (2017). However, surprising sample variability has been reported in this phase transition, with some studies not seeing direct evidence for the ferromagnetic ordered state Ross et al. (2009, 2011b); Hodges et al. (2002); Yaouanc et al. (2003); Gardner et al. (2004); D’Ortenzio et al. (2013); Bhattacharjee et al. (2016); Bonville et al. (2004). Using the sharp anomaly in CP as the figure-of-merit for the phase transition, interesting systematics have been observed Ross et al. (2012); Hallas et al. (2017); Arpino et al. (2017); Mostaed et al. (2017). Powder samples grown by solid state synthesis at relatively low temperatures show a sharp CP anomaly and a high . usually 0.26 K Ross et al. (2012); Hallas et al. (2017); Arpino et al. (2017); Pecanha-Antonio et al. (2017); however most single crystal studies display broader thermodynamic anomalies at much lower temperatures, often with s around and below 0.2 K Thompson et al. (2017); Lhotel et al. (2014); Yasui et al. (2003); Chang et al. (2012).
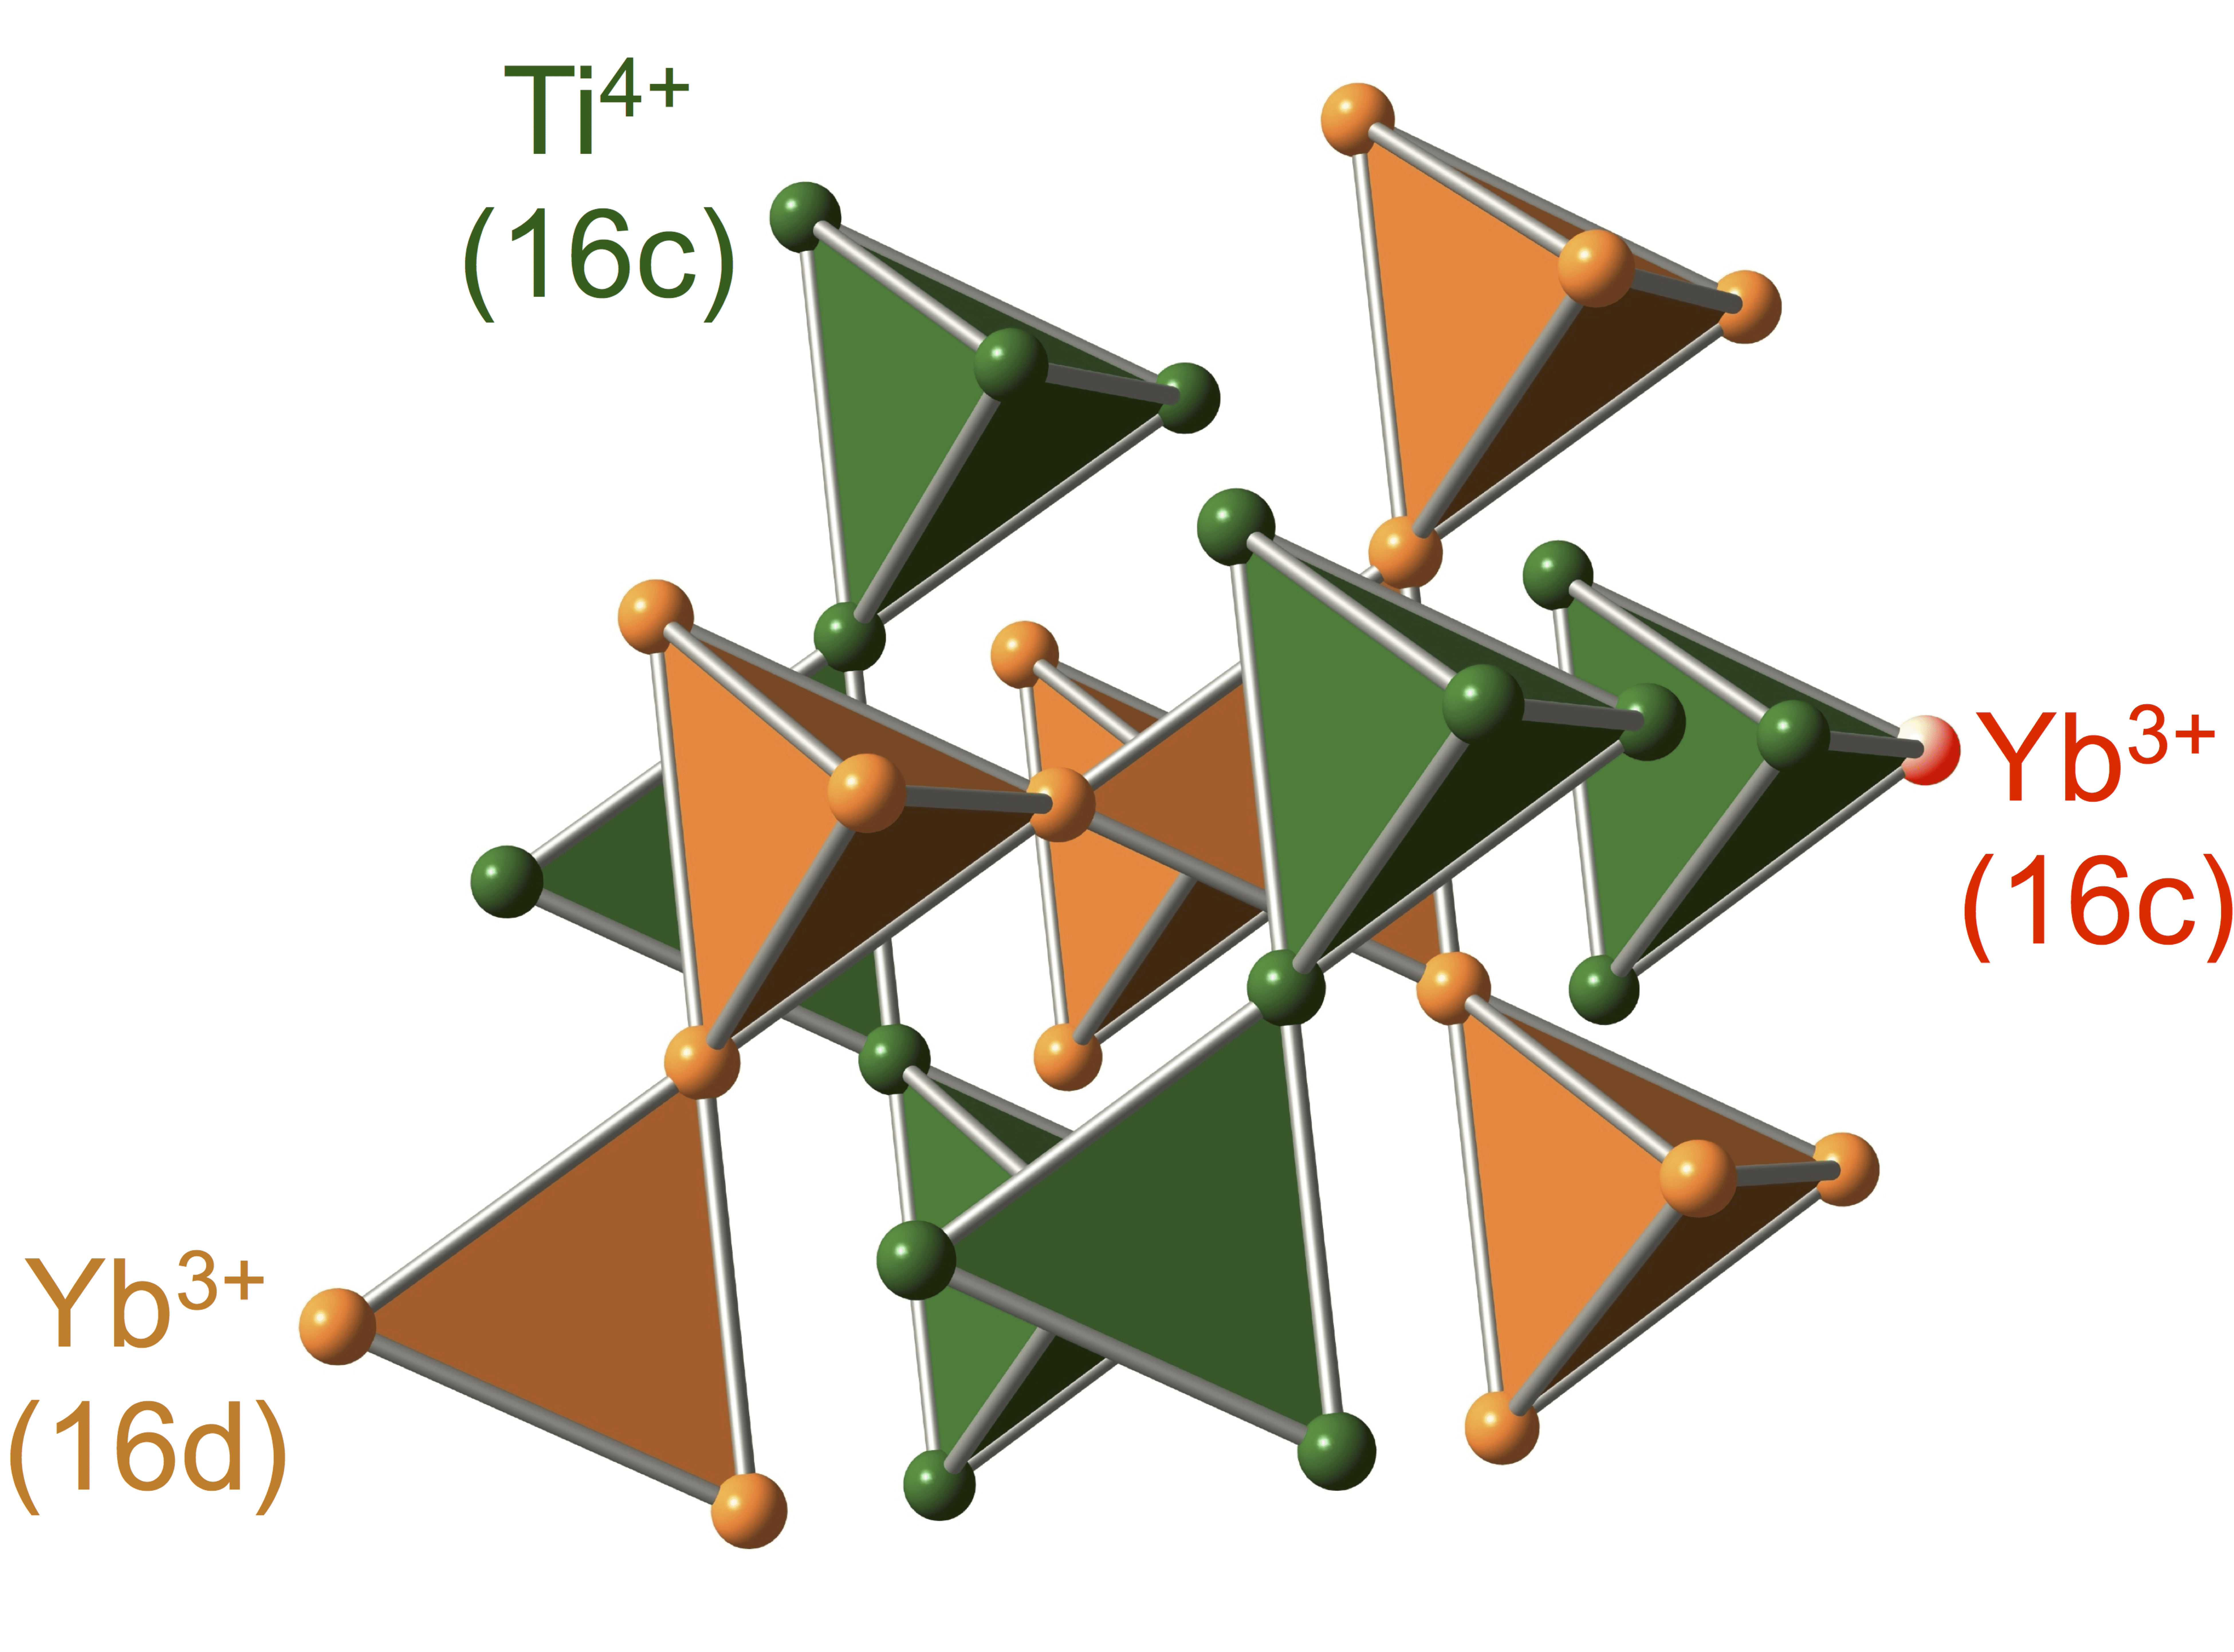
Crystallographic studies of the powder and single crystal samples have revealed that the powder samples are stoichiometric Yb2Ti2O7, while the single crystals are “lightly stuffed”, and characterized by the composition Yb2+xTi2-xO7-y, with 0.04 Ross et al. (2012). That is, a small excess of ions, nominally at the crystallographic 16d or A site, are “stuffed” onto the 16c or B site where nonmagnetic ions are located in pure Yb2Ti2O7 as schematically indicated in Fig. 1. Light stuffing is also known to occur in other titanate pyrochlores Baroudi et al. (2015).
It is remarkable that such a small change in stoichiometry could so strongly effect the ground state selection of a simple ordered state in a three dimensional magnetic insulator. Related phenomena has also recently been observed in the effect of hydrostatic pressure on stoichiometric Yb2Ti2O7 samples, where ambient pressure conditions show no sign of a SR signal for the transition, but a minimal 1 kbar (and above) applied pressure results in a clear signal for a transition near 0.26 K Kermarrec et al. (2017).
With weak “stuffing” able to suppress this phase transition by as much as Ross et al. (2012); Hallas et al. (2017); Arpino et al. (2017); Yasui et al. (2003); Chang et al. (2012), it is important to understand precisely what is at play in its ground state selection. One thing that is clear is that most single crystals of Yb2Ti2O7 likely have Yb3+ ions occupying not only the stoichiometric A-sites, but also B-sites. They also possess A-sites with missing oxygen neighbours. The Yb3+ ions in defective environments are expected to experience very different crystal field effects than those at stoichiometric A-sites Gaudet et al. (2015). As these effects determine the spin anisotropy and size of the Yb3+ moment, it is possible that the defective Yb3+ moments and their anisotropy are very different from those displayed by stoichiometric Yb3+ - indeed a prediction from point charge calculations of the crystal field effects on Yb3+ have suggested that this is the case Gaudet et al. (2015).
The eigenvalues and eigenfunctions associated with crystal field states can be determined using inelastic neutron spectroscopy, and these have been determined for stoichiometric Yb2Ti2O7 and several other rare-earth based pyrochlore magnets Gaudet et al. (2015); Rosenkranz et al. (2000); Bertin et al. (2012). However, the equivalent measurements on Yb3+ in defective environments in Yb2+xTi2-xO7-y are much more difficult, as the environments occur at low density in these materials. Additionally, as we will see, the eigenvalues associated with the defective environments tend to extend to much higher energies.
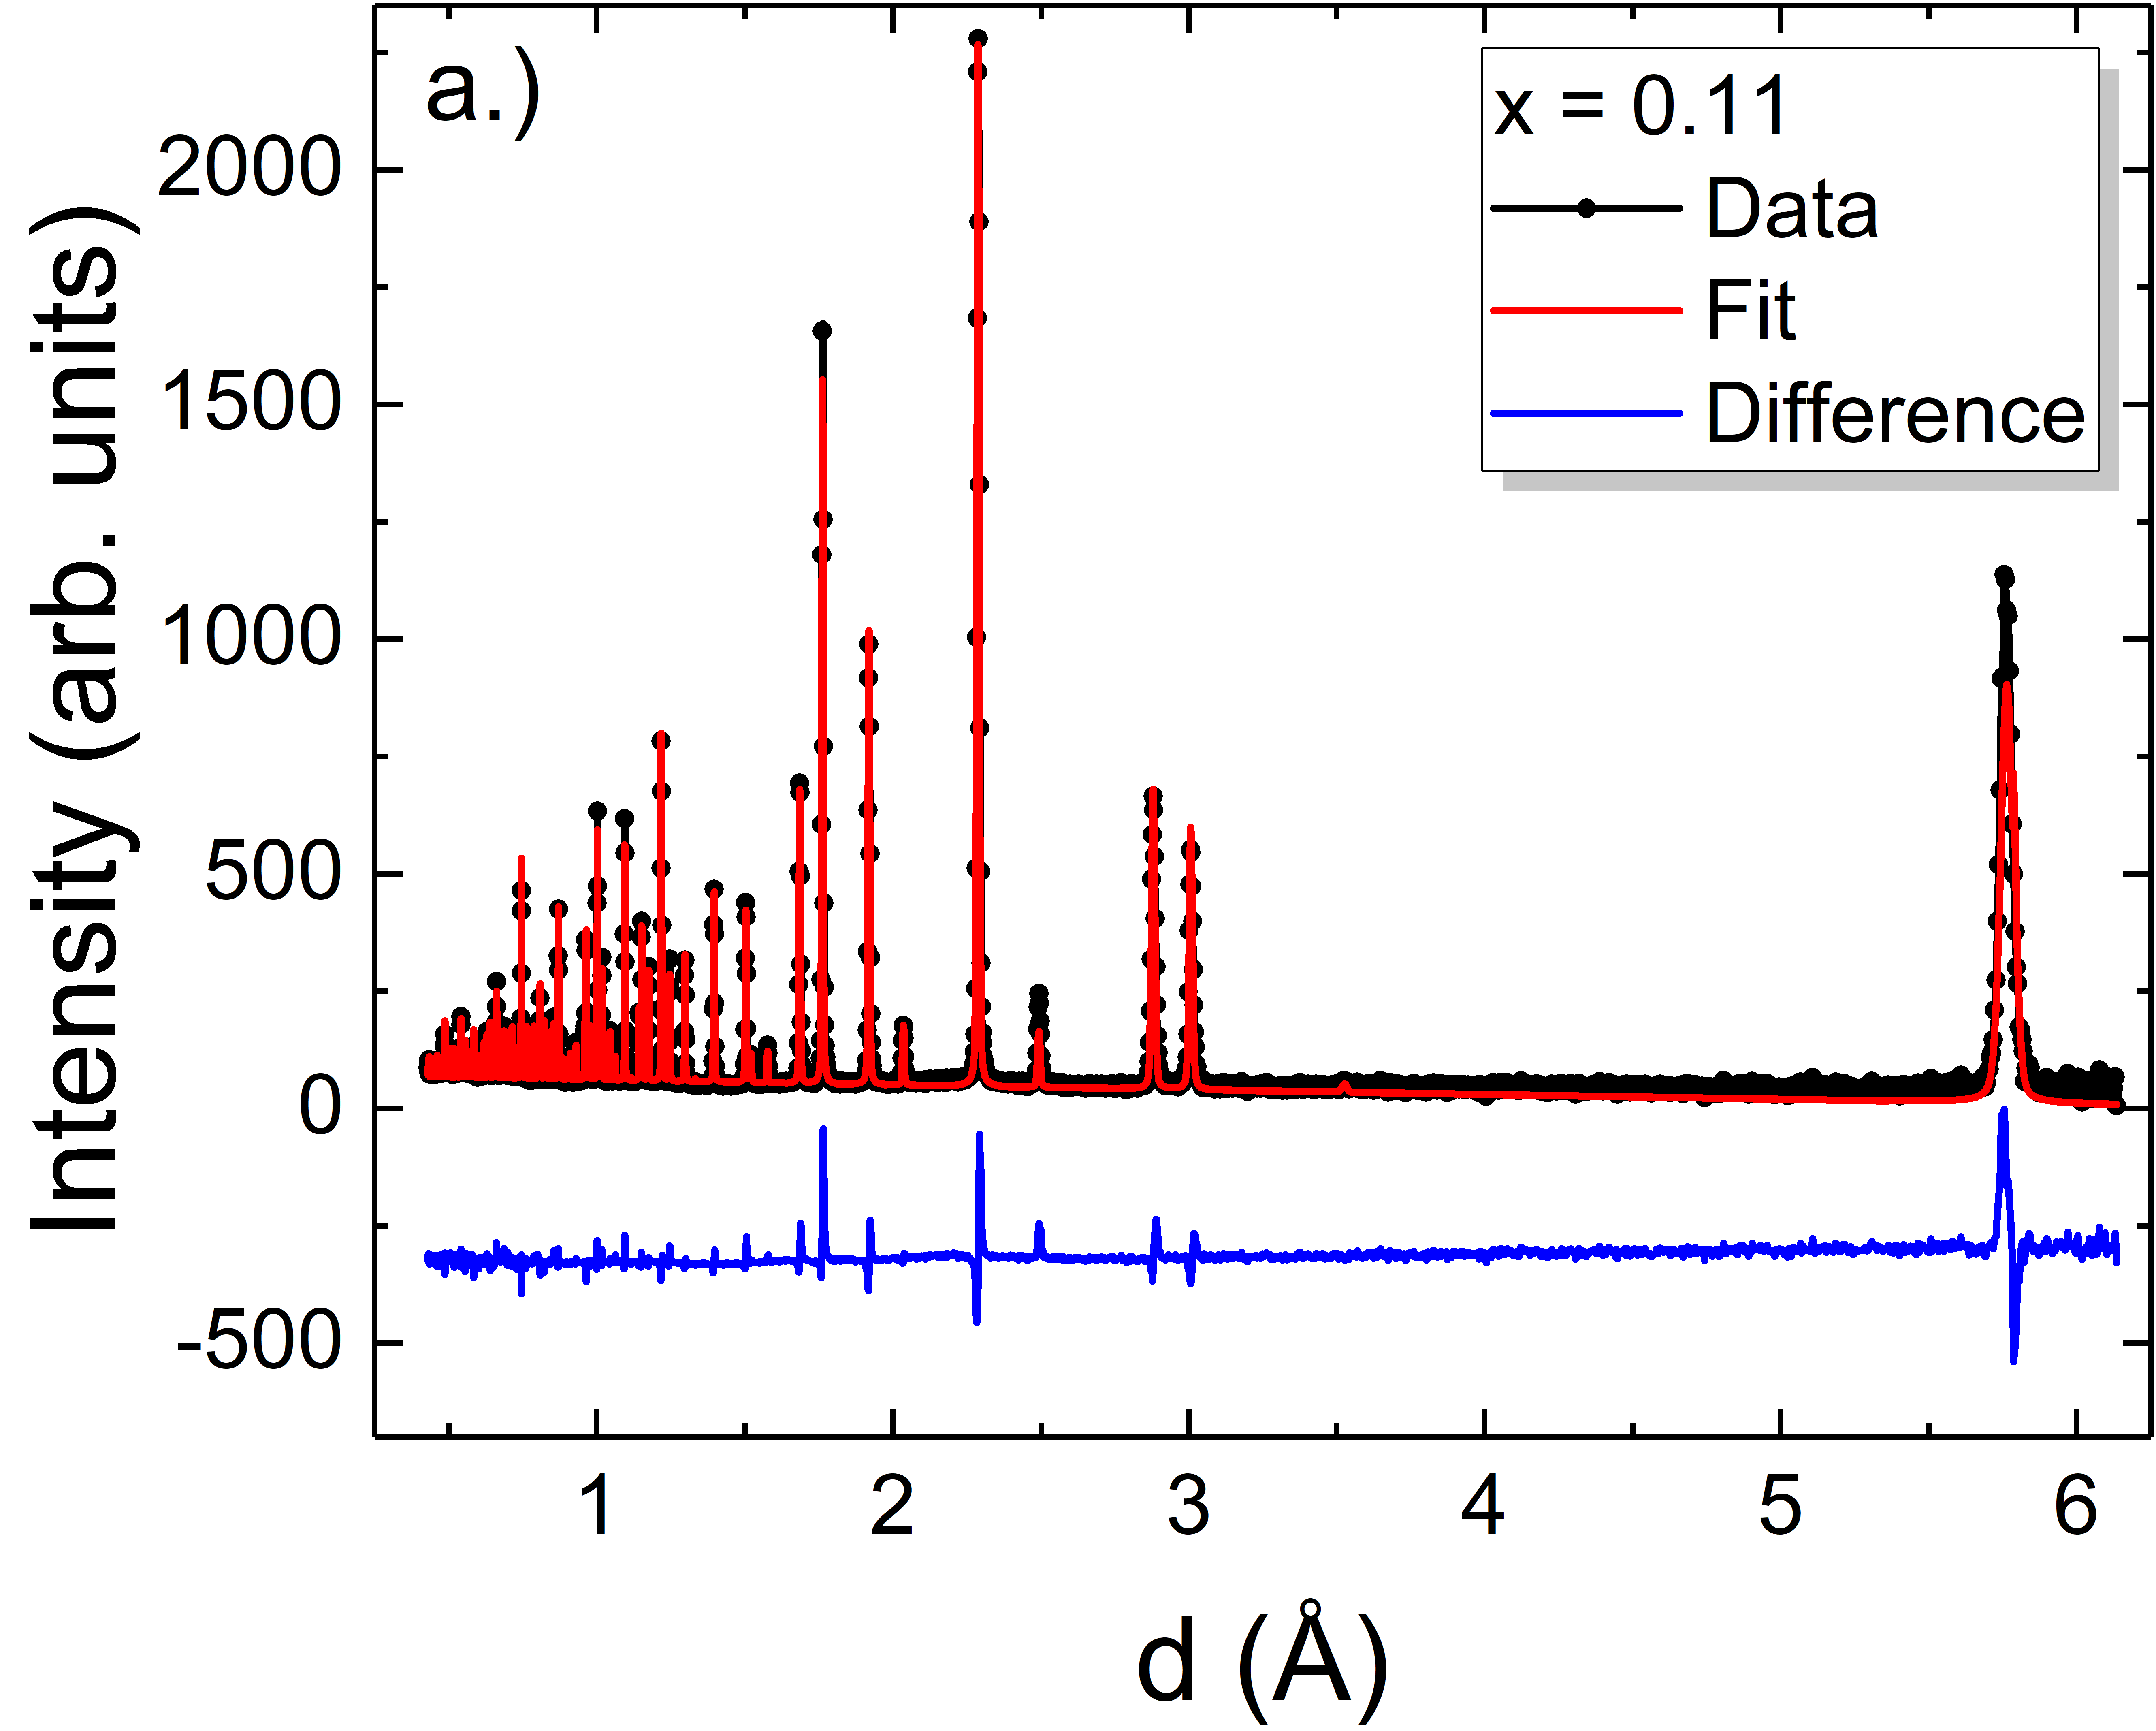
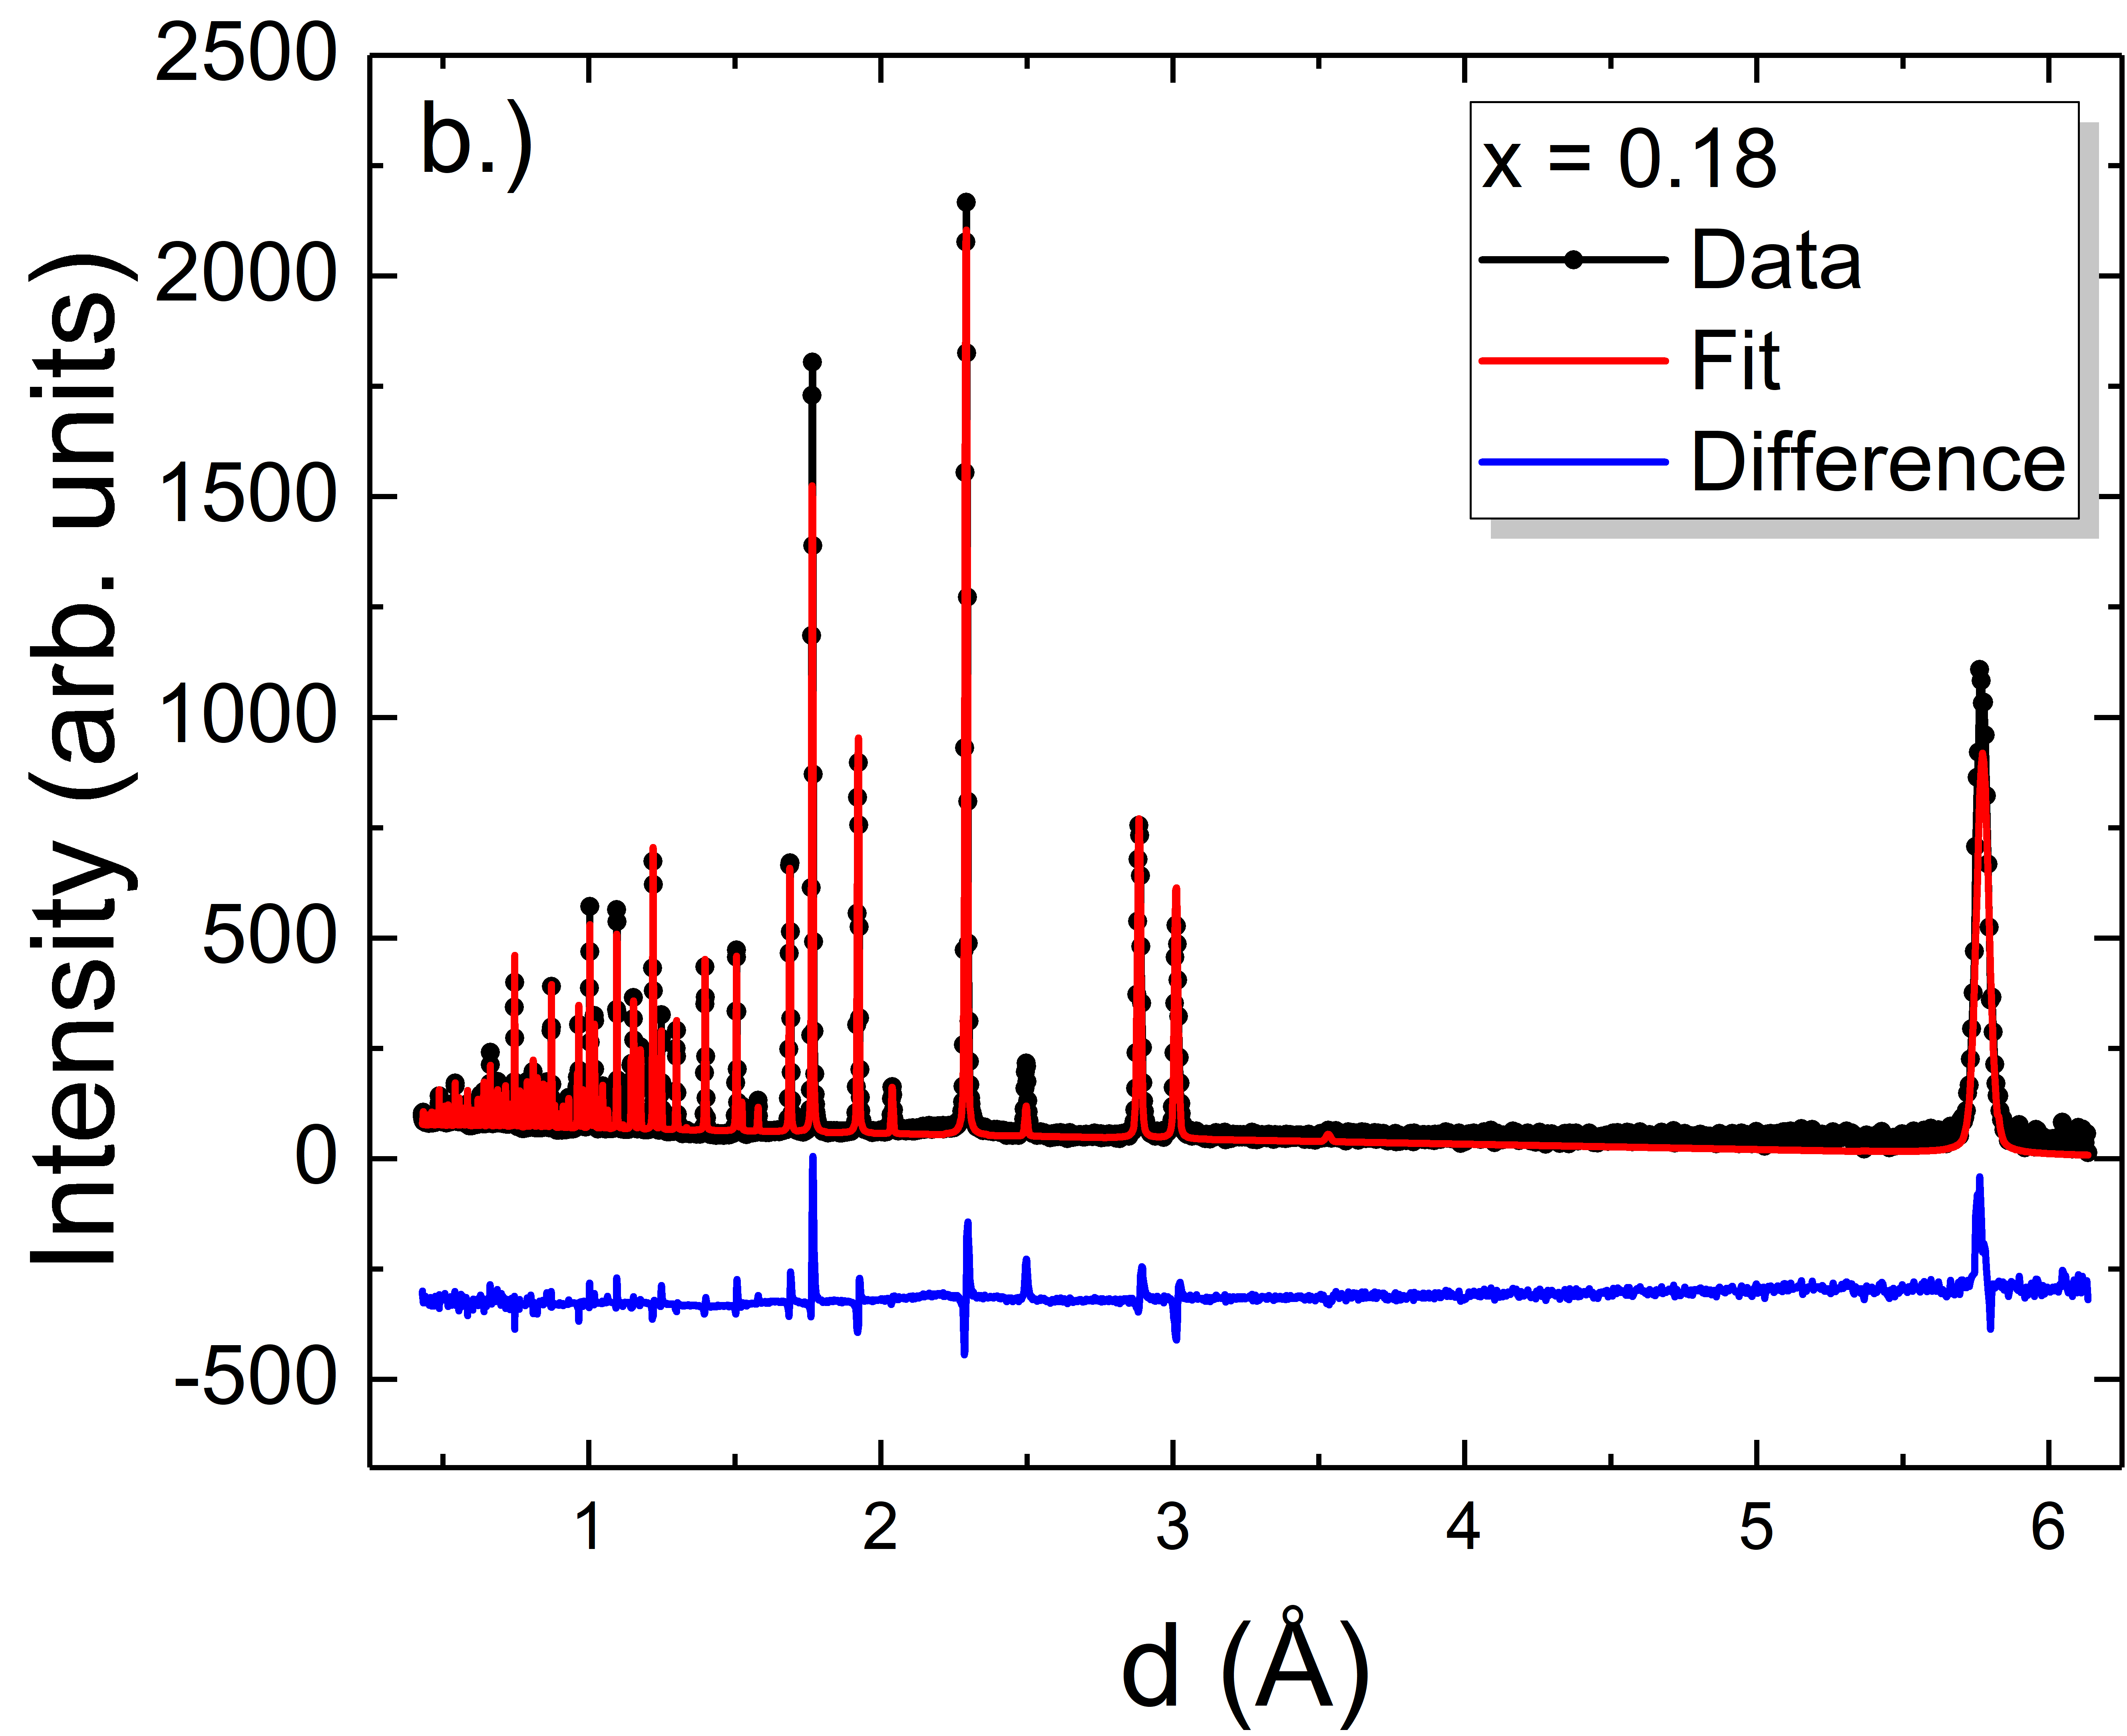
Powder samples of Yb2+xTi2-xO7-y with x = 0.11 and 0.18 were prepared at McMaster University and characterized using the POWGEN neutron powder diffractometer Huq et al. (2011) at the Spallation Neutron Source of Oak Ridge National Laboratory. Our best refinement of this powder diffraction data gives x = 0.106(4) and 0.176(8) for the highly stuffed samples with oxygen vacancies preferentially located at the O(1) site of the pyrochlore lattice, as discussed in the Supplemental Material (SM).
Inelastic neutron scattering measurements were performed on these two highly stuffed powder samples. The resulting samples were g of powder for each of the x = 0.11 and 0.18 samples. We studied their CEF excitations using the direct geometry time-of-flight spectrometer SEQUOIA Granroth et al. (2010) at ORNL and compared these results with earlier measurements performed Gaudet et al. (2015) on the stoichiometric (x = 0) and lightly stuffed (x = 0.05) samples. The powder samples were loaded into aluminium flat plates and were sealed under He atmosphere in a glove box. An empty, aluminium flat plate with the same dimensions was prepared in a similar manner and employed for background measurements. Measurements have been performed at T = 5 K and 300 K, with incident energies of = 150, 250 and 500 meV. The corresponding chopper settings selected at these energies were: and , and and and respectively. The data were reduced with Mantid Arnold et al. (2014) and analyzed using DAVE Azuah et al. (2009) software, while we employed custom software to refine the CEF spectrum of the powder samples, as described above and in the SM.
The CEFs originate primarily from the “cage” of O2- ions surrounding the cations, lifting the (2J+1)-fold degeneracy of the J = 7/2 ground state manifold appropriate to . Typical time-of-flight inelastic neutron scattering data from four powder samples of Yb2+xTi2-xO7-y, with x = 0, 0.05, 0.11, and 0.18 are shown at T = 5 K in Figs. 3, and for x = 0.11 and 0.18 in Fig. 4. This data has been analysed from a starting point, known as the point charge approximation Hutchings (1964); Freeman and Watson (1962); Malkin et al. (2004); Walter (1984), where initial CEF transitions from the ground state are calculated based on the local symmetry of the and site ions, taken from crystallographic measurements. The energies and intensities of the CEF transitions are subsequently refined to agree with the experimental data. The case for is relatively straightforward as its 13 4f electrons give a Hund’s rule ground state of J = 7/2, so it is a Kramers’ ion with at most 3 CEF transitions from the ground state.
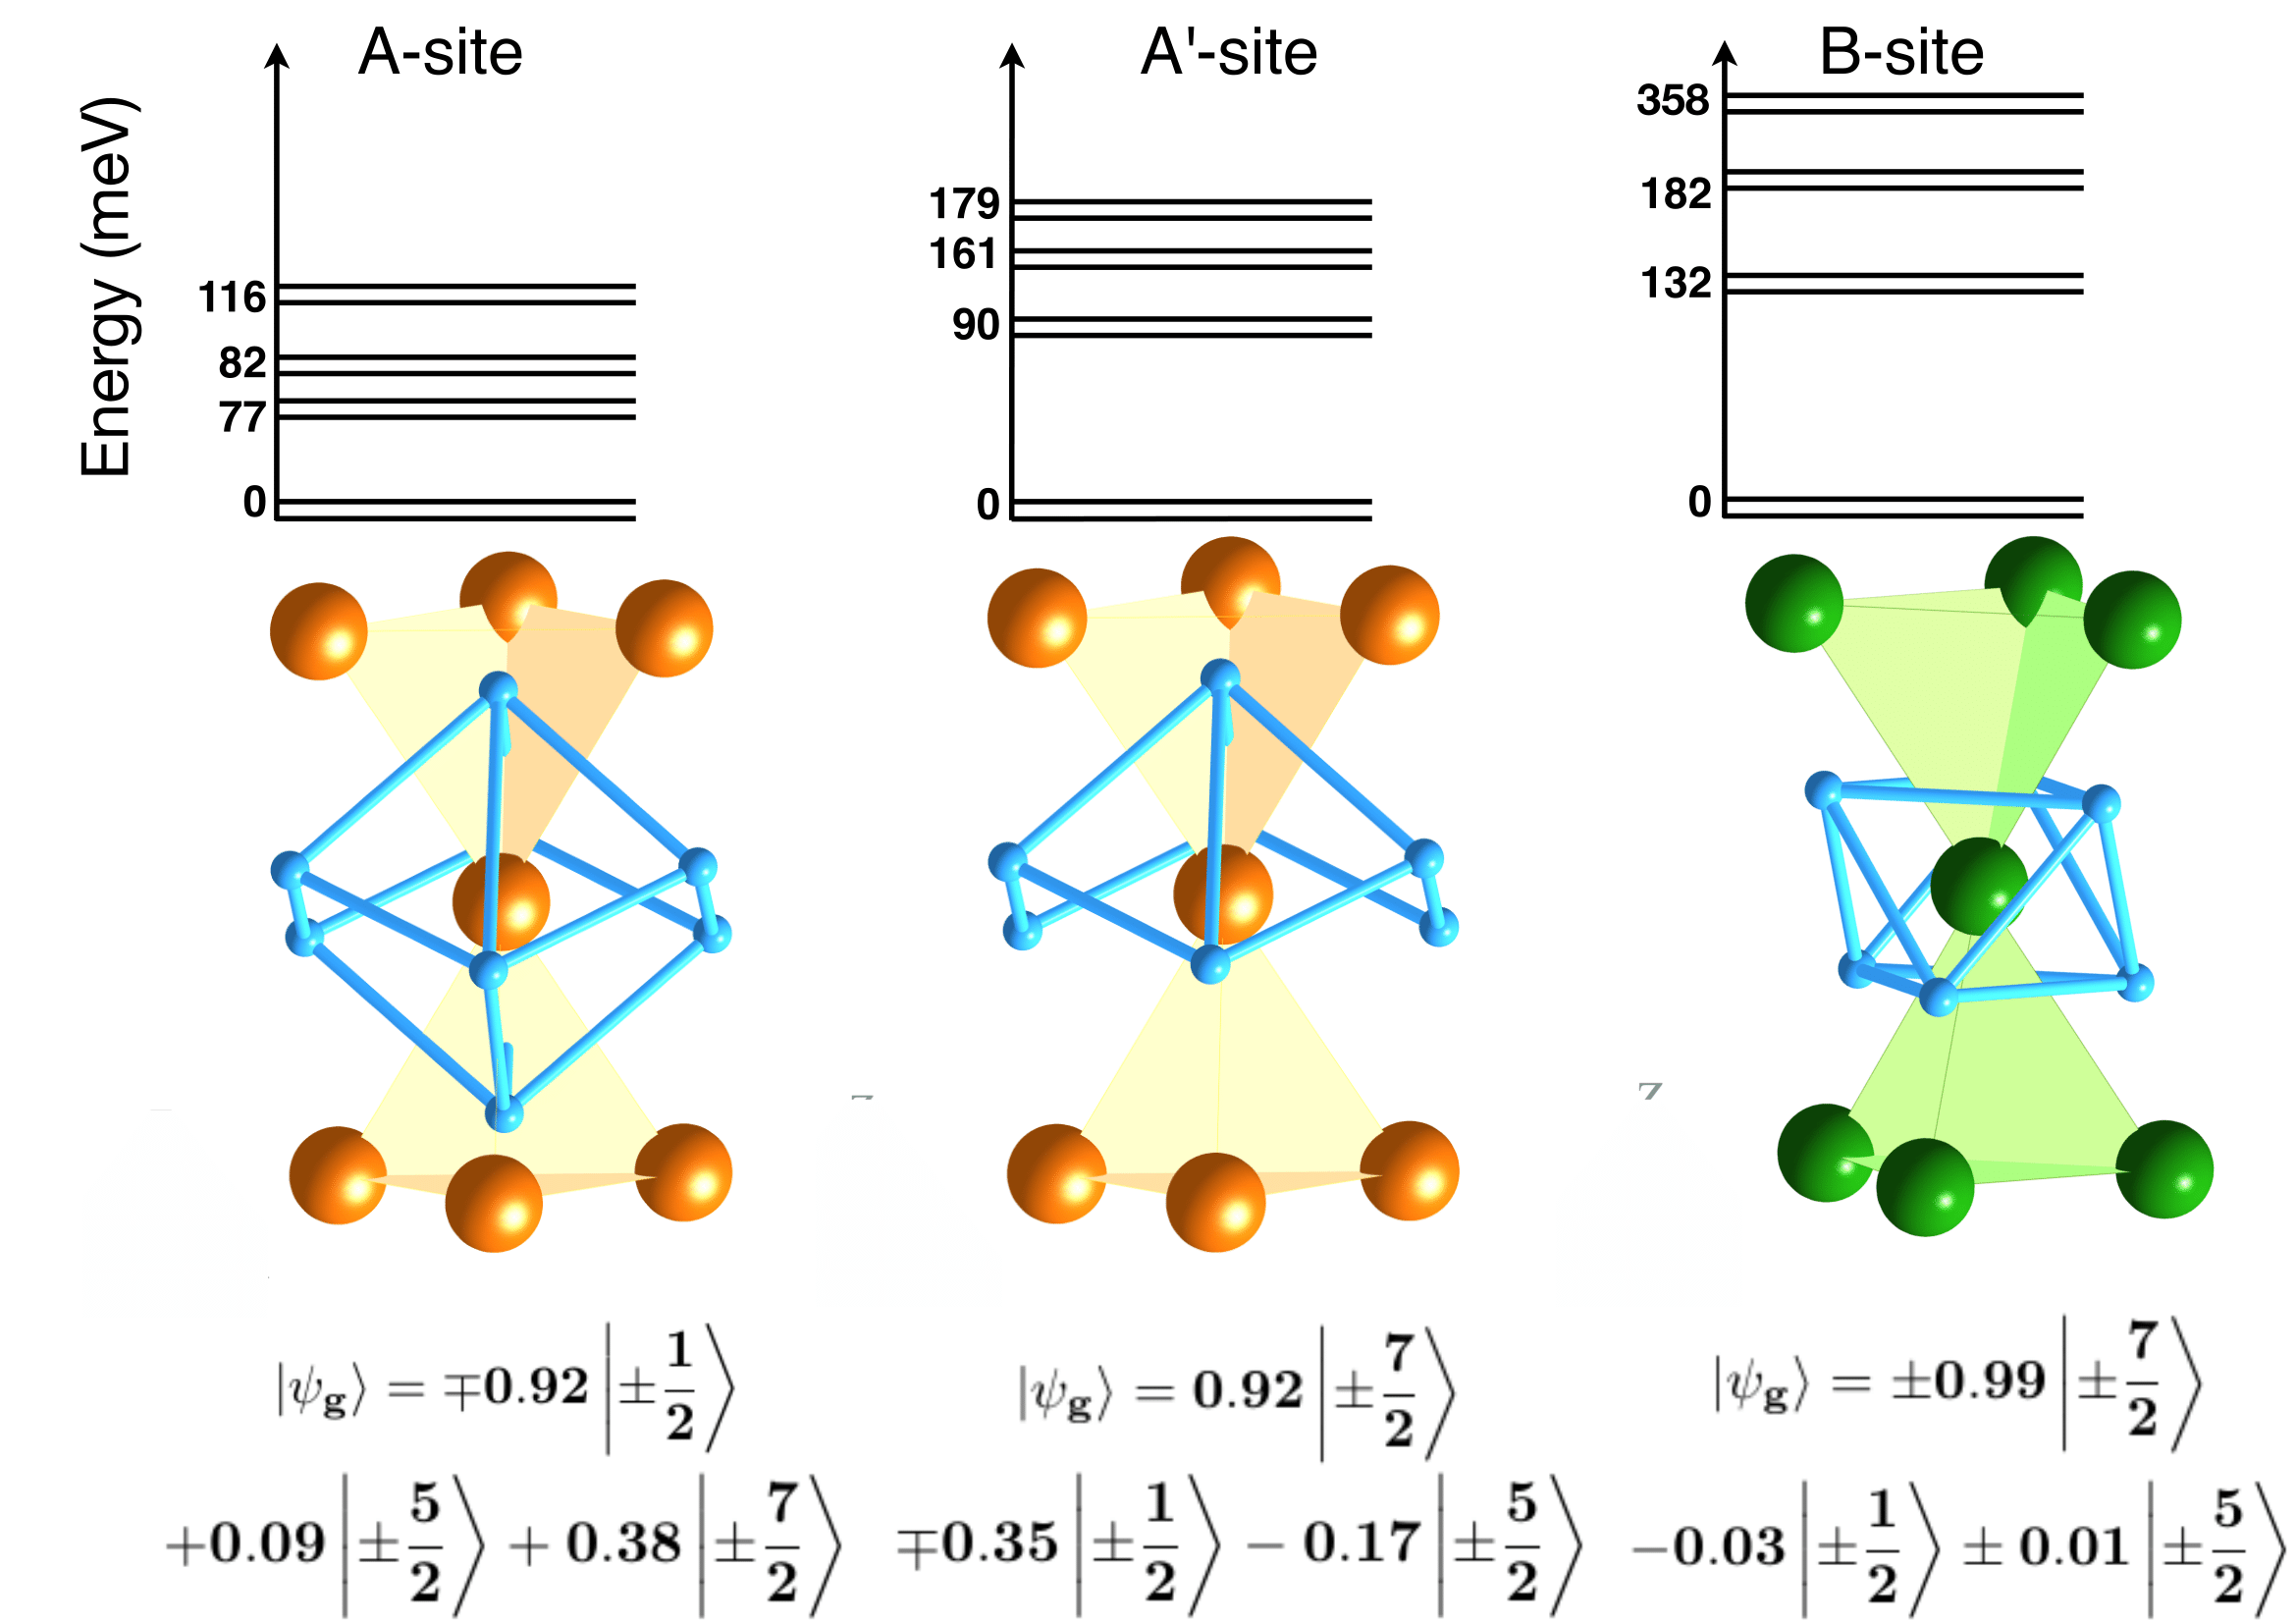
We considered 3 local Yb3+ environments shown in Fig. 2. These are Yb3+ in an A site environment with a full complement of 8 neighbouring O2- ions; in an A site environment with one O2- vacancy (referred to as an site); and a Yb3+ ion in a B site environment with a full complement of 6 neighbouring O2- ions. The A site O2- environment consists of a cube distorted along the local [111] directions. Six O(2) ions are located on a plane perpendicular to this direction and a three-fold rotation axis. Two additional O(1) ions are located along the local [111] axis. In other titanate pyrochlores, the O(1) sites are known to have a higher probability of hosting vacancies than the O(2) sites Sala et al. (2014), a result which we confirm here for Yb2+xTi2-xO7-y using powder neutron diffraction, as shown in the SM. By contrast, the environment at the B site is a trigonal anti-prism made of six O(2) oxygen ions. Additional local Yb3+ environments, such as an A site Yb3+ with two vacancies, were assumed to be unlikely at the stuffing levels considered here.
Our CEF calculation followed Prather’s convention Prather (1961) and employed the Stevens’ formalism Stevens (1952). The resulting CEF Hamiltonian for at all three sites can be written as:
| (1) |
Here are the Stevens’ operators and the CEF parameters used to approximate the Coulomb potential generated by the ligands.
The unpolarised neutron partial differential magnetic cross-section can be written within the dipole approximation as Squires (1978):
| (2) |
where is the scattered solid angle, the ratio of the scattered and incident momentum of the neutron, C is a constant and is the magnetic form factor of the magnetic Yb3+ ion. The scattering function gives the relative scattered intensity due to transitions between different CEF levels. At constant temperature and wave vector , we have:
| (3) |
where and is a Lorentzian function which ensures energy conservation as the neutron induces transitions between the CEF levels , that possess a finite energy width or inverse lifetime.
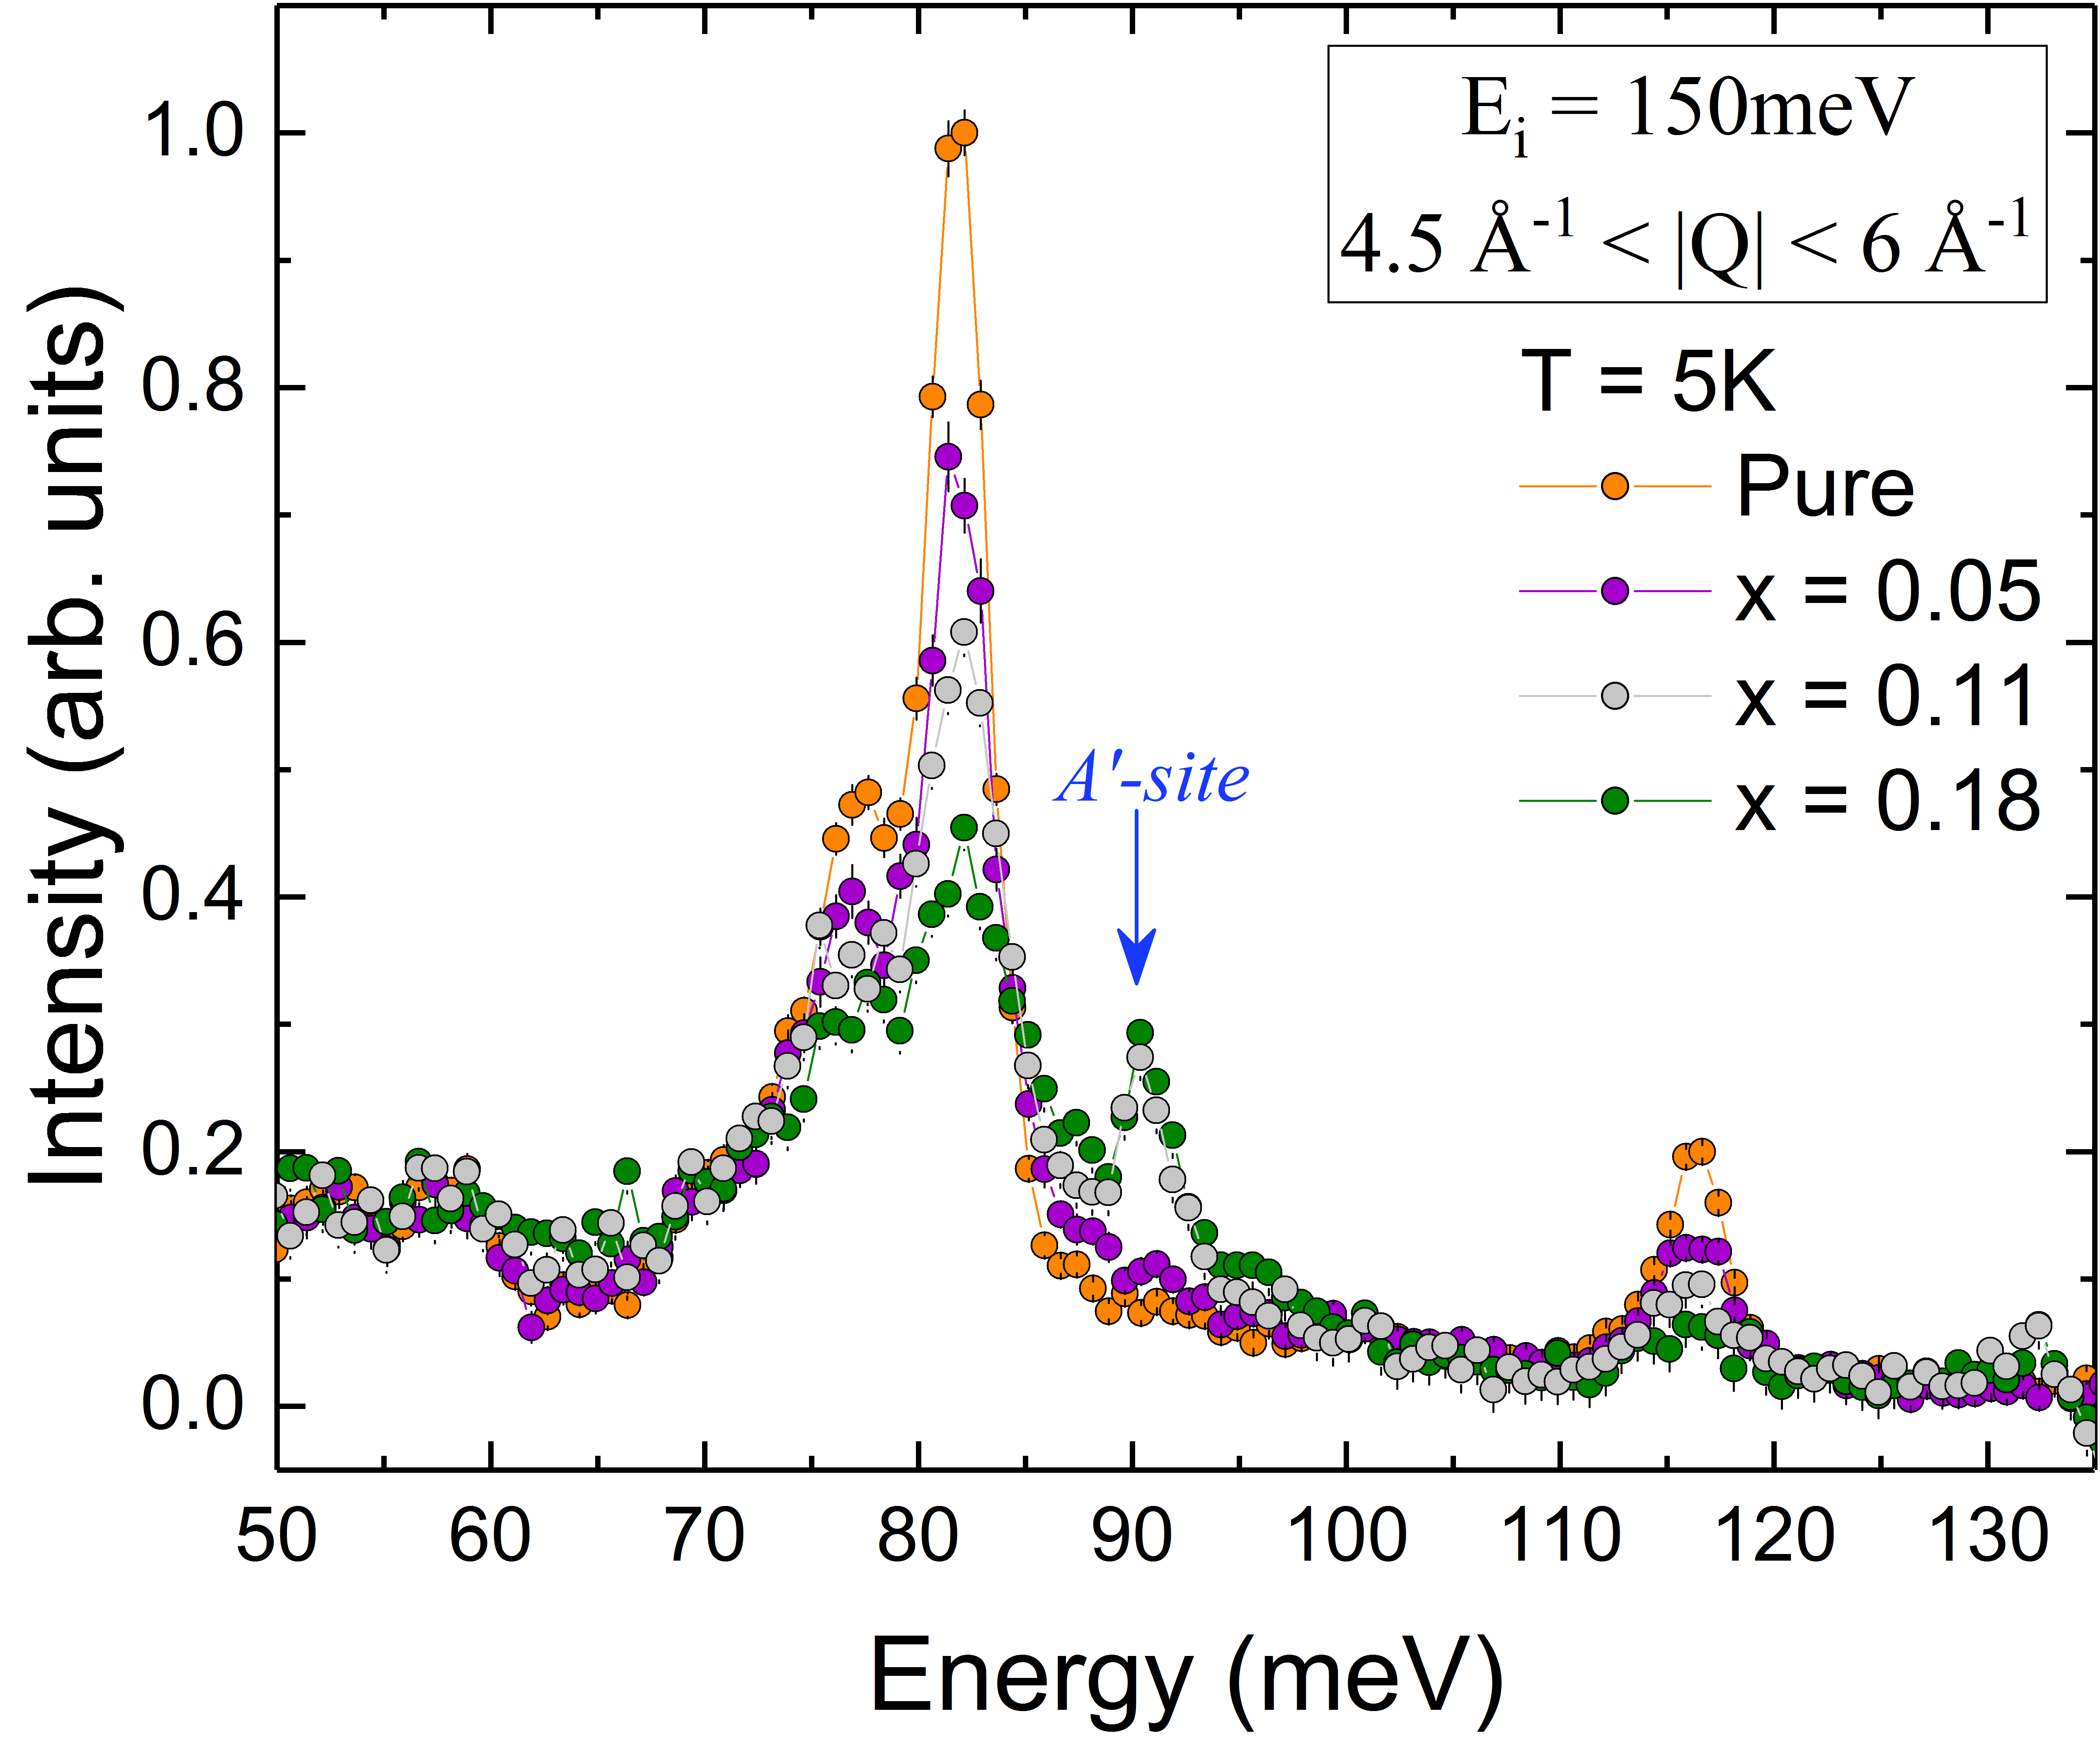
Figure 3 shows a comparison of the data from the four powder Yb2+xTi2-xO7-y samples, using incident neutrons with . The intensity scale has been normalized to sample mass. The stoichiometric, x = 0, and lightly stuffed, x = 0.05, powder samples show only the 3 A site CEF transitions at 76, 81, and 116 meV as previously reported Gaudet et al. (2015). As a function of increasing stuffing, x, we clearly observe the growth of a new CEF at 91 meV, which we will attribute to site Yb3+. A Monte Carlo calculation, shown in the SM, of the prevalence of A to site Yb3+ ions as a function of x, and with y in Yb2+xTi2-xO7-y set to ensure charge neutrality, shows that the normalized intensity of this 91 meV CEF scales in proportion to x.
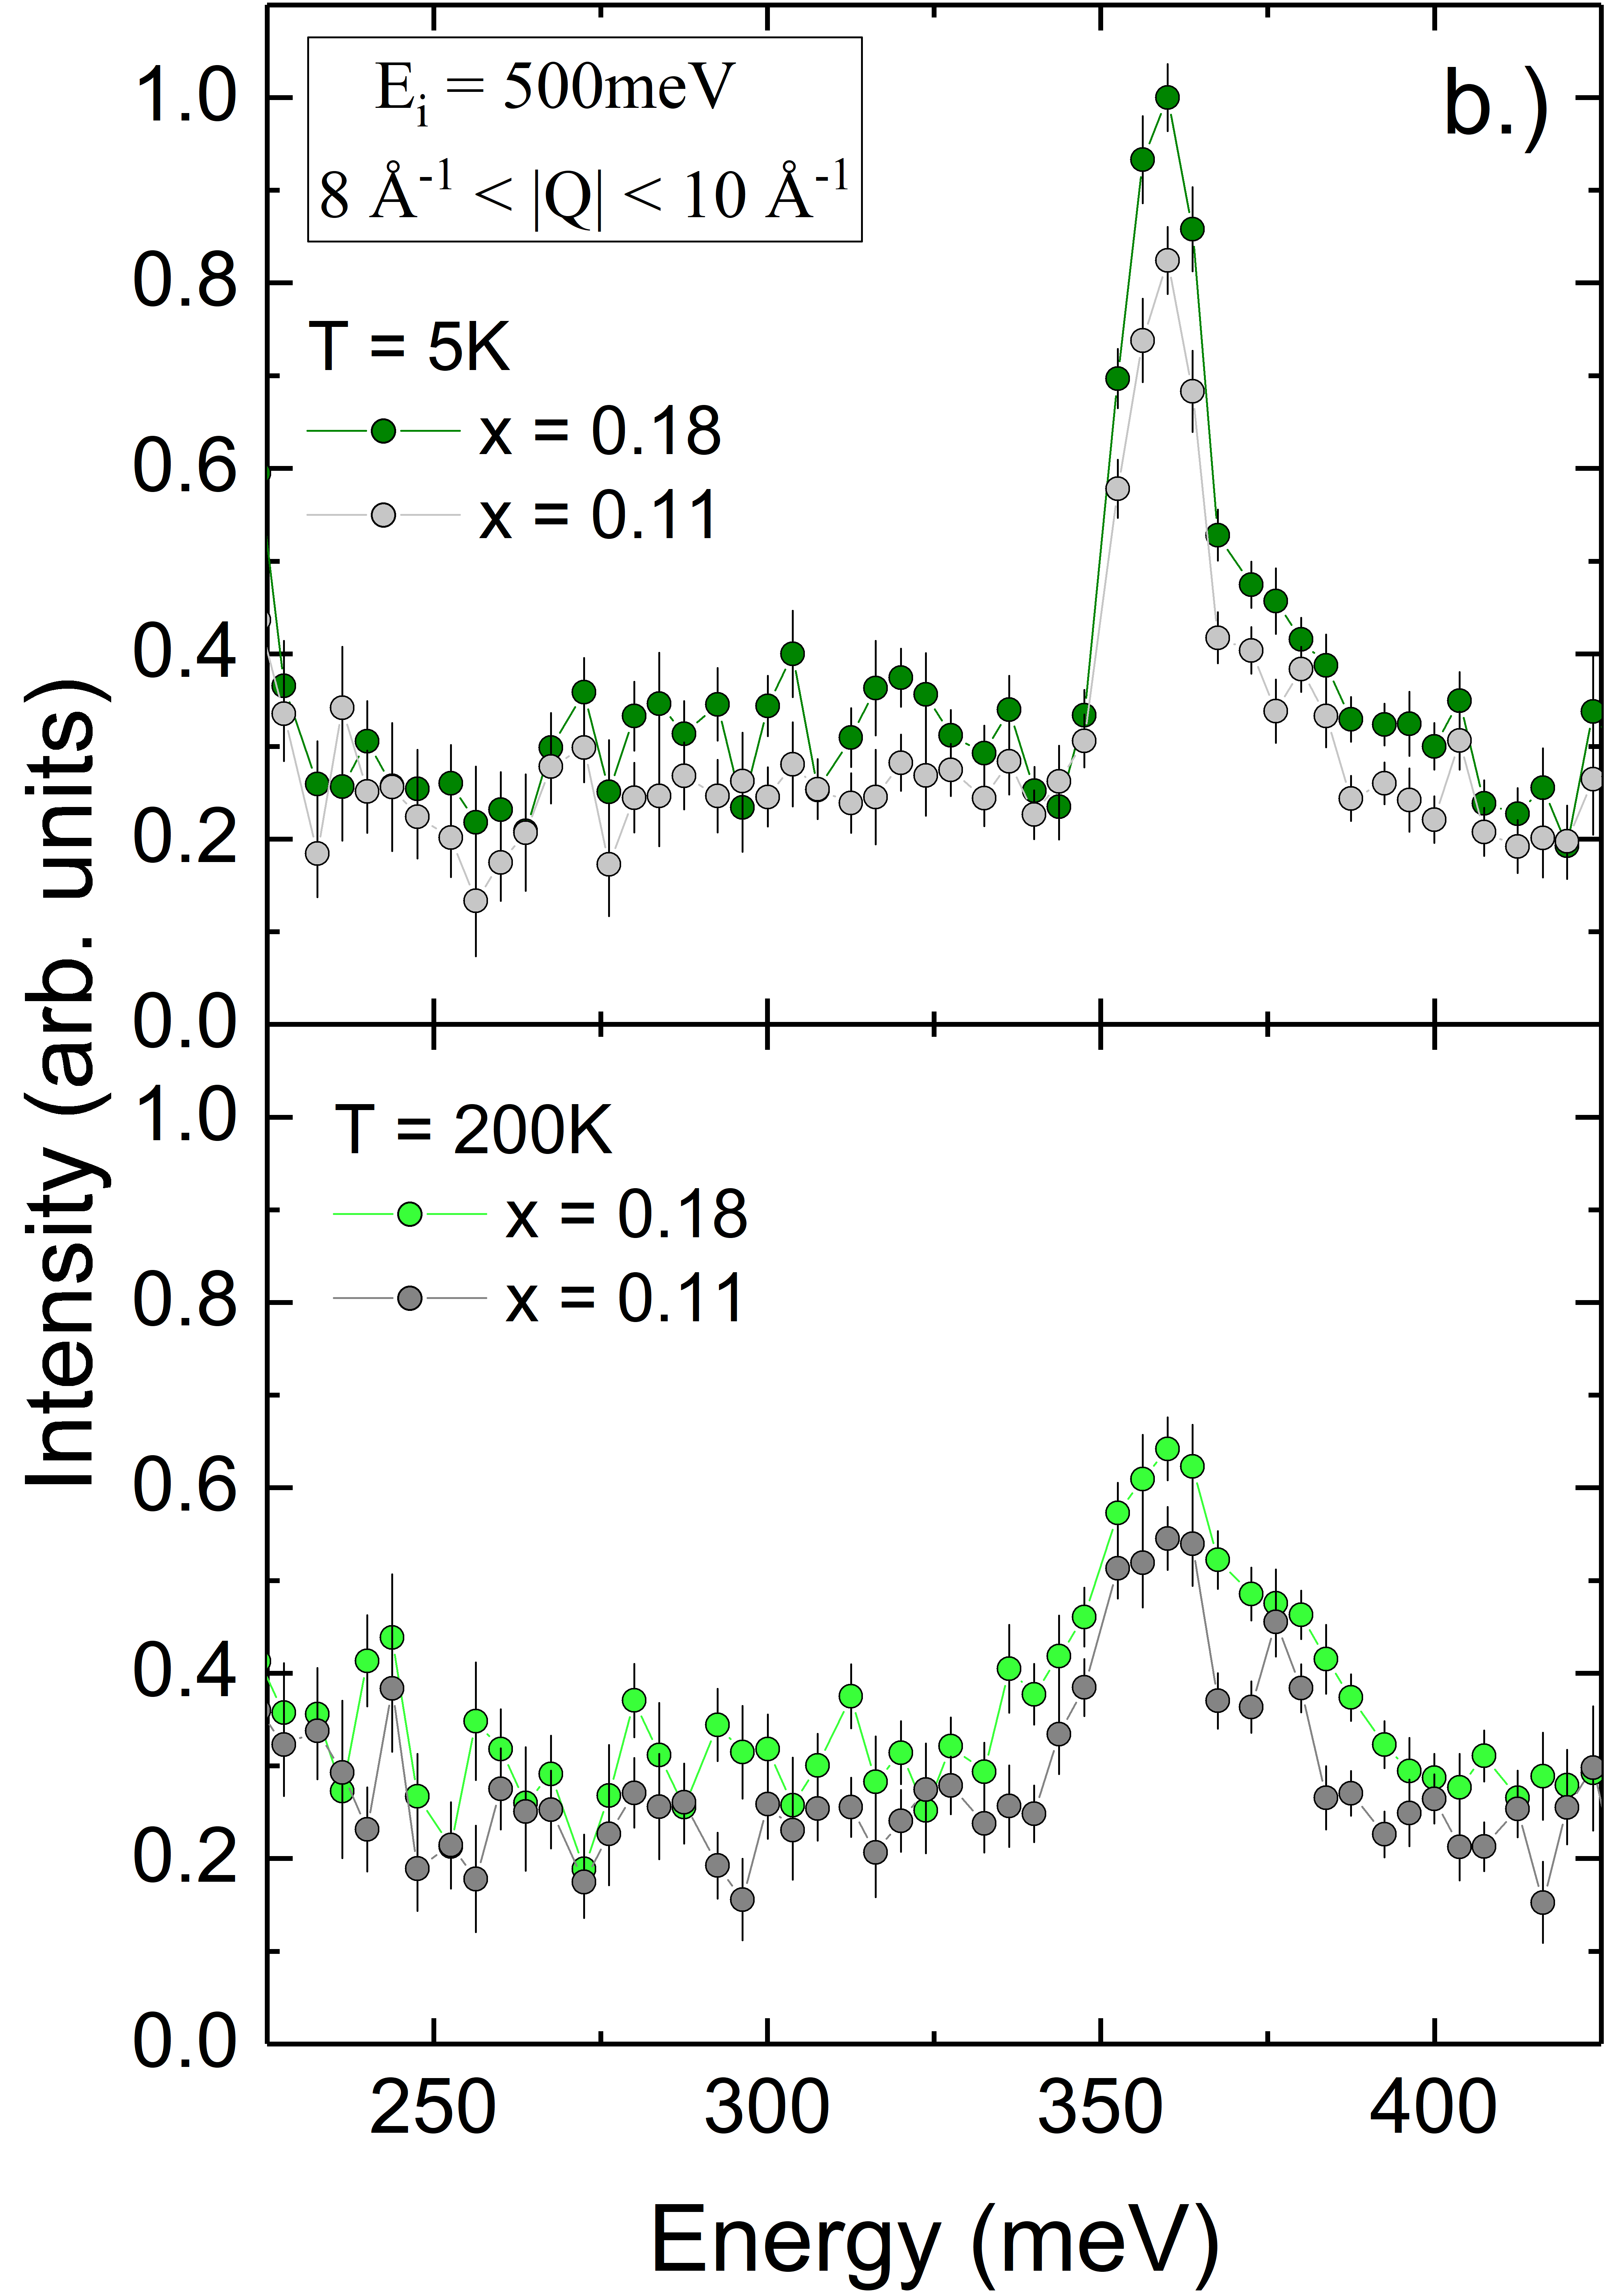
The CEF spectrum at energies above 100 meV is shown in Fig. 4, for the x = 0.11 and 0.18 powder samples, as measured with neutrons. One observes clear excitations above the 116 meV CEF excitation associated with the stoichiometric A site’s most energetic CEF level. Of particular note is the well isolated CEF excitation at 358 meV which we associate with Yb3+ at the B site, and whose intensity scales between the x = 0.11 and 0.18 powder samples in proportion to x. The stoichiometric (x = 0) and lightly stuffed (x = 0.05) powder samples were measured at high energies with Ei = 700 meV neutrons, and the 358 meV CEF excitation is not visible for either.
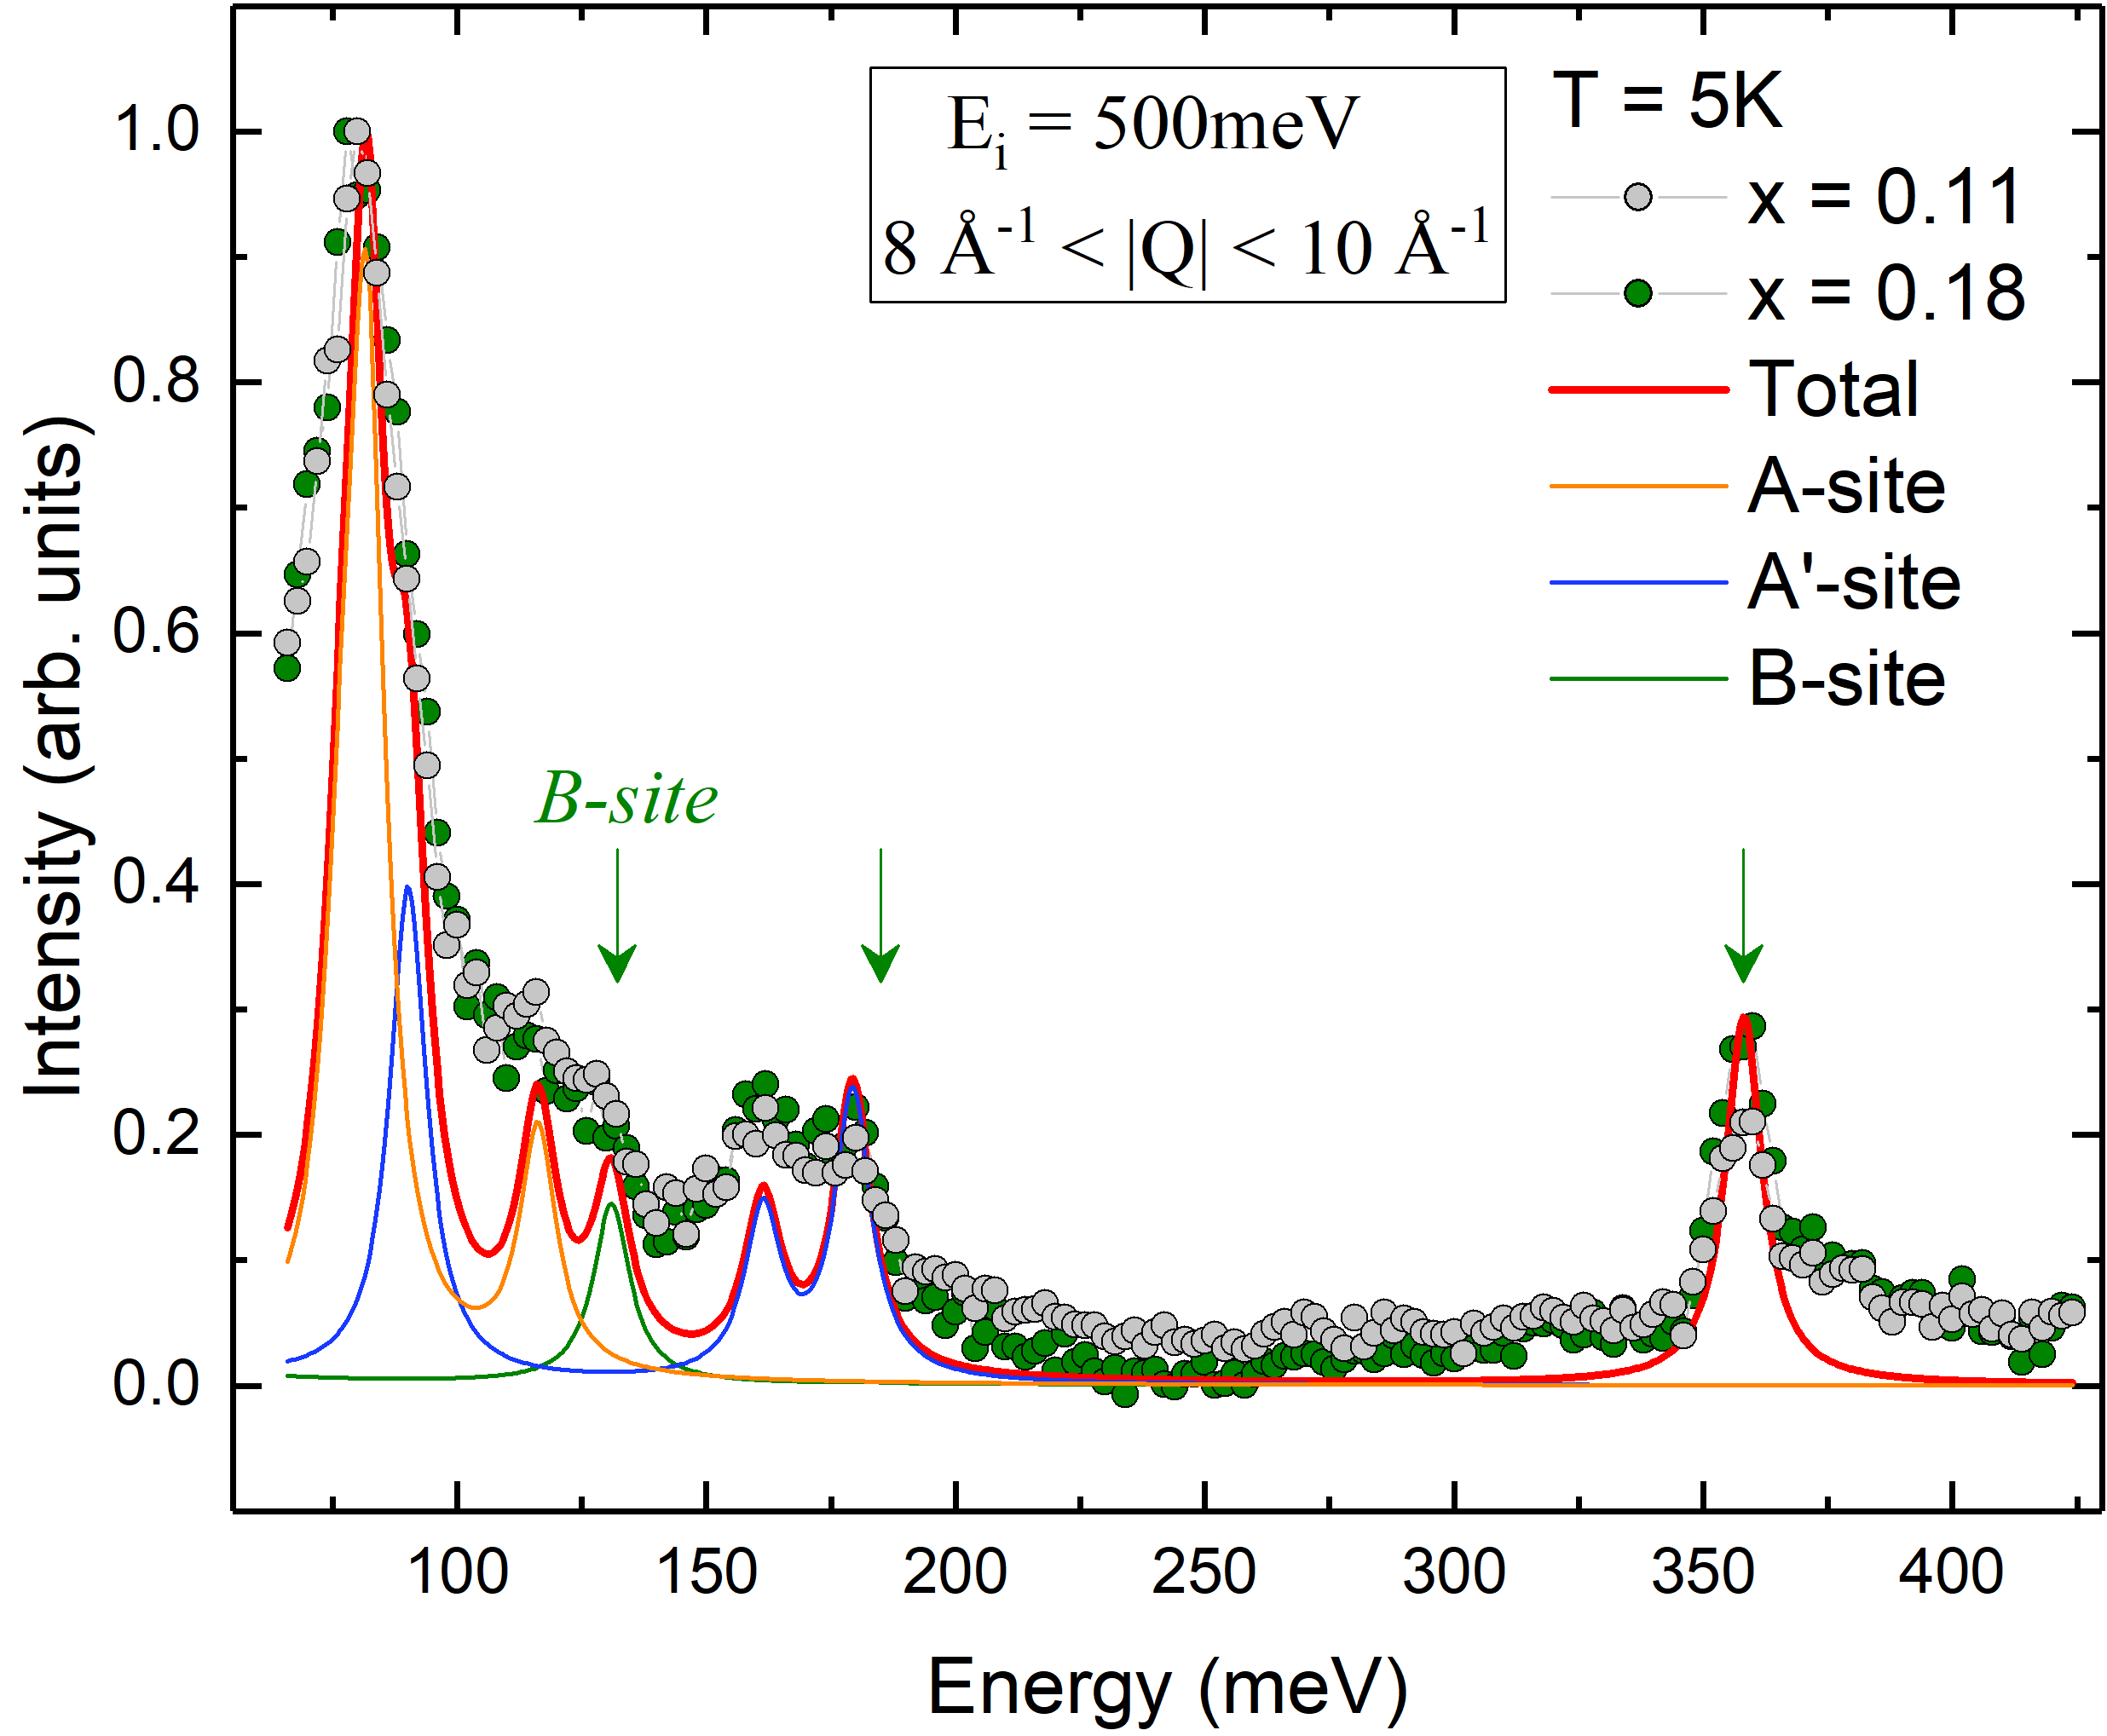
The energies and relative intensities of all the CEF excitations measured below 400 meV were fit as described above, assuming the CEF parameters previously established for the stoichiometric x = 0 sample Gaudet et al. (2015). The results are shown as the solid lines in Fig. 4, with the new CEF parameters and energies for the site and B site tabulated along with those of the A site Yb3+ in the SM. The description of all CEF levels below 400 meV is very good, and the resulting CEF energy eigenvalues are shown for the A, and B site Yb3+ in the top panel of Fig. 2. The bandwidth of the CEF excitations is much larger for Yb3+ in the defective environments, with the defective B site environment giving the largest bandwidth, consistent with this Yb3+ ion experiencing the largest electric fields and their gradients.
The determination of the CEF parameters allows a determination of the g-tensor characterising the anisotropy, as well as the moment size associated with the ground state doublet of Yb3+ at the A, and B sites. The resulting eigenfunctions within the Yb3+ ground state doublets are shown in the bottom panel of Fig. 2. The corresponding anisotropic g-tensor values are , for Yb3+ at the A site; , for Yb3+ at the site; and , for Yb3+ at the B site. The A site Yb3+ moment was previously known to display XY anisotropy Gaudet et al. (2015). These results show both the site and B site Yb3+ moments to possess Ising-like anisotropies, with the B site Yb3+ Ising anisotropy being stronger than that associated with the site. Such a change in anisotropy between stoichiometric and defective Yb3+ sites was predicted on the basis of point charge calculations, but has now been directly verified with these measurements Gaudet et al. (2015). The ground state moment associated with the A, and B sites are found to be , and , respectivelyGaudet et al. (2015). While dipolar interactions are expected to be relatively weak in Yb2Ti2O7, due to the low moment size, they scale as the square of the moment, and thus larger defective moments would tend to produce a strong, random perturbation on the dipole sum.
It is also clear that the A site CEF transitions develop significant energy broadening with increasing stuffing. This can be broadly appreciated in Fig. 3, and is examined quantitatively in Fig. 5, where attention is focussed on the 116 meV A site Yb3+ CEF transition, which is well separated in energy from any other transition for all powder samples. The energy width of the CEF excitations can be examined by fitting the data, shown in the inset of Fig. 5, utilizing a damped harmonic oscillator (DHO) line shape for the 116 meV CEF transitions. At the energy transfers and temperatures of interest, the DHO can be approximated by a single Lorentzian, the form of which is given by,
| (4) |
This is a Lorentzian function of energy with width centred on the energy of the CEF transition, . This form convolutes both the intrinsic energy width, and that arising from the instrumental resolution, which are assumed to add in quadrature. The intrinsic energy width or inverse lifetime of the 116 meV CEF excitation for each of the stuffed powder samples was extracted from this analysis and is plotted as a function of stuffing, , in Fig. 5.
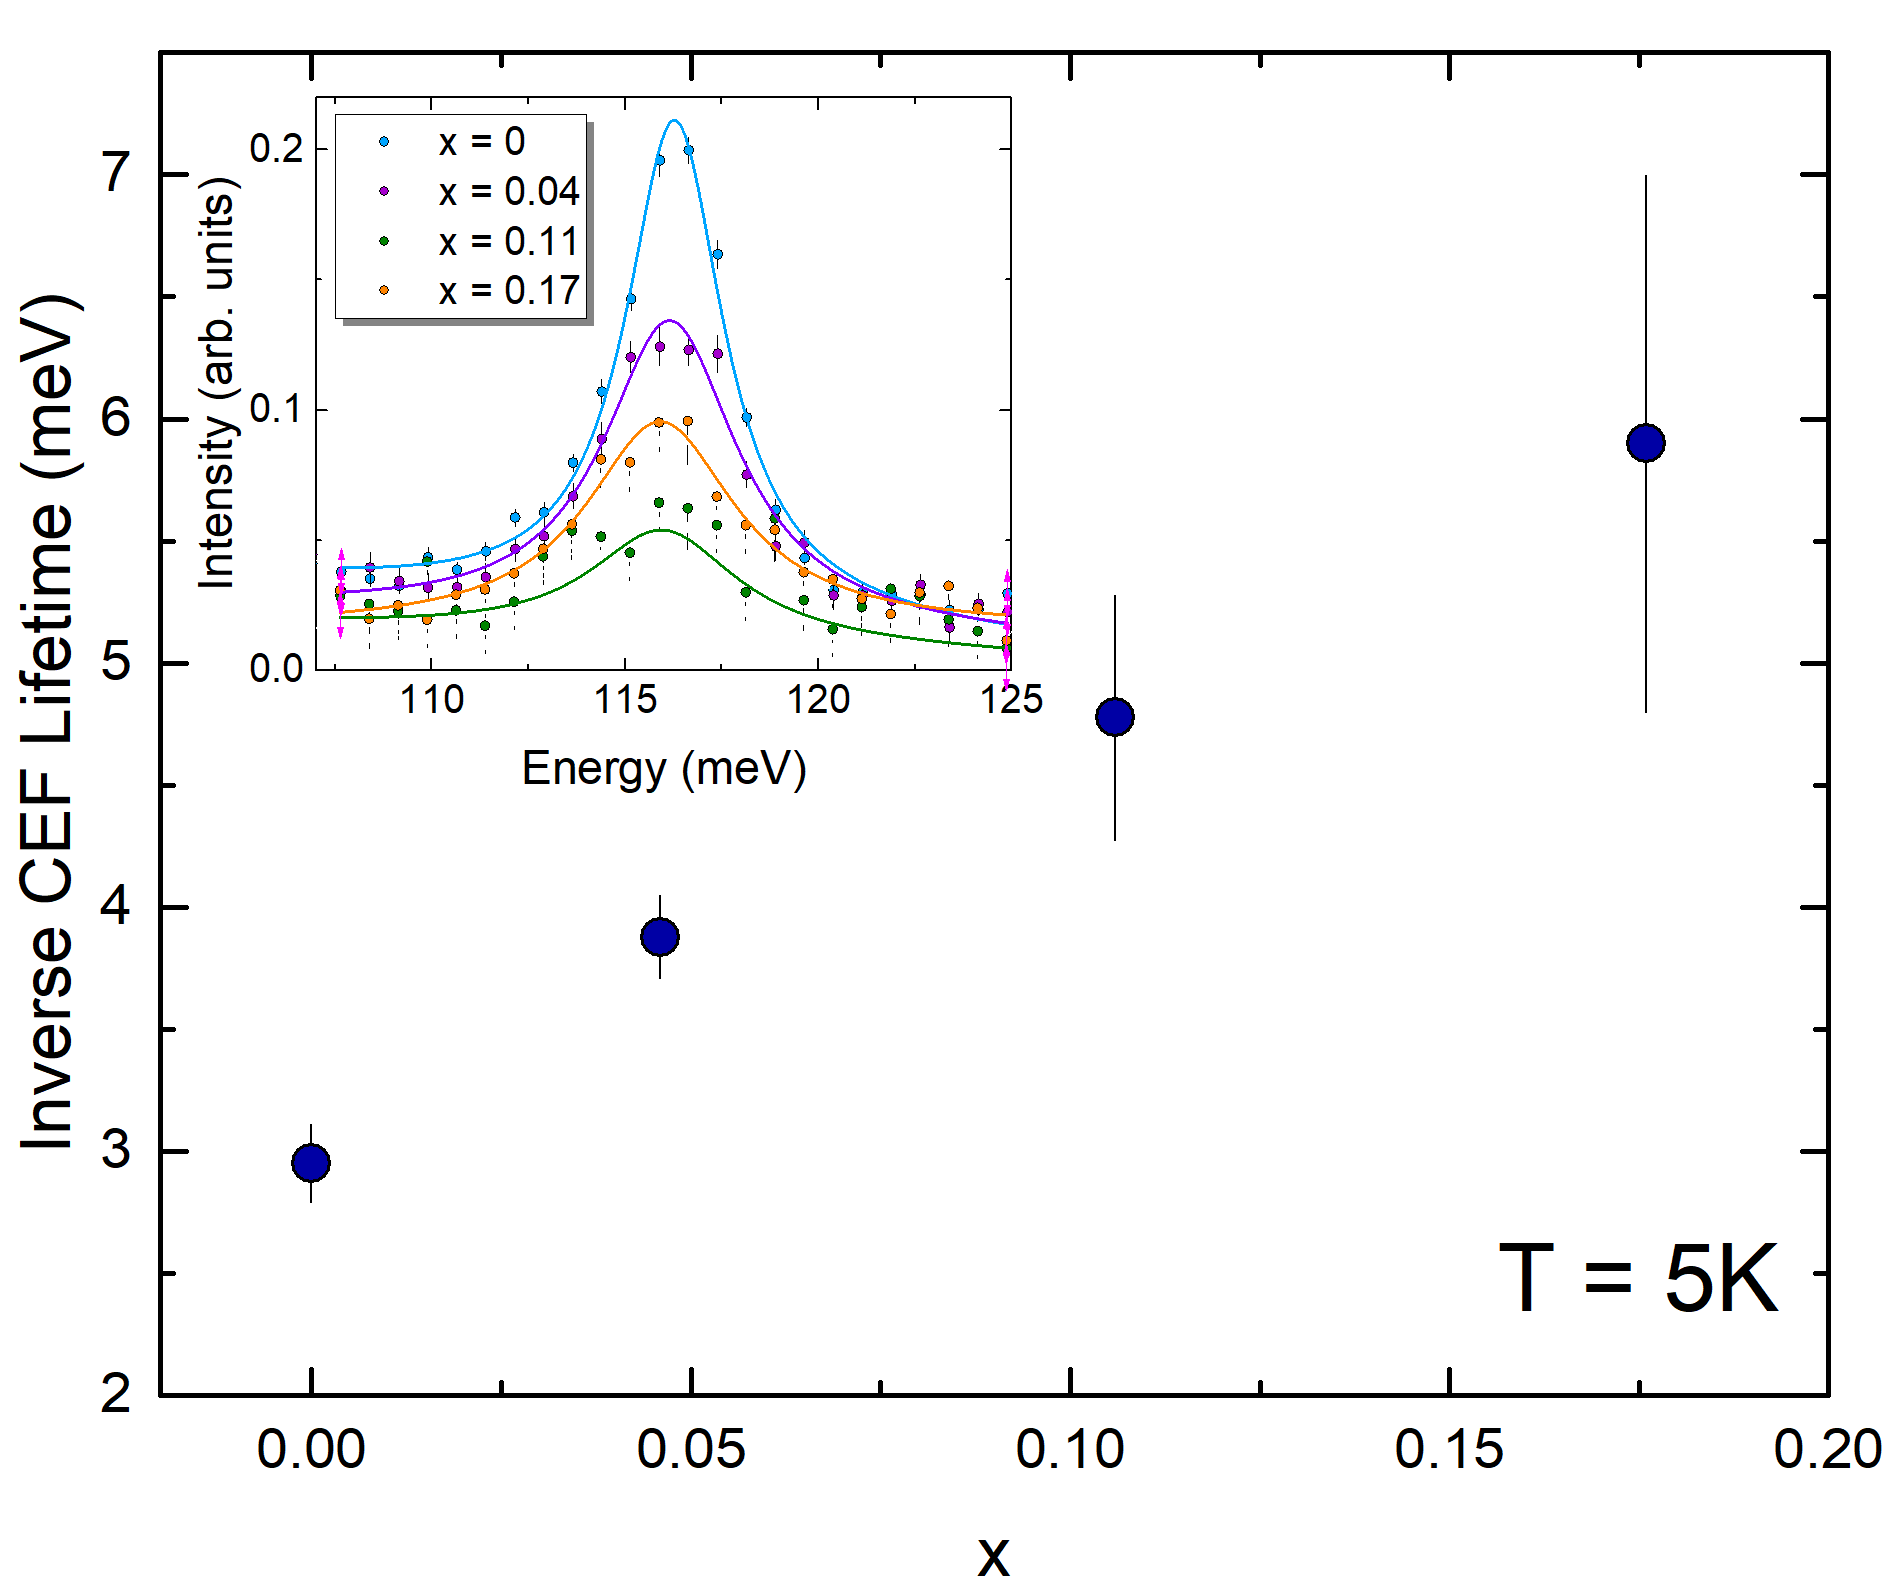
Figure 5 clearly shows the CEF excitations at low temperatures in the stuffed powder samples to display much larger energy widths than that of the stoichiometric sample. The trend for low temperature CEF inverse lifetimes to systematically increase with stuffing, previously reported for the x = 0 and x = 0.05 powder samples Gaudet et al. (2015) is seen to extend to the largest stuffing level studied, x = 0.18.
In conclusion, new time-of-flight neutron spectroscopy allows the possibility of detecting and distinguishing CEF excitations in complex real materials with relatively low levels of defective environments, and we have demonstrated this for the quantum spin ice candidate pyrochlore magnet Yb2+xTi2-xO7-y. Such detailed information is particularly important for the case of Yb2Ti2O7, as its ground state displays unusually strong sensitivity to stoichiometry. Our results specifically show Yb3+ moments in stuffed and oxygen deficient environments display Ising anisotropy, rather than the XY local anisotropy displayed by the stoichiometric moments. Such defective Yb3+ moments are also considerably larger than their stoichiometric counterparts, and these, at a minimum, would tend to randomize dipolar interactions. Both of these manifestations of stuffing can be important for ground state selection in real samples of Yb2+xTi2-xO7-y, and may underlie the ground state’s extreme sensitivity to stoichiometry in this family of quantum magnets.
Research conducted at McMaster University was supported by the Natural Sciences and Engineering Research Council of Canada (NSERC). We acknowledge useful discussions with A. Aczel, L. Balents, G. Ehlers, M. D. Lumsden, S. E. Nagler and K. A. Ross. We are very grateful for the instrument and sample environment support provided during our inelastic neutron scattering measurements. The experiments which were performed at the Spallation Neutron Source at Oak Ridge National Laboratory was sponsored by the US Department of Energy, Office of the Basic Energy Sciences, Scientific User Facilities Division.
References
- Lacroix et al. (2011) C. Lacroix, P. Mendels, and F. Mila, Introduction to Frustrated Magnetism (Springer-Verlag, Berlin Heidelberg, 2011).
- Gardner et al. (2010) J. S. Gardner, M. J. P. Gingras, and J. E. Greedan, Rev. Mod. Phys. 82, 53 (2010).
- Harris et al. (1997) M. J. Harris, S. T. Bramwell, D. F. McMorrow, T. Zeiske, and K. W. Godfrey, Phys. Rev. Lett. 79, 2554 (1997).
- Ramirez et al. (1959) A. P. Ramirez, A. Hayashi, R. J. Cava, R. Siddharthan, and B. S. Shastry, Nature 1, 333 (1959).
- den Hertog and Gingras (2000) B. C. den Hertog and M. J. P. Gingras, Phys. Rev. Lett. 84, 3430 (2000).
- Bramwell and Gingras (2001) S. T. Bramwell and M. J. P. Gingras, Science 294, 1495 (2001).
- Castelnovo et al. (2008) C. Castelnovo, R. Moessner, and S. L. Sondhi, Nature 451, 42 (2008).
- Clark et al. (2014) L. Clark, G. J. Nilsen, E. Kermarrec, G. Ehlers, K. S. Knight, A. Harrison, J. P. Attfield, and B. D. Gaulin, Phys. Rev. Lett. 113, 117201 (2014).
- Petit et al. (2016) S. Petit, E. Lhotel, B. Canals, M. C. Hatnean, J. Ollivier, H. Mutka, E. Ressouche, A. R. Wildes, M. R. Lees, and G. Balakrishnan, Nature Physics 12, 746 (2016).
- Thompson et al. (2011a) J. D. Thompson, P. A. McClarty, and M. J. P. Gingras, J. Phys.: Condens. Matter 23, 164219 (2011a).
- Thompson et al. (2011b) J. D. Thompson, P. A. McClarty, H. M. R. nnow, L. P. Regnault, A. Sorge, and M. J. P. Gingras, Phys. Rev. Lett. 106, 187202 (2011b).
- Ross et al. (2011a) K. A. Ross, L. Savary, B. D. Gaulin, and L. Balents, Phys. Rev. X 1, 021002 (2011a).
- Savary and Balents (2012) L. Savary and L. Balents, Phys. Rev. Lett. 108, 037202 (2012).
- Applegate et al. (2012) R. Applegate, N. R. Hayre, R. R. P. Singh, T. Lin, A. G. R. Day, and M. J. P. Gingras, Phys. Rev. Lett. 109, 097205 (2012).
- Benton et al. (2012) O. Benton, O. Sikora, and N. Shannon, Phys. Rev. B 86, 075154 (2012).
- Hayre et al. (2013) N. R. Hayre, K. A. Ross, R. Applegate, T. Lin, R. R. P. Singh, B. D. Gaulin, and M. J. P. Gingras, Phys. Rev. B 87, 184423 (2013).
- Savary and Balents (2013) L. Savary and L. Balents, Phys. Rev. B 87, 205130 (2013).
- D’Ortenzio et al. (2013) R. M. D’Ortenzio, H. A. Dabkowska, S. R. Dunsiger, B. D. Gaulin, M. J. P. Gingras, T. Goko, J. B. Kycia, L. Liu, T. Medina, T. J. Munsie, D. Pomaranski, K. A. Ross, Y. J. Uemura, T. J. Williams, and G. M. Luke, Phys. Rev. B 88, 134428 (2013).
- Kimura et al. (2013) K. Kimura, S. Nakatsuji, J.-J. Wen, C. Broholm, M. B. Stone, E. Nishibori, and H. Sawa, Nat. Commun. 4, 1934 (2013).
- Gingras and McClarty (2014) M. J. P. Gingras and P. A. McClarty, Rep. Prog. Phys. 77, 056501 (2014).
- Pan et al. (2014) L. D. Pan, S. W. Kim, A. Ghosh, C. M. Morris, K. A. Ross, E. Kermarrec, B. D. Gaulin, S. M. Koohpayeh, O. Tchernyshyov, and N. P. Armitage, Nat. Commun. 5, 4970 (2014).
- Robert et al. (2015) J. Robert, E. Lhotel, G. Remenyi, S. Sahling, I. Mirebeau, C. Decorse, B. Canals, and S. Petit, Phys. Rev. B 92, 064425 (2015).
- Pan et al. (2016) L. D. Pan, N. J. Laurita, K. A. Ross, B. D. Gaulin, and N. P. Armitage, Nat. Phys. 12, 361 (2016).
- Hamachi et al. (2016) N. Hamachi, Y. Yasui, K. Araki, S. Kittaka, and T. Sakakibara, AIP Advances 6, 055707 (2016).
- Blöte et al. (1969) H. Blöte, R. Wielinga, and W. Huiskamp, Physica 43, 549 (1969).
- de Réotier et al. (2006) P. D. de Réotier, V. Glazkov, C. Marina, A. Yaouanc, P. C. M. Gubbens, S. Sakarya, P. Bonville, A. Amato, C. Baines, and P. J. C. King, Physica B 374, 145 (2006).
- Yaouanc et al. (2011) A. Yaouanc, P. D. de Réotier, C. Marin, and V. Glazkov, Phys. Rev. B 84, 172408 (2011).
- Ross et al. (2012) K. A. Ross, T. Proffen, H. A. Dabkowska, J. A. Quilliam, L. R. Yaraskavitch, J. B. Kycia, and B. D. Gaulin, Phys. Rev. B 86, 174424 (2012).
- Hallas et al. (2017) A. M. Hallas, J. Gaudet, and B. D. Gaulin, (2017), arXiv:1708.01312 [cond-mat] .
- Yasui et al. (2003) Y. Yasui, M. Soda, S. Iikubo, M. Ito, M. Sato, N. Hamaguchi, T. Matsushita, N. Wada, T. Takeuchi, N. Aso, and K. Kakurai, J. Phys. Soc. Jpn. 72, 3014 (2003).
- Chang et al. (2012) L.-J. Chang, S. Onoda, Y. Su, Y. J. Kao, K. D. Tsuei, Y. Yasui, K. Kakurai, and M. R. Lees, Nat. Commun. 3, 992 (2012).
- Gaudet et al. (2016) J. Gaudet, K. A. Ross, E. Kermarrec, N. P. Butch, G. Ehlers, H. A. Dabkowska, and B. D. Gaulin, Phys. Rev. B 93, 064406 (2016).
- Yaouanc et al. (2016) A. Yaouanc, P. D. de Réotier, L. Keller, B. Roessli, and A. Forget, J. Phys.: Condens. Matter 28, 426002 (2016).
- Scheie et al. (2017) A. Scheie, J. Kindervater, S. Säubert, C. Duvinage, C. Pfleiderer, H. J. Changlani, S. Zhang, L. Harriger, K. Arpino, S. . Koohpayeh, O. Tchernyshyov, and C. Broholm, Phys. Rev. Lett. 119, 127201 (2017).
- Ross et al. (2009) K. A. Ross, J. P. C. Ruff, C. P. Adams, J. S. Gardner, H. A. Dabkowska, Y. Qiu, J. R. D. Copley, and B. D. Gaulin, Phys. Rev. Lett. 103, 227202 (2009).
- Ross et al. (2011b) K. A. Ross, L. R. Yaraskavitch, M. Laver, J. S. Gardner, J. A. Quilliam, S. Meng, J. B. Kycia, D. K. S. T. Proffen, H. A. Dabkowska, and B. D. Gaulin, Phys. Rev. B 84, 174442 (2011b).
- Hodges et al. (2002) J. A. Hodges, P. Bonville, A. Forget, A. Yaouanc, P. D. de Réotier, G. André, M. Rams, K. Królas, C. Ritter, P. C. M. Gubbens, C. T. Kaiser, P. J. C. King, and C. Baines, Phys. Rev. Lett 88, 077204 (2002).
- Yaouanc et al. (2003) A. Yaouanc, P. D. de Réotier, P. Bonville, J. A. Hodges, P. C. M. Gubbens, C. T. Kaiser, and S. Sakarya, Physica B: Condens. Matter 326, 456 (2003).
- Gardner et al. (2004) J. S. Gardner, G. Ehlers, N. Rosov, R. W. Erwin, and C. Petrovic, Phys. Rev. B 70, 180404 (2004).
- Bhattacharjee et al. (2016) S. Bhattacharjee, S. Erfanifam, E. L. Green, M. Naumann, Z. Wang, S. Granovsky, M. Doerr, J. Wosnitza, A. A. Zvyagin, R. Moessner, A. Maljuk, S. Wurmehl, B. Büchner, and S. Zherlitsyn, Phys. Rev. B 93, 144412 (2016).
- Bonville et al. (2004) P. Bonville, J. A. Hodges, E. Bertin, J. P. Bouchaud, P. D. de Réotier, L. P. Regnault, H. M. R. nnow, J. P. Sanchez, S. Sosin, and A. Yaouanc, Hyperfine Interact. 156, 103 (2004).
- Arpino et al. (2017) K. E. Arpino, B. A. Trump, A. O. Scheie, T. M. McQueen, and S. M. Koohpayeh, Phys. Rev. B 95, 094407 (2017).
- Mostaed et al. (2017) A. Mostaed, G. Balakrishnan, M. R. Lees, Y. Yasui, L.-J. Chang, and R. Beanland, Phys. Rev. B 95, 094431 (2017).
- Pecanha-Antonio et al. (2017) V. Pecanha-Antonio, E. Feng, Y. Su, V. Pomjakushin, F. Demmel, L.-J. Chang, R. J. Aldus, Y. Xiao, M. R. Lees, and T. Brückel, (2017), arXiv:1709.01013 [cond-mat] .
- Thompson et al. (2017) J. D. Thompson, P. A. McClarty, D. Prabhakaran, I. Cabrera, T. Guidi, and R. Coldea, Phys. Rev. Lett. 119, 057203 (2017).
- Lhotel et al. (2014) E. Lhotel, S. R. Giblin, M. R. Lees, G. Balakrishnan, L. J. Chang, and Y. Yasui, Phys. Rev. B 89, 224419 (2014).
- Baroudi et al. (2015) K. Baroudi, B. D. Gaulin, S. H. Lapidus, J. Gaudet, and R. J. Cava, Phys. Rev. B 92, 024110 (2015).
- Kermarrec et al. (2017) E. Kermarrec, J. Gaudet, K. Fritsch, R. Khasanov, Z. Guguchia, C. Ritter, K. A. Ross, H. A. Dabkowska, and B. D. Gaulin, Nat. Commun. 3, 14810 (2017).
- Gaudet et al. (2015) J. Gaudet, D. D. Maharaj, G. Sala, E. Kermarrec, K. A. Ross, H. A. Dabkowska, A. I. Kolesnikov, G. E. Granroth, and B. D. Gaulin, Phys. Rev. B 92, 134420 (2015).
- Rosenkranz et al. (2000) S. Rosenkranz, A. P. Ramirez, A. Hayashi, R. J. Cava, R. Siddharthan, and B. S. Shastry, J. Appl. Phys. 87, 5914 (2000).
- Bertin et al. (2012) A. Bertin, Y. Chapuis, P. D. de Réotier, and A. Yaouanc, J. Phys. Condens. Matter 24, 256003 (2012).
- Huq et al. (2011) A. Huq, J. P. Hodges, O. Gourdon, and L. Heroux, Z. Kristallogr. Proc. 1, 127 (2011).
- Granroth et al. (2010) G. E. Granroth, A. I. Kolesnikov, T. E. Sherline, J. P. Clancy, K. A. Ross, J. P. Ruff, B. D. Gaulin, and S. E. Nagler, J. Phys. Conf. Ser. 251, 12058 (2010).
- Arnold et al. (2014) O. Arnold, J. C. Bilheux, J. M. Borreguero, A. Buts, S. I. Campbell, L. Chapon, M. Doucet, N. Draper, R. F. Leal, M. A. Gigg, V. E. Lynch, A. Markvardsen, D. J. Mikkelson, R. L. Mikkelson, R. Miller, K. Palmen, P. Parker, G. Passos, T. G. Perring, P. F. Peterson, S. Ren, M. A. Reuter, A. T. Savici, J. W. Taylor, R. J. Taylor, R. Tolchenov, W. Zhou, and J. Zikovsky, Nucl. Instr. Meth Phys. Res. A. 764, 156 (2014).
- Azuah et al. (2009) R. T. Azuah, L. R. Kneller, Y. Qiu, P. L. W. Tregenna-Piggott, C. M. Brown, J. R. D. Copley, and R. M. Dimeo, J. Res. Natl. Inst. Stand. Technol. 114, 341 (2009).
- Hutchings (1964) M. T. Hutchings, Solid State Physics - Advances in Research and Applications, edited by F. Seitz and D. Turnbull, Vol. 16 (Academic Press, New York, 1964) pp. 227–273.
- Freeman and Watson (1962) A. J. Freeman and R. E. Watson, Phys. Rev. 127, 2058 (1962).
- Malkin et al. (2004) B. Z. Malkin, A. R. Zakirov, M. N. Popova, S. A. Klimin, E. P. Chukalina, E. Antic-Fidancev, P. Goldner, P. Aschehoug, and G. Dhalenne, Phys. Rev. B 70, 075112 (2004).
- Walter (1984) U. Walter, J. Phys. Chem. Solids 45, 401 (1984).
- Sala et al. (2014) G. Sala, M. J. Gutmann, D. Prabhakaran, D. Pomaranski, C. Mitchelitis, J. B. Kycia, D. G. Porter, C. Castelnovo, and J. P. Goff, Nat. Mater. 13, 488 (2014).
- Prather (1961) J. L. Prather, Nat. Bur. Stand. (U.S.), Monogr. 19 (1961).
- Stevens (1952) K. W. H. Stevens, Proc. Phys. Soc. A 65, 209 (1952).
- Squires (1978) G. L. Squires, Introduction to the Theory of Thermal Neutron Scattering (Cambridge University Press, Cambridge, UK, 1978).
- Dabkowska and Dabkowski (2010) H. A. Dabkowska and A. B. Dabkowski, Springer Handbook of Crystal Growth, edited by G. Dhanaraj, K. Byrappa, V. Prasad, and M. Dudley (Springer-Verlag, Berlin Heidelberg, 2010) Chap. 12.
- Petricek et al. (2014) V. Petricek, M. Dusek, and L. Palatinus, Z. Kristallogr. 229, 345 (2014).
I Supplemental Material: Crystal field excitations from ions at defective sites in highly stuffed
In this supplemental information we show the details of the crystal field calculation with which we analysed the neutron scattering data. We also highlight several details of the inelastic neutron scattering spectrum as a function of temperature. Finally we discuss sample preparation and refinement of the neutron powder diffraction data for the two highly stuffed samples of .
I.1 A. Crystal Field Program
In order to analyse the neutron scattering data and fit the Crystal Electric Field (CEF) excitations we developed a calculation based on the point charge model Hutchings (1964) and on the Stevens’ formalism Stevens (1952). The former neglects the overlap between the orbitals and any relativistic corrections, while the latter is a mathematical tool to write an expansion of the Coulomb potential of the crystal based on the symmetries of the environment that surrounds the magnetic ion. In our samples, the magnetic rare earth ion is sitting at 3 different environments: stoichiometric sites, oxygen deficient sites and sites. Figure 2 in the main paper shows these 3 environments. Notice that we rotated the reference system in order to align the local direction along .
In general the Coulomb potential of the crystal can be expressed using a linear combination of tesseral harmonics as follows,
| (5) |
Here is the charge of the ligand, is the position of the ligand and is the tesseral harmonic Hutchings (1964).
If we centre our reference system on the magnetic ion, we can rewrite the previous equation in this way,
| (6) |
where for ligands,
| (7) |
Equation 7 gives the coefficients of the linear combination of the tesseral harmonics. For every point group, only a few terms in the expansion are non zero (see Ref. Walter (1984)), and these terms coincide with the number of Stevens Operators we use in our Hamiltonian.
The point group of both the scalenohedron and the trigonal anti-prism is and thus, following Prather’s convention Prather (1961), only the terms and survive in our expansion. This convention states that the highest rotational axis of the system must be rotated along and one of the axis along , assuring in this way that we have the minimum number of terms in the Coulomb expansion.
Finally we can use the so called “Stevens Operators Equivalence Method” to evaluate the matrix elements of the crystalline potential between coupled wave functions specified by one particular value of the total angular momentum . This method states that, if is a Cartesian function of given degree, then to find the operator equivalent to such a term one replaces , , with , , respectively, keeping in mind the commutation rules between these operators. This is done by replacing products of , , by the appropriate combinations of , , , divided by the total number of combinations. Note that, although it is conventional to use or in the equivalent operator method, all factors of are dropped when evaluating the matrix elements.
As we are studying the ground state (GS) of a rare-earth system, without an external field applied, , , and are good quantum numbers. Thus the Crystal Field Hamiltonian can now be written as:
| (8) |
where is the same coefficient as in Eq. 7, is the electron charge, is the vacuum permittivity, is the expectation value of the radial part of the wave function, is a numerical factor that depends on the rare earth ion Hutchings (1964), is a constant to normalize the tesseral harmonics and are the Stevens Operators.
The terms are commonly called Crystal Field Parameters, and they coincide with the parameters we fit in our calculation. A general form of the Hamiltonian for our system is therefore:
| (9) |
It is easy to verify that the equations are not linear, so we cannot write a closed system to solve the problem and identify a unique solution. In general a common way to solve non linear equations is to create a function that closely approximates the result. We thus decided to use our Hamiltonian as a function of six CEF parameters, that are simultaneously fit to quantities of interests such as the energy of the excitations, the spectrum and the relative intensities of the levels. The quantity that the calculation minimizes is:
| (10) |
where is the calculated quantity of interest and is the observed quantity.
Following this spirit, the logic of the calculation is the following:
-
1.
Starting with an initial set of CEF parameters, that can be calculated from first principles or taken from literature, we diagonalize our CEF Hamiltonian.
-
2.
The eigenvalues are rescaled respect to the GS energy and we calculate and normalize the intensities and the CEF spectrum .
-
3.
is calculated using Eq. 10.
-
4.
The procedure is iterated using another set of CEF parameters in order to minimize until we converge on a solution which best estimates the experimental results.
The minimization algorithm is robust and it assures the convergence towards a global minimum. The final CEF parameters are then used to calculate the spectrum for a direct comparison with the data set. Table 1 shows the best CEF parameters which were found minimize in the fitting procedure along with the energy eigenvalues corresponding to the CEF excitations of ions out of the ground state at the , and sites.
| Crystal Field Parameters (meV) | ||
| A Site | Site | B Site |
| Calculated Spectrum (meV) | ||
I.2 B. Temperature Evolution of the Crystal Field Excitations
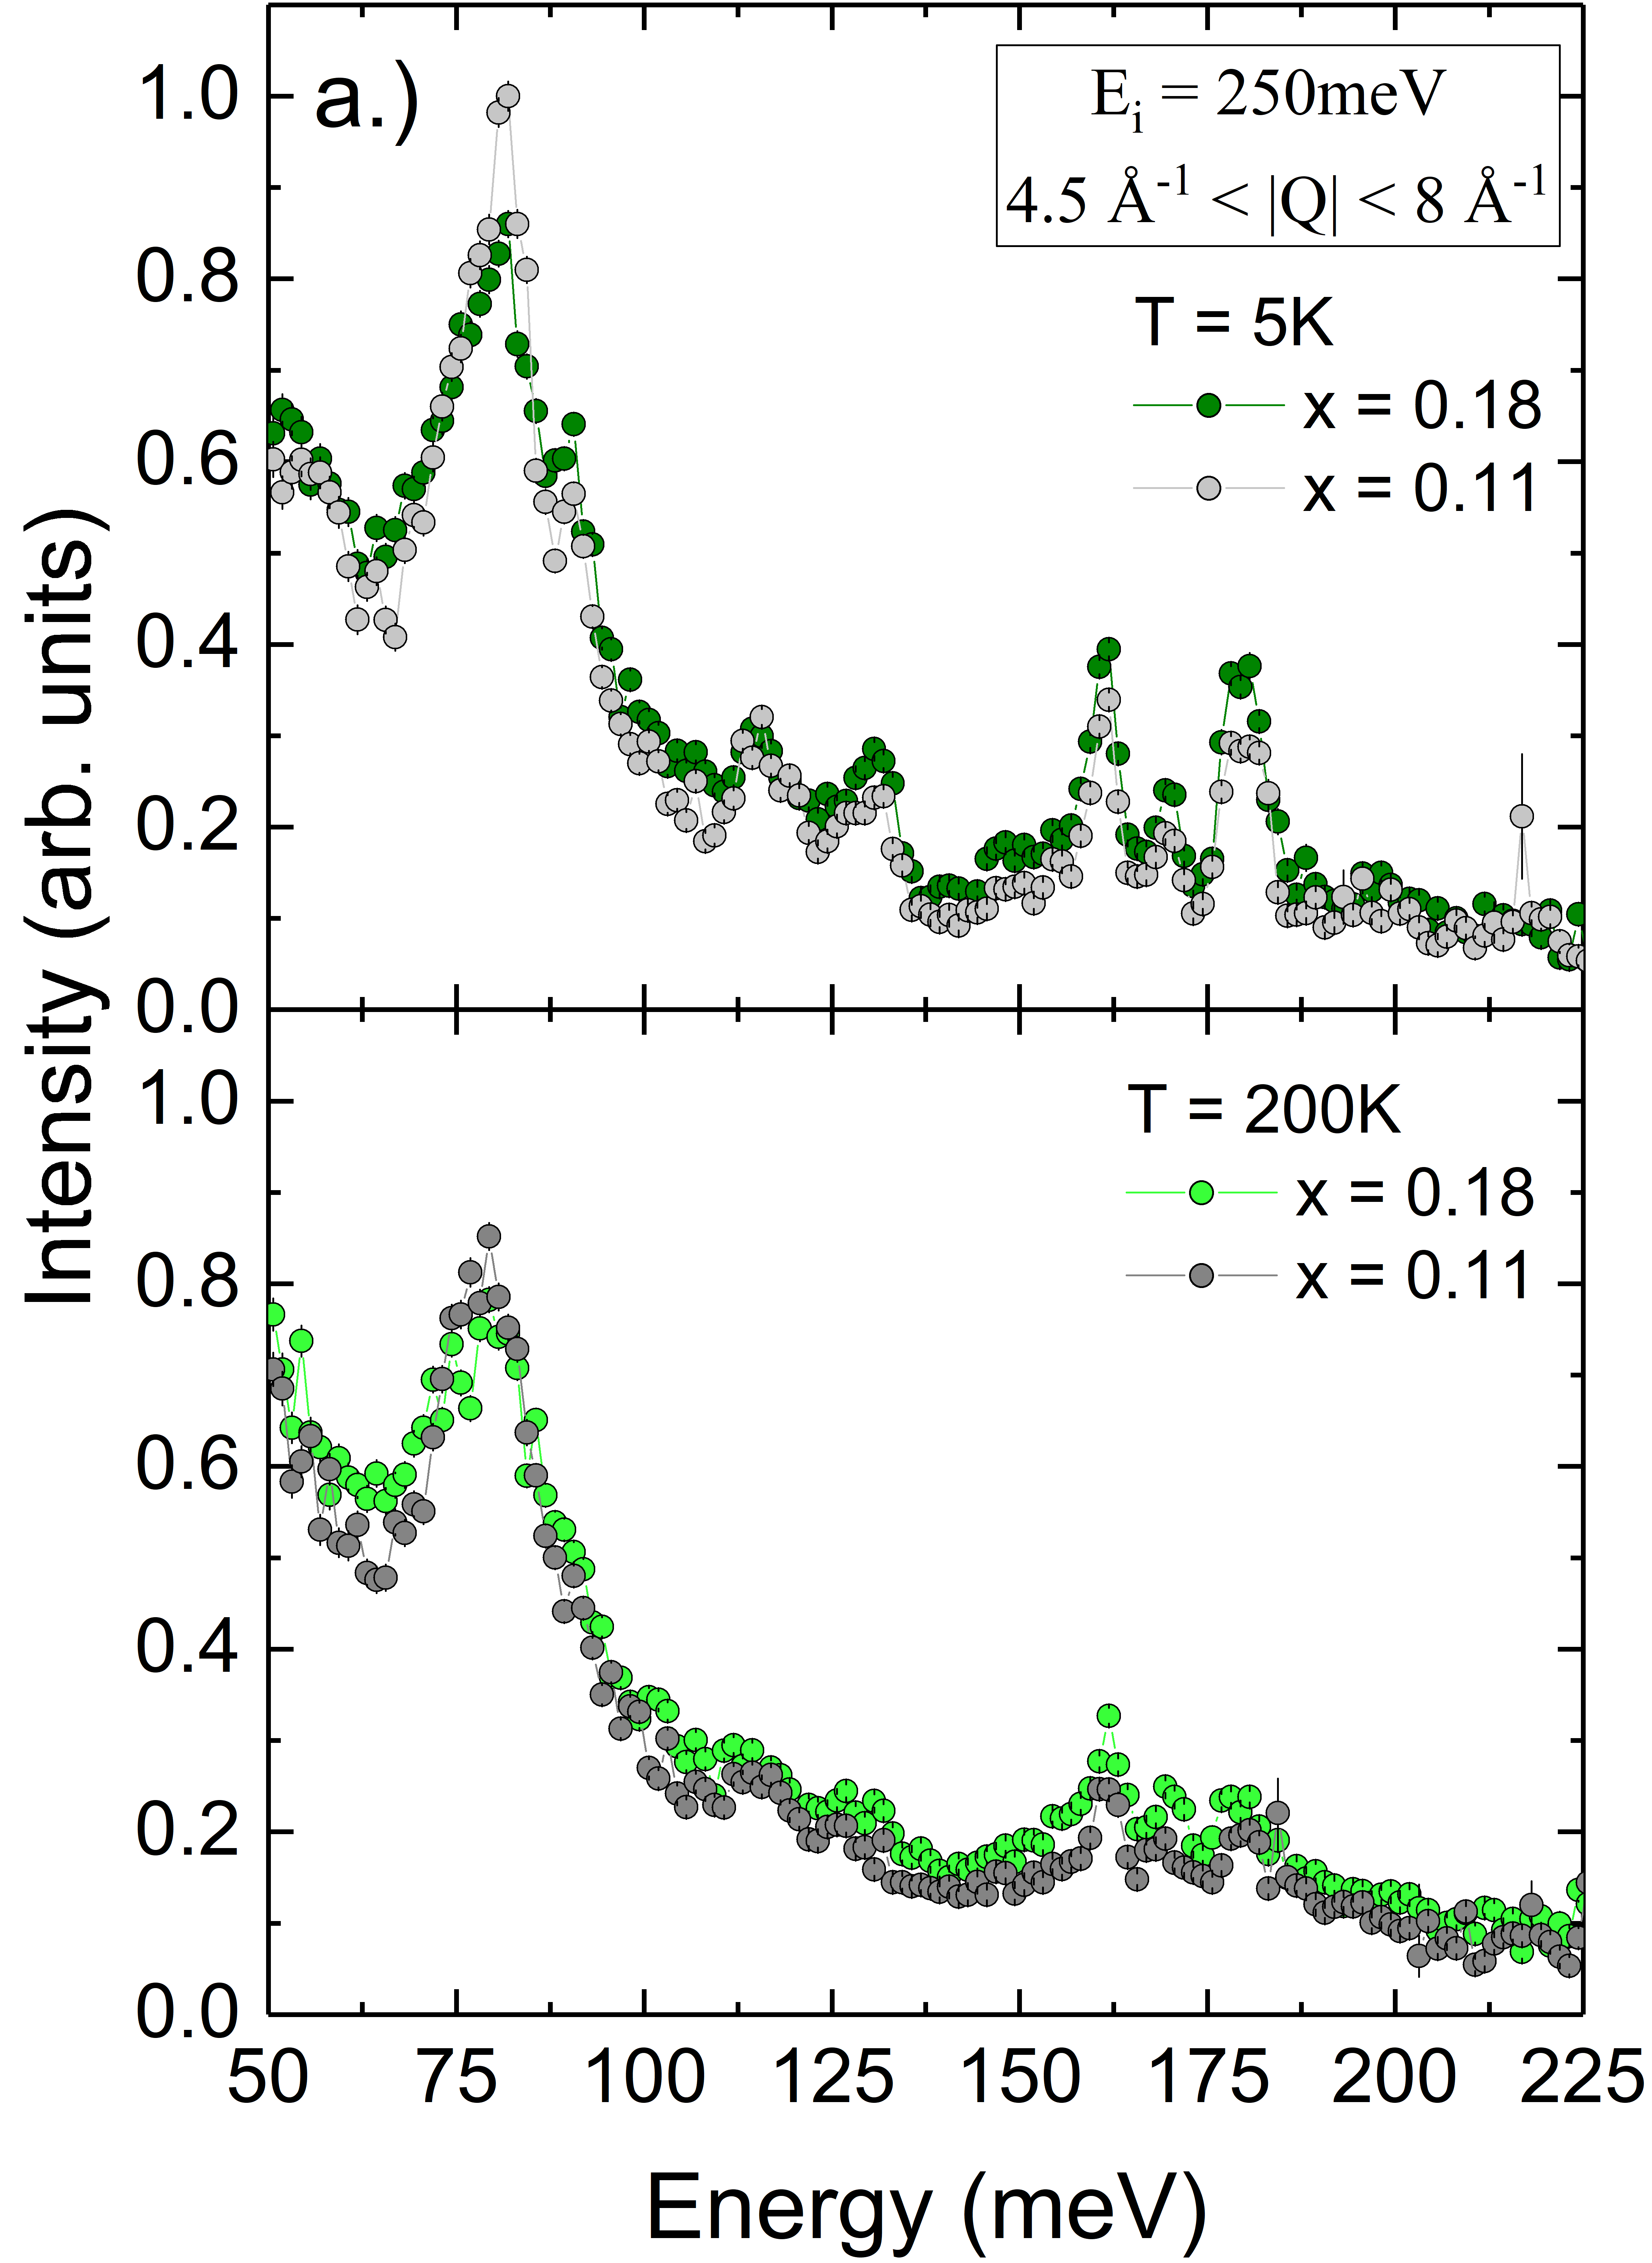
Crystal field excitations have several important characteristics: as single ion properties the CEFs tend to be dispersion-less and the Q-dependence of their intensities is largely determined by the magnetic form factor of the magnetic ion involved. They also display temperature dependence that reflects the population distribution of the CEF levels. Given that the lowest energy CEF excited state is at 76 meV, and thus for all temperatures below room temperature, we expect no states above the ground state to be thermally populated. These features can be used to distinguish the real CEF levels from the background and from other elementary excitations, particularly phonons. In figure 6 we show the comparison of the CEF spectrum at T = 5 K (top panels) and T = 200 K (bottom panels) with an incident energy and meV x = 0.11 and x = 0.18 samples.
As the temperature is increased the spectrum becomes broader in energy, in agreement with previous observations by Gaudet et al Gaudet et al. (2015). As mentioned above, this is not a thermal population effect but the result of the CEFs acquiring finite lifetimes, due to interactions with other excitations, notably phonons. With the exception of the site Yb3+ CEF excitations, the normalized intensity of the inelastic features in the spectrum are stronger for the x = 0.18 stuffed sample than for the x = 0.11 sample, as expected, reflecting the higher level of stuffing.
The feature at meV is not a CEF level since its intensity does not change with the temperature. By contrast the shape of the peak at meV becomes very broad at K consistent with the presence of two levels ( and transitions) close one to each other.
The highest energy CEF feature at indicative of Yb3+ at meV is due to stuffed site Yb3+. This level has been previously predicted in Ref Gaudet et al. (2015) and is now experimentally observed. The relatively high energy of this CEF is due to the fact that the oxygen ions surrounding the Yb3+ at sites are closer to the Yb3+ ions than is the case for either or site Yb3+.
I.3 C. Sample preparation and characterization of the two highly stuffed Yb2+xTi2-xO7-y samples
I.3.1 1. Sample preparation
Two single-crystals of Yb2+xTi2-xO7-y with composition, and and dimensions , were prepared by solid state reaction between pressed powders of and which were sintered at 450 ∘C for 15 hours with warming and cooling rates of 100 ∘C/h. The sample preparation and characterization of the stoichiometric, x = 0, and x = 0.05 powders of Yb2+xTi2-xO7-y are described elsewhere Ross et al. (2012). The purity of the starting powders of and was close to . To produce these highly stuffed, x = 0.11 and 0.18, samples of , a higher ratio of to was used in comparison to what is conventionally used in order to produce stoichiometric samples of . The two single-crystals were grown at McMaster University by utilizing the floating zone image furnace technique, which is described elsewhere Dabkowska and Dabkowski (2010). The growths were conducted in gas with no overpressure and the growth rates were 7 mm/h and 8 mm/h for the x = 0.11 and x = 0.18 samples, respectively. The single-crystal samples were then pulverized using a Pulverisette 2 mortar grinder for 30 minutes each.
I.3.2 2. Refinement of neutron powder diffraction data
We discuss the results of our refinement for neutron powder diffraction data collected at POWGEN Huq et al. (2011) at T = 300 K in table 2 for the x = 0.11 and x = 0.18 stuffed samples. This refinement was performed using the crystallographic refinement software JANA2006 Petricek et al. (2014). Note that the pure x = 0 and lightly stuffed x = 0.05 stuffed samples have previously been characterized by powder diffraction techniques in Ref. Ross et al. (2012).
The neutron diffraction powder spectra and best fits to the data are shown in figure 7. The cell parameters arising from this refinement for the x = 0.11 stuffed sample is Å, while for the x = 0.18, Å. Table 3 highlights the systematic increase of the unit cell parameter, , for all samples compared in this study. The fact that the length of the unit cell gets bigger as the stuffing, , increases is a direct consequence of the oxygen vacancies; the Coulomb repulsion of the cations left unshielded by the vacancy tends to push all the ions away from each other increasing the size of the unit cell. Moreover our refinement showed that these vacancies are mainly located on the O(1) sites of the pyrochlore lattice, confirming the analysis in Ref. Sala et al. (2014). The refined chemical formula for the two compounds are and giving a stuffing of x = 0.11 and x = 0.18 respectively, in agreement with the approximate stoichiometry of the starting materials used in the crystal growth.
| Neutron refinement x = 0.11 sample at 300 K | |||||
| Atom | x | y | z | Site | Occupancy |
| Yb | 0.625 | 0.625 | 0.625 | 1 | |
| Ti | 0.125 | 0.125 | 0.125 | 0.947(2) | |
| Yb | 0.125 | 0.125 | 0.125 | 0.053(2) | |
| O(2) | 0.043(4) | 0.25 | 0.25 | 0.994(4) | |
| O(1) | 0.5 | 0.5 | 0.5 | 0.988(3) | |
| Neutron refinement x = 0.18 sample at 300 K | |||||
| Atom | x | y | z | Site | Occupancy |
| Yb | 0.625 | 0.625 | 0.625 | 1 | |
| Ti | 0.125 | 0.125 | 0.125 | 0.912(2) | |
| Yb | 0.125 | 0.125 | 0.125 | 0.088(2) | |
| O(2) | 0.458(3) | 0.25 | 0.25 | 0.984(10) | |
| O(1) | 0.5 | 0.5 | 0.5 | 0.979(3) | |
| Refined lattice parameters | |
|---|---|
| Degree of stuffing, | a (Å) |
| 0.000(1) | 10.020(3) |
| 0.046(4) | 10.029(4) |
| 0.106(4) | 10.063(4) |
| 0.176(8) | 10.080(7) |
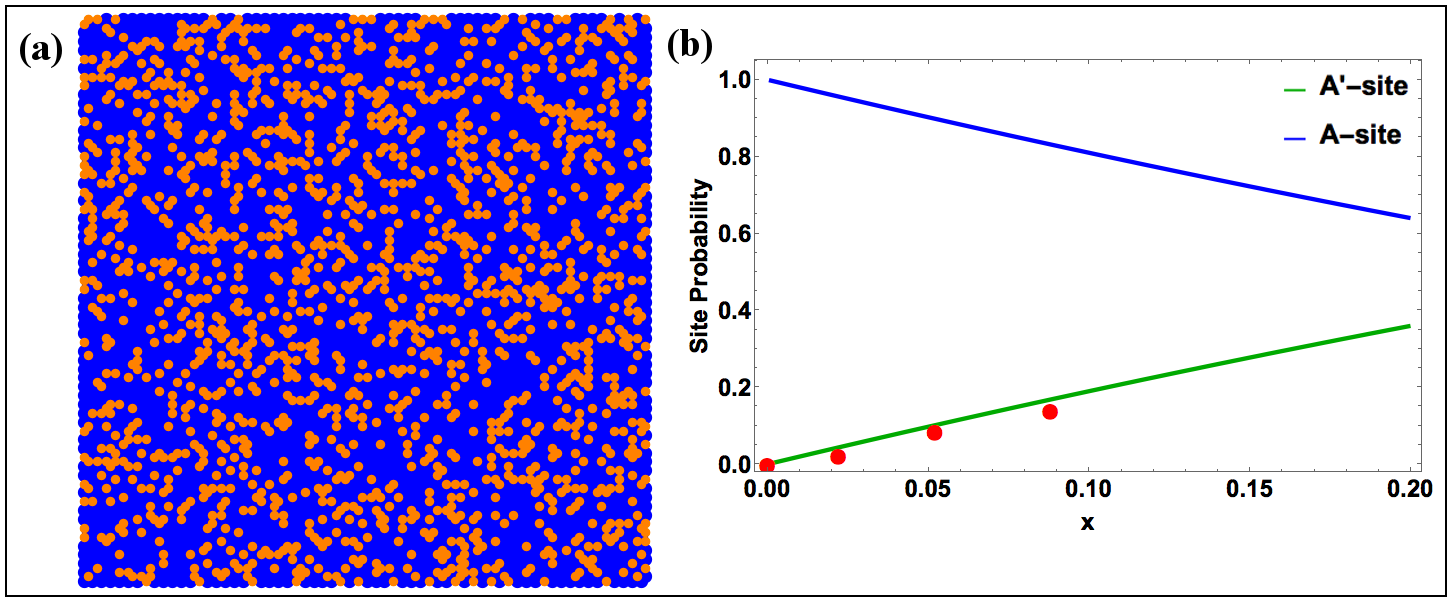
Assuming that oxygen atoms are removed at random, we can perform a simple Monte Carlo (MC) simulation to calculate the relative preponderance of to sites in the lattice as a function of the stuffing level, . Assuming that each and site contributes independently to the intensity of the spectrum, we can argue that the intensity of the transition at meV should be proportional to this ratio.
For this calculation we created a supercell consisting of unit cells filled with random vacancies located only at the O(1) position. Due to the symmetry of the pyrochlore lattice each Yb3+ ion at an site has only two O(1) ions as first nearest neighbour, thus we calculated how many ions have no vacancies and how many are affected by the stuffing. The calculation was repeated for realizations of disorder. We show in figure 8 the results of this analysis, with the conclusion that the transition at meV originates from sites, and its intensity is directly proportional to the number of vacancies in the system.
