2Department of Applied and Engineering Physics, Cornell University, Ithaca, NY, USA 14853
3Joseph Henry Laboratories of Physics, Jadwin Hall, Princeton University, Princeton, NJ, USA 08544
4NIST Quantum Devices Group, 325 Broadway Mailcode 817.03, Boulder, CO, USA 80305
5Kavli Institute for Particle Astrophysics and Cosmology, SLAC National Accelerator Laboratory, 2575 Sand Hill Rd, Menlo Park, California, USA 94025
6Department of Physics and Astronomy, University of Pennsylvania, 209 South 33rd Street, Philadelphia, PA, USA 19104
7Department of Physics, University of Michigan, Ann Arbor, USA 48103
8NASA Goddard Space Flight Center, Greenbelt, MD 20771 USA
11email: bjk98@cornell.edu
Advanced ACTPol Low Frequency Array: Readout and Characterization of Prototype 27 and 39 GHz Transition Edge Sensors
Abstract
Advanced ACTPol (AdvACT) is a third generation polarization upgrade to the Atacama Cosmology Telescope, designed to observe the cosmic microwave background (CMB). AdvACT expands on the 90 and 150 GHz transition edge sensor (TES) bolometer arrays of the ACT Polarimeter (ACTPol), adding both high frequency (HF, 150/230 GHz) and low frequency (LF, 27/39 GHz) multichroic arrays. The addition of the high and low frequency detectors allows for the characterization of synchrotron and spinning dust emission at the low frequencies and foreground emission from galactic dust and dusty star forming galaxies at the high frequencies. The increased spectral coverage of AdvACT will enable a wide range of CMB science, such as improving constraints on dark energy, the sum of the neutrino masses, and the existence of primordial gravitational waves. The LF array will be the final AdvACT array, replacing one of the MF arrays for a single season. Prior to the fabrication of the final LF detector array, we designed and characterized prototype TES bolometers. Detector geometries in these prototypes are varied in order to inform and optimize the bolometer designs for the LF array, which requires significantly lower noise levels and saturation powers (as low as pW) than the higher frequency detectors. Here we present results from tests of the first LF prototype TES detectors for AdvACT, including measurements of the saturation power, critical temperature, thermal conductance and time constants. We also describe the modifications to the time-division SQUID readout architecture compared to the MF and HF arrays.
Keywords:
Cosmic Microwave Background, Transition Edge Sensor, Bolometer, Polarimetry, Advanced ACTPol, Synchrotron1 Introduction
Advanced ACTPol (AdvACT) is an upgrade to the Atacama Cosmology Telescope polarimeter (ACTPol), designed to observe the polarization of the cosmic microwave background (CMB) across five different frequency bands [1]. ACT is an off-axis Gregorian telescope located in the Chilean Atacama Desert at an elevation of 5190 m [2]. The telescope optical chain consists of a 6 m diameter primary mirror, a 2 m diameter secondary mirror and a set of three optics tubes. Each tube consists of a window, filter stack, three silicon reimaging optics, a feedhorn array and finally the detector focal plane. The AdvACT upgrade has already replaced each of ACTPol’s three detector arrays, replacing optics tube elements to accommodate different frequency bands where needed. The 2017 season configuration consists of one high frequency (HF) array, observing at 230 and 150 GHz, and two mid frequency (MF) arrays, observing at 150 and 90 GHz [3]. The last array of AdvACT to be deployed is the low frequency (LF) detector array, which will replace one of the MF arrays and observe at 27 and 39 GHz.
Single frequency observations of the CMB are limited by foregrounds such as synchrotron, spinning dust emission, galactic dust, and dusty star forming galaxies. AdvACT’s high and low frequency coverage allows for the removal of these foregrounds, with the low frequency coverage aiding in the removal of synchrotron and spinning dust emission. The wide frequency coverage (27-230 GHz) and fine angular resolution ( at 150 GHz) of AdvACT will enable a wide range of science such as improving constraints on dark energy, the sum of the neutrino masses, and the existence of primordial gravitational waves [3]. Here we present the characterization of the detector test die used to select the final detector parameters for fabricating the AdvACT LF array.
2 The Detectors
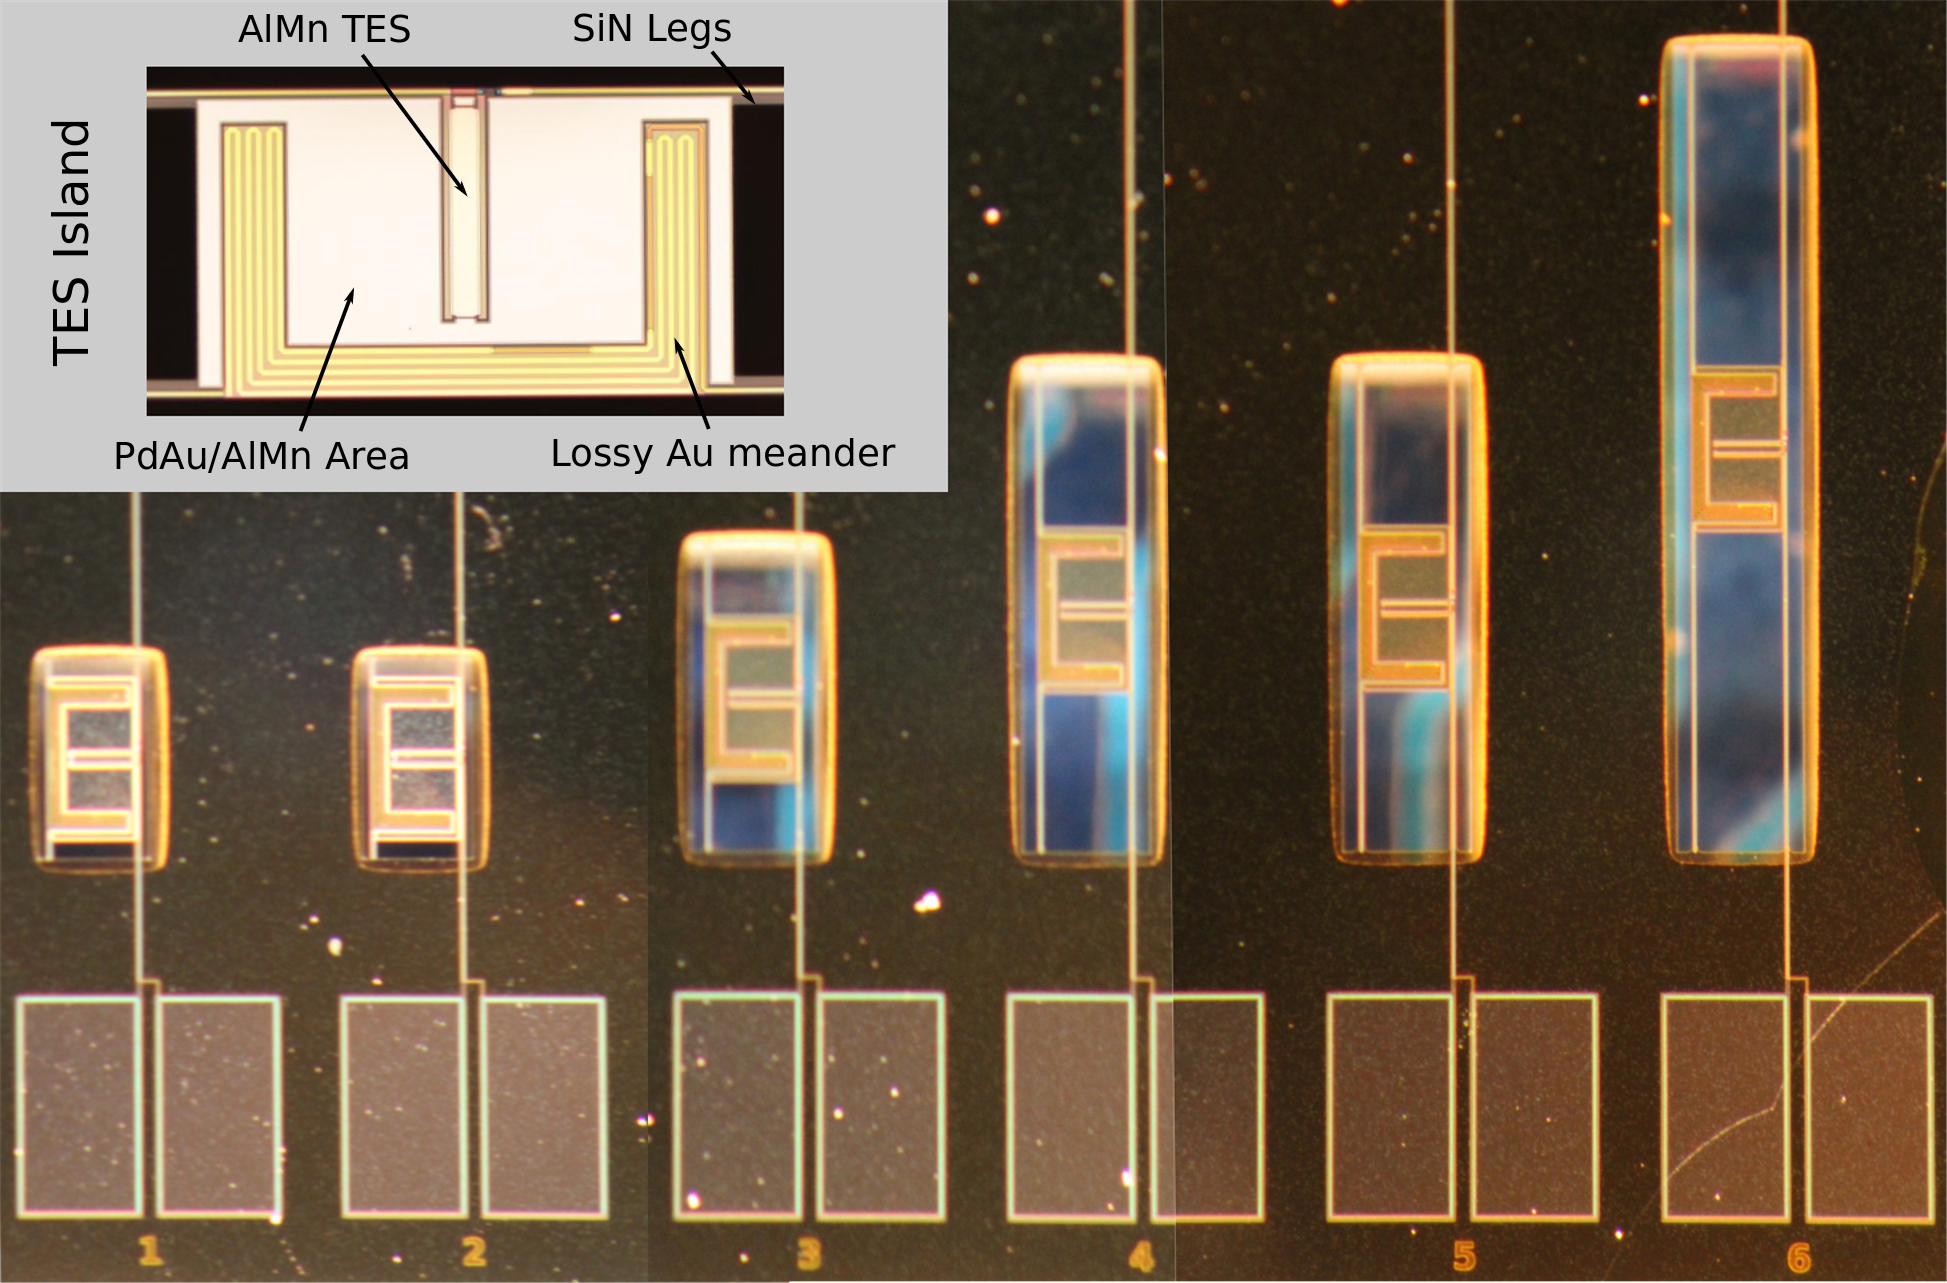
The LF array is a polarization-sensitive dichroic array of 73 pixels coupled to transition edge sensor (TES) bolometers [4]. Each pixel has four orthomode transducer (OMT) coupling probes, two for each linear polarization, connected to superconducting niobium microstrip lines that transmit radiation to the AlMn TES bolometers [5, 6]. There are four optical TESes per pixel, a pair for each linear polarization at both 27 and 39 GHz, as well as two dark TESes. Each TES island is weakly coupled to the cold bath by a set of four SiN legs. During operation, the TES is voltage-biased to keep it on the superconducting transition, which is designed to be at 165 mK. The geometry of the TES legs determines the thermal conductance to the bath, , which limits how much power the detector can dissipate before saturating.
| ID | [GHz] | [] | [] | [mK] | [pW] | [pW/K] | [m] | |
|---|---|---|---|---|---|---|---|---|
| 1 | 39 | 14.4 | 61.0 | |||||
| 2 | 39 | 12.1 | 61.0 | |||||
| 3 | 27 | 10.0 | 219.8 | |||||
| 4 | 27 | 10.0 | 500.0 | |||||
| 5 | 27 | 15.0 | 500.0 | |||||
| 6 | 27 | 10.0 | 1000 |
The TES leg geometry is selected to optimize the performance under expected loading conditions at the ACT site. This selection is largely driven by the saturation power without optical loading, , and the thermal conductivity, . The target saturation powers are 1.5 pW at 27 GHz and 7.8 pW at 39 GHz, which corresponds to three times the estimated loading at each frequency. These are much lower saturation powers than those in the MF ( and pW) and HF ( and pW) arrays, driving us to much longer leg lengths. However, similarly long legs have been fabricated for SPIDER [7].
The following model is used to describe how is determined by the bath temperature, , and the critical temperature of the device, :
| (1) |
The thermal conductivity, , is then given by,
| (2) |
The LF detector test die leg parameters were selected by extrapolating a linear fit to the for the MF and HF detectors as a function of the cross-sectional area to the leg length, . Test dies with several leg variants were then fabricated to explore the parameter space near and near . These variants are shown in Fig.1. Additional devices with different heat capacities were fabricated to optimize the temporal response of the detector. The detectors must respond quickly enough to prevent smearing of the signals from the sky or from the half-wave-plate modulators [3], but this must be balanced against the temporal response becoming so fast that the detectors become unstable [8]. Both types of devices were characterized, and the final leg and heat capacity geometries for use on the LF array were selected based on those results.
3 Device Characterization
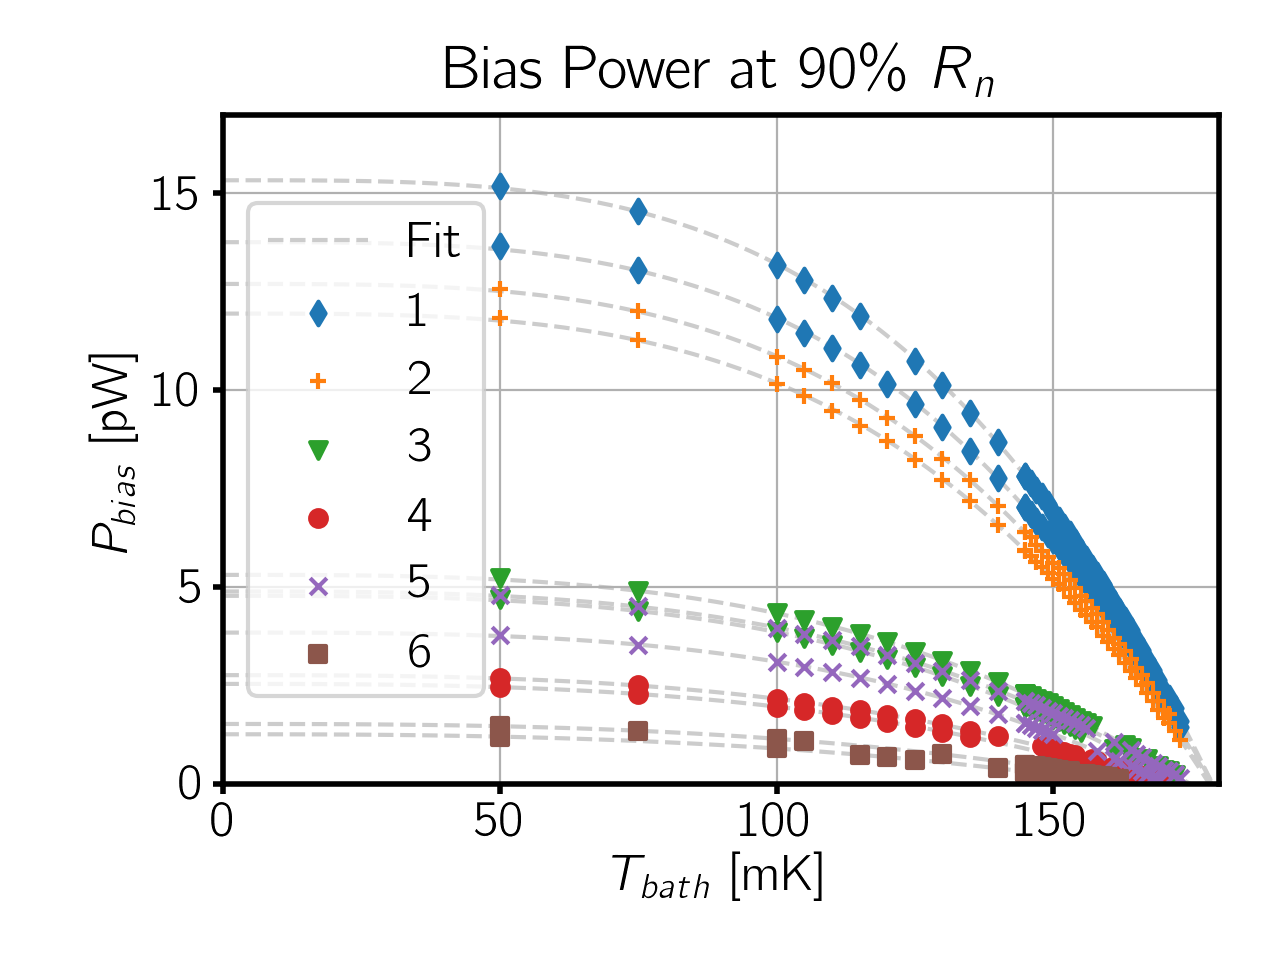
The optimal TES leg geometries were determined by measuring current-voltage (IV) curves at many different bath temperatures, ranging from 50 to 180 mK. These IV curves are used to determine the bias power required to drive the TES to 90% of the normal resistance, . We define this value to be the saturation power, . The bias powers at 90% for each bath temperature are fit to Eq. (1), as shown in Fig. 2, for , , and .
Based on previous measurements of the values for the MF and HF detectors, we expect to be proportional to the ratio of [3]. In Fig. 3, we show the measured vs the ratio of . The black-dashed line is the best-fit linear relation, which was used to select the leg geometry of the 39 GHz detectors. For these, we choose to keep the leg length the same as the HF and MF detectors, , which gave a width, , of .
The 27 GHz detectors have the lowest target of all the AdvACT detectors at . While the test die parameters were selected based on the HF and MF linear fit, we find that the low saturation power, longer leg length detectors differ in their behavior with as a function of in that the slope is larger by about a factor of two. This may be due to the phonon transport differing for the much longer legs. This difference is reflected in the 27 GHz devices having a thermal conductance exponent, , , compared to for the 39 GHz devices, as shown in Table 1. While we do not account for correlation between fit parameters in our error determination in Table 1, we do find there to be a negative correlation between and , so for a fixed the difference between the 27 and 39 GHz detector values will persist. We fit the devices with independently, leading to the gray dashed line in Fig.3, which we used to select the final 27 GHz detector leg parameters of and . Measured prototype device parameters are shown in Table 1. The measured critical temperatures for most of the devices were found to be above the target 165 mK. Selection of the final leg geometries for fabricating the LF array was done after scaling these results to a of 165 mK.
The detector responsivity decreases with increasing frequency due to the thermal time constant of the detector, which can be varied by adding heat capacity to the TES island. We tested six different recipes of PdAu and AlMn, in order to explore how the time constant varied as a function of each materials volume. These six test devices were all 27 GHz devices, four with AlMn volumes ranging from to and no PdAu, two of which had the same AlMn volume but different leg widths, and two with the full AlMn volume while having either or of PdAu. Extrapolations from the previously fabricated MF devices were suitable for the 39 GHz devices.
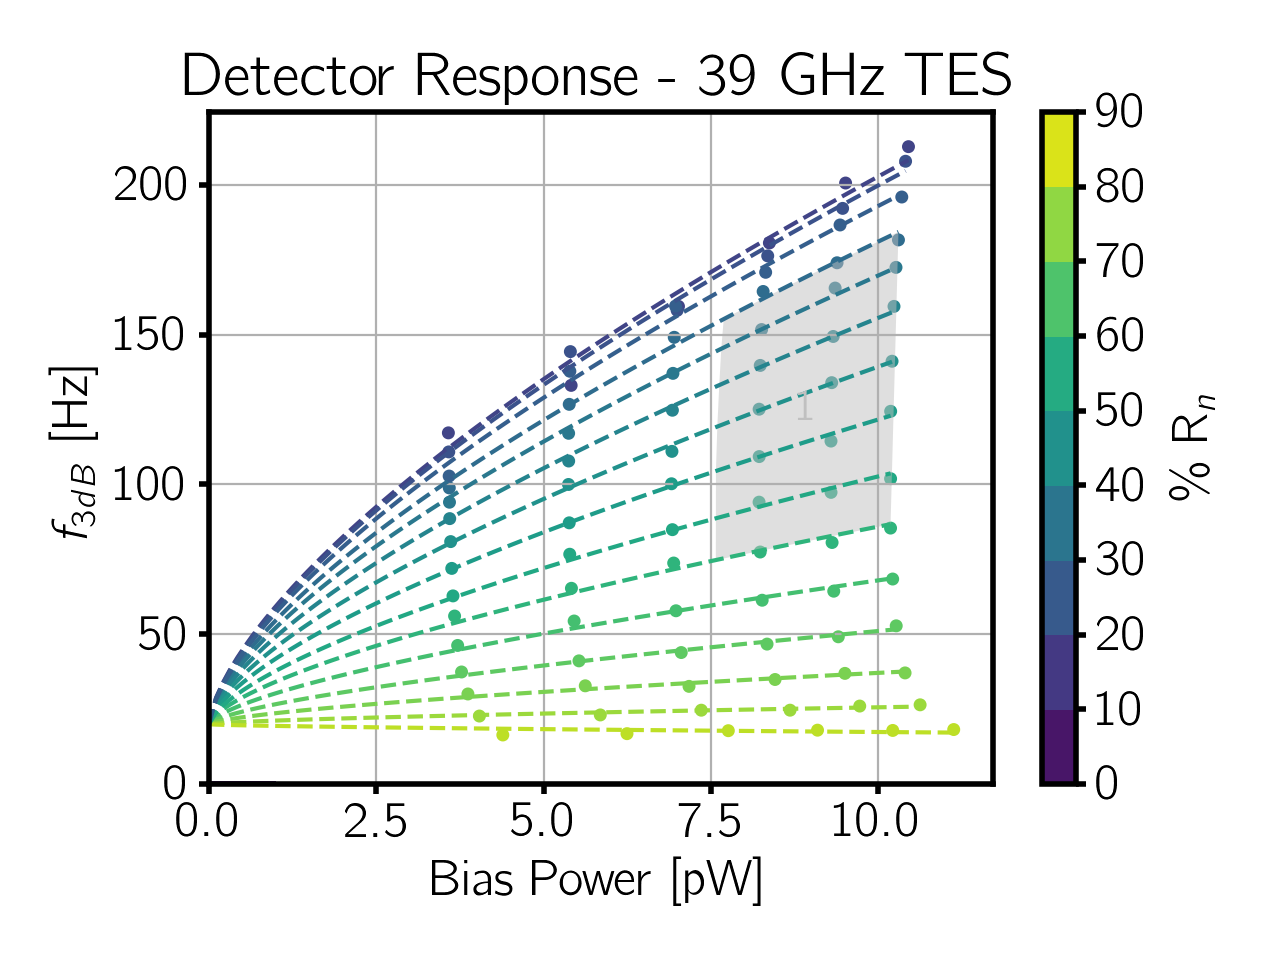
We report the time constant of the detector as , defined as the frequency at which the response of the detector decreases by a factor of two compared to the DC response. The target for the LF detectors ranges from 81 to 275 Hz for 35%-70% across the range of expected bias powers under loading in the field. This range is set by requiring fast enough detectors to observe with a rapidly rotating half-wave plate modulator, but not too fast that they could become unstable [3].

We test the response time by adding a small square-wave to the voltage bias applied to the detectors with amplitude ranging from of the DC bias value. The response is sampled at 250 kHz to measure the exponential fall time of the detector current, or . We do this at six different bath temperatures and several different points on the TES transition, measured by the TES resistance relative to normal, , as shown in Fig. 4. These data are then fit to a two-fluid model described by Eq. (3), where and are a function of measurable parameters specified in [9], and is the bias power,
| (3) |
This model qualitatively captures the data, though a linear model yields similar results. Better understanding of the TES behavior and physics throughout the transition is work in progress.
From these data, we found that having PdAu on the 27 GHz devices, in addition to the full AlMn volume, decreased the below our target threshold of 81 Hz. Based on this we chose to have 73% of the full (largest tested) AlMn volume (full being ) and no PdAu on the 27 GHz detectors and 100% of the full AlMn volume and 76% of the full volume of PdAu (full being ) for the 39 GHz detectors.
4 Readout
The LF array will have a much smaller number of TESes than AdvACT’s HF and MF arrays but it will be read out using the same time division multiplexing (TDM) scheme [3, 10, 11, 12]. Each TES in the LF array will be voltage-biased and multiplexed through the warm Multi-Channel Electronics (MCE) using a SQUID-based TDM architecture developed at NIST/Boulder [13, 14]. Containing fewer pixels, the LF cold electronics will be a simplified adaptation of the HF and MF designs, using the same PCB used in the HF and MF arrays. The LF array will have a multiplexing (MUX) factor, or number of detectors per readout channel, of 26:1, whereas HF and MF have MUX factors of 64:1 and 55:1, respectively. The cold readout electronics are similar otherwise to the electronics described in [3, 10].
The LF array readout wiring has been designed such that TESes from polarization pairs at one optical frequency are read out on the same column and thus the same 1 K SQUID series array and 300 K warm amplifier. Unlike in the MF and HF arrays, each column in the LF array has its own dedicated TES bias line and dark TESes are wired to their own column. This is an improvement over the MF and HF readout because each detector type (27 GHz, 39 GHz, and dark), which will have different optimal bias powers, can be independently biased. Deliberate shorts on some unused shunt inputs have also been implemented, providing Johnson noise channels for independently probing detector bias line noise.
5 Conclusion
We fully characterized new test dies, which were designed to demonstrate the low values needed to optimize the LF array. The LF cryogenic readout electronics have been assembled and tested. The LF detector array is currently being fabricated at NIST and will be deployed to extend the range of AdvACT from 27 GHz to 230 GHz.
This demonstrates our ability to cover a wide range of saturation powers (as low as 1 pW) and detector response speeds through modification of the detector leg length, the leg width, the AlMn volume, and the PdAu volume on a single detector design. This has direct application to detector design for future CMB experiments, such as the Simons Observatory and CMB-S4, which will face similar design challenges.
Acknowledgements.
This work was supported by the U.S. National Science Foundation through award 1440226. The development of multichroic detectors and lenses was supported by NASA grants NNX13AE56G and NNX14AB58G. The work of KPC, KTC, BJK, and JTW was supported by NASA Space Technology Research Fellowship awards.References
- [1] R. J. Thornton et al., ApJS 227, 21 (2016), doi:10.3847/1538-4365/227/2/21.
- [2] J. W. Fowler et al., Appl. Opt. 46, 17, 3444 (2007), doi:10.1364/AO.46.003444.
- [3] S. W. Henderson et al., Journal of Low Temperature Physics 184, 3, 772 (2016), ISSN 1573-7357, doi:10.1007/s10909-016-1575-z.
- [4] S. M. Simon et al., J. Low Temp. Phys. This Special Issue (2017).
- [5] D. Li et al., Journal of Low Temperature Physics 184, 1, 66 (2016), ISSN 1573-7357, doi:10.1007/s10909-016-1526-8.
- [6] S. M. D. et al., J. Low Temp. Phys. This Special Issue (2017).
- [7] J. P. Filippini et al., in Millimeter, Submillimeter, and Far-Infrared Detectors and Instrumentation for Astronomy V, volume 7741 of Proc. SPIE, page 77411N (2010), doi:10.1117/12.857720.
- [8] K. Irwin and G. Hilton, Transition-Edge Sensors, pages 63–150, Springer Berlin Heidelberg, Berlin, Heidelberg (2005), ISBN 978-3-540-31478-3.
- [9] K. D. Irwin et al., Journal of Applied Physics 83, 8, 3978 (1998), doi:10.1063/1.367153.
- [10] S. W. Henderson et al., in Millimeter, Submillimeter, and Far-Infrared Detectors and Instrumentation for Astronomy VIII, volume 9914 of Proc. SPIE, page 99141G (2016), doi:10.1117/12.2233895.
- [11] K. Crowley et al., J. Low Temp. Phys. This Special Issue (2017).
- [12] S. K. C. et al., J. Low Temp. Phys. This Special Issue (2017).
- [13] E. S. Battistelli et al., Journal of Low Temperature Physics 151, 908 (2008), doi:10.1007/s10909-008-9772-z.
- [14] J. Beyer and D. Drung, Superconductor Science Technology 21, 10, 105022 (2008), doi:10.1088/0953-2048/21/10/105022.