New Horizons Ring Collision Hazard:
Constraints from Earth-based Observations
A White Paper for the New Horizons Mission
Version 2: 31-Jan-2013
Version 2 fixes an error in how diffraction was handled in reflected light, and improves the scattering model by considering non-Mie particles.)
Abstract
The New Horizons spacecraft’s nominal trajectory crosses the planet’s satellite plane at from the barycenter, between the orbits of Pluto and Charon. I have investigated the risk to the spacecraft based on observational limits of rings and dust within this region, assuming various particle size distributions. The best limits are placed by 2011 and 2012 HST observations, which significantly improve on the limits from stellar occultations, although they do not go as close to the planet. From the HST data and assuming a ‘reasonable worst case’ for the size distribution, we place a limit of damaging impacts by grains of radius onto the spacecraft during the encounter. The number of hits is 200 above the NH mission requirement, and above the mission’s desired level. Stellar occultations remain valuable because they are able to measure closer to the Pluto surface than direct imaging, although with a sensitivity limit several orders of magnitude higher than that from HST imaging. Neither HST nor occultations are sensitive enough to place limits on at or below the mission requirements.
1 Background and Motivation
On November 3-4, 2011, the “New Horizons Encounter Hazards Workshop” workshop was held at Southwest Research Institute, Boulder, CO. The purpose of the workshop was to discuss possible collisional hazards to New Horizons (NH) during its upcoming 2015 trajectory through the Pluto system. Discussion topics included a variety of theoretical modeling and observations, each of which placed limits on a range of particle sizes at different locations within the system. Based on these inputs and followup work, the NH mission will decide on a final trajectory at some point prior to the 2015 encounter. This paper summarizes and follows up on work I presented at the workshop.
2 Mission Requirements
The New Horizons spacecraft incorporates a multi-layer flexible shield, which in part protects the spacecraft against damage from high-speed micrometeoroid dust impacts. The shield is designed to protect NH against impacts of at relevant speeds. The New Horizons mission itself has defined a slightly lower critical mass of . The mission has a requirement of impacts of size or greater during the encounter, and a ‘desirement’ of impacts of mass . For the purpose of this paper, I assume a density of 4 g cm-3, corresponding to a critical radius .
3 Observational Limits
Rings in reflected light. Observations by HST and ground-based telescopes can be used to search directly for rings and dust orbiting in the region near Pluto. Assuming a non-resolved uniform ring of optical depth , the observed brightness in reflected light is
| (1) |
In this expression, is the measured ring intensity and is the incident solar flux. The ring’s optical depth is , and albedo is . is the cosine of the angle , which is the tilt angle of the rings (from normal) as seen by the observer. is the particle’s phase function at scattering angle . For Earth-based observations of Pluto, is in the range 0–2∘.
The normal optical depth for a ring seen in reflected light is
| (2) |
where is the size distribution of the dust grains, with units . The scattering efficiency is usually computed using Mie scattering, and approaches the value of for and moderately absorbing particles.
Finally, the number of damaging hits to the spacecraft during its passage through the system can be written as
| (3) |
where is the cross-sectional area of the spacecraft (Chris Hersman, personal communication), and is the cosine of the sub-spacecraft latitude at closest approach. A trajectory directly through the plane will encounter fewer particles than one on a shallow slant angle; for the nominal NH encounter geometry, GeoViz111http://soc.boulder.swri.edu/nhgv shows that . Combining Eqs. 1–3, can be calculated exactly from and the size distribution .
Rings in extincted light. In the case of extincted light (e.g., a stellar occultation), the ring’s brightness is calculated slightly differently. Here, the observed intensity is
4 Ring Upper Limits from Stellar Occultations
Stellar occultations have two distinct advantages over direct imaging. First, they offer a higher resolution , defined by the Fresnel limit
| (6) |
rather than the diffraction limit, which in the case of HST is
| (7) |
Second, the occultation observations are immune to the effects of stray light. This allows for measurements to continue with no loss in sensitivity even as the star and occulting body approach each other on the detector. Imaging experiments (like on HST) are often limited by stray light, in particular when searching for faint features such as rings at sub-arcsecond separations from a bright extended object such as Pluto.
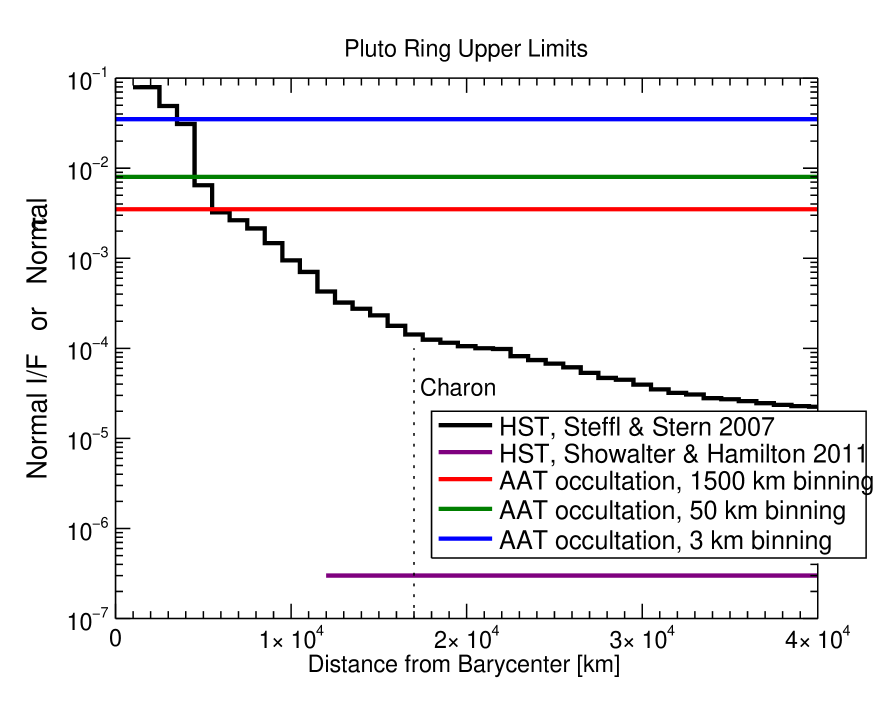
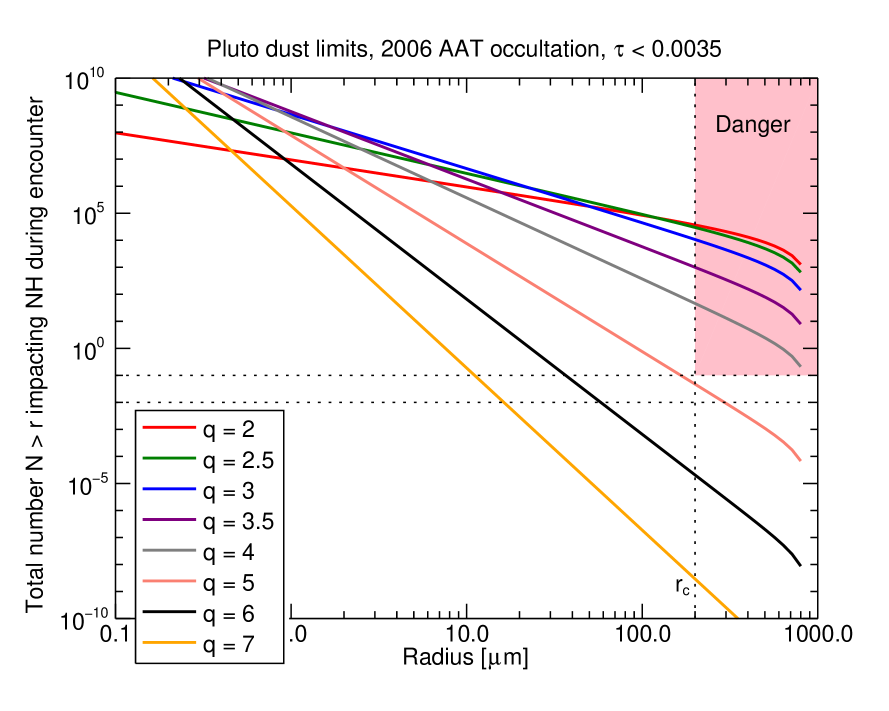
2006 AAT occultation. Pluto passed in front of the magnitude 15.5 star P384.2 on 2006 Jun 12. This occultation was observed by R. French and K. Shoemaker using the 3.9-meter Anglo-Australian Telescope (AAT). This observation coupled a large aperture with a low-noise, fast-readout CCD (10 fps) to study the system at unprecedented resolution. The data achieved a SNR of 333 per scale-height (). The shadow path traveled at 26.7 km/sec across Earth, giving a linear resolution of 2.67 km/sample. The 50-second central occultation measured Pluto’s atmospheric structure (Young et al., 2008). However, the dataset also included close to three hours of additional data, from two hours before the central event to one hour after. We recently re-analyzed the entire dataset to search for occultations by as-yet unknown rings, orbital debris, or satellites (Throop et al., 2011). Results are shown in Table 1 and Fig. 1.
| Search | Upper Limit |
|---|---|
| (no detections) | |
| Rings, 1500 km width | |
| Rings, 50 km width | |
| Rings, 3 km width | |
| Satellites along occultation path | 100 m |
Other occultations. Additional ring occultation results have been reported by several groups. McKay (2008) and Pasachoff et al. (2006) report on one additional dataset taken in Australia during the 2006 Jun 12 occultation. Their limits are similar to ours. Boissel et al. (2008, also Boissel in preparation 2011) reports limits from four occultations in 2006-2008. Their limits are also similar to ours. Neither of these studies found any dips attributable to unknown satellites or orbital debris.
5 Ring Upper Limits from HST Imaging
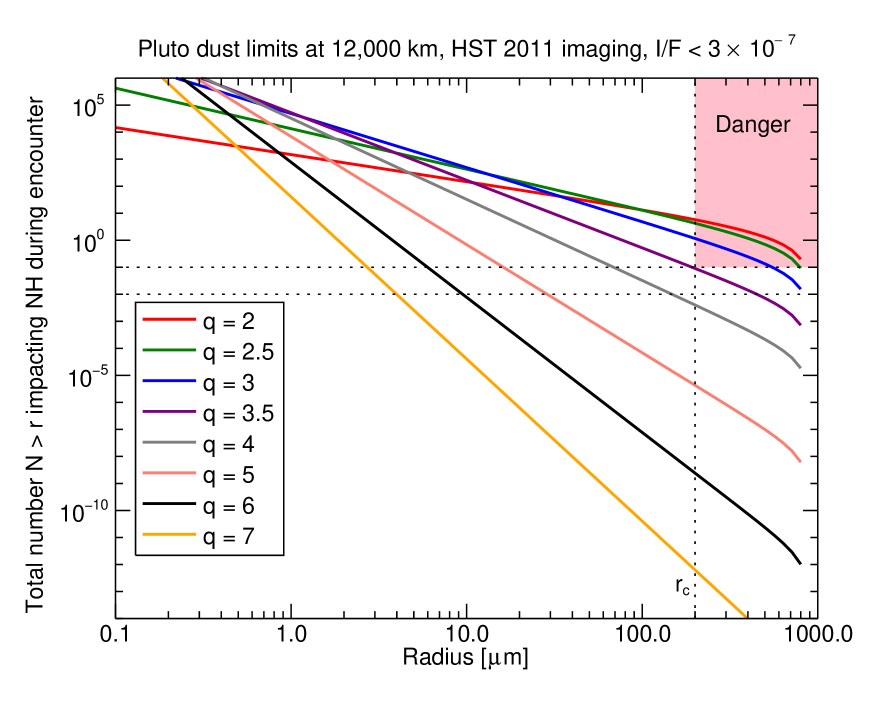
The Hubble Space Telescope was used in June 2011222DD-12436, 5 orbits, PI Showalter and June-July 2012333DD-12801, 34 orbits, PI Weaver to search directly for rings around Pluto. These observations placed Charon and Pluto in such a way as to facilitate subtraction of stray light. The reduced stray light allowed for a much-improved lower limit to compared to previous results (e.g. Steffl and Stern, 2007), where it was difficult to distinguish between stray light and reflected ring light. M. Showalter has presented preliminary results that showed a limit on the normal outward of 12,000 km from Pluto. Inward of this distance the detectors were saturated, so no limit could be calculated.
This new limit is 3-4 orders of magnitude better than the AAT occultation data, depending on the value of particle albedo assumed. The AAT data is able to measure closer to the planet than HST, but for practical purposes the HST limit is superior.
6 Impact Limits for New Horizons
In this section I use the measured constraints on ring abundance to infer the population of mm-sized grains and thus the risk to New Horizons on its path through the Pluto system.
An ‘absolute worst case’ scenario can be examined if we assume that 100% of the rings’ optical depth is due to grains of radius exactly . In this case, Eqs. 1 – 3 give us
| (8) |
Plugging in the HST I/F limit and assuming an albedo , we find . This shows that observations alone, when interpreted most conservatively, cannot technically rule out a danger to the spacecraft. However, in this case our input assumptions are truly extreme enough that the computed value of is not really a useful statement about the actual danger.
In order to make a ‘plausible worst case’ scenario, I make the more reasonable assumption that the grains are distributed not unimodally but in a power law, where
| (9) |
The exponent indicates the slope of the distribution. Values of have most of their surface area in small grains, while indicates a dominance of large grains. Power laws are believed to be common in collisional systems such as rings. The actual distribution in rings across many orders of magnitude may well be much more complex, but it has not been well measured. Also, by choosing a wide range of power laws, we are likely to bound the actual distribution.
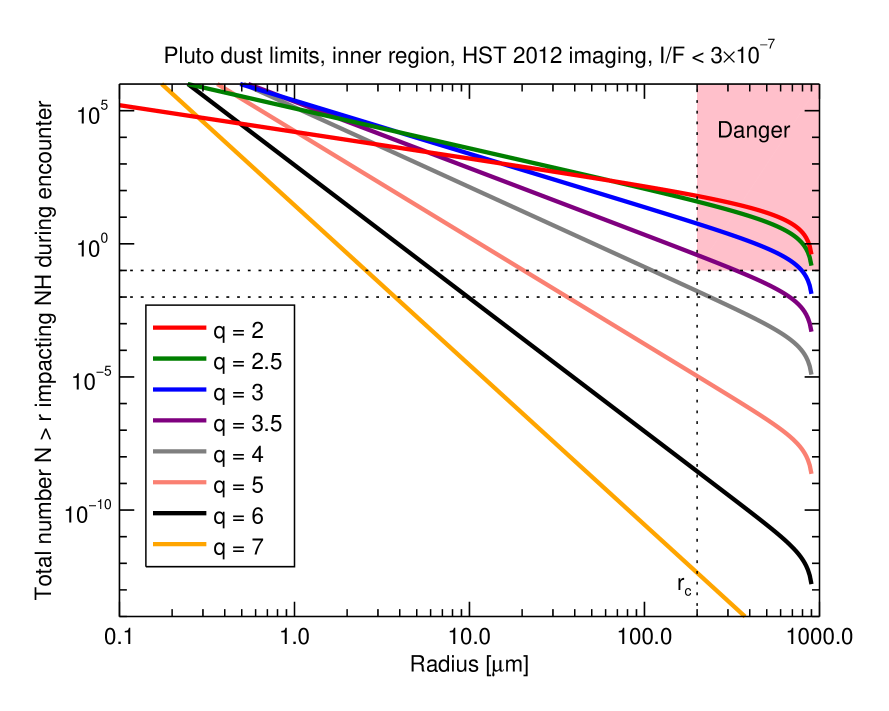
I computed the for rings with in the range of 2–7. For each distribution, I calculated explicitly for every particle size. All calculations were done at . The size range extended from to across 100 logarithmically spaced bins. The upper size limit is consistent with that used by (Thiessenhusen et al., 2002), and consistent with the drop-off in interplanetary impactors seen above 1 g by Gruen et al. (1985, their Fig. 3). Neither the size limits nor the composition strongly affect the results. I normalized such that (Eq. 1) matched that from HST. It was then straightforward to calculate from Eq. 3.
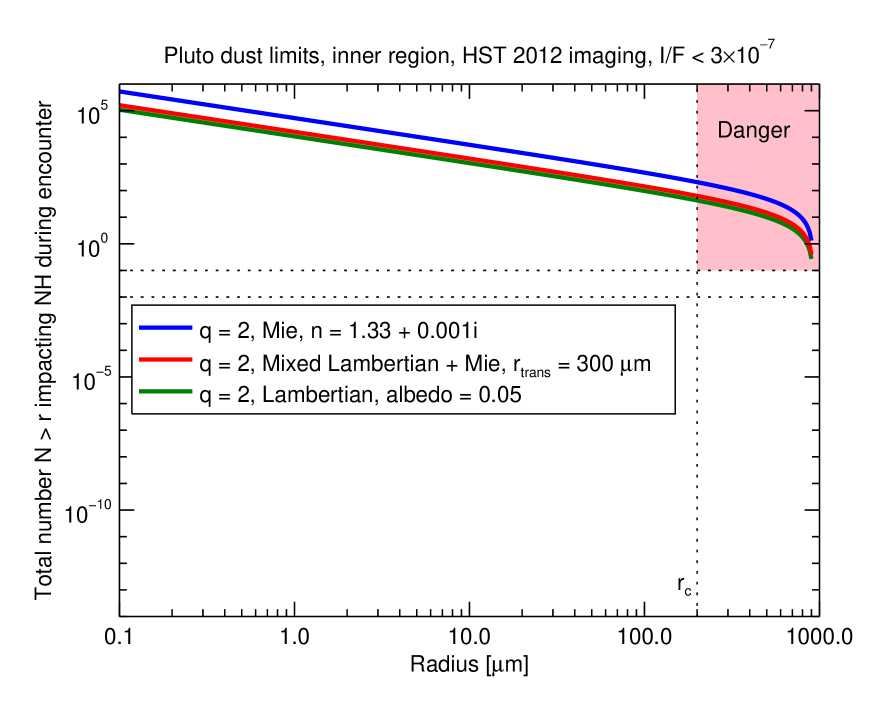
Because there is uncertainty in the true scattering law valid for ring particles (e.g. Throop and Esposito, 1998), I used two end-members cases, with the expectation that the actual scattering properties should be bounded by these two. The first, Mie scattering, is valid for small, fresh, and/or spherical grains; here I assumed the particle composition to be a silicate-ice mixture with index of refraction (that is, relatively absorbing forward-scatterers). In the second, I assumed Lambertian scattering with an albedo (that is, dark back-scatterers). Following the model of Throop and Esposito (1998), I have transitioned smoothly between these two scattering models at a size . More details on the scattering model are given in Appendix A.
Results are shown in Fig. 2. Each curve shows the number of hits received as a function of particle size . The range in values for each curve (that is, the vertical height spanned by each curve) is due to the two scattering models, with the Mie scattering model always being the higher of the two (that is, less reflective, and a higher number density). The plot shows that for steep size distributions where , NH is out of the ‘Danger’ zone, receiving dangerous hits. However, for , the mission’s safety cannot be assured. Values of in the range yield [Update: was in v1] dangerous hits through the encounter. Smaller values of result in larger , because these distributions are dominated by larger grains.
The actual value for at Pluto is of course unknown. However, typical collisional ejecta has a upon initial creation (Durda et al., 2007). Size-dependent processes in planetary rings almost always reduce : Poynting-Robertson drag and radiation pressure are both proportional to radius, reducing by 1. Recent simulations of dust processes at Pluto support (Doug Hamilton, this workshop), suggesting that would not be unexpected for dust at Pluto. Because the curves for are similar near near , the inferred value for turns out to be only weakly sensitive to changes to . These low values of are the most dangerous ones and the most likely, and thus the best observational limits cannot rule out a substantial impact hazard to the spacecraft during encounter.
In the Mie scattering case, I have assumed highly absorbing particles. This is consistent with the dark particles inferred for the Uranian ring, with (Cuzzi, 1985). Icy particles with a higher albedo are prevalent in the outer solar system; Pluto and Charon’s own albedos are in the range 0.3–0.5, suggesting the possibility of bright ring particles. However, lacking any direct constraints on ring albedos, I use the most conservative observed values. Brighter particles would decrease .
Future observations. 2007 HST observations of the Pluto system (Steffl and Stern, 2007) placed limits of at 10,000 km. The limit was unable to go lower because of incomplete removal of stray light from Pluto-Charon in the telescope optics. The recent 2011 HST observations improved the limit by some by rolling the spacecraft with Charon’s orbital motion to allow for improved stray light removal. 2012 HST observations pushed this limit closer inward in the Pluto-Charon system, but did not substantially change the numerical limit. Future HST observations (or other Earth-based observations) are unlikely to yield any significant improvement over the current limit. Imaging in the infrared or mm (Spitzer, ALMA, JWST, Herschel) is much less useful than the optical because most of the surface area is expected to be in small grains, where long wavelengths are less sensitive.
The limit from the occultation could be improved with additional observations using brighter stars and/or larger telescopes. For instance, observing an occultation of an 11th magnitude star from a 10-m telescope would yield a signal 250 brighter the dataset used here, and an SNR some better. However, such an increase in sensitivity would not be nearly sufficient to beat HST. Occultations will always be superior to HST for searching for small ring arcs and isolated 100 m objects, and in the closest region toward the planet. In particular, appulses (where the shadow path passes near the Earth but not over it) are more frequent than occultations, and would be quite valuable because they often occur with brighter stars.
7 Acknowledgments
Thanks to Leslie Young, Cathy Olkin, Mark Showalter, Hal Weaver, and Alan Stern for comments and suggestions. I also thank Mark Showalter and Andrew Steffl for providing their unpublished data. Discussions with Matt Hedman were helpful, and I am particularly grateful to him for noticing the error in how diffraction was handled in an earlier version of this paper and checking the calculations in the current version.
Appendix A Notes to version 2 – December 2012
In an earlier version of this paper, I assumed that to model the HST calculations, the scattering angle was close enough to zero that the single-scattering albedo could be written as
| (10) |
where the 0.5 is to account for the diffraction spike, which is formally part of the phase function but not seen in our particular observations.
While this is an OK approximation for some particle sizes, it is technically incorrect, as can be easily verified at, say, a value of , which computes a negative given the refractive index and wavelength used here. However, my code’s actual computations conveniently avoided this issue by neglecting to include the 0.5 at all. As a result, the plots in the paper over-estimated (that is, it erroneously computed that particles were bright, and easy to detect), and thus under-estimated the impact rate . Matt Hedman pointed out this issue to me, and I have revised the paper to address it.
This issue is very easy to fix. In this revised paper, I consider explicitly the value of the phase function for each particle, as shown in Eq. 2. There is no reason not to include ; it was just an erroneous simplification.
For small grains, the effect of including the phase function is minimal. For these, the phase function has little structure near 0∘ which causes the singularities in Eq. 10, and the particles are naturally quite reflective because no absorption happens due to their small size. As a result, the albedo approximation is accurate, and the number of impacts is unchanged for the curves in Fig. 2 dominated by small grains ().
For the large grains, resonances near backscatter causes structure in the phase function , and the Mie particles naturally reflect less because they absorb more. For these grains, nearly all the light comes out in the diffraction peak, with very little reflected. My original paper said in effect that these grains were easier to detect than they really are. Handling the phase function properly causes a substantial increase in for distributions dominated by large grains. In the case of , this caused to be under-estimated by a factor of .

I made a second change to this paper, which was to address the fact that Mie scatterers may be a poor model in the first place. While Mie is a commonly used scattering method for small grains, it becomes inaccurate for larger grains. Mie methodology assumes that grains are perfectly spherical, homogeneous, and smooth, and that they are free of any cracks, voids, inclusions, or surface roughness. Every single one of these terms will cause deviations from Mie, and they will in general all cause grains to be more reflective (back-scattering). One physical example is a hailstone. Mie scattering would calculate a large water ice sphere to be virtually invisible to any observers outside of the central diffraction peak. But in reality hailstones (and by extension, an icy body such as Pluto, albedo 0.5) are extremely reflective and easy to see. In these macroscopic bodies, scattering is due not to light waves traveling through the body (which Mie describes), but by reflections by cracks and surface roughness. The size at which this transition from Mie to macroscopic scattering occurs will vary based on the history and processing of the surface. Some experimental work has shown it to be in the 10-100 range (Schmitt et al., 1987), and a transition near this size was used to fit data from Saturn’s G ring (Throop and Esposito, 1998). In the current model, I chose a transition size of 300 , in order to be somewhat conservative, and hedge against the possibility that Pluto’s rings might be caused by Enceladus- or Triton-like plumes, which could produce a ring of fresh ice grains for which Mie scattering is a reasonable model. Figure 5 shows a comparison between the different scattering models.
For reference, the two versions of Fig. 2 are shown in Fig. 4. These two changes partially cancel each other out, but the overall effect is an increase in by a factor of .
A.1 Lambertian function
Note that because the ring particles are not spatially resolved, the Lambertian phase function must be the disk-integrated version, not the commonly used surface version. The disk-integrated phase function can be easily derived from the surface one, and is taken as (e.g. Porco et al., 2008, their Eq. 7)
| (11) |
At backscatter (), this is just . Note that Eq. 11 is normalized such that
| (12) |
However, Eq. 11 includes only a reflectance term, and not a diffraction term. The value of used in Eq. 1 should thus be half of this value, or .
References
- Boissel et al. (2008) Boissel, Y., B. Sicardy, F. Roques, T. Widemann, P. Gaulme, N. Ageorges, V. Ivanov, O. Marco, E. Mason, O. Mousis, P. Rousselot, M. Assafin, F. Braga-Ribas, J. Camargo, D. da Silva Neto, A. Andrei, R. Vieira Martins, L. Albert, C. Veillet, and R. Behrend, 2008, Search for small satellites and rings orbiting Pluto through stellar occultations. DPS 40, 483.
- Cuzzi (1985) Cuzzi, J. N., 1985, Rings of Uranus: Not so thick, not so black. Icarus 63, 312–316.
- Durda et al. (2007) Durda, D. D., G. J. Flynn, L. E. Sandel, and M. M. Strait, 2007, Size-frequency distributions of dust-size debris from the impact disruption of chondritic meteorites. In Dust in Planetary Systems Conference.
- Gruen et al. (1985) Gruen, E., H. A. Zook, H. Fechtig, and R. H. Giese, 1985, Collisional balance of the meteoritic complex. Icarus 62, 244–272.
- McKay (2008) McKay, A., 2008, Undergraduate thesis, Williams College. J. Pasachoff, advisor .
- Pasachoff et al. (2006) Pasachoff, J. M., B. A. Babcock, S. P. Souza, J. W. Gangestad, A. Jaskot, J. L. Elliot, A. A. Gulbis, M. J. Person, E. A. Kramer, E. R. Adams, C. A. Zuluaga, R. E. Pike, P. J. Francis, R. Lucas, A. S. Bosh, D. J. Ramm, J. G. Greenhill, A. B. Giles, and S. W. Dieters, 2006, A search for rings, moons, or debris in the Pluto system during the 2006 July 12 occultation. DPS 38, 2502.
- Porco et al. (2008) Porco, C. C., J. W. Weiss, D. C. Richardson, L. Dones, T. Quinn, and H. Throop, 2008, Simulations of the dynamical and light-scattering behavior of Saturn’s rings and the derivation of ring particle and disk properties. AJ 136, 2172–2200.
- Schmitt et al. (1987) Schmitt, B., J. Ocampo, and J. Klinger, 1987, Structure and evolution of different ice surfaces at low temperature adsorption studies. J. Phys. Suppl. 3 48, 519–525.
- Steffl and Stern (2007) Steffl, A. J. and S. A. Stern, 2007, First constraints on rings in the Pluto system. AJ 133, L1485–1489.
- Thiessenhusen et al. (2002) Thiessenhusen, K. U., A. V. Krivov, H. Krueger, and E. Gruen, 2002, A dust cloud around Pluto and Charon. PSS 50, 79–87.
- Throop and Esposito (1998) Throop, H. B. and L. W. Esposito, 1998, G ring particle sizes derived from ring plane crossing observations. Icarus 131, 152–166.
- Throop et al. (2011) Throop, H. B., R. G. French, K. Shoemaker, C. R. Ruhland, L. A. Young, and C. B. Olkin, 2011, Limits on Pluto’s ring system from the June 12 2006 stellar occultation. DPS 43, 1640.
- Young et al. (2008) Young, E. F., R. G. French, L. A. Young, C. R. Ruhland, M. W. Buie, C. B. Olkin, J. Regester, K. Shoemaker, G. Blow, J. Broughton, G. Christie, D. Gault, B. Lade, and T. Natusch, 2008, Vertical structure in Pluto’s atmosphere from the 2006 June 12 stellar occultation. AJ 136, 1757–1769.