A Highly-Sensitive Cryogenic Phased Array Feed for the Green Bank Telescope
Abstract
In this paper, we describe the development of a new L-band (1.4 GHz) Cryogenic Phased Array Feed (PAF) system, referred to as the GBT2 array. Results from initial measurements made with the GBT2 array are also presented. The PAF was developed for the Green Bank Telescope (GBT) as part of the Focal L-band Array for the GBT (FLAG) project. During the first stage of the development work (Phase I), a prototype cryogenic 19 element dual-polarized array with “Kite” dipole elements was developed and tested on the GBT. The measured system temperature over efficiency () ratio for the bore sight beam of the Kite array was 45.5 K at 1.55 GHz. The off-boresight shows an increase by 13 K at an offset equal to the half power beam width (7.2 at 1.7 GHz). Our measurements indicate that the off-boresight degradation and field-of-view (FoV) limitation of the Kite array is simply due to the fixed array size. To increase the FoV, a new 19-element GBT2 array with larger array spacing was developed during FLAG Phase II. The frequency response of the array was optimized from 1.2 to 1.6 GHz. A system with larger cryostat, new low noise amplifiers (LNAs), down-conversion and digitization close to the front end, unformatted digital transmission over fiber, ROACH II based polyphase filter banks (PFBs) with bandwidth 150 MHz and a data acquisition system that records voltage samples from one of the PFB channels were all developed. The data presented here is processed off-line. The receiver temperature measured (off the telescope, on cold sky/hot load, with no beamforming) with the new system is 17 K at 1.4 GHz, an improvement 8 K over the previous Kite array. Measurements with the GBT2 array on the telescope are in progress. A real time 150 MHz beamformer is also being developed as part of an NSF-funded collaboration between NRAO/GBO/BYU & West Virginia University (Beamformer Project) to support science observations.
1 Introduction
For the advancement of Radio Astronomy, a large class of observations requires extended and large scale surveys. However, large reflector antennas used by radio astronomers have small field of view (FoV) limiting the survey speed. Multiple optimized feeds conventionally used to increase the FoV, however, do not produce overlapping beams and the off-axis feeds suffer efficiency degradation, both resulting in reduced mapping efficiency. The Phased array feed is another technology that can be used to increase the FoV[1]. PAFs consist of densely packed, electrically small feed arrays, each of which over illuminates the reflector. Signals from the array elements are combined to form multiple, overlapping beams with low spillover noise. A low-noise, multi-beam PAF system increases the survey speed of the telescope, enabling radio astronomers to make sensitive, large scale surveys.
Developing a low-noise PAF is difficult due to mutual coupling between array elements. Despite this difficulty several groups across the world have undertaken development of low-noise PAFs (see [2]). The development work is being done for both single radio telescopes and interferometers. The APERture Tile In Focus (APERTIF)[3] and Chequerboard PAFs are un-cooled, broadband ( 800 MHz) PAFs near 1.4 GHz installed respectively at the Westerbork Synthesis Radio Telescope (WSRT) and Australian Square Kilometer Prototype (ASKAP)[4]. The Dominion Radio Astrophysical Observatory (DRAO) used Vivaldi elements similar to APERTIF for a PHased Array feed Demonstrator (PHAD)[5]. PAFs that are being developed for single dish telescopes are cooled arrays. They include AO40 being developed for the Arecibo telescope by Cornell University[6] and a PAF for the Five hundred meter Aperture Spherical Telescope (FAST)[7], both operating near 1.4 GHz. A higher frequency (70 – 95 GHz) PAF is being developed by the University of Massachusetts for the GBT[8].
The Focal L-band Array for the GBT (FLAG) is a collaborative project between NRAO, GBO & BYU. This collaboration has developed a detailed model for the PAF system and the associated beamforming algorithms[9, 10]. The PAF modeling efforts of BYU led to a design procedure that will iteratively reshape the dipole structure in order to optimize the sensitivity of the array feed on a reflector telescope[11]. A prototype array, referred to as the Kite array, was constructed and tested on the GBT, which forms Phase I of the FLAG project. Section 2 summarizes the Phase I developments and results. During this phase NRAO also developed an independent PAF model, which is described in Section 3. The collaboration then developed the GBT2 dipole array, which forms FLAG Phase II. The dipole spacing in GBT2 array is optimized to obtain 7 beams on the GBT spaced at the half power beam width over its operating frequency. The full system has been redesigned as part of Phase II work. Section 4 gives a description of the system and the initial measurement results.
2 FLAG Phase I: Development, Measurement and Results
 |
 |
 |
 |
 |
 |
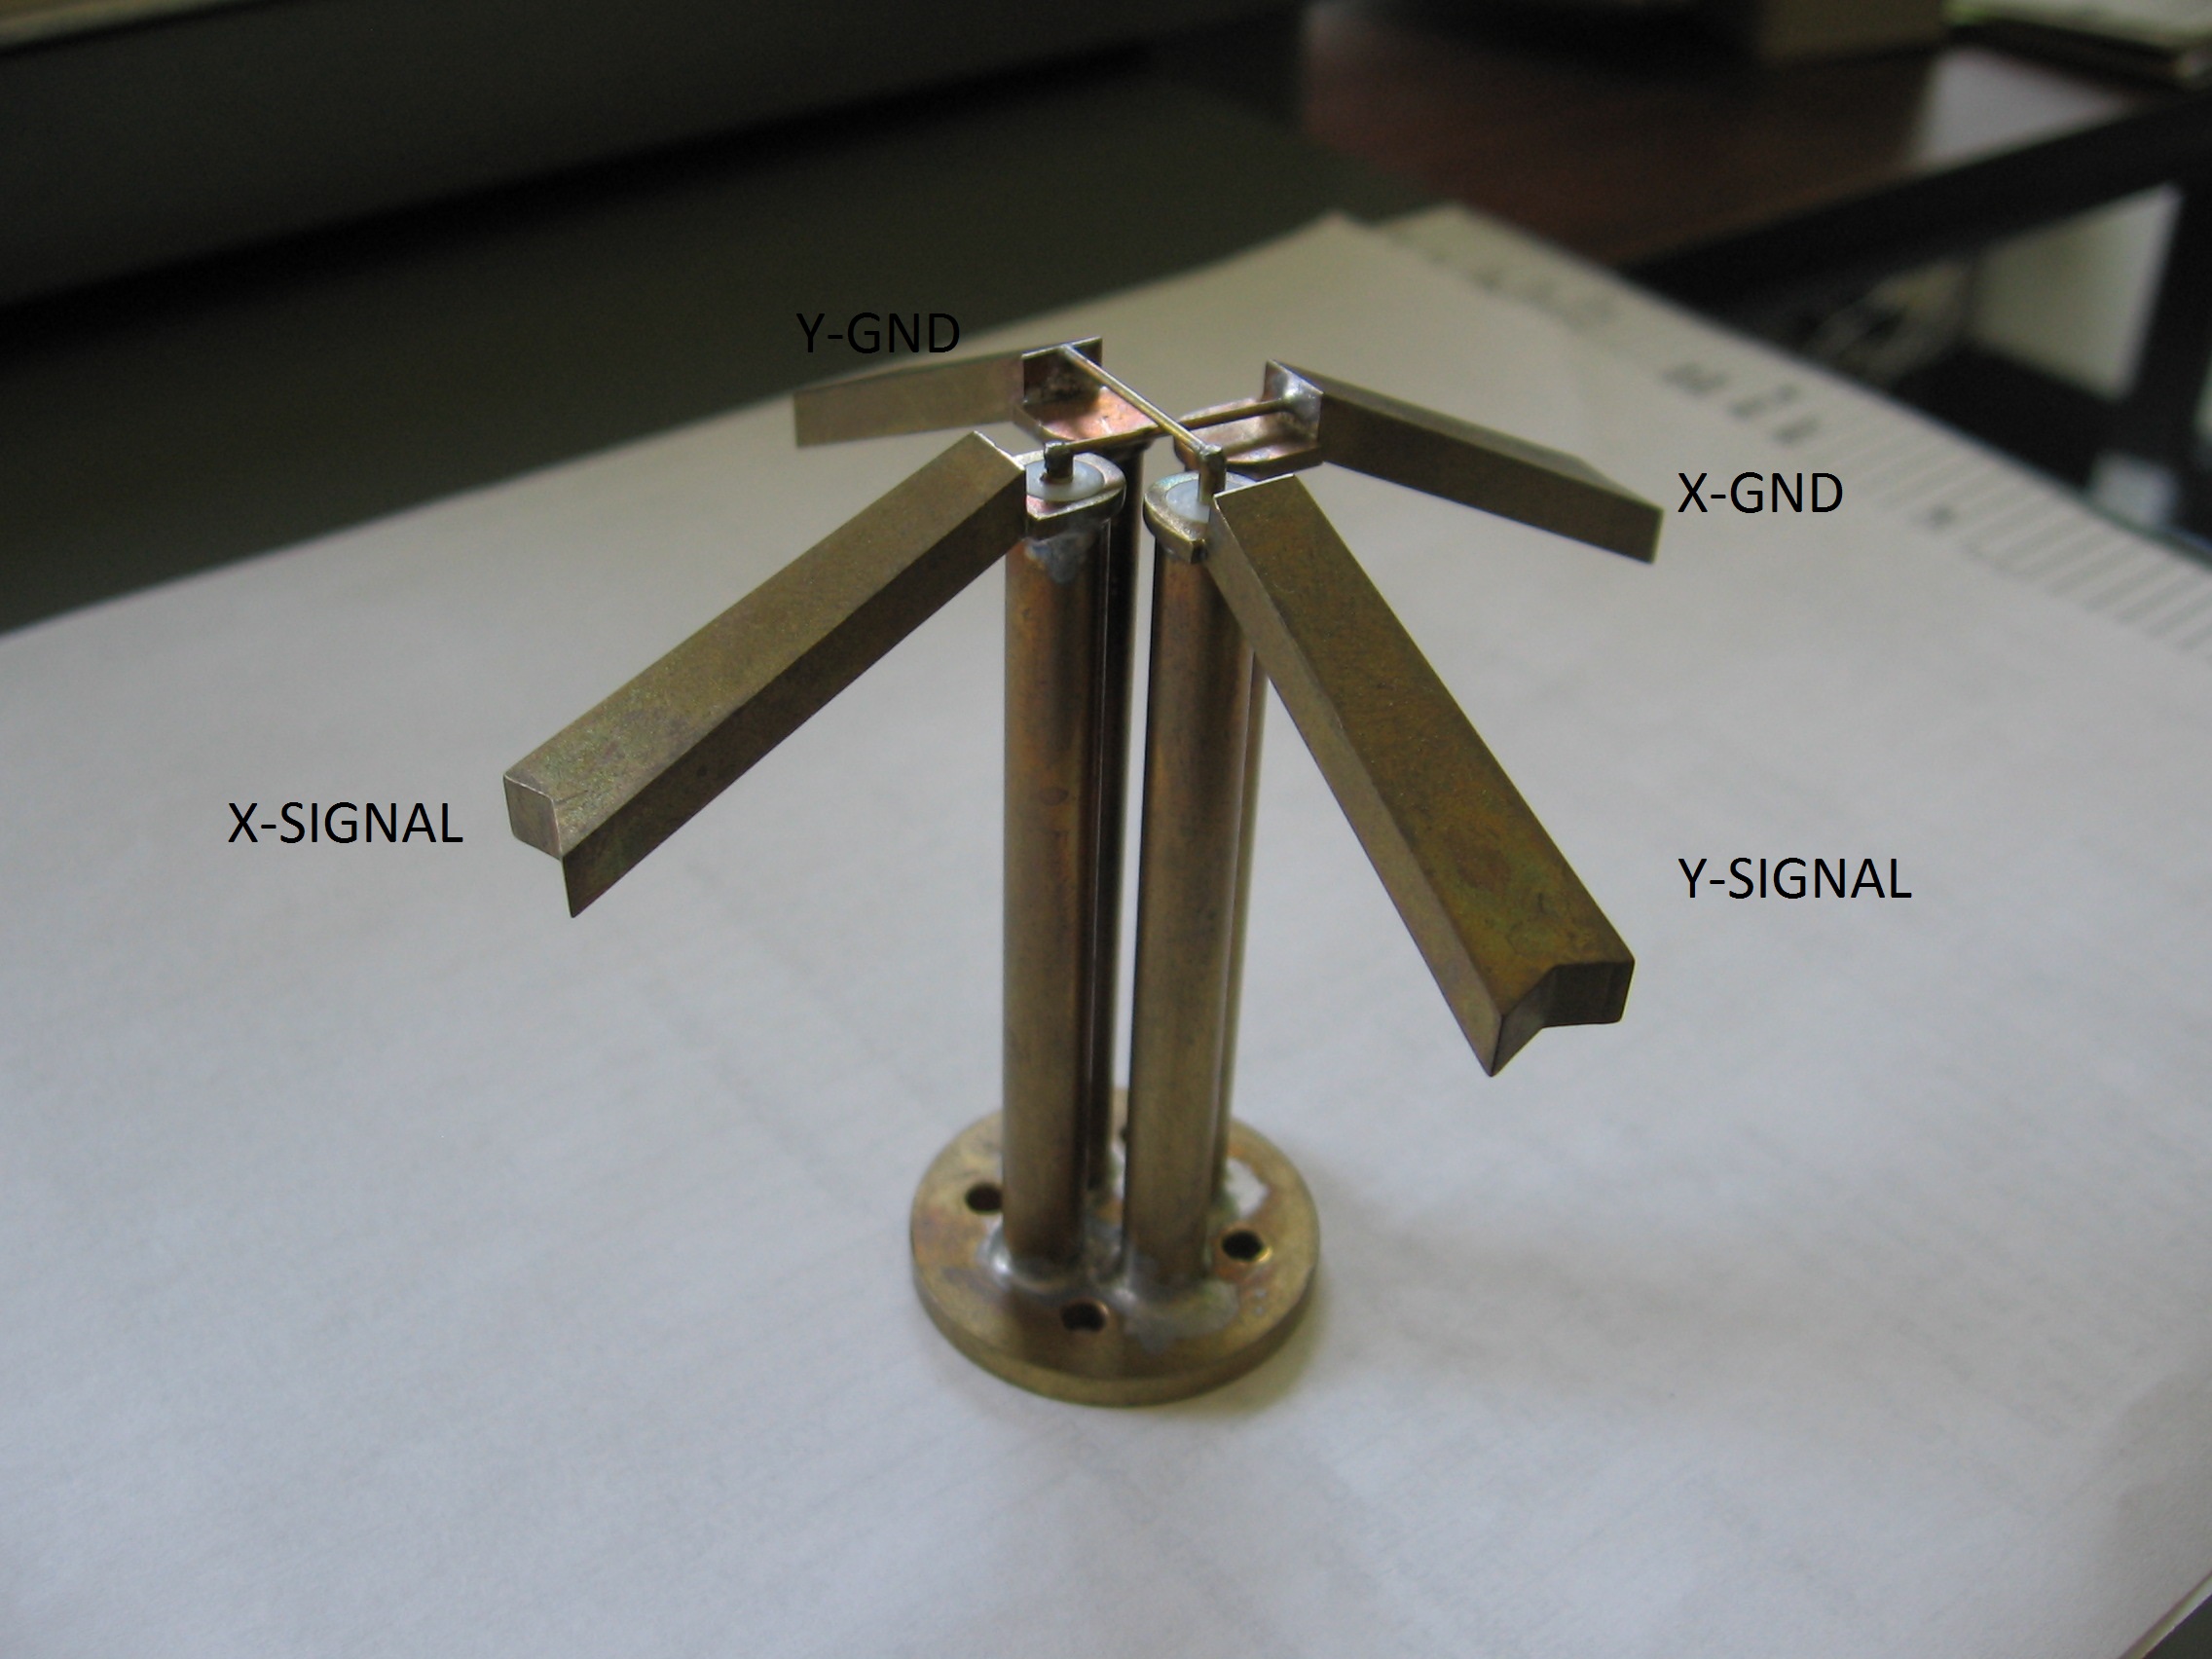
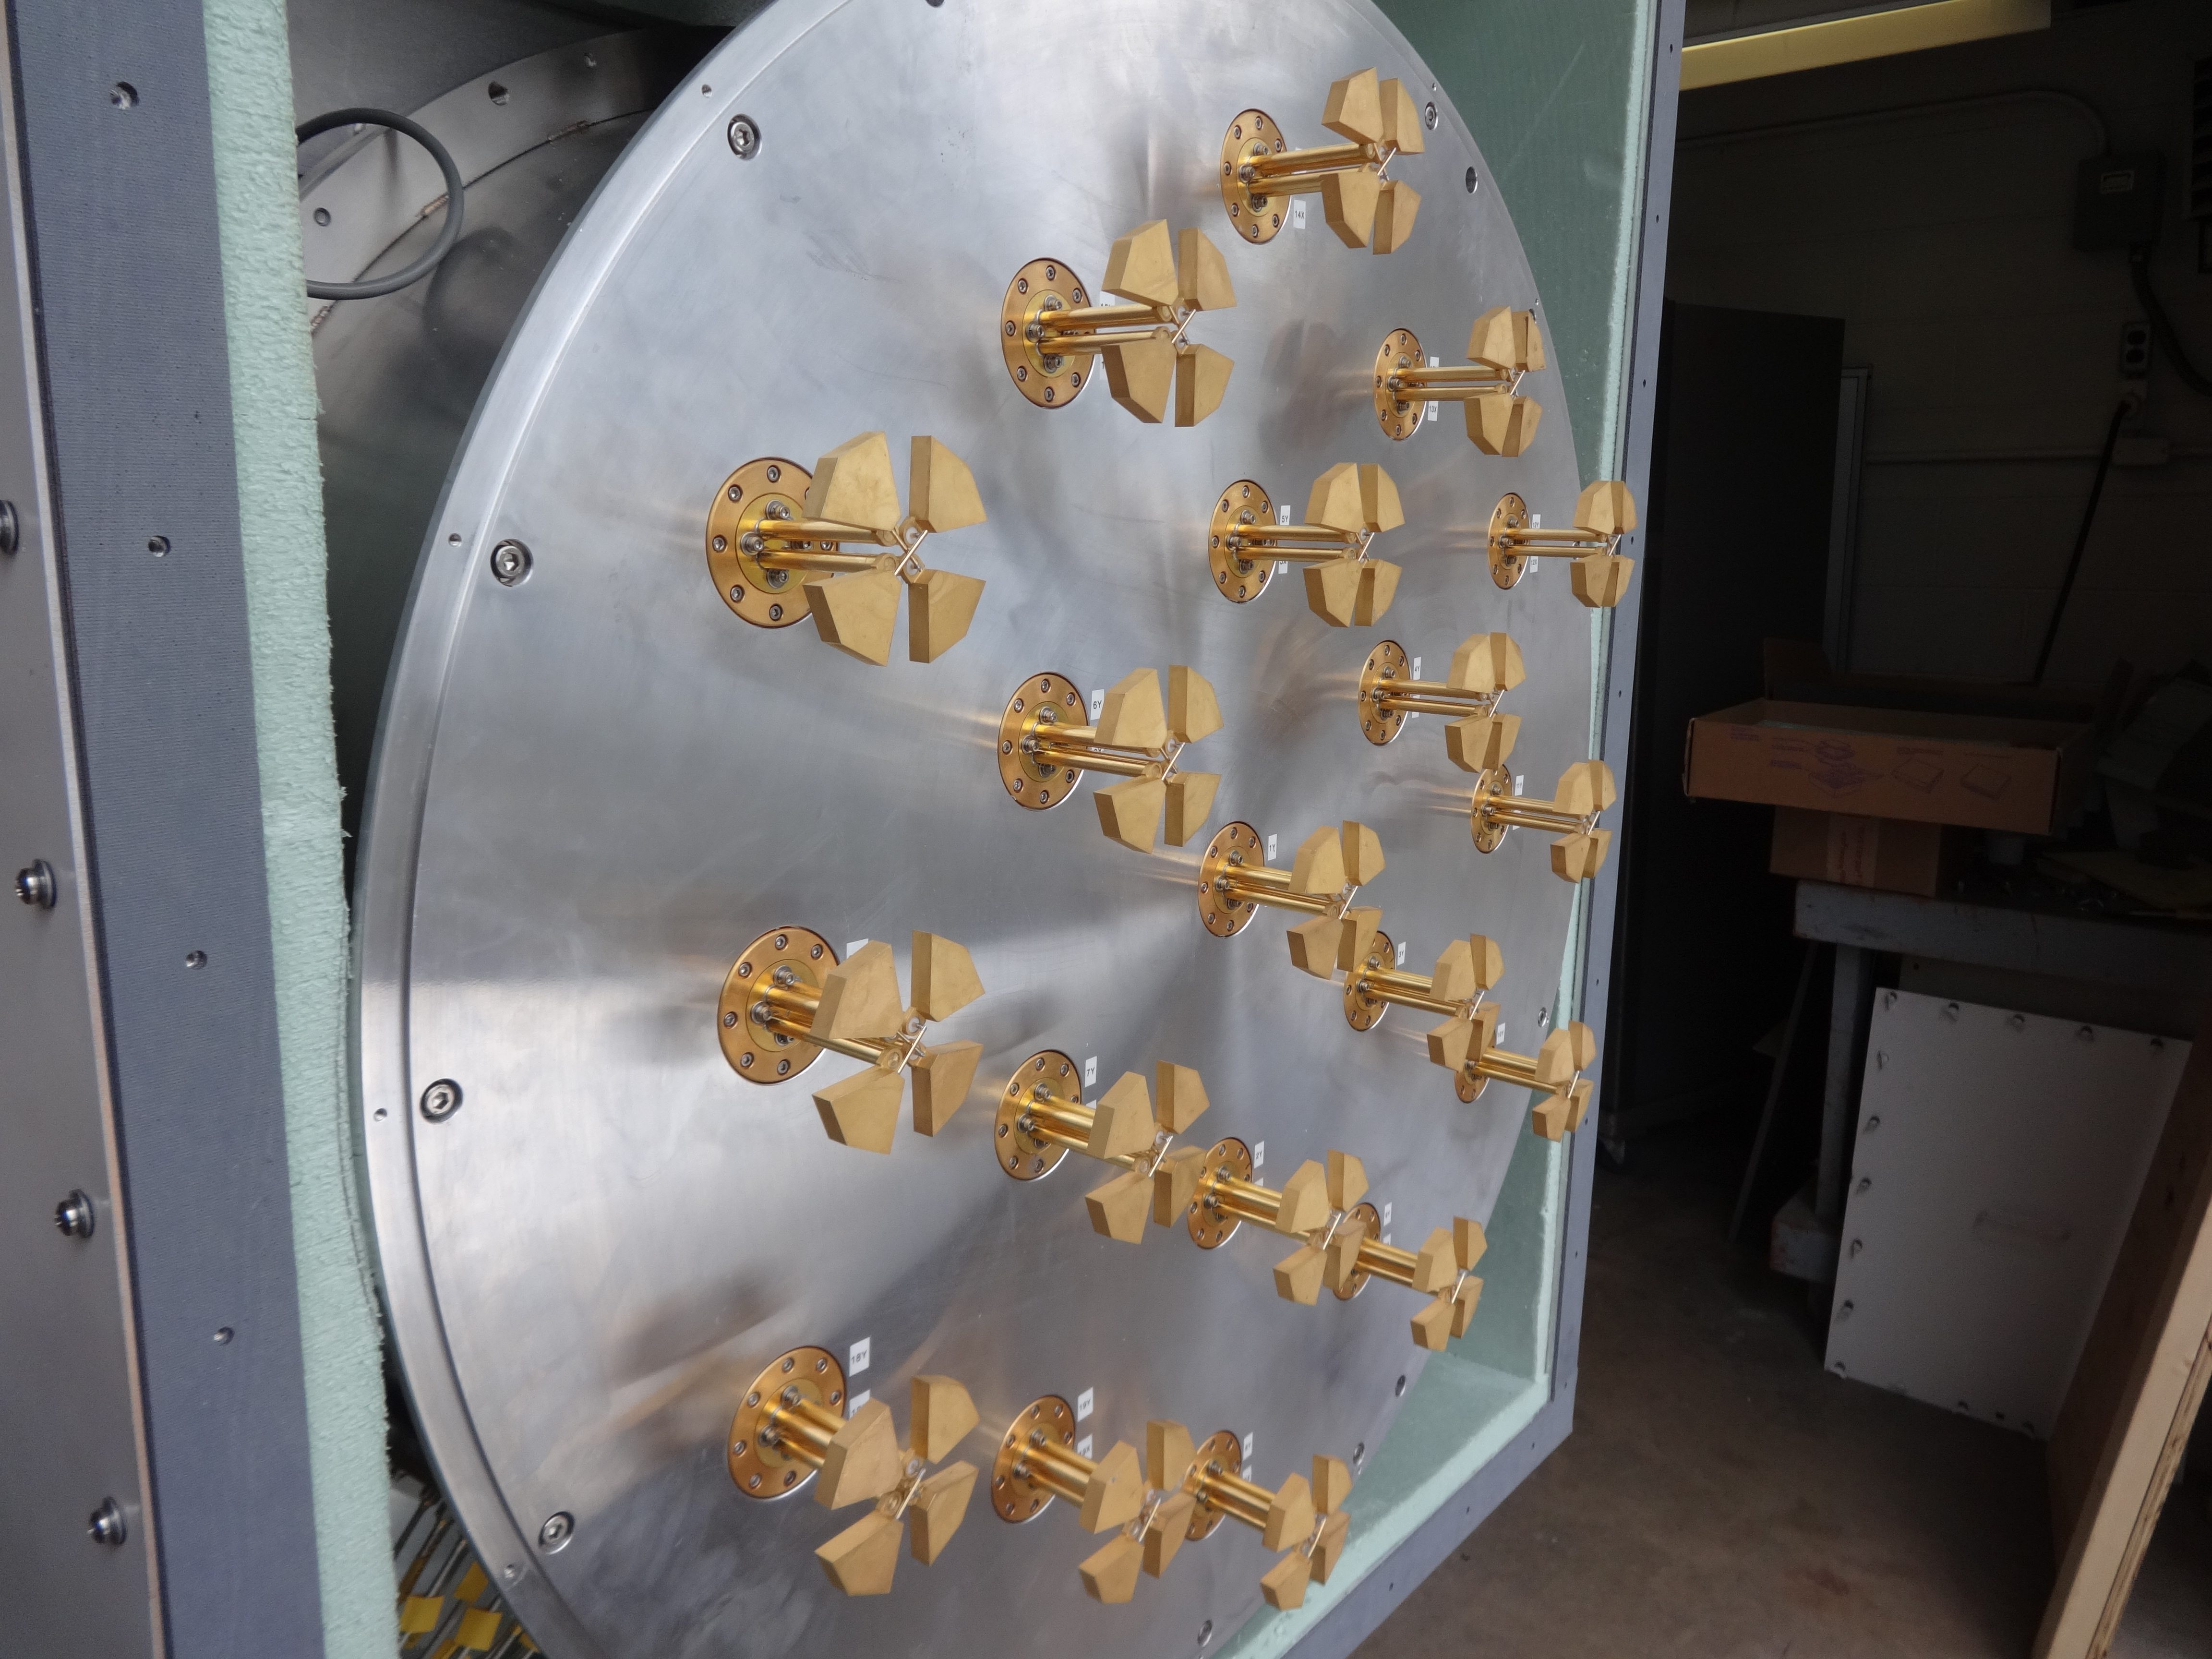
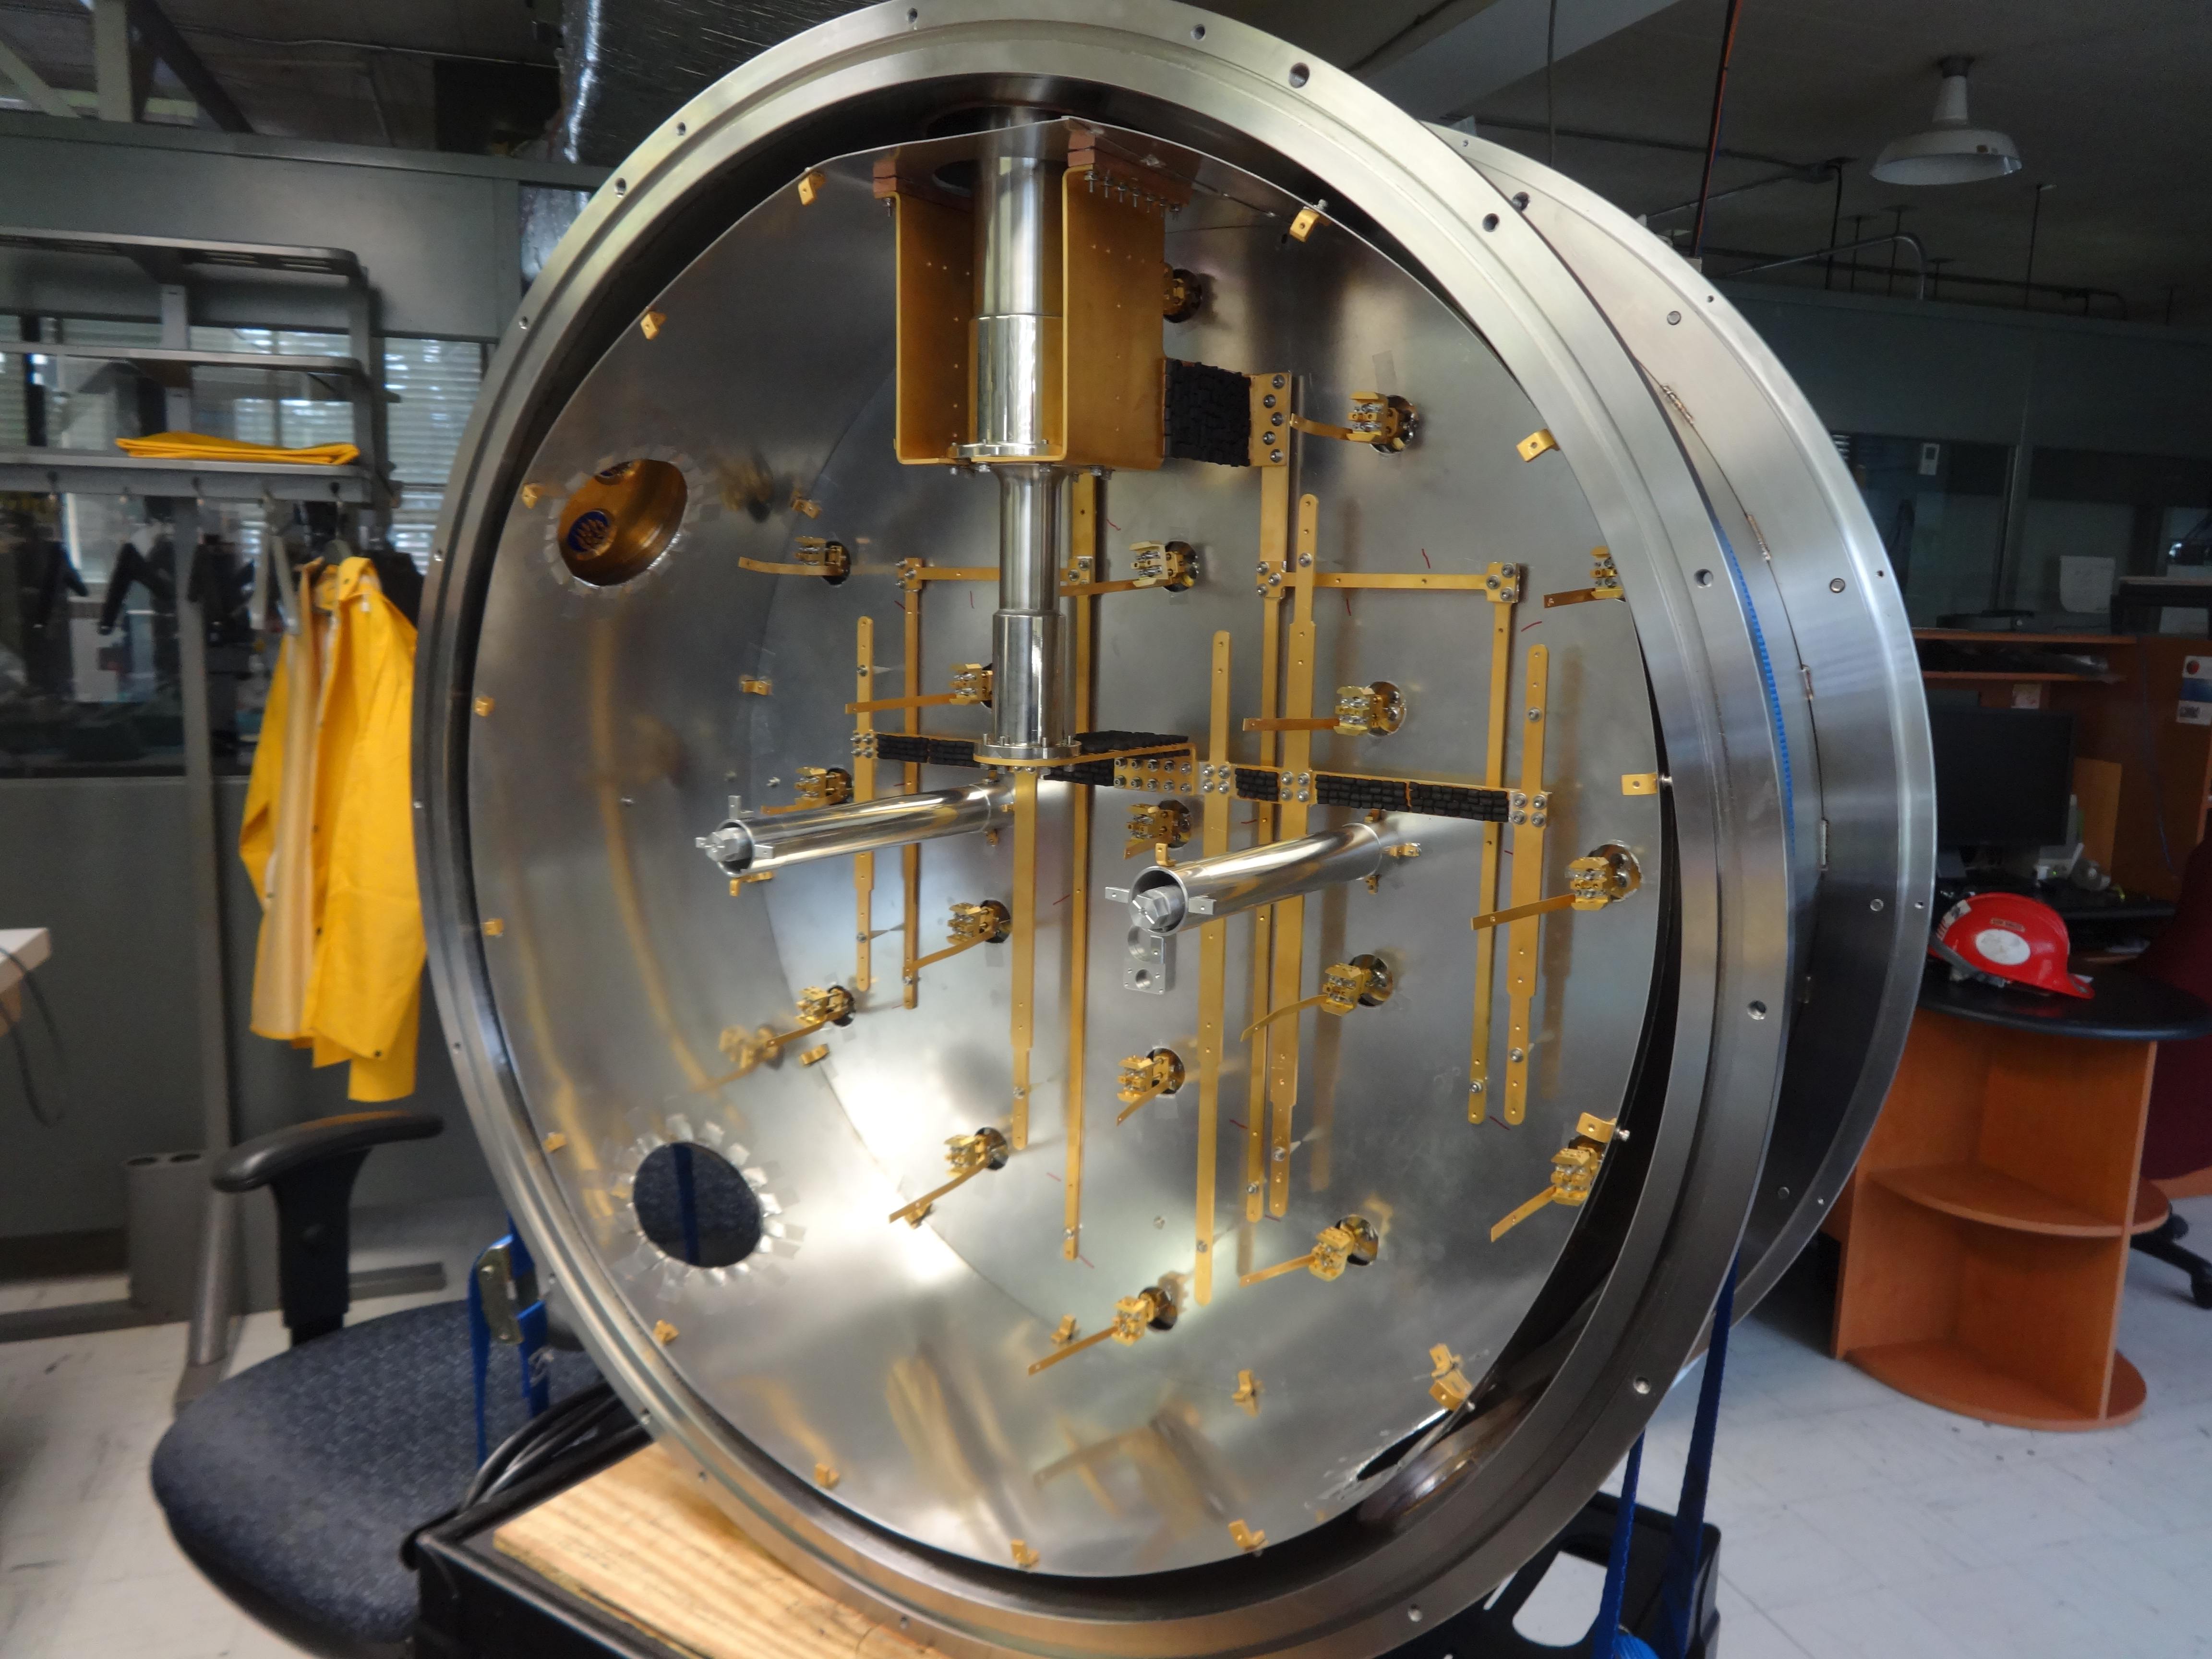
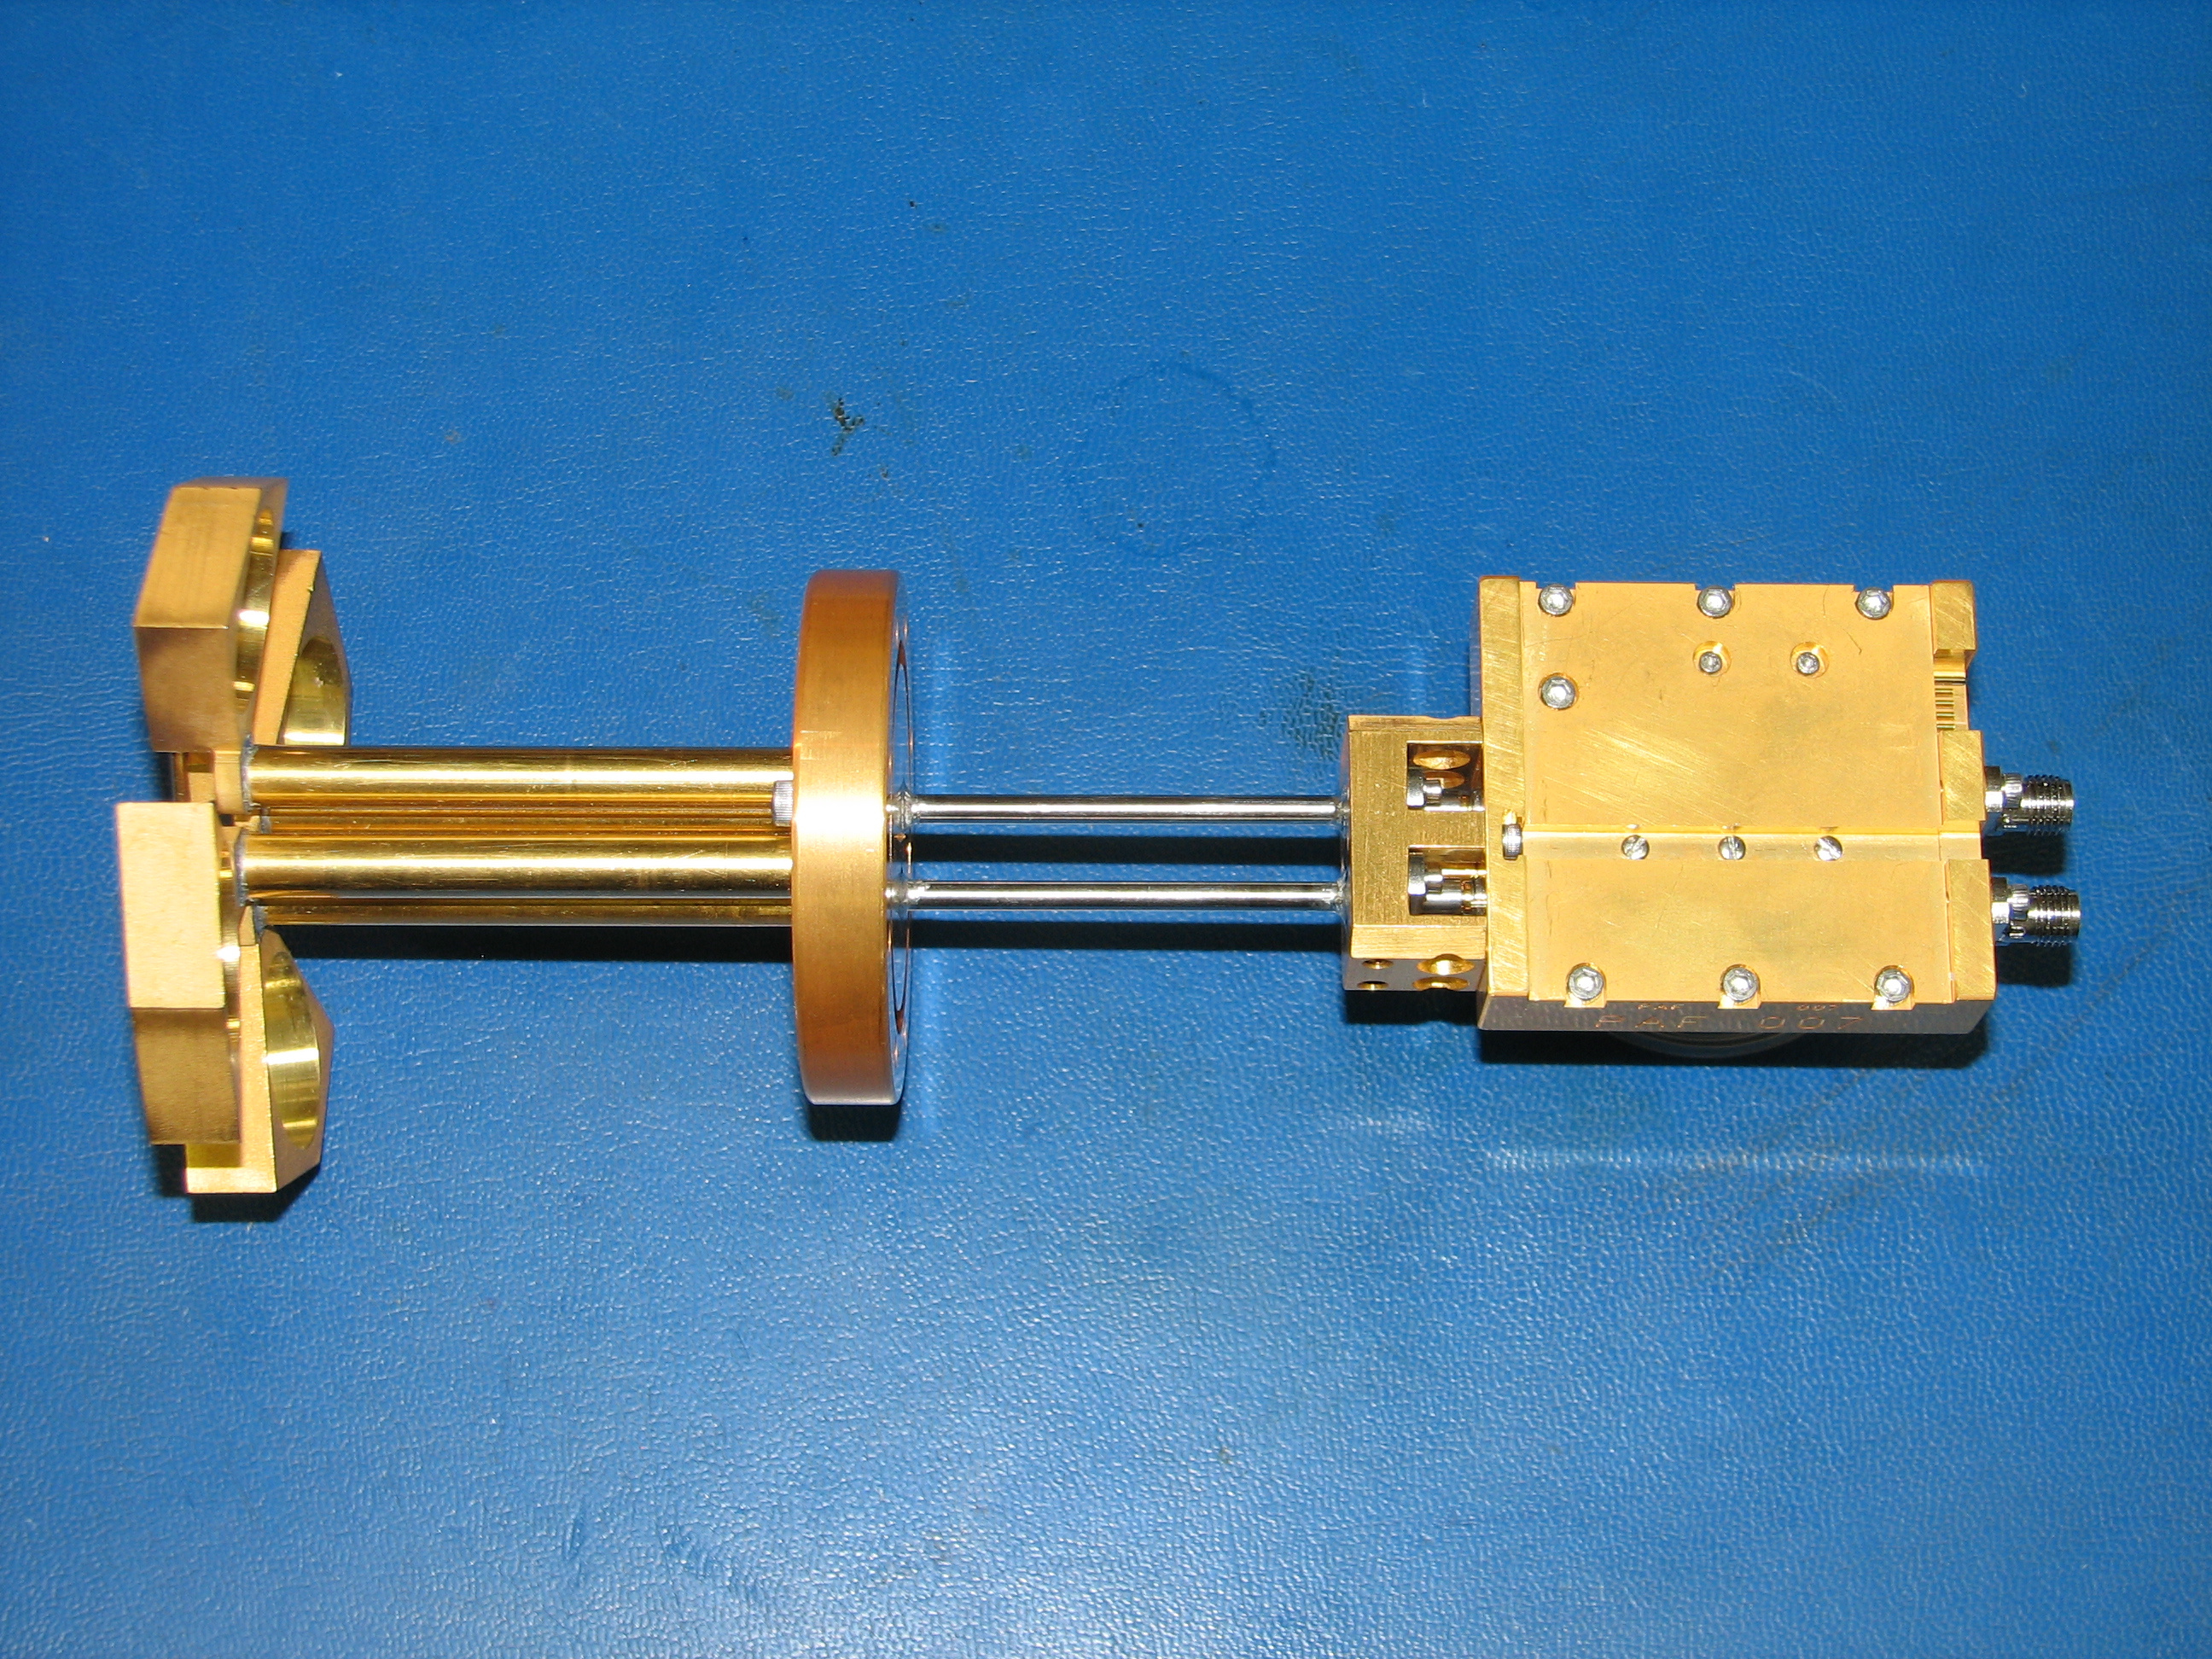
The Kite array developed during FLAG Phase I is shown in Fig. 1. The dipoles were optimized for active impedance match to the LNA and for maximum sensitivity on a reflector antenna over a specified FoV. The optimization was done over the frequency range 1.3 to 1.7 GHz. The design and fabrication of the dipoles were done by Karl Warnick and a team of students at BYU. The dipoles and balun, which were maintained at ambient temperature, were connected to the LNA through a low-loss but high thermal impedance coaxial cable. The LNAs were located inside the cryostat and cooled to 15K. The cryostat was developed by Roger Norrod at NRAO[12]. Signal received by each dipole was amplified and transmitted through analog fiber optic links to an analog down-converter. The bandwidth at the output of the down-converter was reduced to about 400 KHz. The signals were then digitized using 12-bit ADCs and the voltage samples were recorded to disk. All processing was done offline on the recorded data, where we formed beams by maximizing the signal-to-noise ratio (SNR)[13].
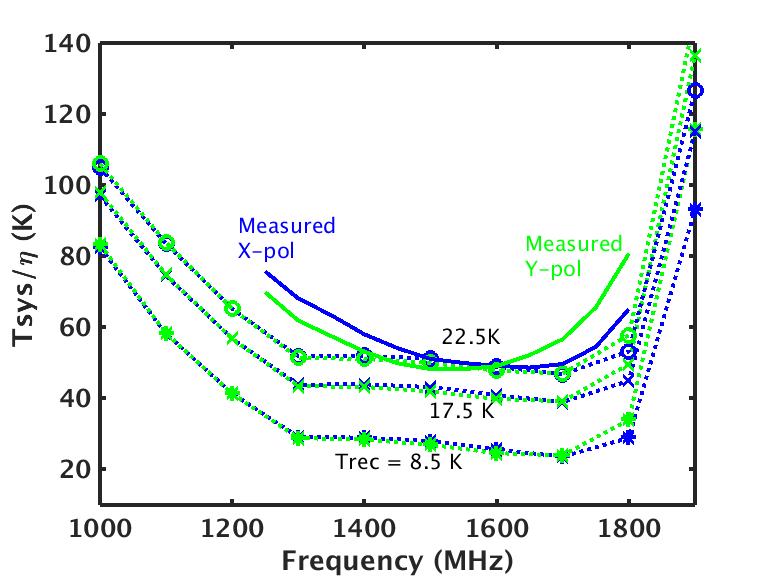
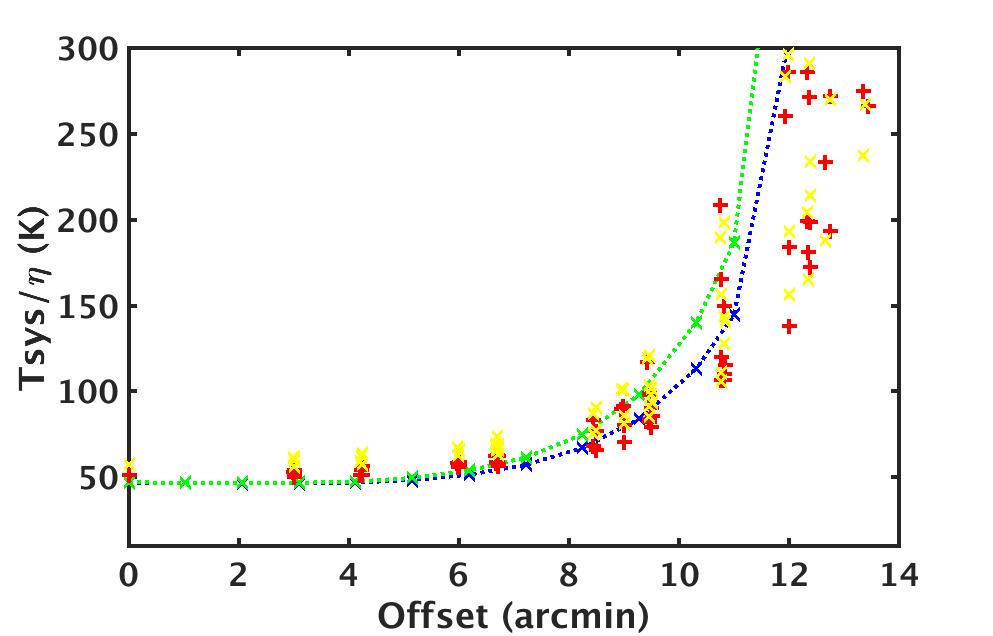
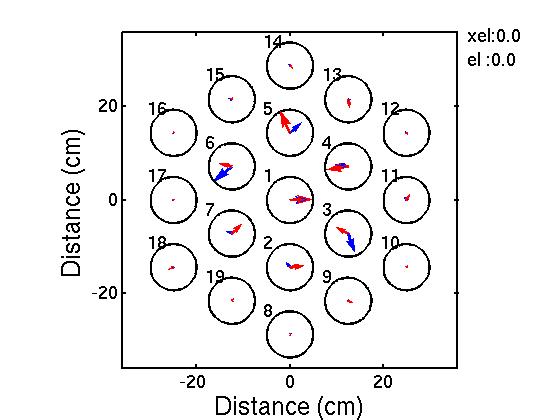
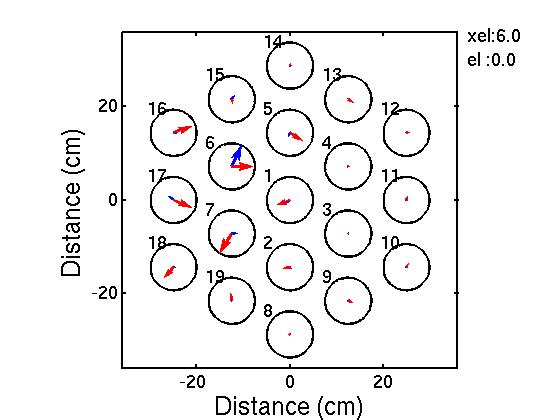
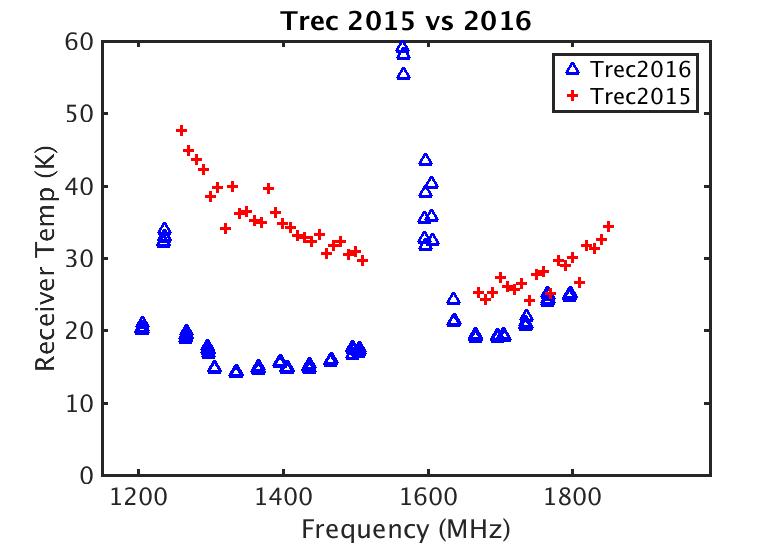
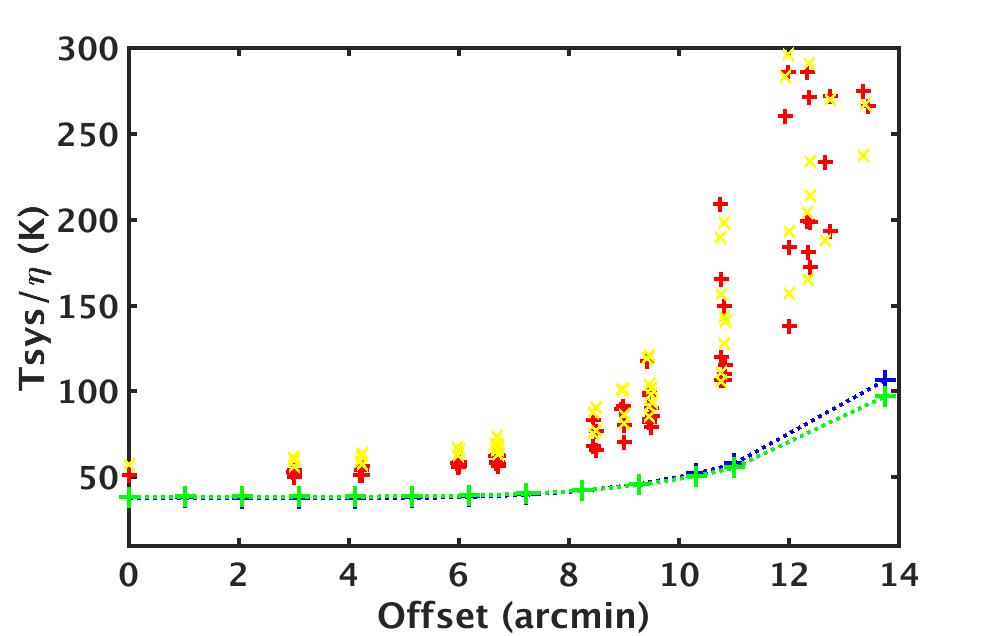
In early 2015, the receiver temperature of the Kite array was measured at the outdoor facility at GBO. The receiver temperature (median value of the temperatures of the 38 dipoles) as a function of frequency is shown in Fig. 6. The best value obtained was 25 K at 1.7 GHz. The array was then installed on the GBT and an extensive set of measurements were made[13]. We express the performance of the PAF in terms of the ratio , where is the system temperature and is approximately the aperture efficiency if the radiation efficiency is close to unity. Fig. 2 shows an example measurement result made using the source Virgo A. The best value obtained for the boresight beam is 45.5 K near 1.55 GHz. The FoV of the array is measured at 1.7 GHz by observing Virgo A at different offsets from the boresight. As seen in Fig. 2, the increases by about 13 K at an offset equal to the half power beam width (7.2 at 1.7 GHz). Our measurements show that the FoV is limited by the finite size of the array. This is illustrated in Fig. 3, where we plot the maximum SNR weights for boresight and those for an offset of 6. The 7 elements which have significant values for the weights are located at the edge of the array for 6 offset. Thus, for this array, an additional ring of elements would be needed for offsets larger than 6 in order to form a high sensitivity beam and therefore the FoV is limited by the array size.
3 The NRAO PAF model
A PAF model was independently developed at NRAO. Our modeling starts with the electromagnetic simulation of the full array in the Computer Simulation Technology (CST) software package. This simulation provides the S-parameters and field patterns of each dipole when embedded in the array. The outputs of the CST are then used to compute the embedded beam patterns, which are defined as the field pattern when a dipole in the array is excited and all other dipole inputs are short circuited. The embedded beam patterns and the S-parameters along with the LNA noise model are used to predict when the PAF is place on the GBT. Any additional noise contribution (like losses in the system) is accounted in the model by adding a noise temperature to the receiver temperature due to LNA alone. A complete description of the model starting from the first principles is available as an NRAO internal report[14]. In Fig. 2, we compare the model predictions with measurements made on the GBT. As seen in Fig. 2, the model well predicts the off-boresight measurements and to a lesser extent the frequency dependence of the boresight measurements. An excess noise temperature of 14 K at 1.5 GHz over the LNA noise contribution (noise temperature due to LNA is 8.5 K) is required for the model to match with the measurements. Out of this excess, the total contribution from losses in the system and the expected additional noise in the LNA is approximately 9 K. The origin of the unaccountable 5 K noise contribution needs further investigation.
4 FLAG Phase II: Development, Measurement and Results
 |
 |
 |
 |
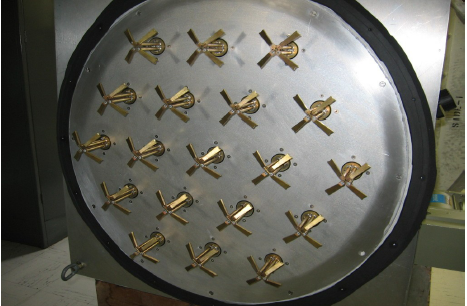
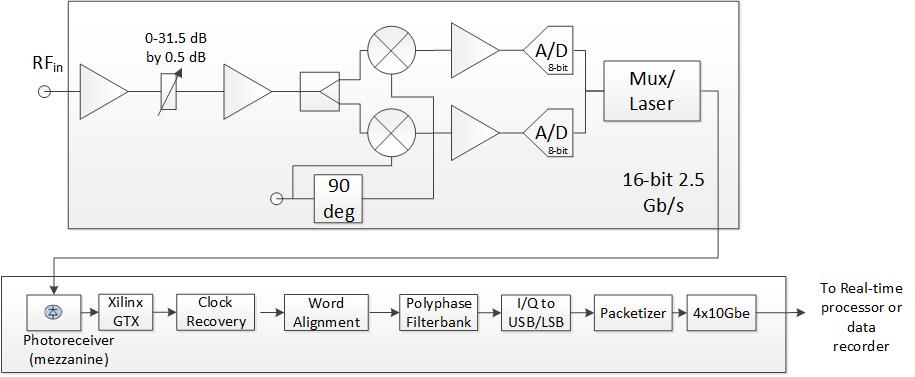
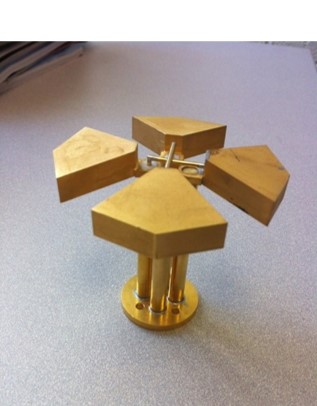
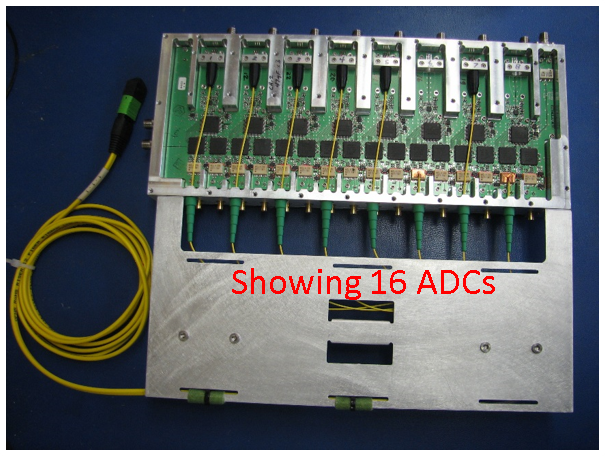
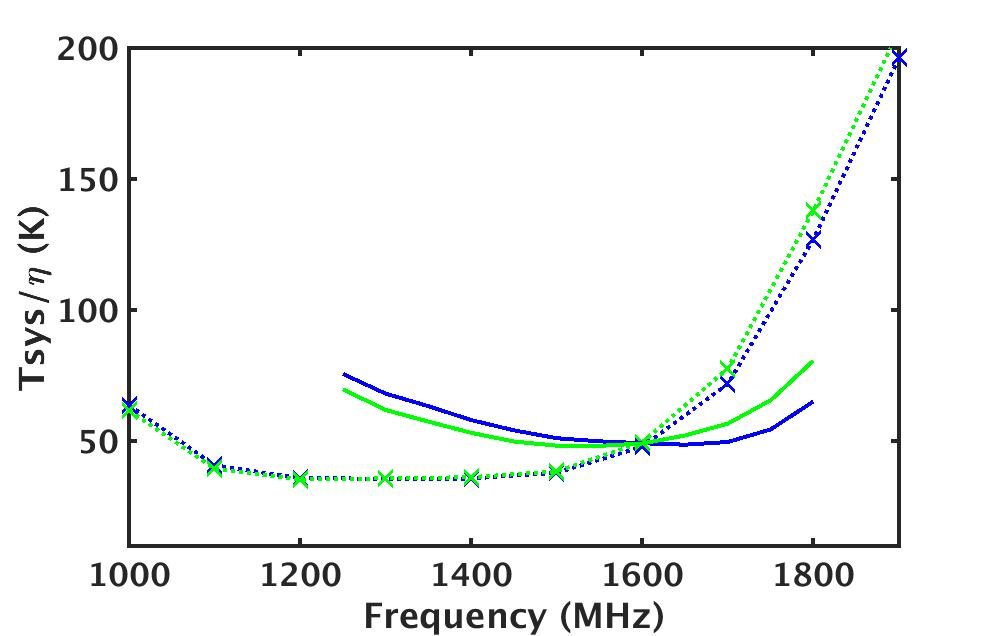
Based on the success of the Phase I effort, the complete system was redesigned. The block diagram of the new system is shown in Fig. 4. To increase the FoV of the PAF for the GBT, the GBT2 array (see Fig. 5) was developed with an element spacing of 15.6 cm (0.73 at 1.4 GHz). The dipoles were redesigned by Karl Warnick for this element spacing and the frequency range was optimized to 1.2 to 1.6 GHz (see Fig. 7). A larger cryostat was developed for the GBT2 array (see Fig. 5) and the LNAs were redesigned for improved noise temperature[15]. The signals are down converted and digitized with 8 bit ADCs close to the front-end. The bandwidth at this stage is limited to 150 MHz. An unformatted digital link over optical fiber transports the samples to the FPGA in ROACH II boards. Fig. 6 shows the digital down-converter and the link[16]. A polyphase filter bank (PFB) implemented in the FPGA breaks down the 150 MHz bandwidth into 512 channels. The data acquisition system developed for system testing and commissioning of the front-end records voltage samples from one channel of the PFB to disk. The recorded data is processed offline to form maximum SNR beams.
 |
 |
 |
 |
We have measured the receiver temperature of the system at the outdoor test facility at GBO, which is shown in Fig. 6. The receiver temperature of GBT2 array shows improvement by more than 8 K compared to that of the Kite array (see Fig. 6). The expected bore sight and off-bore sight performances of GBT2 array on the GBT obtained using the NRAO PAF model are shown in Fig. 7. Measurements with the GBT2 array on the telescope is underway. The Beamformer project will also be commissioning the real time system later this year, which then will be used for regular science observations with the GBT.
5 Acknowledgments
We acknowledge the help and support of L. Jensen, R. Dickman, S. Pan, W. Randolph, and K. O’Neil during the FLAG development work, testing and observations on the GBT. The NRAO is a facility of the National Science Foundation (NSF) operated under cooperative agreement by Associated Universities, Inc. We acknowledge the support of the NSF/ATI program through the awards 1309832 and 1309815, 2013.
References
- [1] J. R. Fisher, “Phased array feed for low noise reflector antenna,” NRAO Electronic Division Internal Report 307, September 1996.
- [2] K. F. Warnick, R. Maaskant, M. V. Ivashina, D. B. Davidson, and B. D. Jeffs, “High-Sensitivity Phased Array Receivers for Radio Astronomy,” Proceedings of the IEEE, 104, 3, March 2016, pp. 607–622, doi:10.1109/JPROC.2015.2491886.
- [3] M. V. T. Oosterloo and W. R. K. van Cappellen, “The latest on apertif,” in Proceedings of the ISKAF2010 Science Meeting, Assen, the Netherlands, Jun. 2010, pp. 43–54.
- [4] A. P. Chippendale, et al., “Measured Sensitivity of the First Mark II Phased Array Feed on an ASKAP Antenna”, ICEAA, September 2015, pp 541–544, DOI: 10.1109/ICEAA.2015.7297174
- [5] A. D. Gray, et al., “Activities of the dominion radio astrophysical observatory,” in General Assembly and Scientific Symposium, 2011 XXXth URSI XXXth, Istanbul, Turkey, Aug. 2011, pp. 1–4, DOI: 10.1109/URSIGASS.2011.6123728
- [6] G. Cortes-Medellin, et al., “A fully cryogenic phased array camera for radio astronomy,” IEEE Trans. Antennas and Propagation, 63, 6, June 2015, pp. 2471–2481, DOI: 10.1109/TAP.2015.2415527
- [7] Y. Wu, C. Jin, J. Fan, X. Zhao, L. Yu, B. Du, “Development of the L-band phased array feed for the Five-hundred-meter Aperture Spherical radio Telescope,” Progress in Electromagnetic Research Symposium (PIERS), August 2016, pp. 1667 – 1667, DOI: 10.1109/PIERS.2016.7734752
- [8] N. R. Erickson, et al., “A 64 Element, 70–95 GHz Focal Plane Phased Array,” IEEE International Symposium on Antennas and Propagation & USNC/URSI National Radio Science Meeting, July 2015, pp. 1514 – 1515, DOI: 10.1109/APS.2015.7305146
- [9] K. F. Warnick, B. Woestenburg and P. Russer, “Minimizing the noise penalty due to mutual coupling for a receiving array,” IEEE Trans. Antennas Propag., 57, pp. 1634–1644, Jun. 2009, DOI: 10.1109/TAP.2009.2019898.
- [10] B. D. Jeffs, et al., “Signal Processing for Phased Array Feeds in Radio Astronomical Telescopes”, IEEE Journal of Selected Topics in Signal Processing, 2, 5, 2008, pp. 635 – 646, DOI: 10.1109/JSTSP.2008.2005023
- [11] K. F. Warnick et al., “Design and characterization of an active impedance matched low-noise phased array feed,” IEEE Trans. Antennas Propag., 59, 6, Jun. 2011, pp. 1876–1885, DOI: 10.1109/TAP.2011.2122223.
- [12] R. Norrod, J. R. Fisher, B. D. Jeffs, and K. F. Warnick, “Cryogenic Phased Array Feed Development,” IEEE International Symposium on Phased Array Systems and Technology, Oct. 2010, pp. 629 – 631, DOI: 10.1109/ARRAY.2010.5613299
- [13] D. A. Roshi et al., “Summary of January 2015 PAF observations with the GBT, Results and Comparison with PAF model,” NRAO Electronic Division Internal Report, 326, March 2015, pp. 1–26, http://library.nrao.edu/public/memos/edir/EDIR_326.pdf.
- [14] D. A. Roshi, and J. R. Fisher, “A Model for Phased Array Feed, ” NRAO Electronic Division Internal Report, 330, January 2016, pp. 1–44, http://library.nrao.edu/public/memos/edir/EDIR_330.pdf.
- [15] W. M. Groves III and M. A. Morgan, “A Cryogenic Low Noise Amplifier Optimized for Phased Array Feeds, ” December 2016, eprint arXiv:1612.04313.
- [16] M. Morgan, J. Fisher, and J. Castro, “Unformatted Digital Fiber-Optic Data Transmission for Radio Astronomy Front Ends,” PASP, 125, 928, pp. 695–704, June 2013, DOI: 10.1086/671349